


Características


¿Tienes alguna pregunta?
Recomendar


8 diapositivas
Geographic Data for Europe Slide Presentation
Visualize key regional data clearly with the Geographic Data for Europe Slide Presentation. This editable map layout highlights specific European countries alongside icon-based text boxes, perfect for presenting statistics, demographics, or business metrics. Use color-coded markers to tell a geographic story with visual clarity. Compatible with PowerPoint, Keynote, Google Slides, and Canva.


8 diapositivas
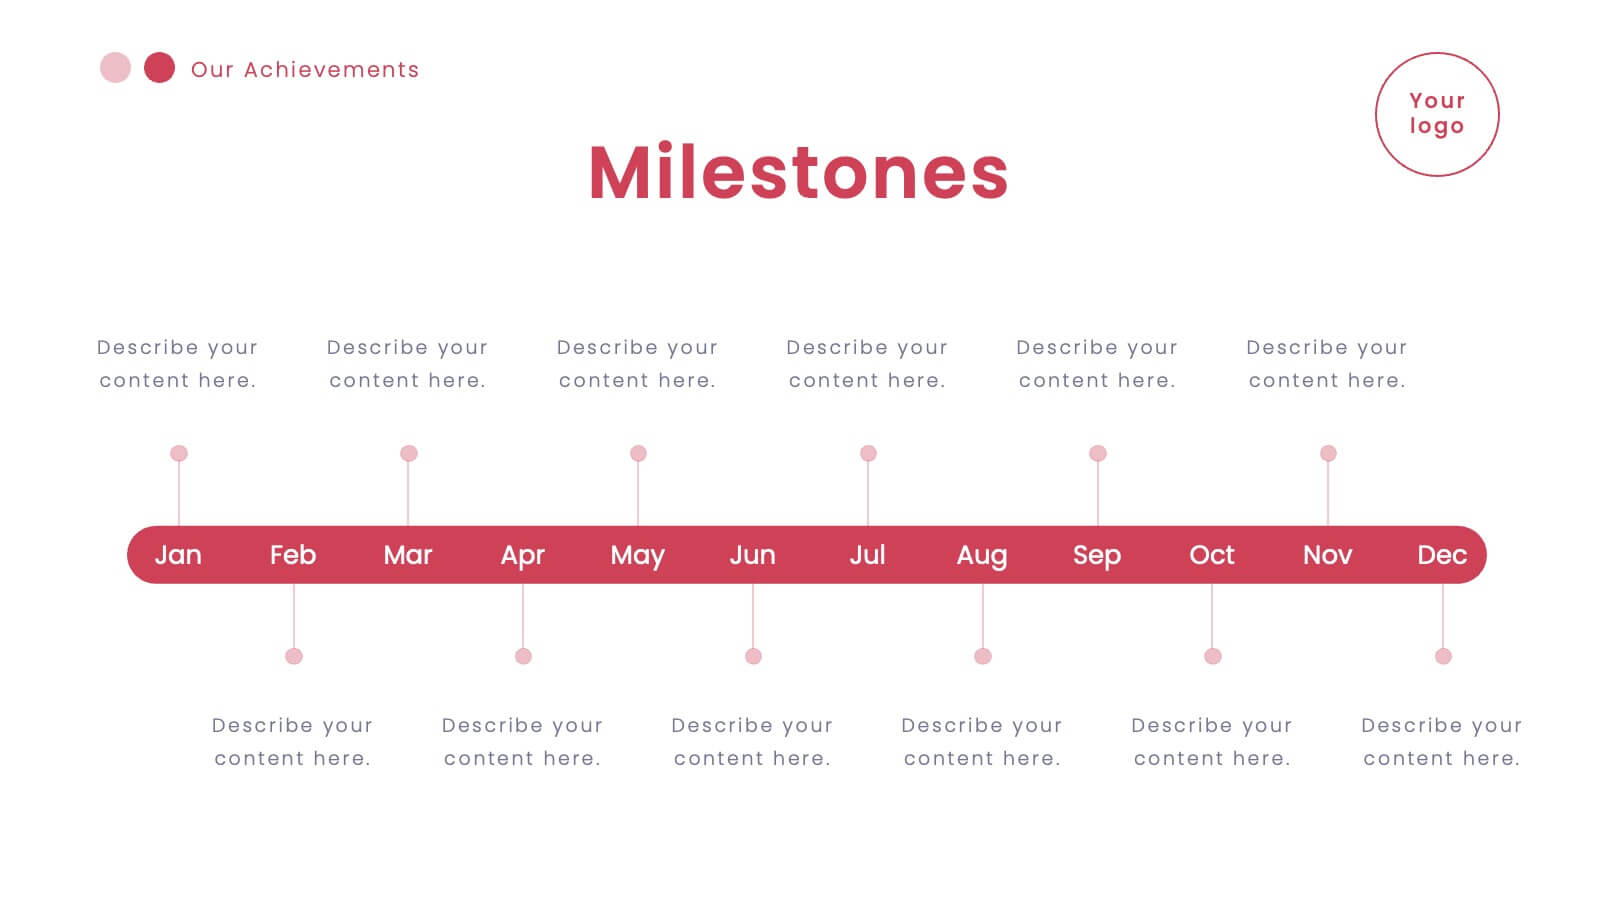
Team Time Allocation and Planning Presentation
Stay on top of your team's workload with the Team Time Allocation and Planning presentation slide. This template features a clear, month-by-month Gantt-style layout, helping you visualize team tasks, priorities, and resource distribution across the year. Ideal for project managers, department leads, or operations teams aiming to streamline scheduling and improve collaboration. Fully customizable in PowerPoint, Keynote, and Google Slides.


6 diapositivas
Market Segmentation by Demographics
Visually break down consumer behavior by gender with this clean, gender-split demographic chart. Ideal for marketing analysts and business strategists, this slide highlights key audience insights, purchasing trends, or engagement metrics. Fully editable in PowerPoint, Keynote, and Google Slides.


7 diapositivas
Veterinary Clinic Infographic Presentation
Veterinarians play a vital role in the health and wellbeing of animals, serving as their trusted doctors. Our comprehensive veterinary clinic infographic template features a diverse array of appealing illustrations that are completely customizable to meet your specific needs. Whether you are a student or a seasoned vet, we've got the perfect infographics for you to showcase all your crucial details in style! Our amazing template is the ultimate solution to help you present your services with crystal-clear clarity. You can create a visually appealing representation of all the awesome offerings at your clinic, including virtual appointments for your furry pals. So, what are you waiting for? Let's make your information shine like never before!


6 diapositivas
Aviation Classes Infographics
Discover the world of Aviation Classes with our customizable infographic template. This template is fully compatible with popular presentation software like PowerPoint, Keynote, and Google Slides, allowing you to easily customize it to illustrate and communicate various aspects of aviation education and training. The Aviation Classes infographic template offers a visually engaging platform to outline the types of aviation courses, training programs, career opportunities, and the importance of aviation education. Whether you're an aviation student, educator, aspiring pilot, or simply interested in aviation, this template provides a user-friendly canvas to create informative presentations and educational materials. Enhance your understanding of Aviation Classes with this SEO-optimized infographic template, thoughtfully designed for clarity and ease of use. Customize it to showcase different aviation disciplines, training institutions, certification requirements, and the role of education in the aviation industry. Ensure that your audience gains valuable insights into the world of aviation education. Start crafting your personalized infographic today to explore the realm of Aviation Classes.


6 diapositivas
Consumer Psychology in Marketing Presentation
Unlock the secrets of customer behavior with our 'Consumer Psychology in Marketing' presentation template. Tailored for marketing professionals, this template allows you to visually dissect and present consumer insights and behaviors. Engage your audience with compelling content that's perfect for workshops or client presentations, compatible with PowerPoint, Keynote, and Google Slides.


4 diapositivas
Employee Performance Feedback
Showcase progress clearly with this Employee Performance Feedback presentation. Featuring skill-based metrics, productivity scores, and analysis ratings, this layout uses visual data bars to evaluate team performance at a glance. Perfect for HR reviews, team assessments, or quarterly check-ins. Fully editable in PowerPoint, Keynote, and Google Slides.


4 diapositivas
Execution-Based Strategic Action Plan Presentation
Highlight your execution strategy with this visually striking pinwheel diagram. Each blade represents a focused action step, ideal for showcasing implementation plans or performance initiatives. Fully customizable in PowerPoint, Keynote, and Google Slides—perfect for strategic reviews, team briefings, or progress tracking across four critical areas.


6 diapositivas
Innovation-Driven Culture and Vision
Present your strategy with clarity using the Innovation-Driven Culture and Vision Presentation. This clean, modern layout features five vertical icon markers to highlight key pillars of innovation. Ideal for leadership talks or team strategy meetings. Fully customizable in PowerPoint, Keynote, and Google Slides for easy edits and branding.


7 diapositivas
Brain Balance Infographic
Introducing our brain infographic template, it's a colorful, engaging and professional brain diagram. This template is designed for a wide range of applications such as education, blogging, social media, marketing, presentations and other types of projects. This infographic is very easy to edit and customize. Fully customizable and compatible with Powerpoint, Keynote, and Google Slides, you can change text, colors and shapes with just one click. This infographic is perfect for any company that wants to show off their colorful personality. Create an infographic that will get people excited about your brand filled with facts and important information!


7 diapositivas
Butterfly Visualization Layout Presentation
Bring balance and clarity to your data storytelling with a sleek, symmetrical design that connects ideas seamlessly. This presentation is ideal for visualizing comparisons, workflows, or interconnected topics in a clean and engaging format. Fully customizable and compatible with PowerPoint, Keynote, and Google Slides.


6 diapositivas
Veterinary Clinic Service Guide Presentation
Bright, friendly, and professional—this clean infographic layout helps present veterinary services with clarity and warmth. Perfect for showcasing treatments, care plans, and clinic highlights, it brings a welcoming touch to any animal care presentation. Fully customizable and compatible with PowerPoint, Keynote, and Google Slides for effortless editing and presentation.


5 diapositivas
Eco-Friendly Practices Implementation Presentation
Brighten your message with a clean, circular design that maps out every green initiative step-by-step. This visual template illustrates key eco-conscious actions, helping you present sustainable practices with ease. Perfect for environmental reports, team strategies, or policy pitches. Fully compatible with PowerPoint, Keynote, and Google Slides for flexible editing.


5 diapositivas
Strategic Budget Planning Forecasting Presentation
For strategic financial management, our Strategic Budget Planning Forecasting template provides a clear visual guide for balancing income and expenses. Ideal for financial planners, it simplifies quarter-by-quarter planning with dynamic charts, ensuring clarity and precision in forecasting financial outcomes. Fully compatible with PowerPoint, Keynote, and Google Slides, it's a versatile tool for any financial presentation or workshop.

22 diapositivas
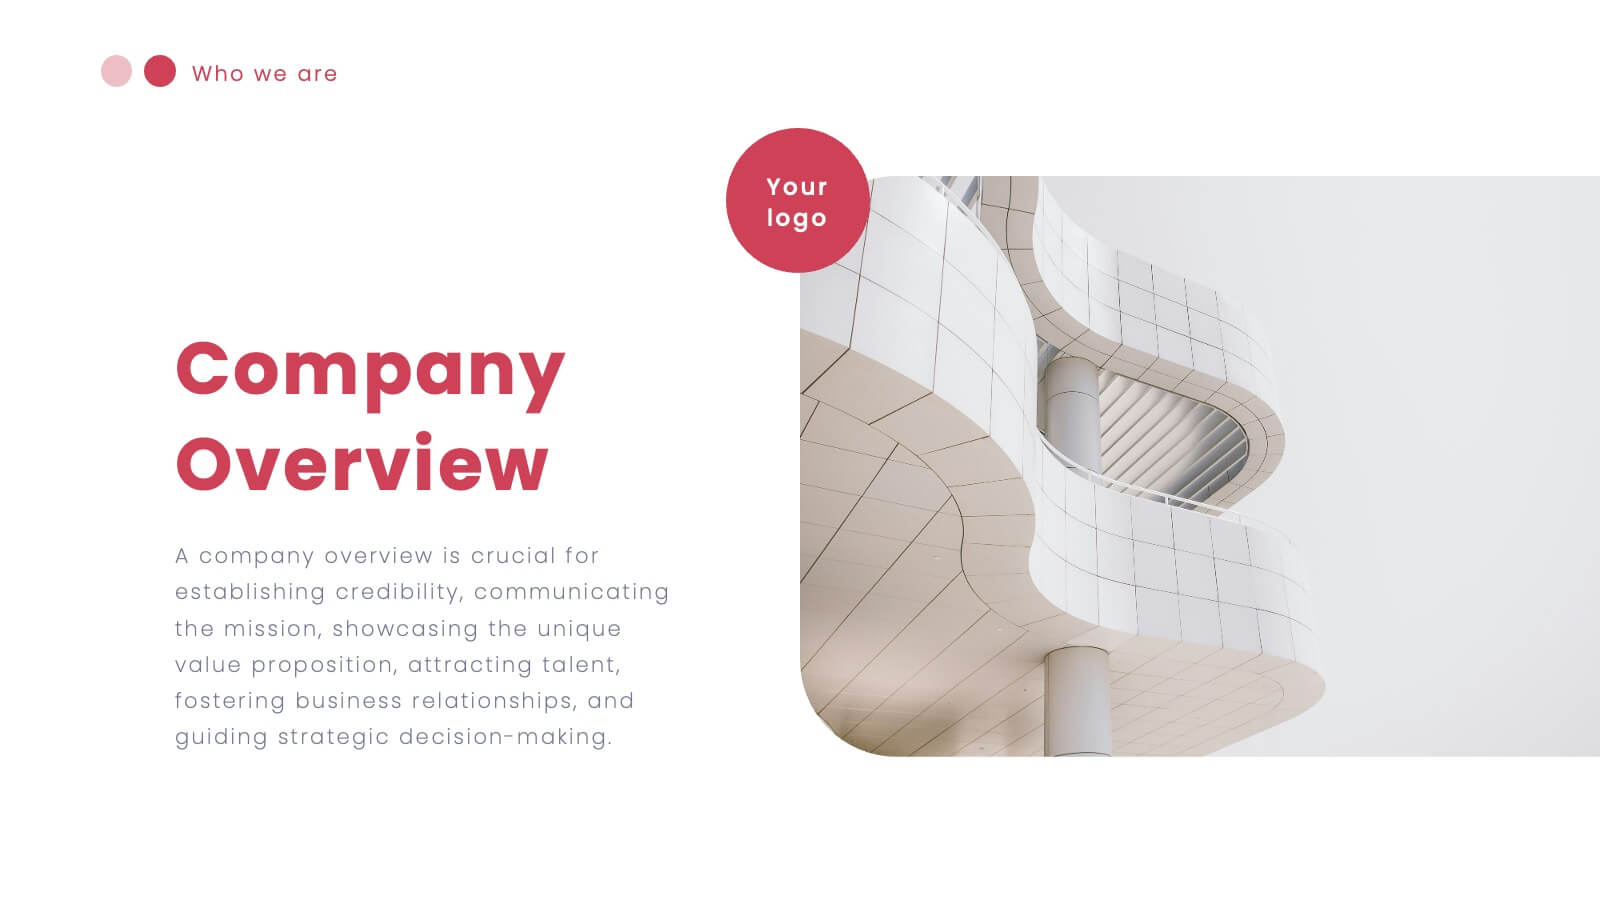
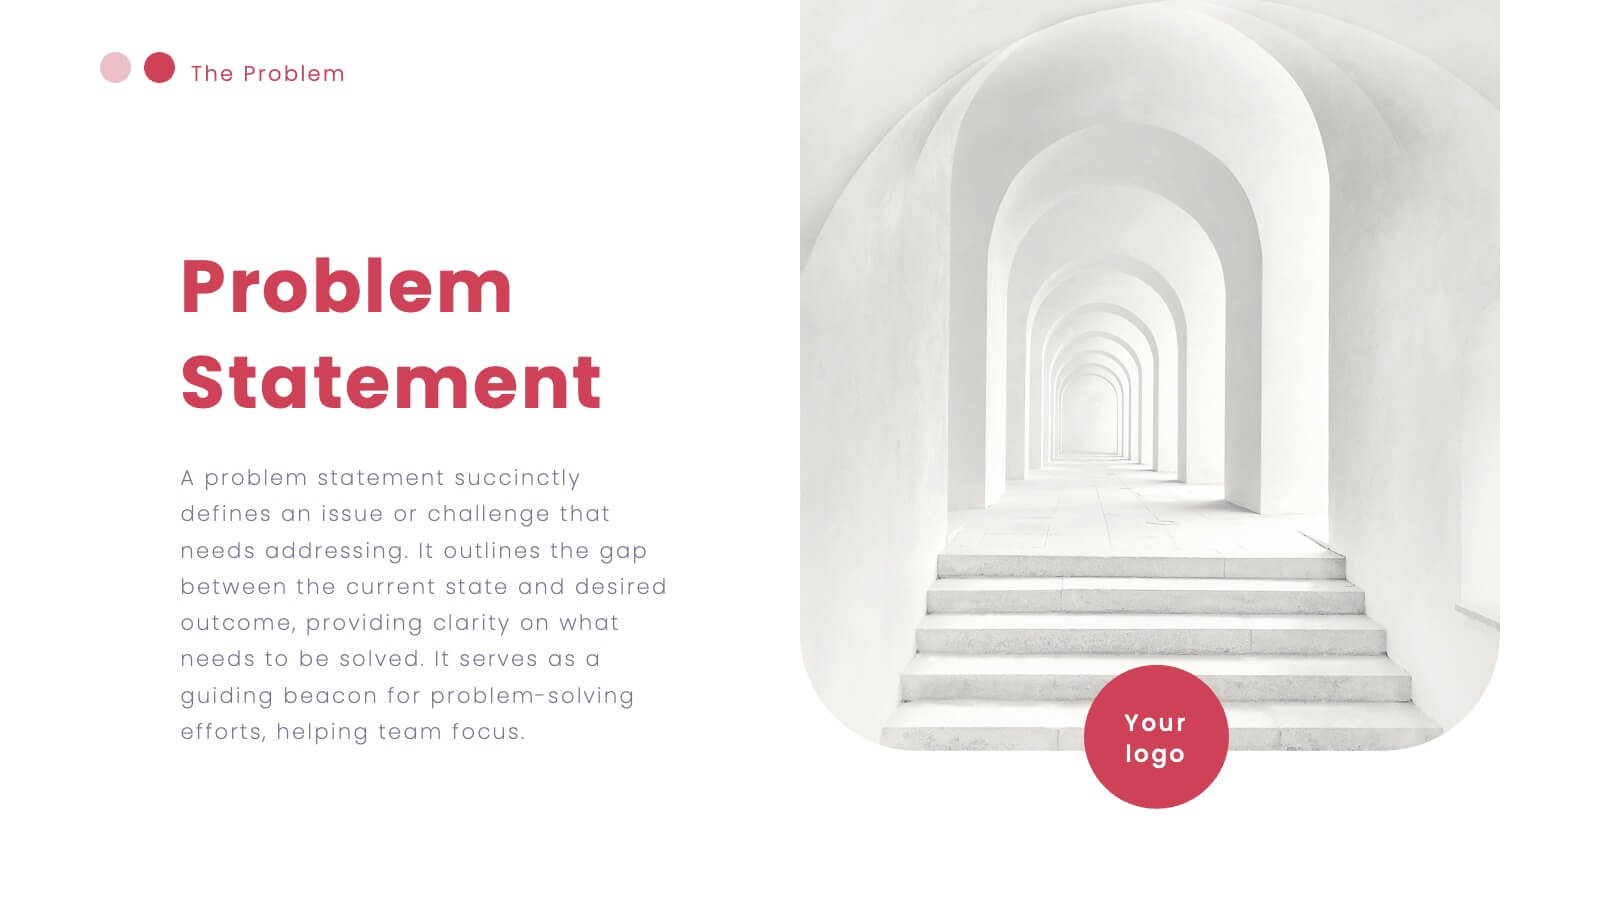
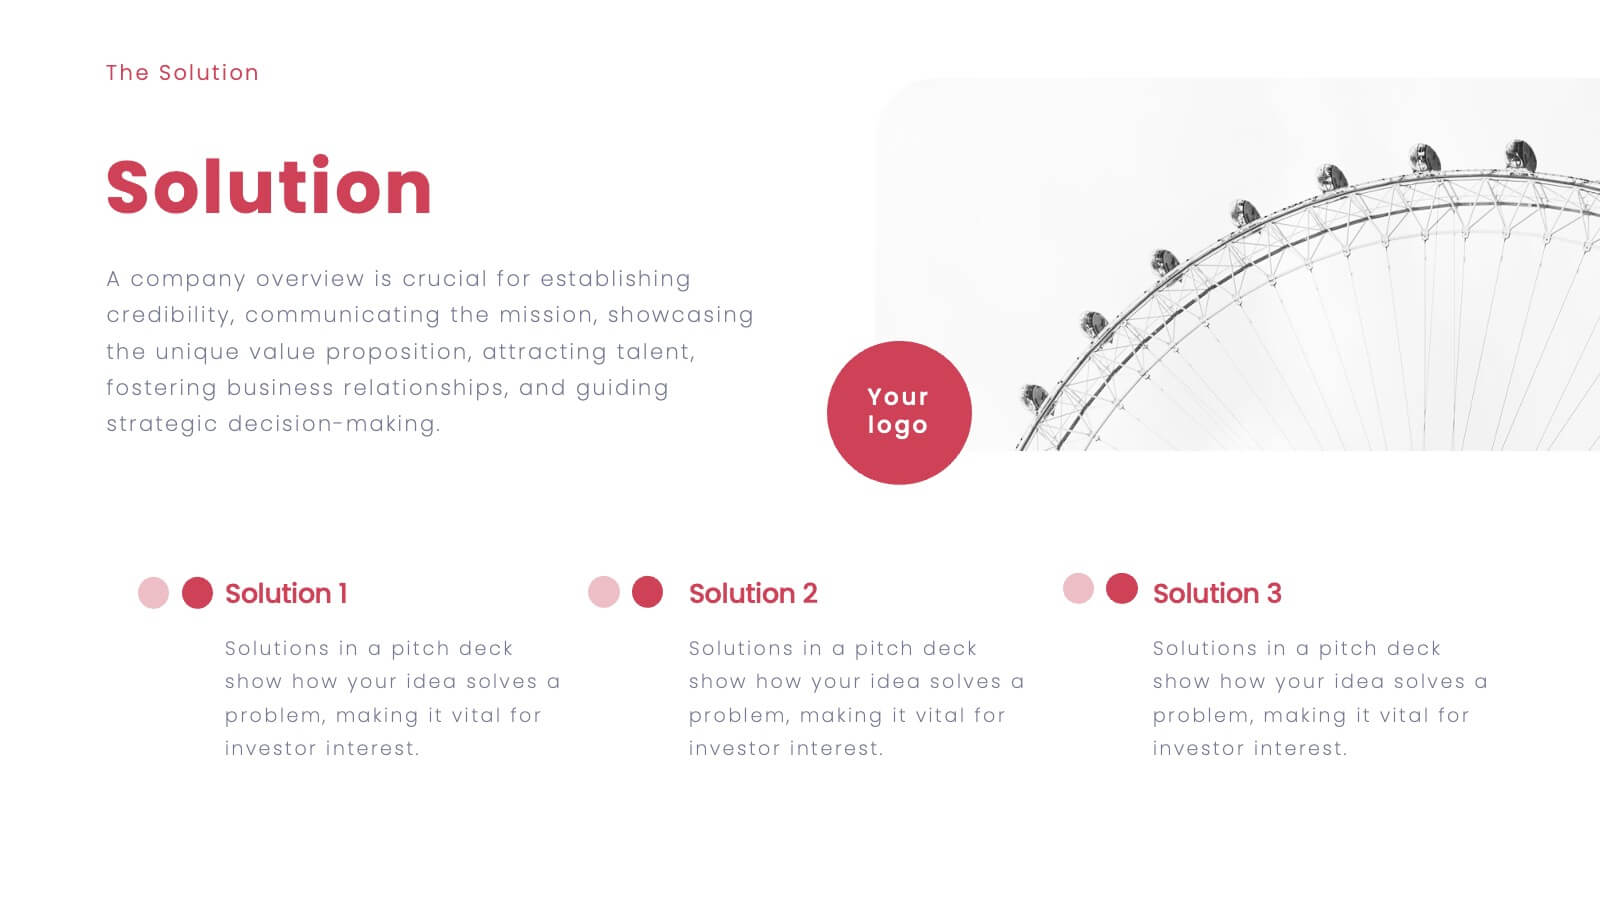
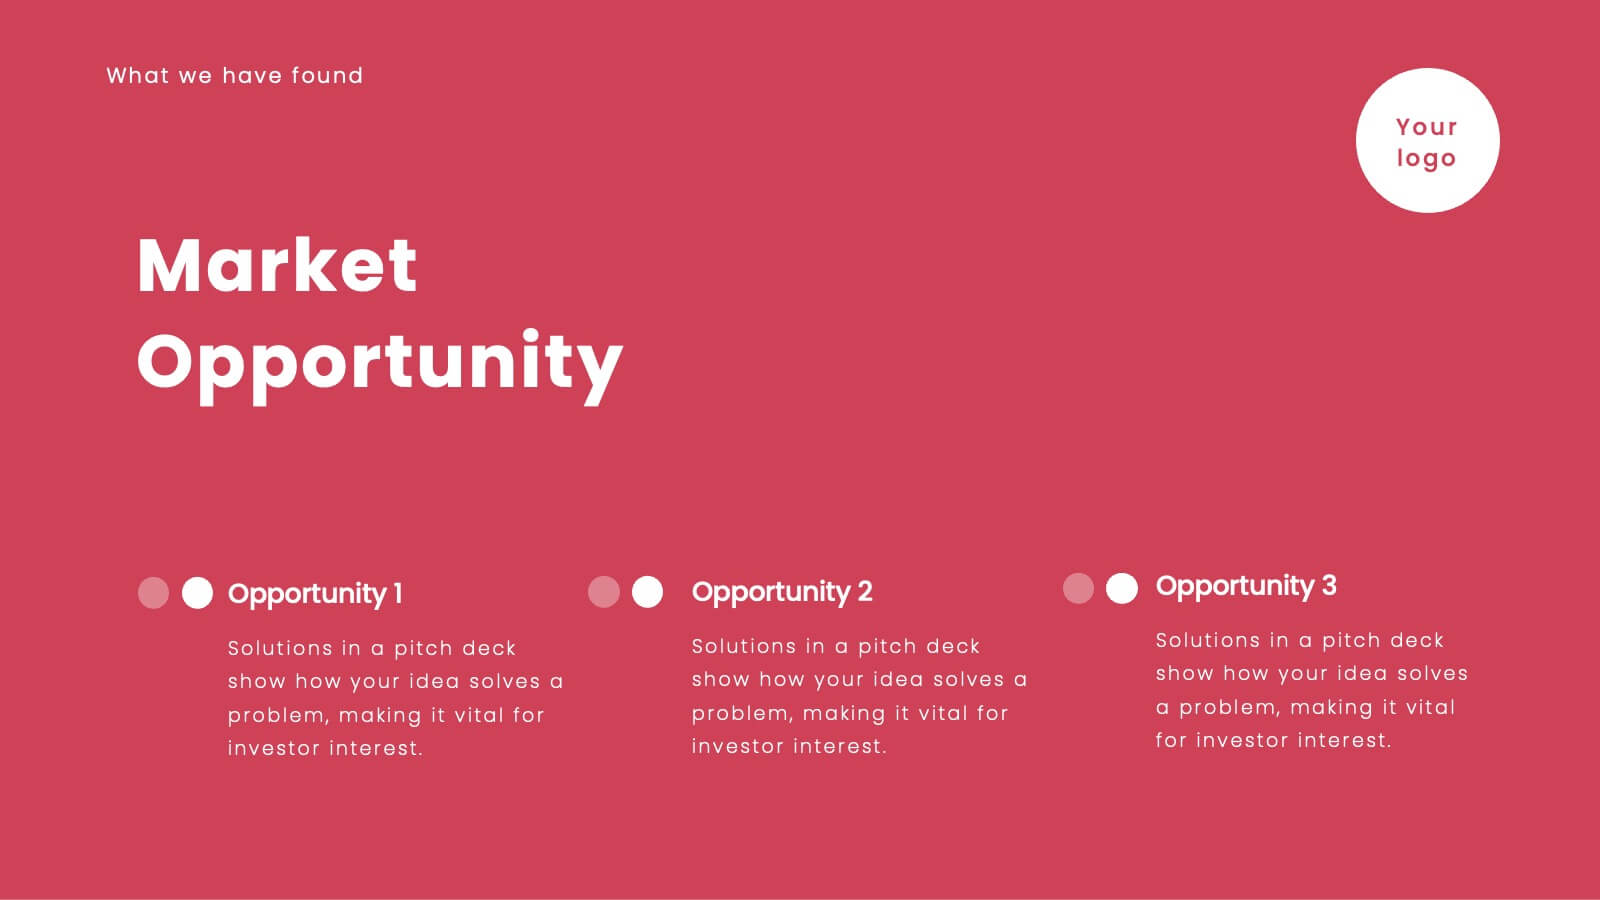
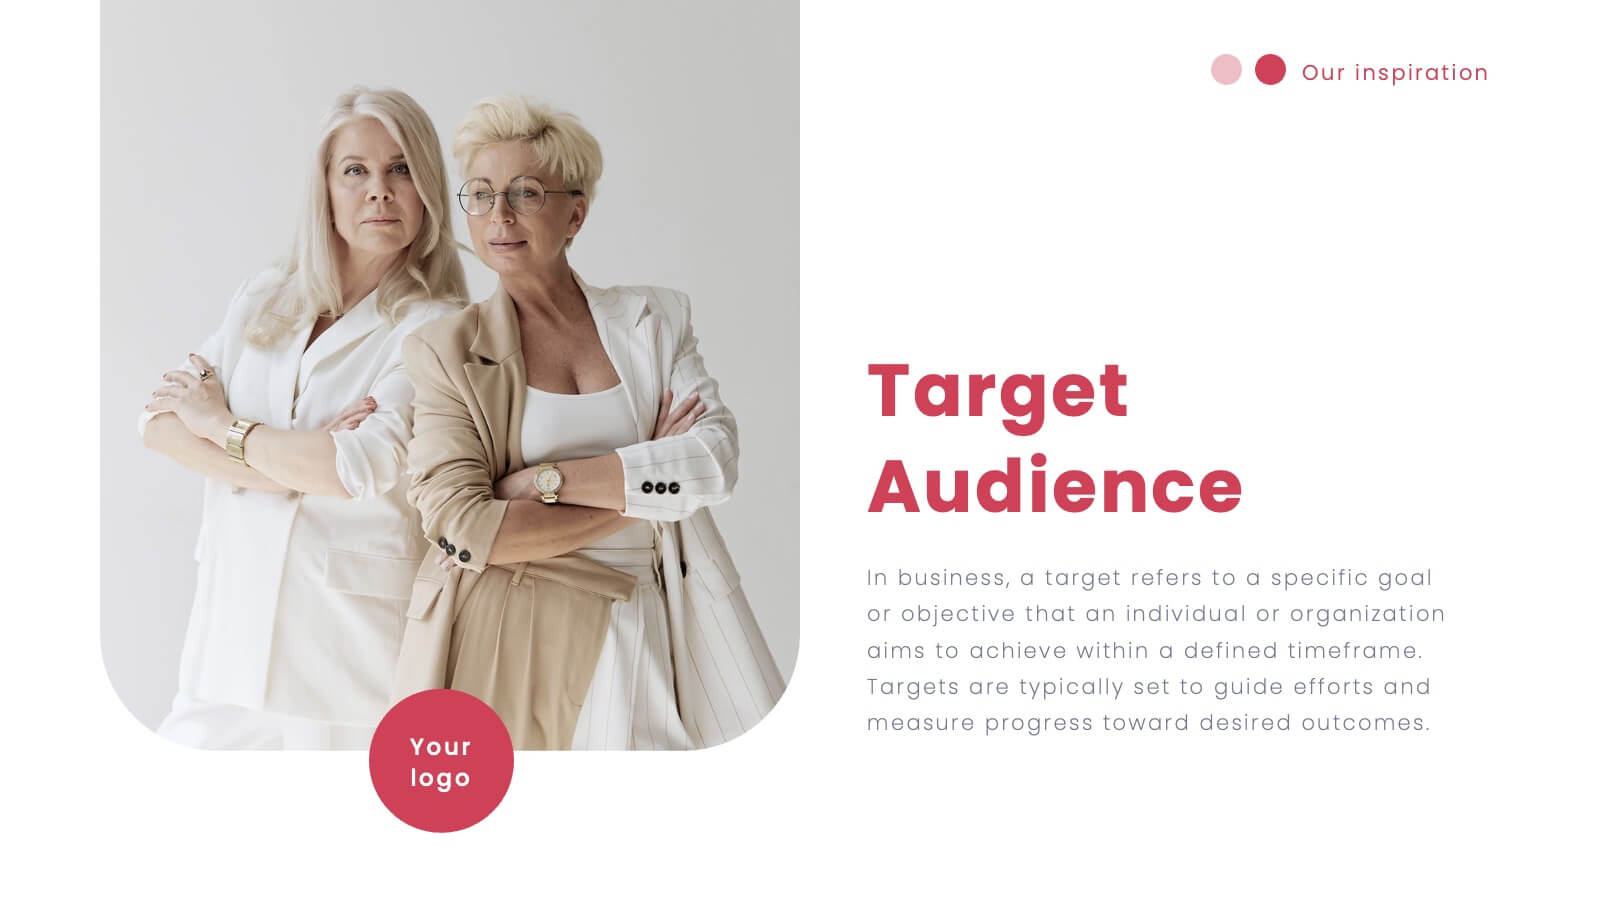
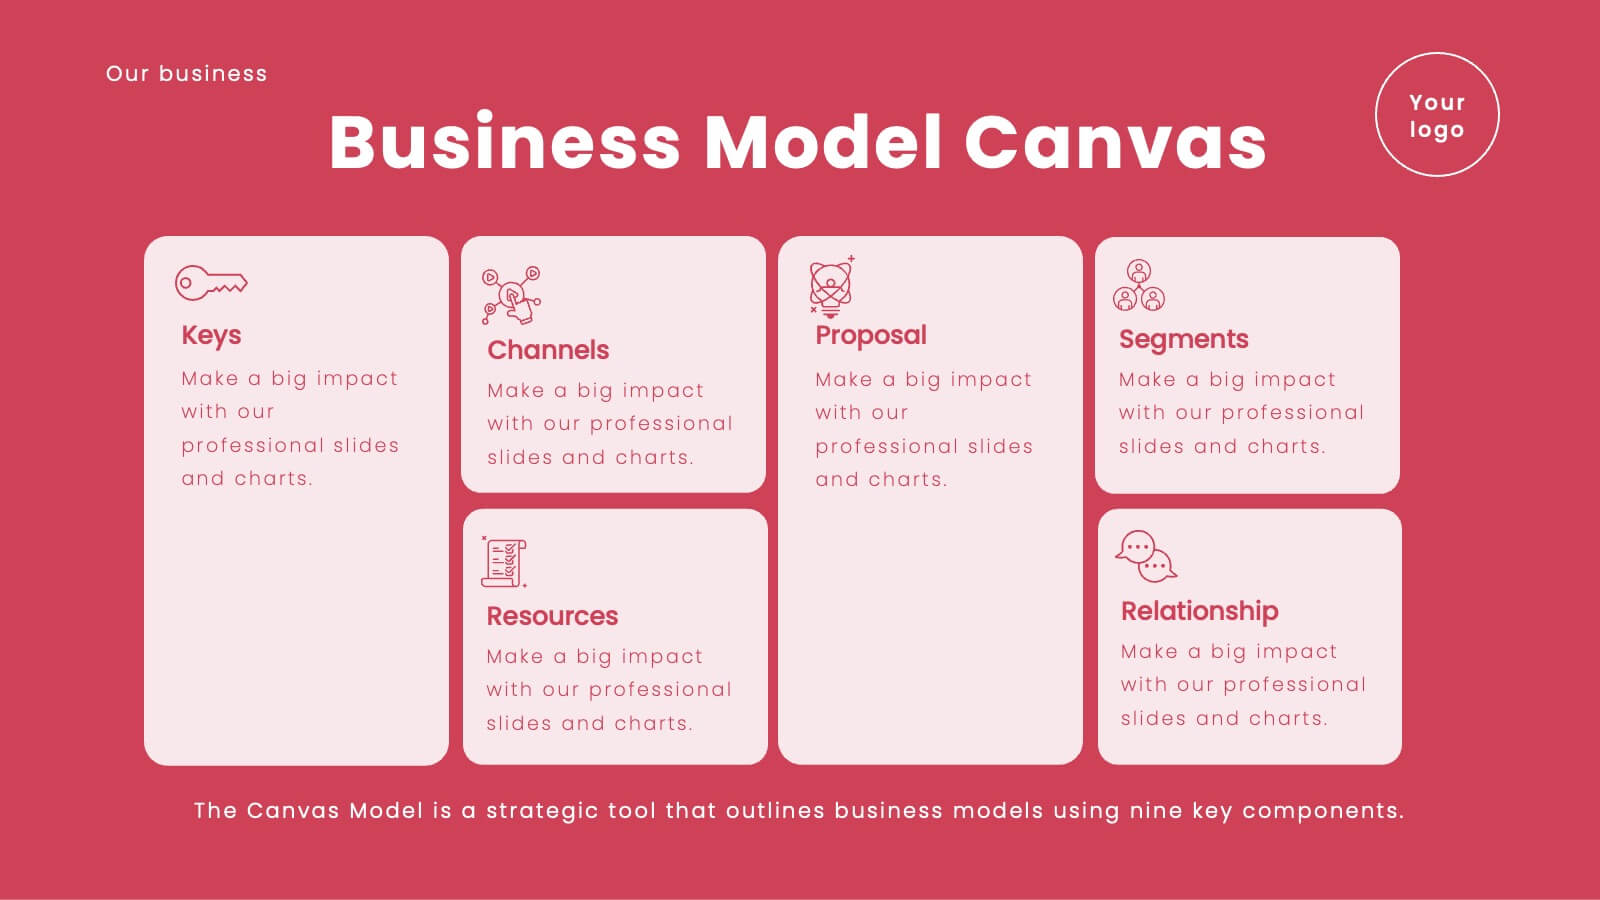
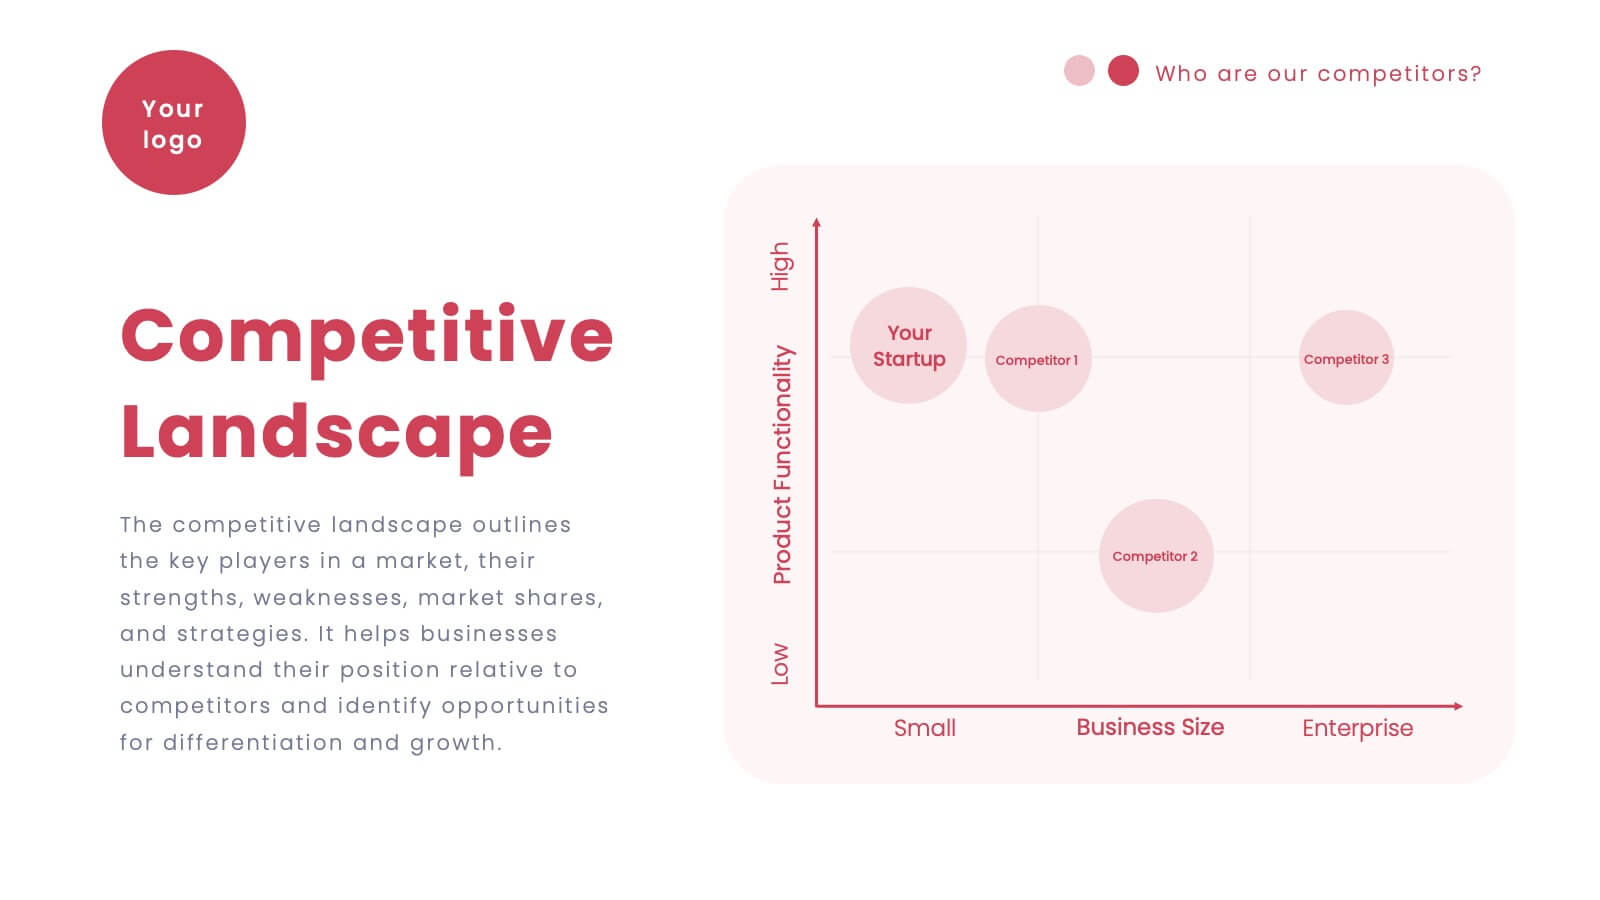
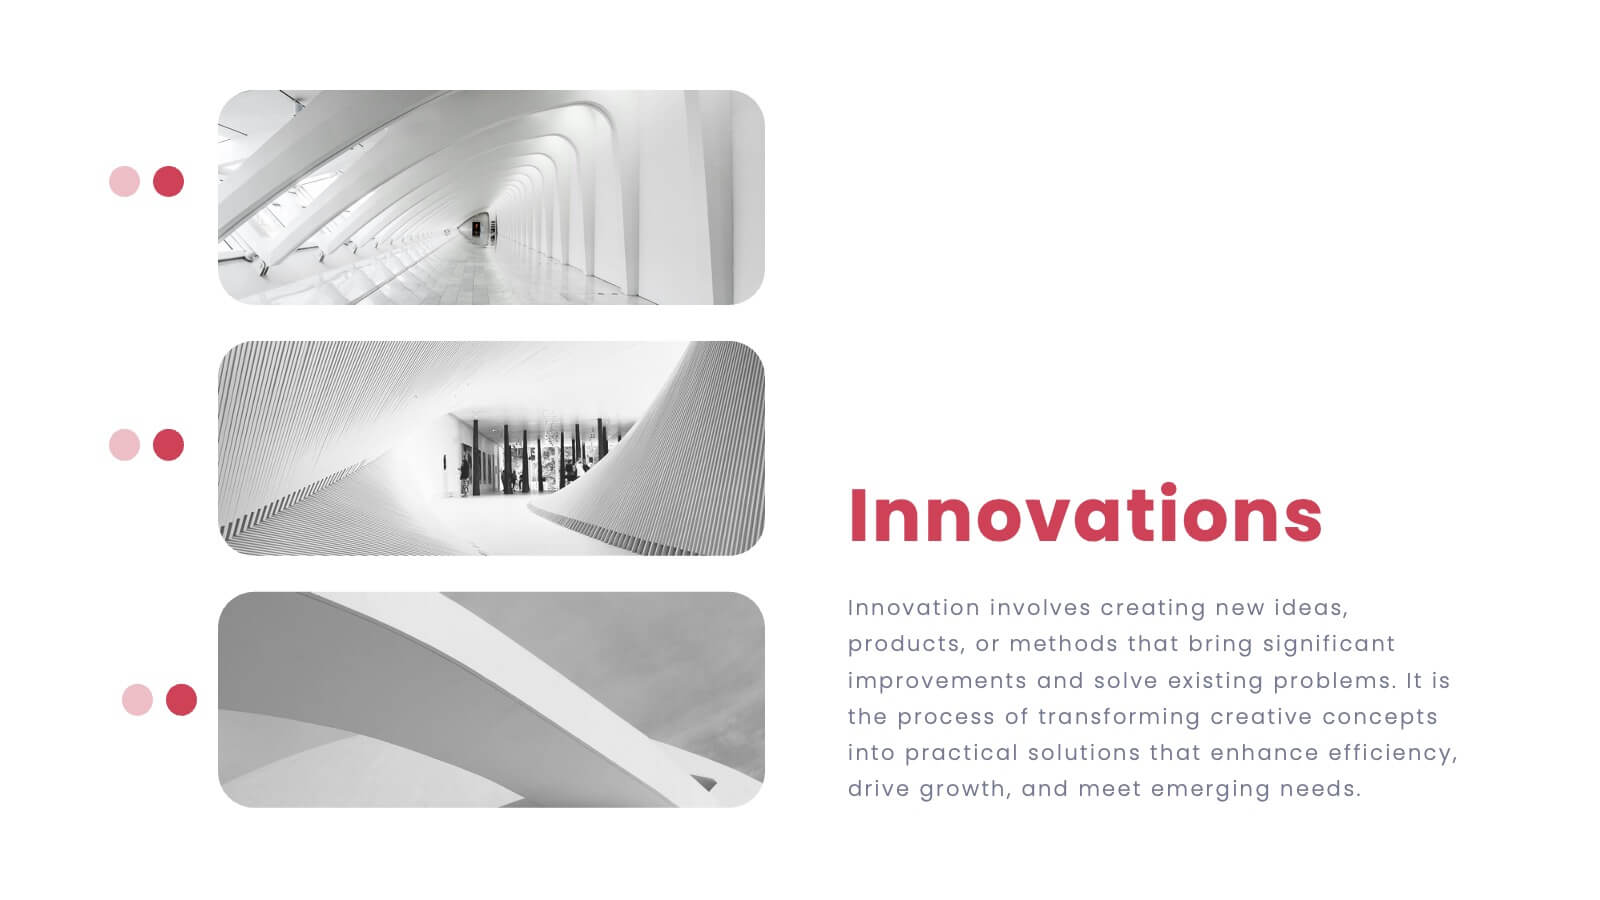
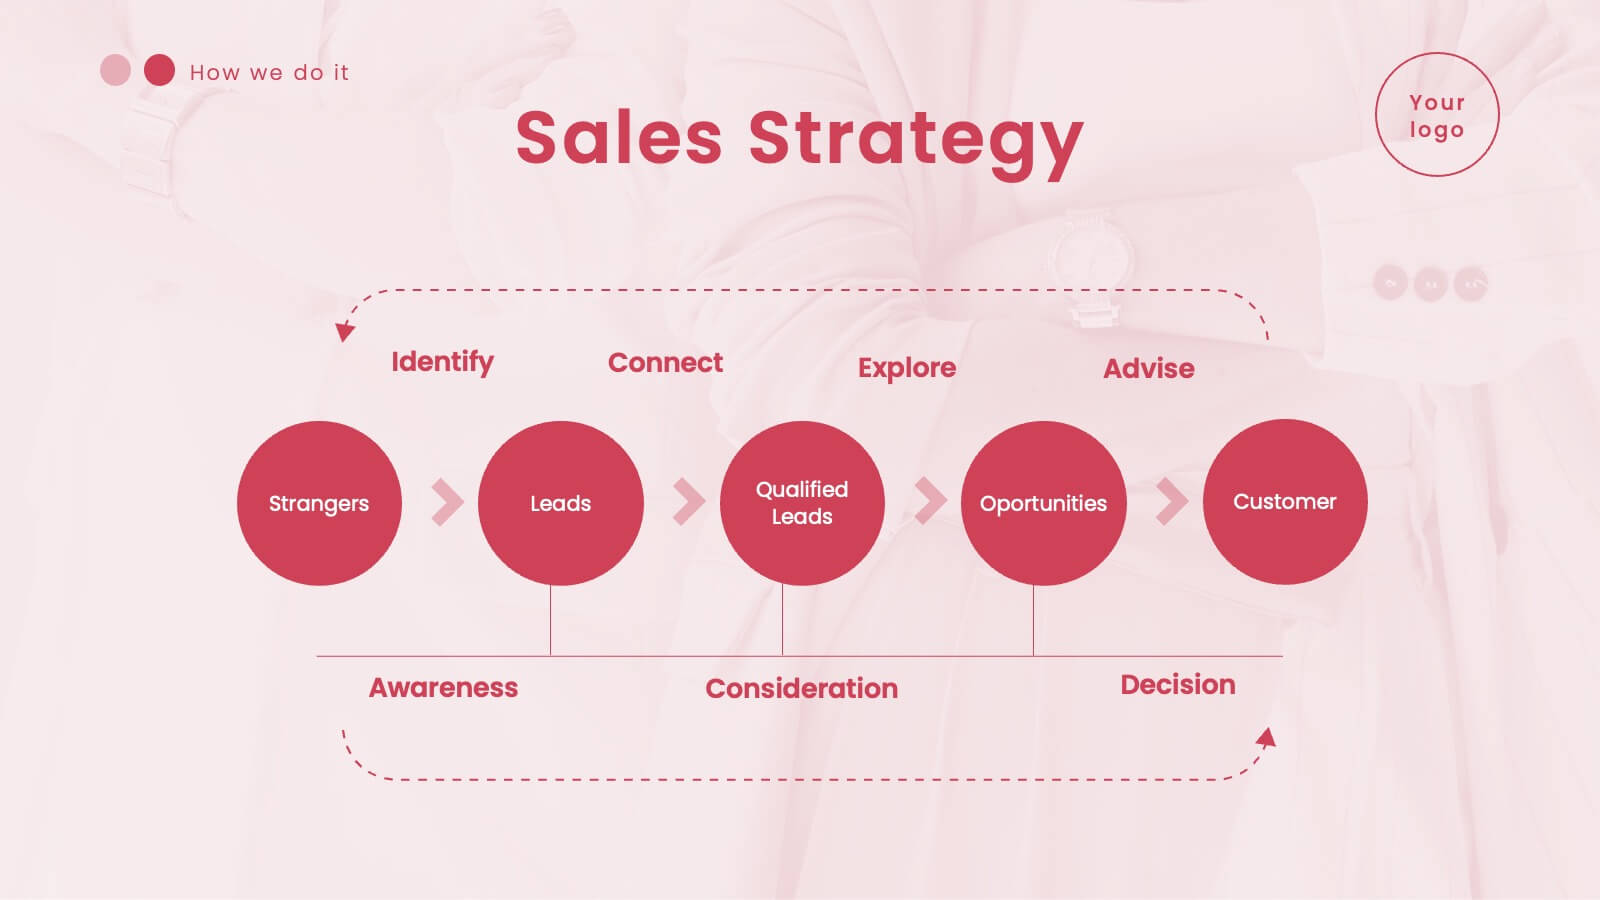
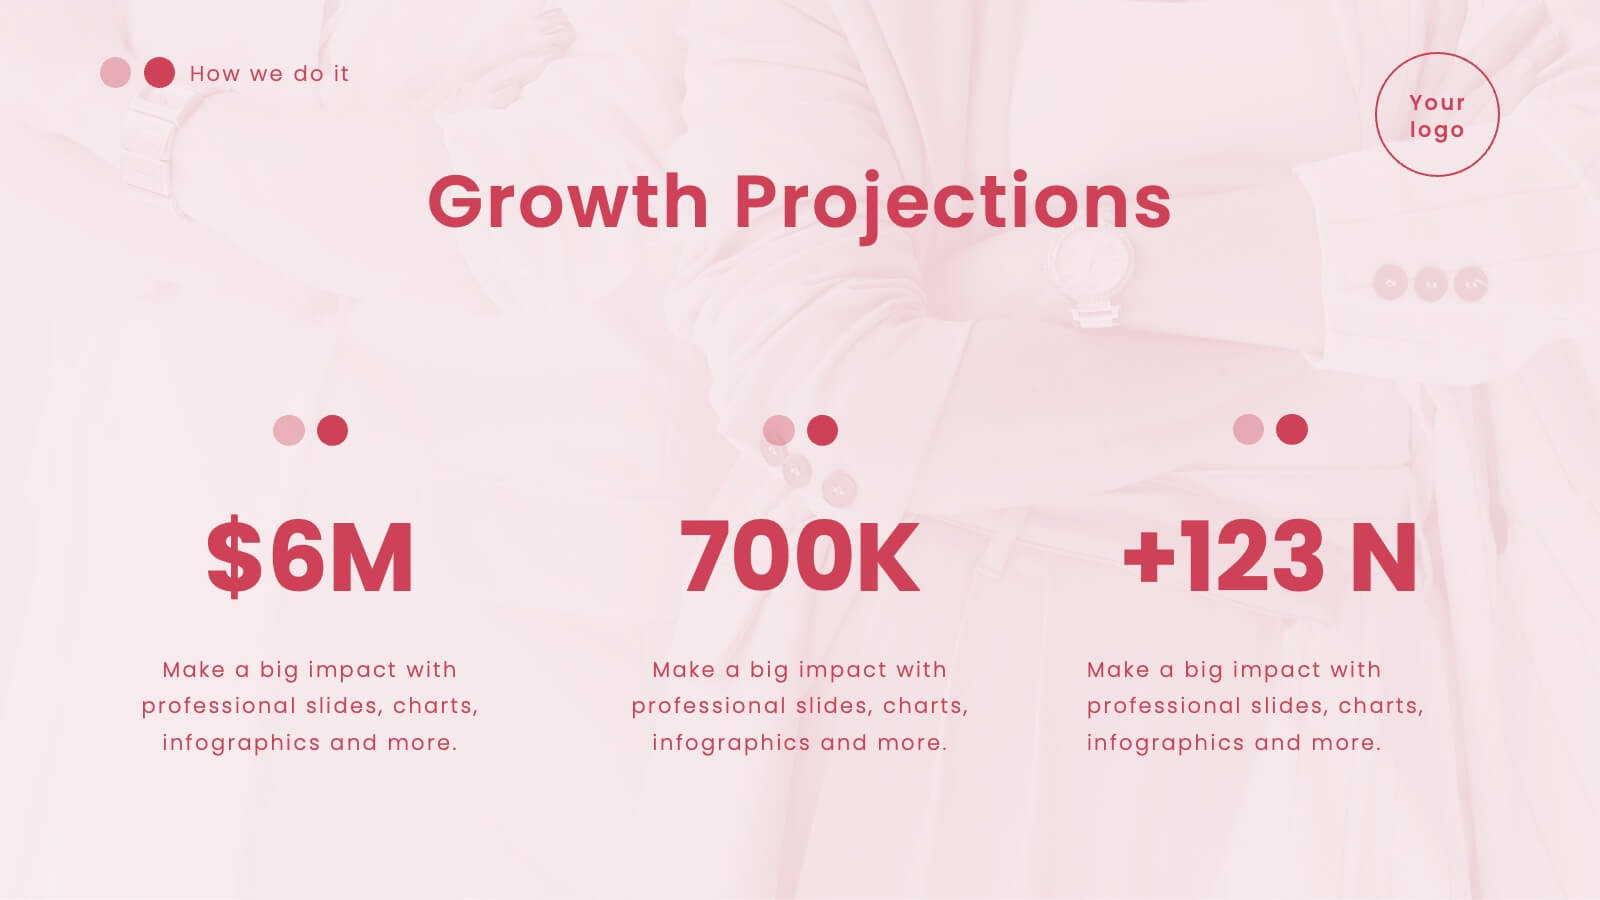
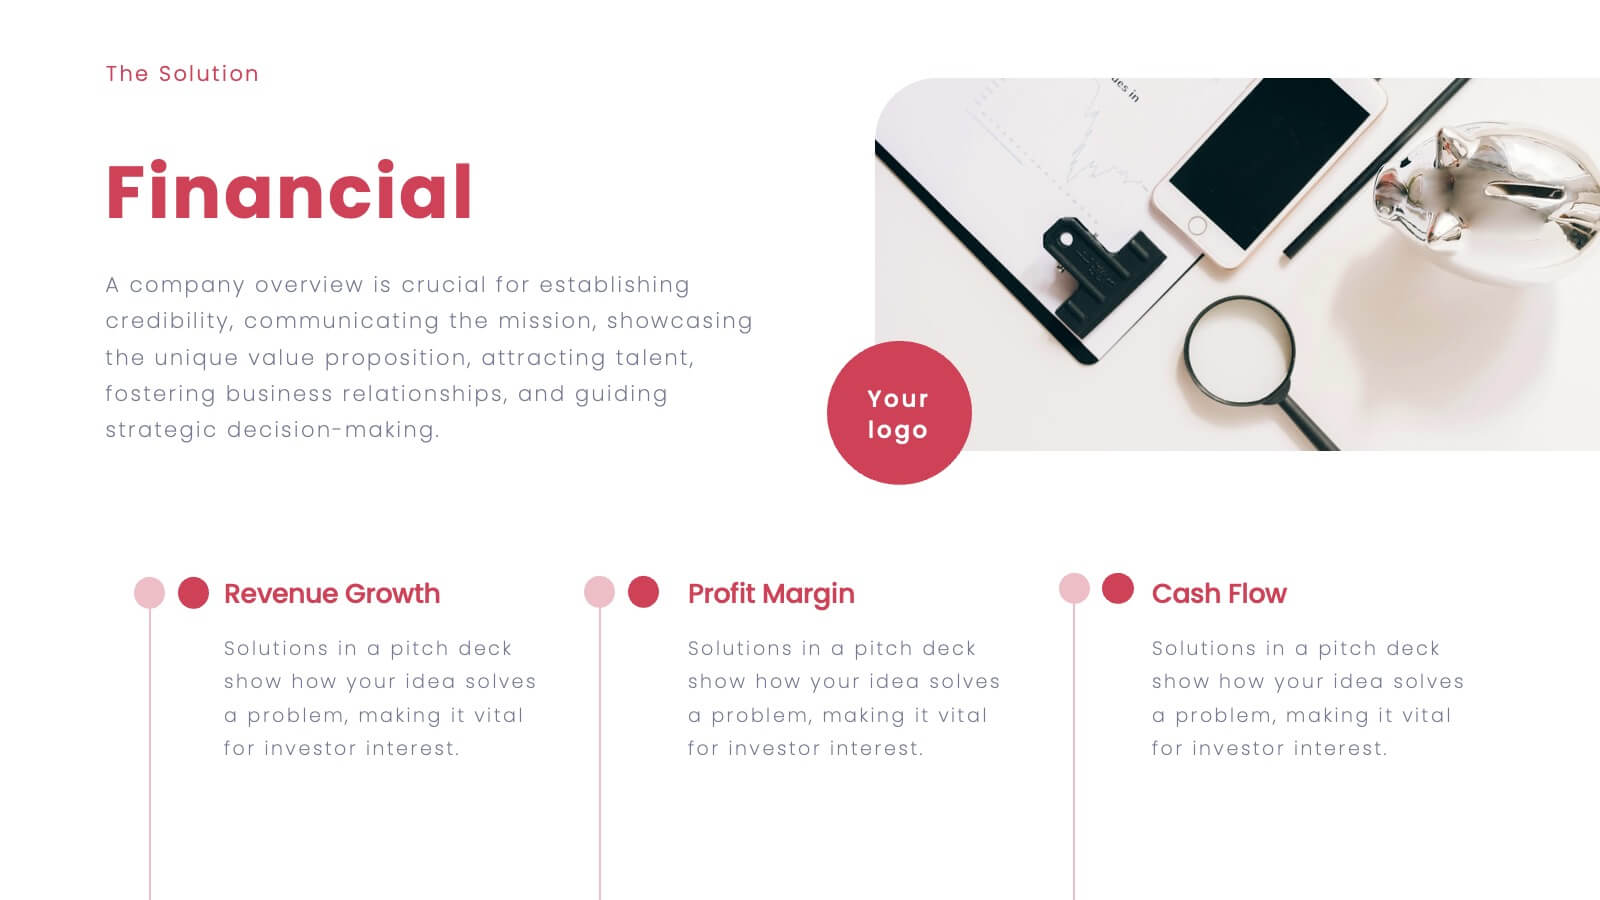
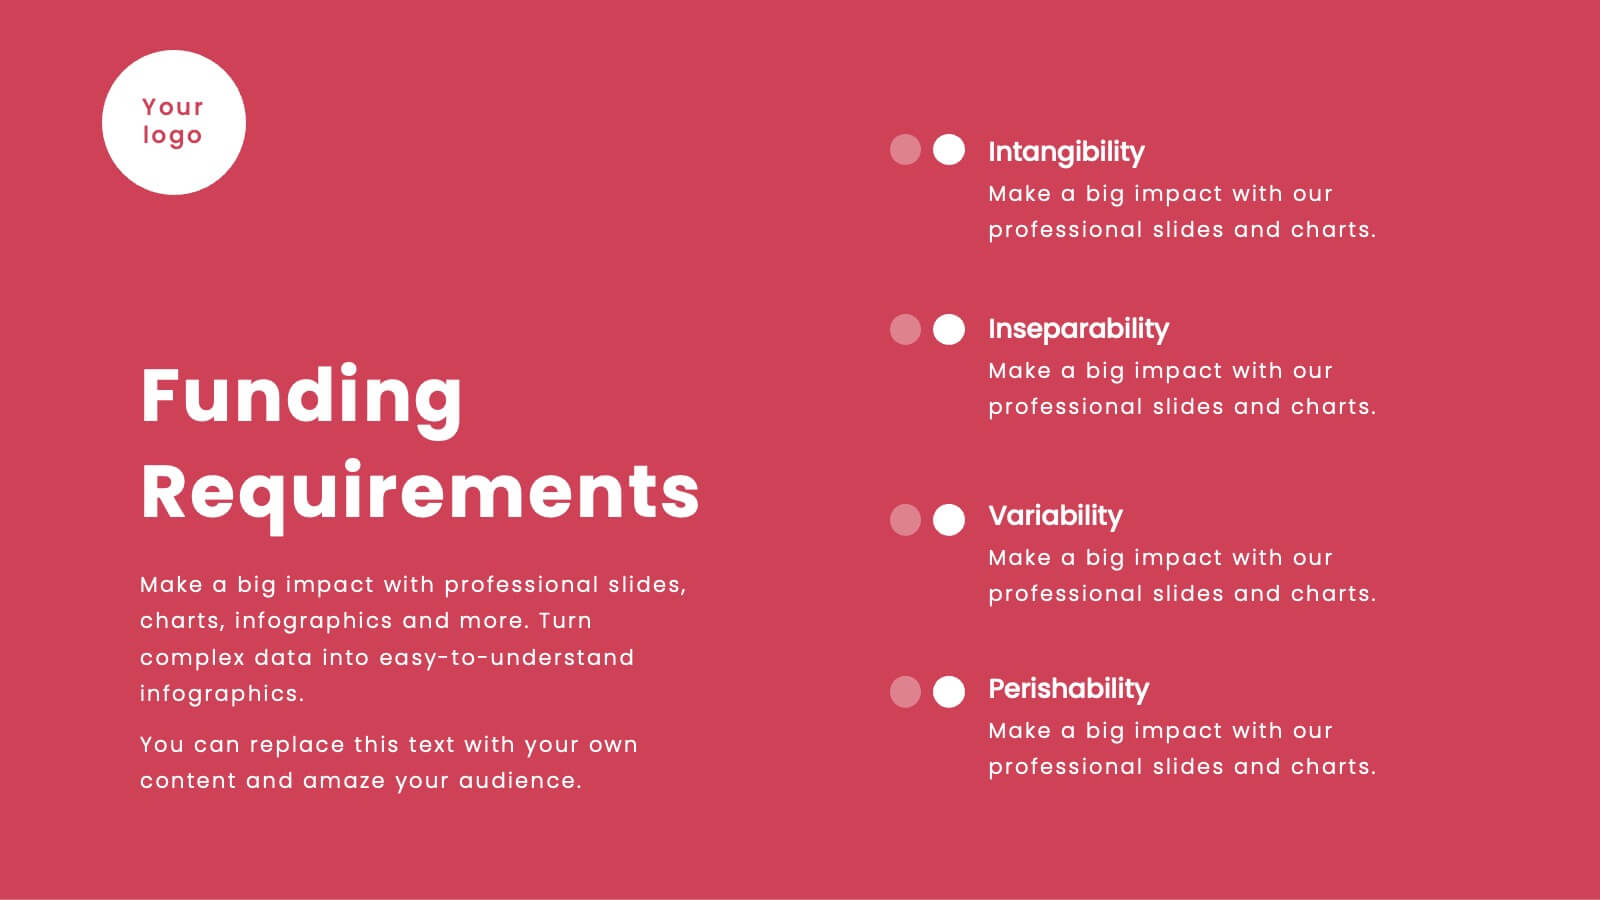
Vortex Startup Pitch Deck Presentation
Launch your ideas into action with this vibrant red pitch deck template, designed to captivate and inform potential investors. It covers everything from company overview to financials and market strategy, ensuring your vision is communicated effectively. Compatible with PowerPoint, Google Slides, and Keynote, this template is perfect for startups seeking to impress and engage.


6 diapositivas
STEM Education and Discovery Presentation
Showcase your STEM insights with this vibrant puzzle-piece infographic. Each piece highlights a key point in science, technology, engineering, or math—perfect for lesson plans, research summaries, or discovery processes. Fully customizable in PowerPoint, Keynote, and Google Slides, making it ideal for educators, researchers, or curriculum developers.


21 diapositivas
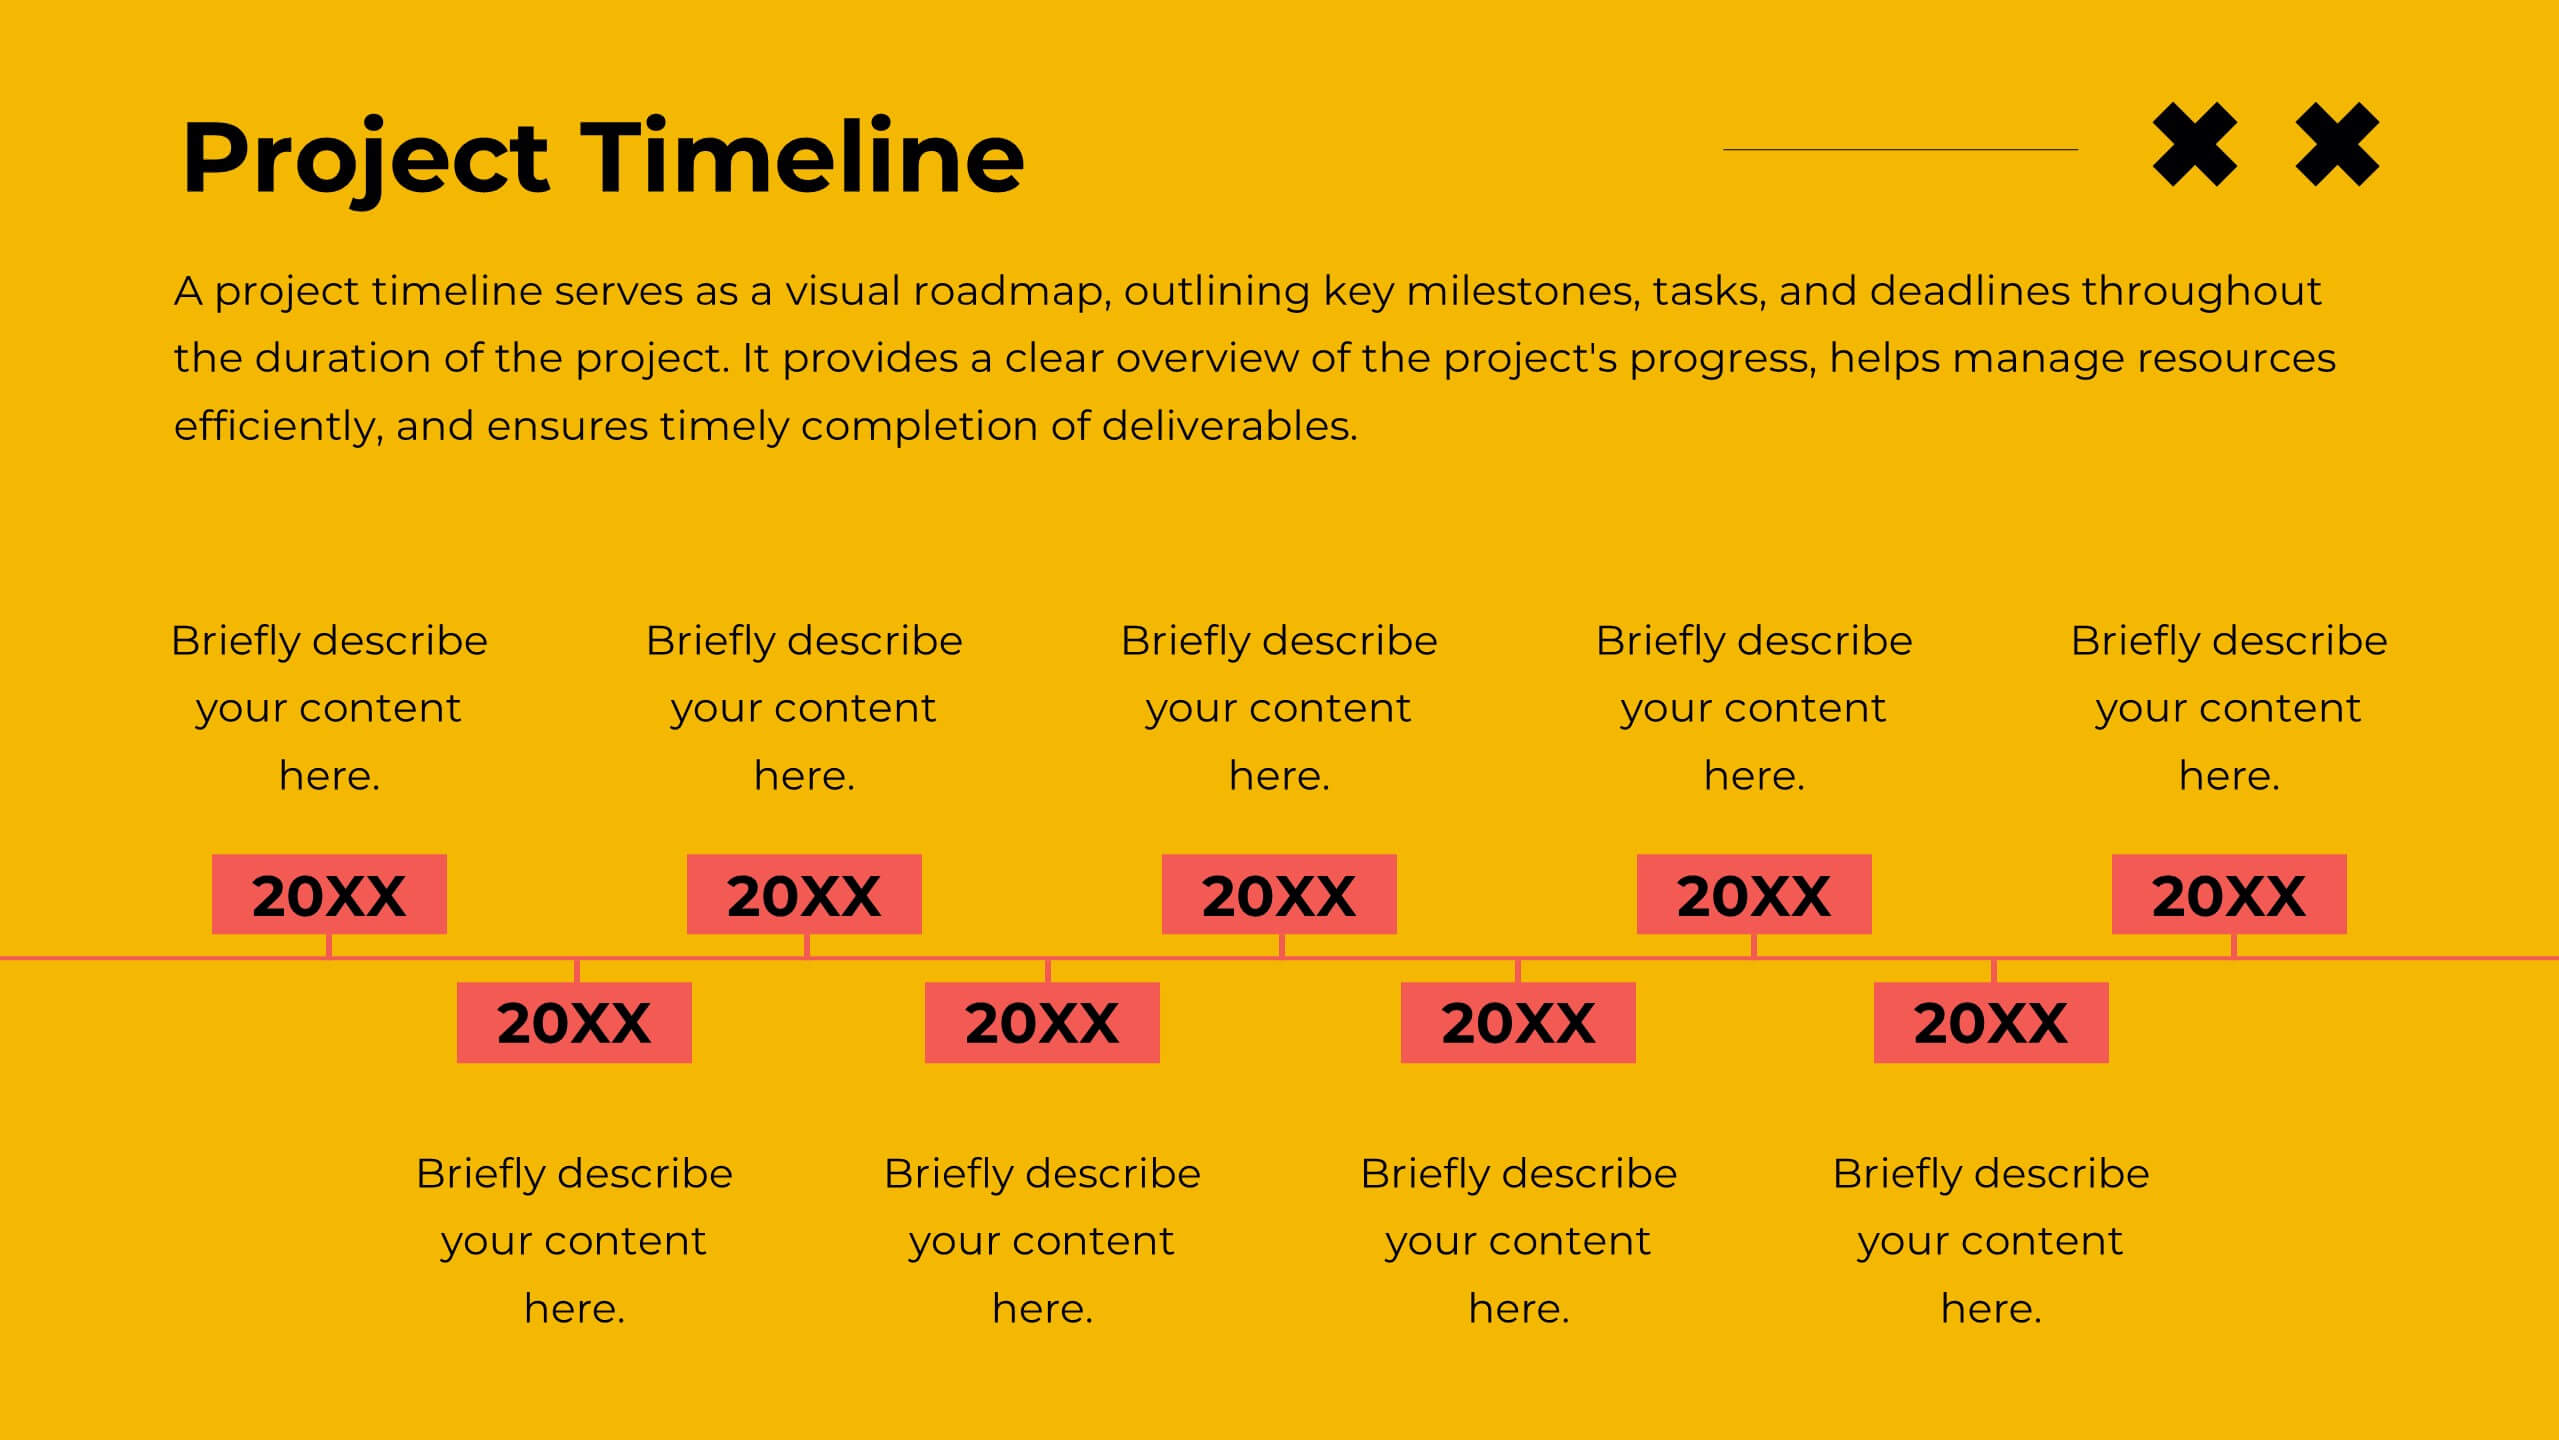
Oslo Design Strategy Proposal Presentation
This design strategy proposal template is tailored to present your creative process with bold colors and clean layouts. It includes sections like overview, design brief, concept development, design process, mood board, and project timeline, giving you a comprehensive structure for showcasing your approach. Compatible with PowerPoint, Keynote, and Google Slides, it ensures seamless presentations.