


Características


¿Tienes alguna pregunta?
Recomendar


5 diapositivas
Porter's Model of Competitive Strategy Presentation
The Porter's Model of Competitive Strategy Presentation offers a unique and modern take on the classic 5 Forces framework. Each force—Buyers, Suppliers, Competitors, Substitutions, and New Entry—is visually represented in a pentagonal arrangement, making it easy to see how each element interacts. With customizable sections for text and icons, this layout is perfect for strategic analysis, consulting reports, or business planning. Compatible with PowerPoint, Keynote, and Google Slides.


7 diapositivas
Leadership Infographic Presentation Template
Leadership is a vital function of management. It helps to direct an organization's resources toward improved efficiency and the achievement of goals. While leadership can be defined in many ways, it is best explained as the ability to motivate and inspire others through example, providing them with direction and being a source of inspiration for those under your authority. This template is designed for you to build the key skills of leadership. Leadership is important for the success of any organization. This template will help you identify your leadership strengths and how to use them.


5 diapositivas
Myths & Facts About Cases Of Mass Hysteria Infographics
Delve into the intriguing world of collective human psychology with myths & facts about cases of mass hysteria infographics. Set against an engaging purple backdrop, these infographics are designed to captivate, educate, and debunk misconceptions surrounding mass hysteria events. Ideal for historians, educators, psychologists, and students. The creative use of vibrant colors and compelling icons help in breaking down complex psychological phenomena into understandable content, making it easier to spark discussion on this fascinating subject. Whether it's for academic purposes, or informational content, this template stands out by blending education with intriguing storytelling.


5 diapositivas
Climate Change Activism Infographics
Climate change activism refers to the efforts of individuals, organizations, and communities that are dedicated to raising awareness about the urgent need to address and mitigate the impacts of climate change. These vertical infographics are powerful and visually compelling presentations that aim to raise awareness about the pressing issue of climate change and inspire action towards a sustainable future. This template is ideal for environmental organizations, activists, educators, and anyone seeking to educate the public about climate change and the urgent need for collective action. Fully compatible with powerpoint, Keynote, and Google Slides.


8 diapositivas
Attention-Interest-Desire-Action Presentation
Enhance your marketing presentations with this Attention-Interest-Desire-Action (AIDA) Model Presentation template. Designed with a modern, structured pyramid layout, this template clearly illustrates the four key stages of consumer decision-making. Ideal for marketers, sales teams, and business strategists, it’s fully customizable and compatible with PowerPoint, Keynote, and Google Slides.


8 diapositivas
Economic Improvement in South America Map Presentation
Highlight regional performance with this South America economic growth map. Featuring 3D bar charts and country-specific markers, it’s ideal for visualizing financial progress, investments, or development trends. Fully editable in PowerPoint, Google Slides, and Keynote, this layout is perfect for reports, forecasts, and business reviews with a geographic focus.


7 diapositivas
Governance Infographics Presentation Template
Our Governance Infographic is designed to present complex information in an easy-to-understand format that is accessible to a wide audience. This template gives you the opportunity to create an infographic that is easy on the eye, but thorough and detailed enough to make sure all the points are covered. This template includes 7 slides that present a comprehensive framework for monitoring and evaluating a company's governance, risk management, and compliance programs. Packed with great content, this presentation tells the story of your governance system. Get started easily by adding your text!


7 diapositivas
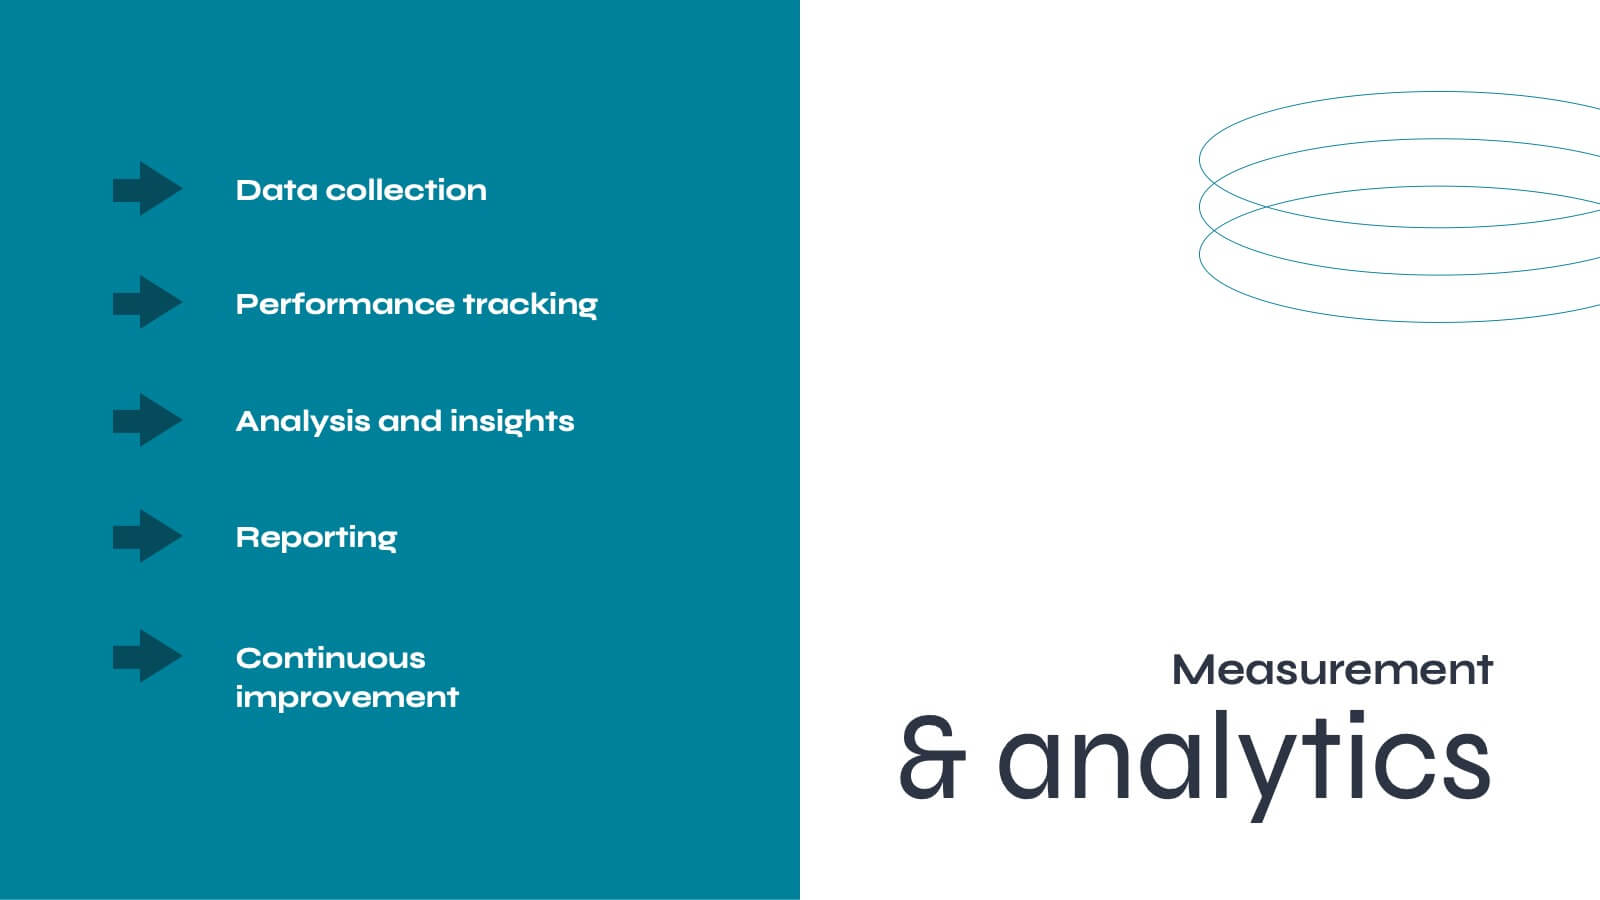
Performance Summary Infographic
Boost your reporting capabilities with our Infographic Templates, designed to deliver exceptional clarity and impact. This series is perfectly suited for professionals seeking to present performance data compellingly and concisely. With a variety of designs including radial graphs, tiered lists, and comparative bars, these templates allow for an informative and aesthetically pleasing showcase of critical metrics. Each template is customizable, letting you adjust the color schemes and text to fit your corporate style, enhancing both visual appeal and brand consistency. Whether used in PowerPoint, Google Slides, or Keynote, these tools are vital for anyone looking to articulate achievements, assess comparative results, and plan based on solid data insights. They are indispensable for consultants, managers, and team leaders who require clear, persuasive presentation resources to drive decisions and highlight successes.


7 diapositivas
Demographic Data Infographic
Demographic data refers to information that characterizes the composition of a population or a specific group based on various socio-economic factors. Our demographic data infographic is not just a graphic, this is a powerful visualization that explores society and empowers decision-makers to understand, connect, and prosper. Prepare for an exhilarating journey through demographics, where data transforms into meaningful insights. Compatible with Powerpoint, Keynote, and Google Slides. This can be used for a variety of purposes, including market research, targeted marketing, policy development, resource allocation, urban planning, and more.


10 diapositivas
Customer Satisfaction and Smile Rating Presentation
Visualize customer experience in a clear and engaging way with this Customer Satisfaction and Smile Rating slide. Featuring a vertical feedback meter and 5 customizable rating levels, this template is ideal for highlighting user sentiment, service evaluations, or feedback summaries. Perfect for performance reviews, UX reports, or NPS breakdowns. Compatible with PowerPoint, Keynote, and Google Slides.


20 diapositivas
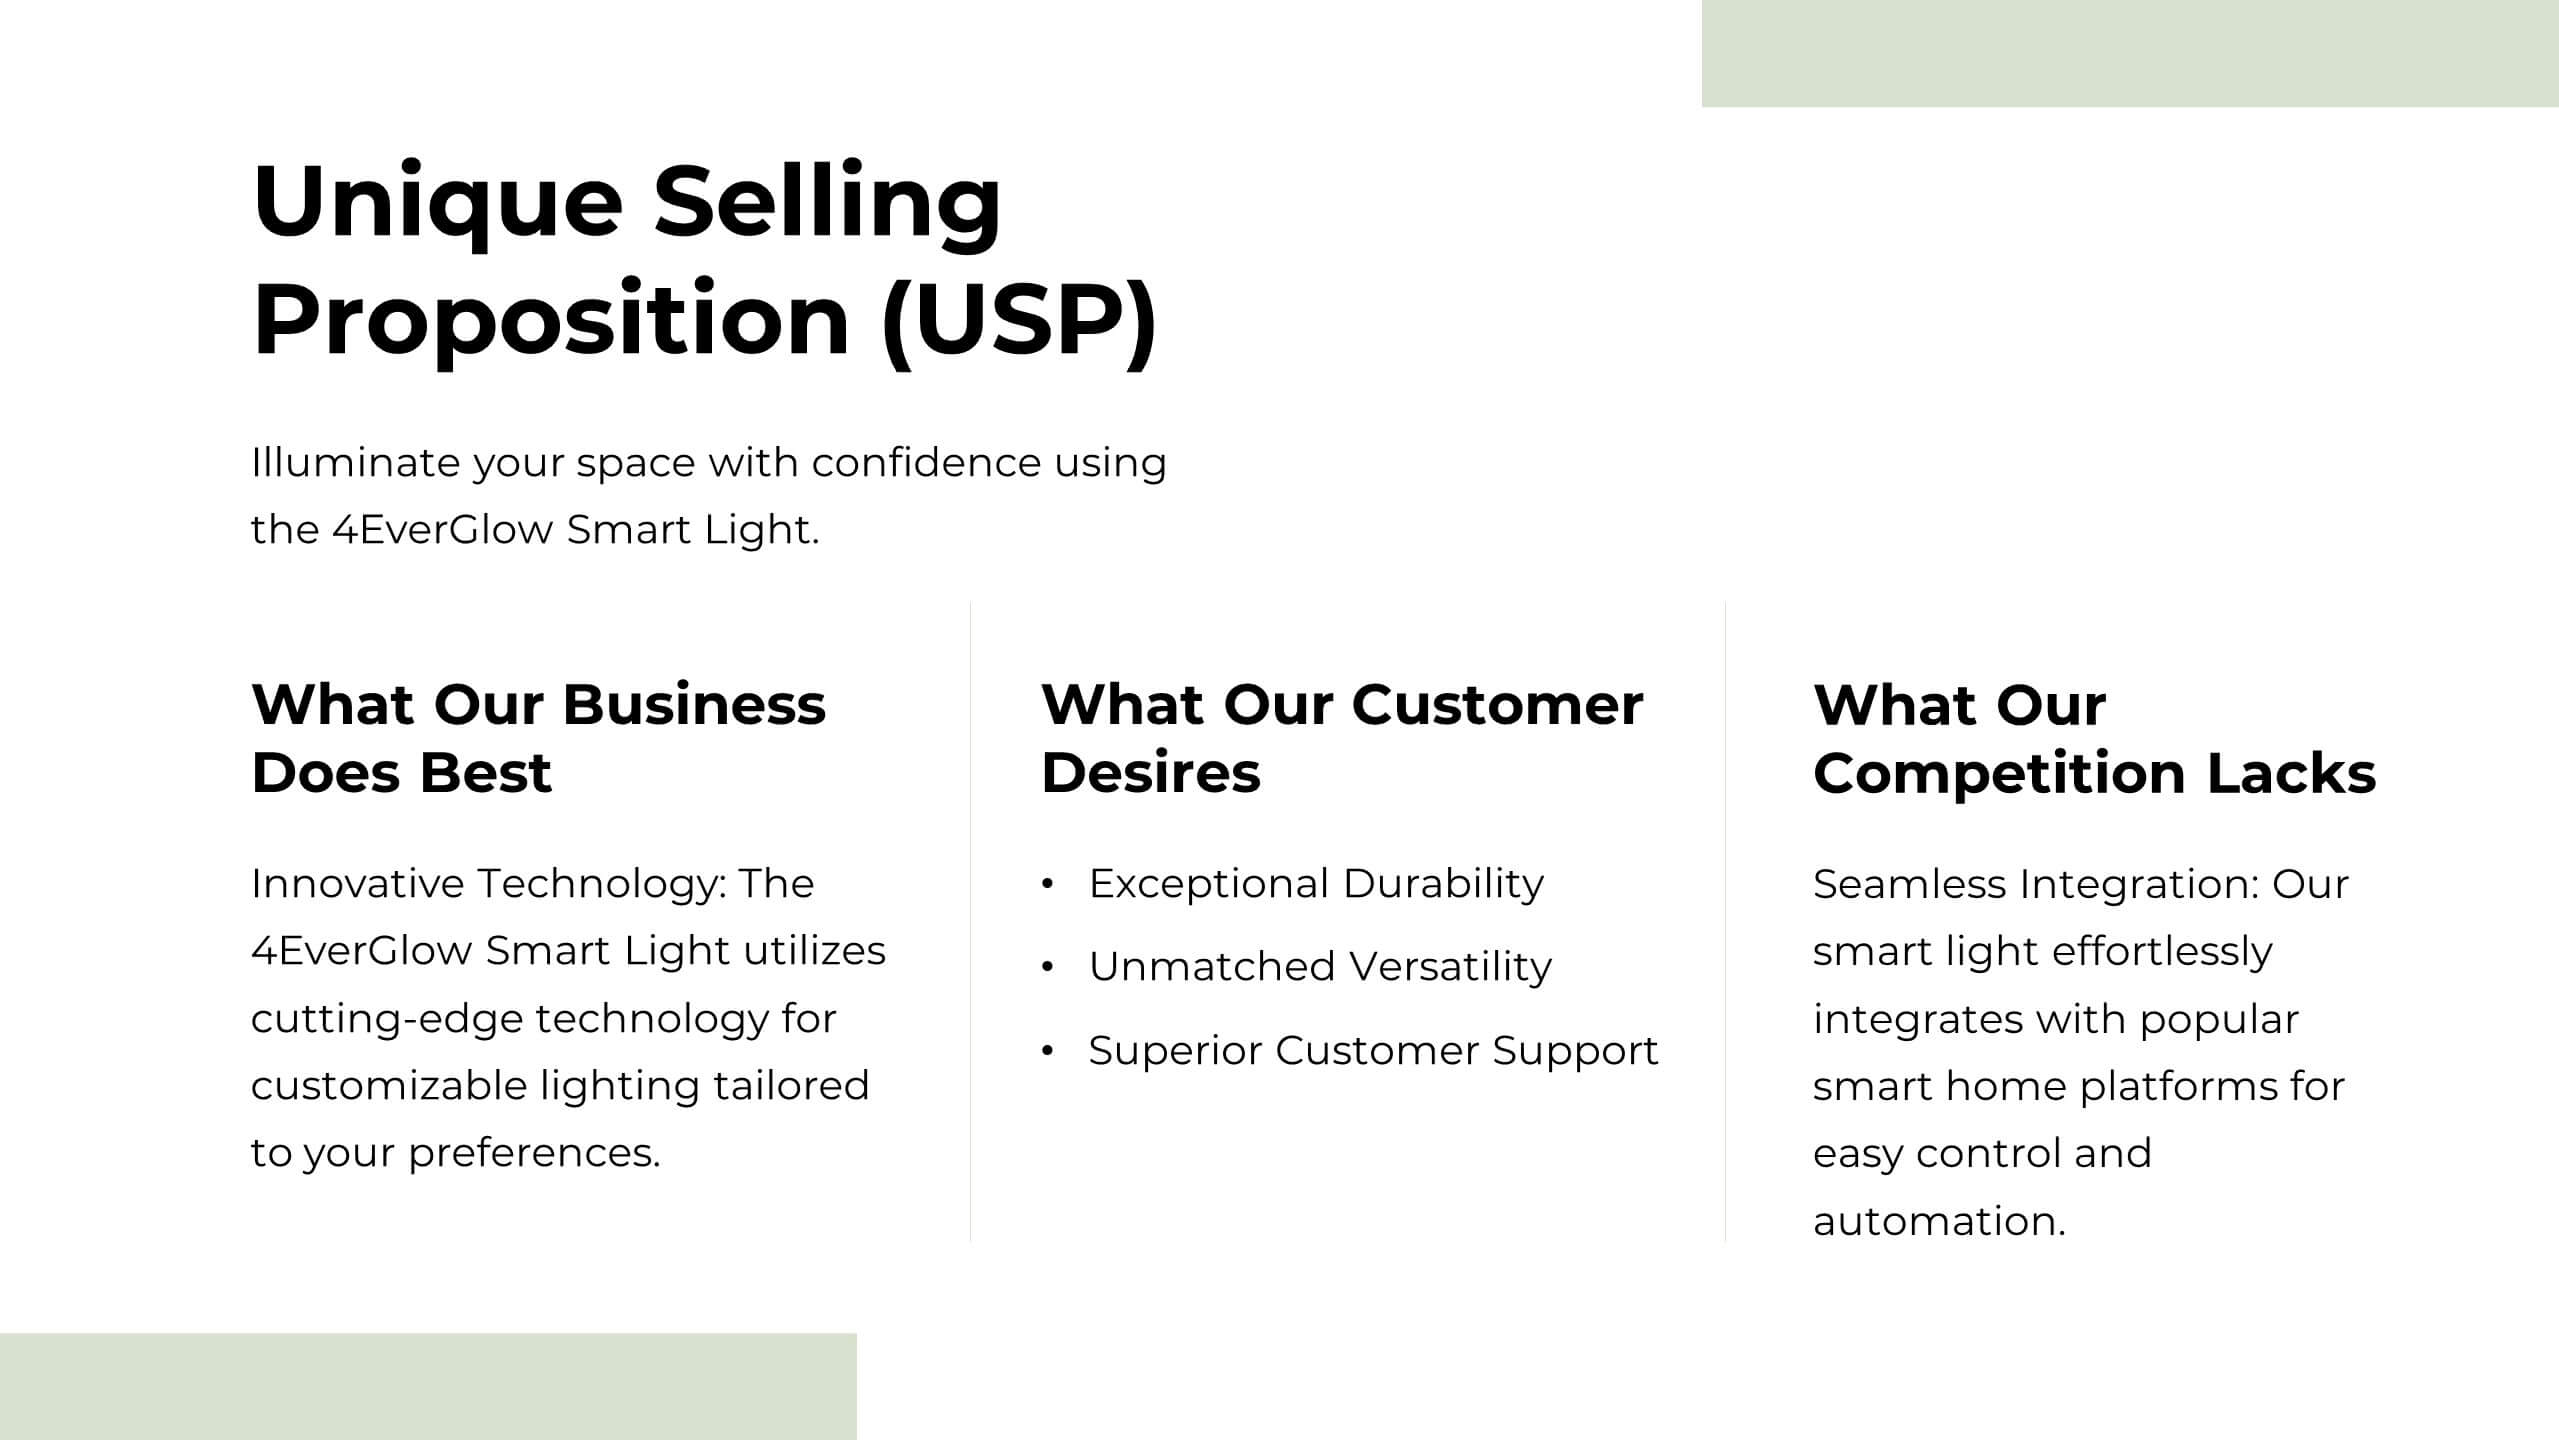
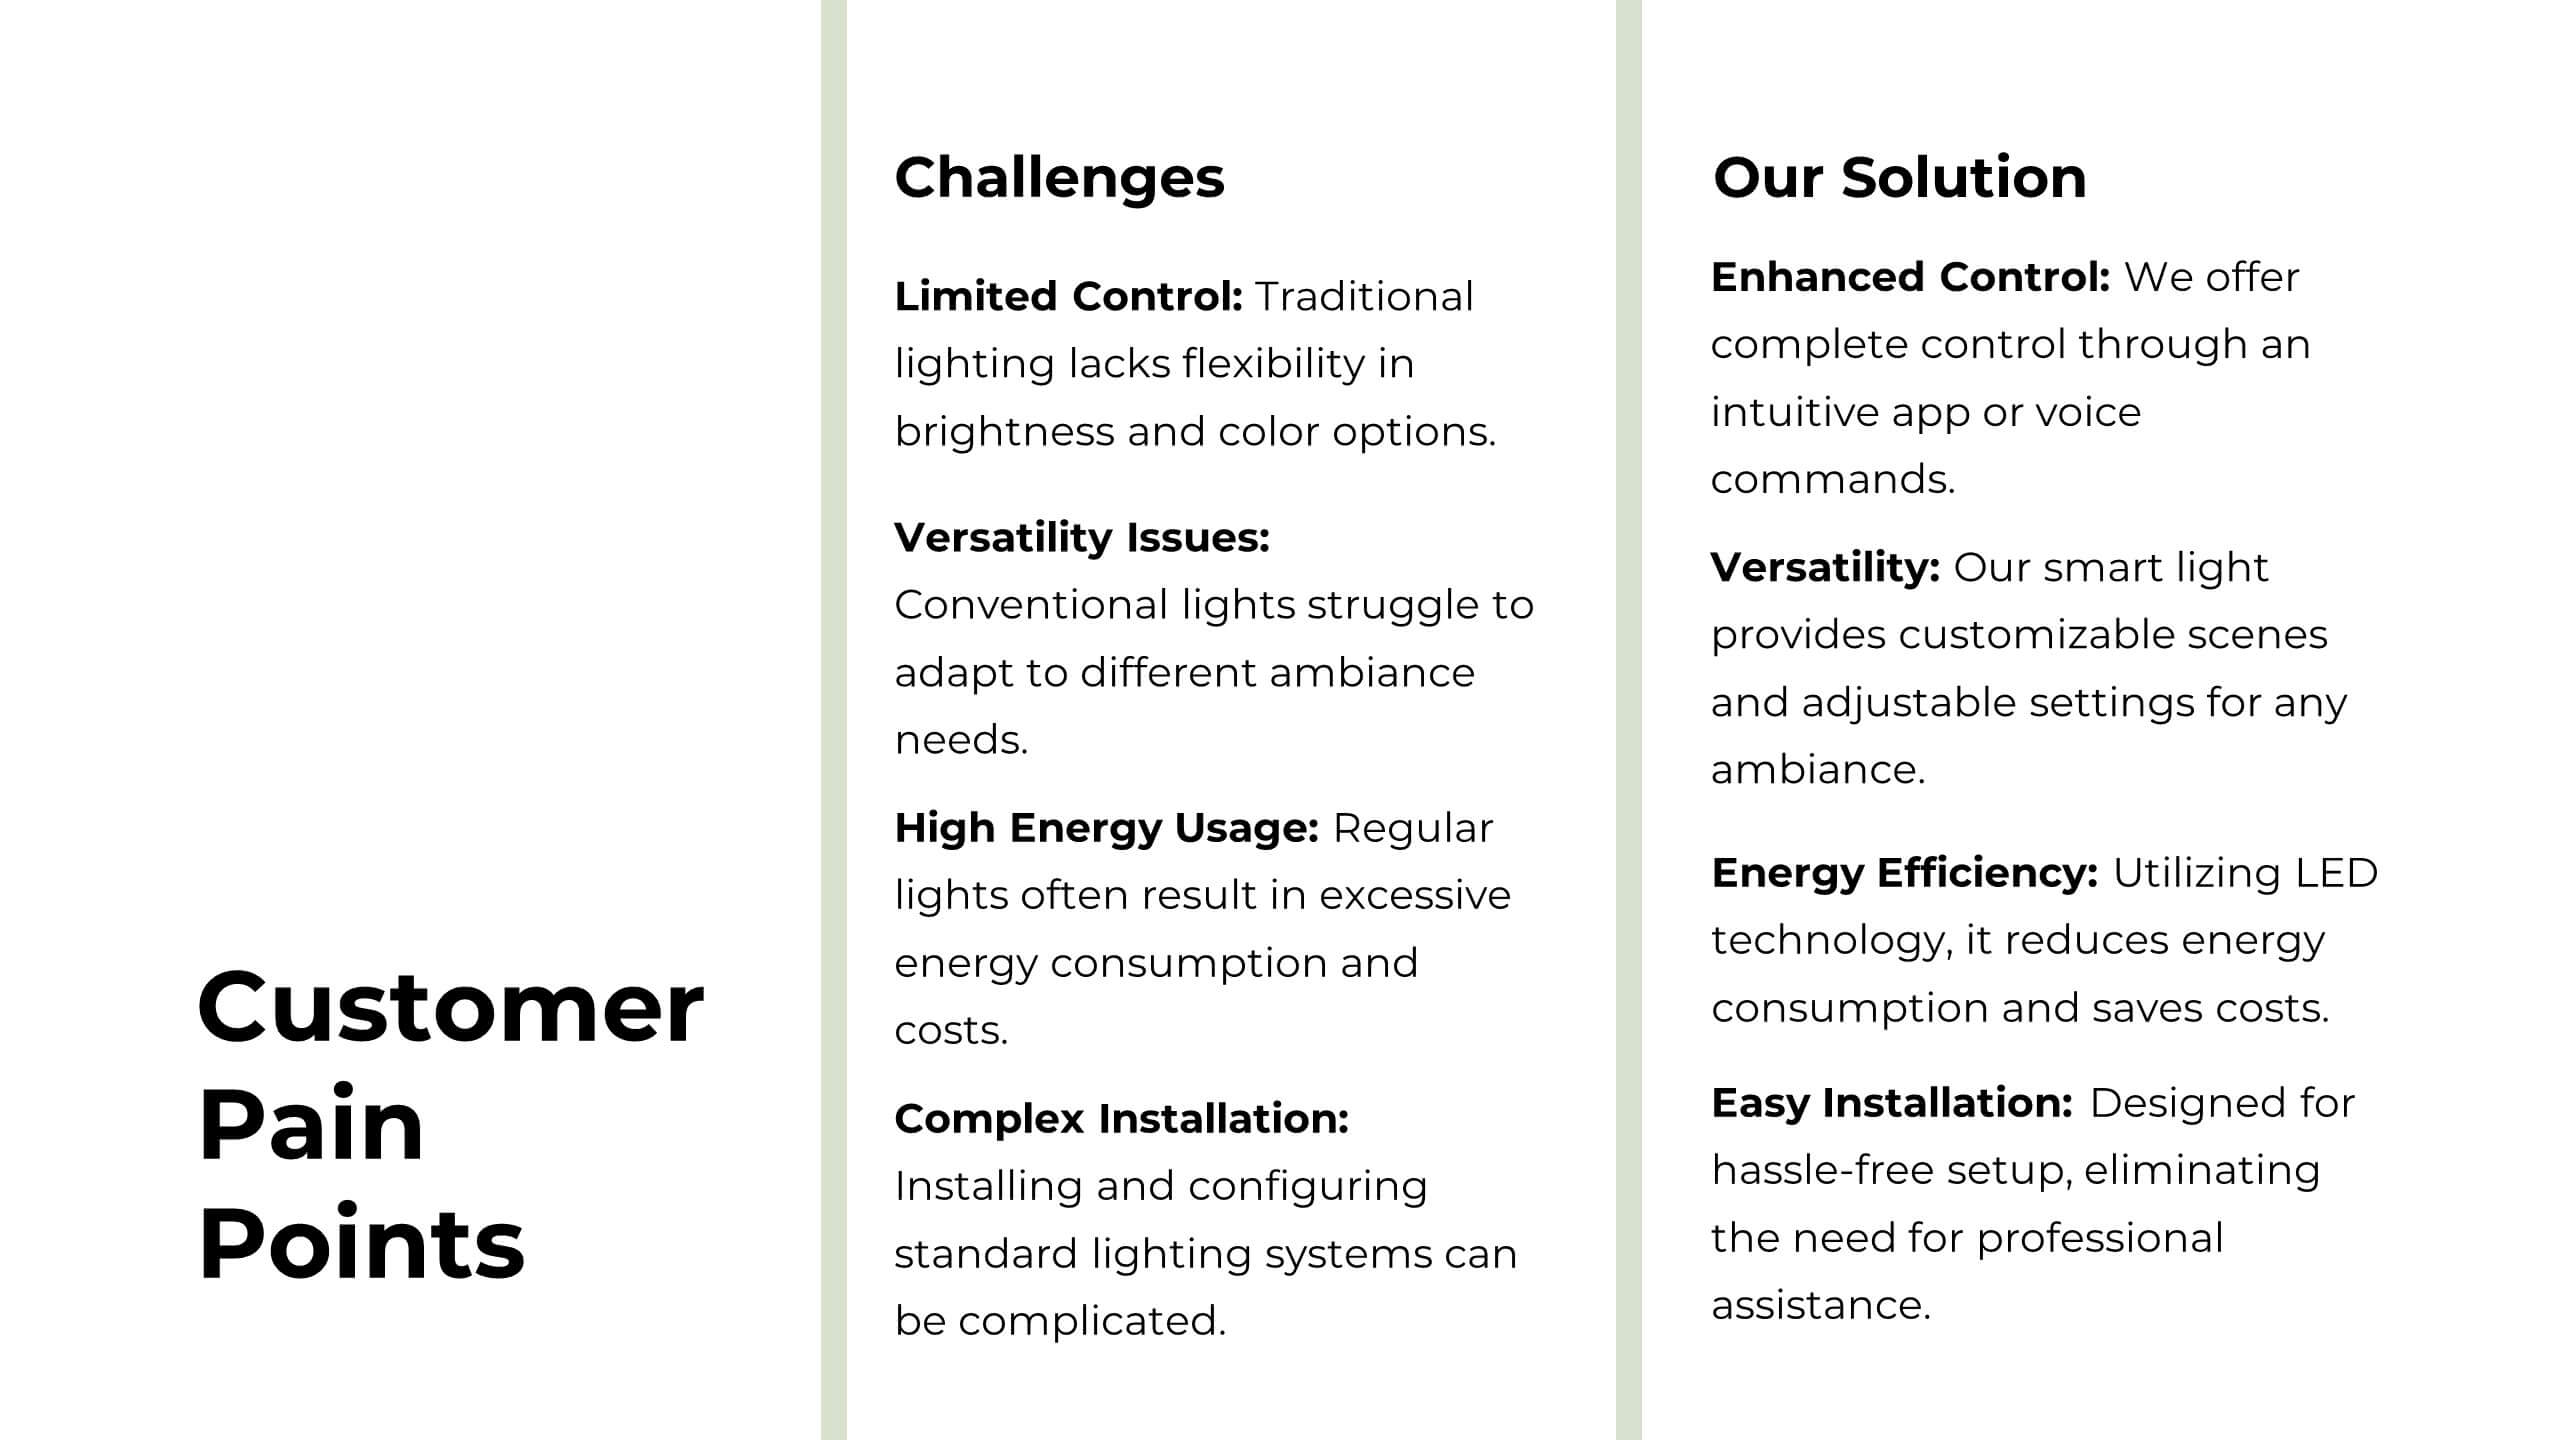
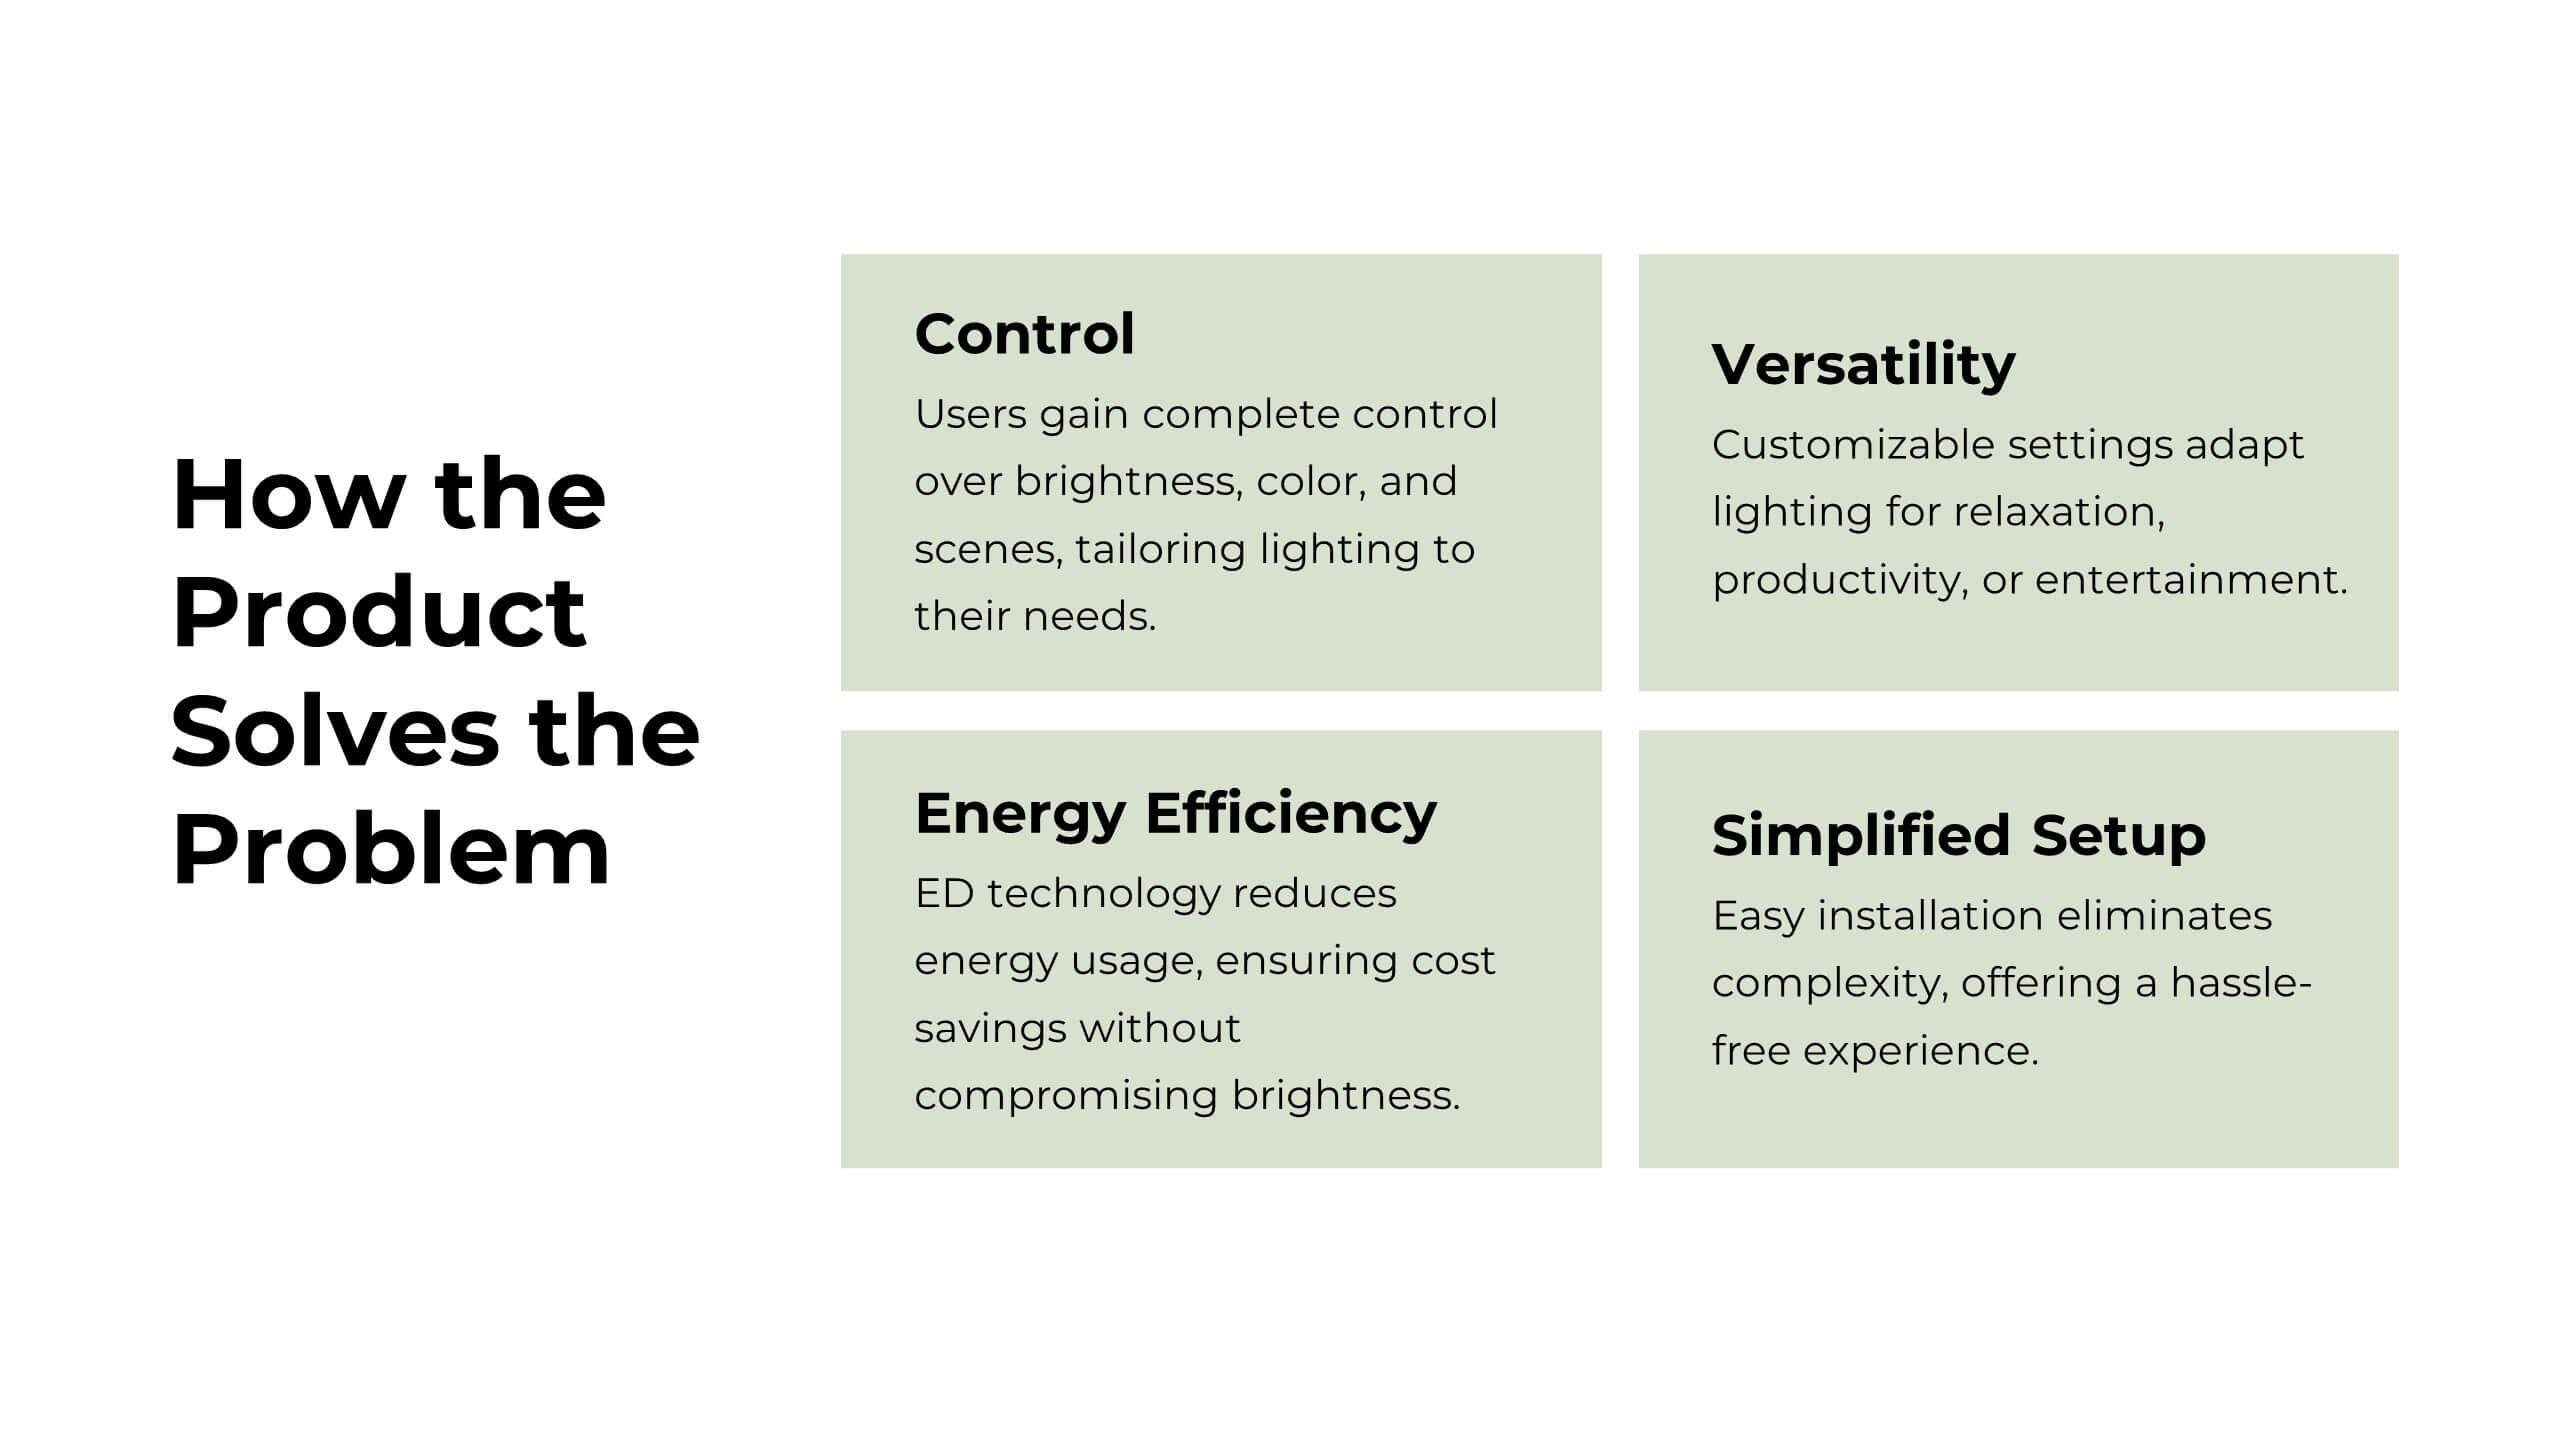
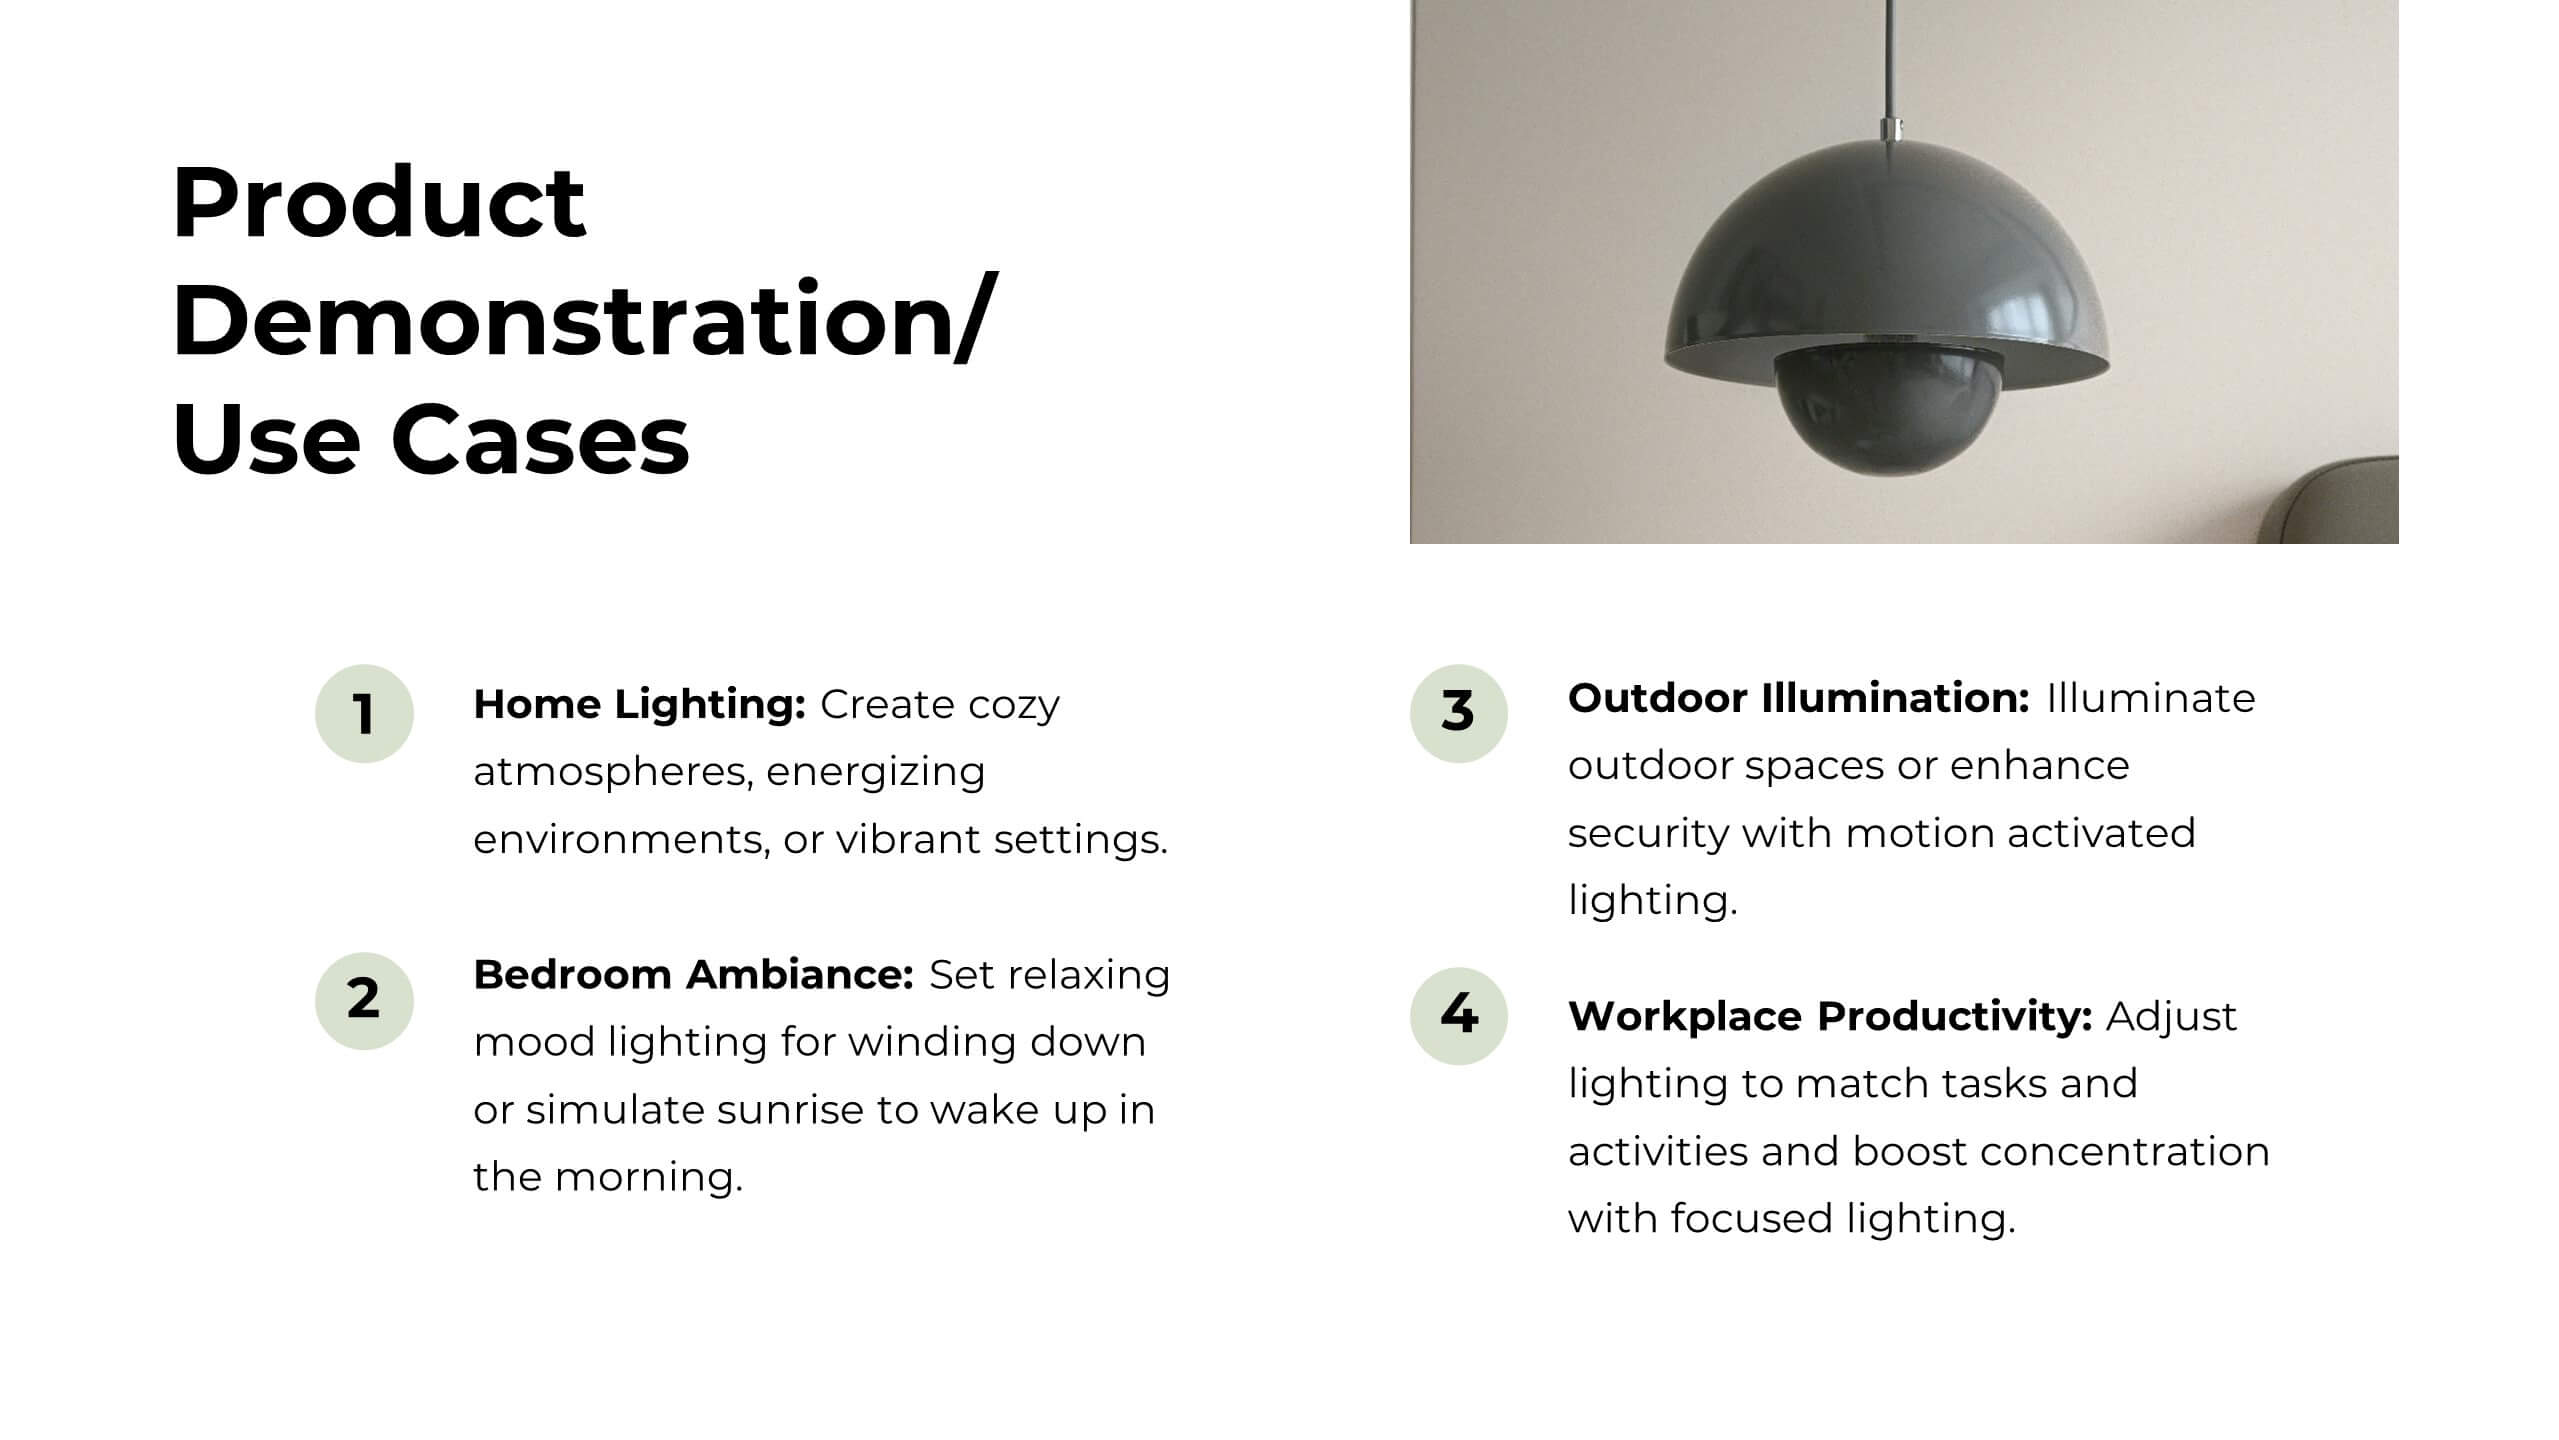
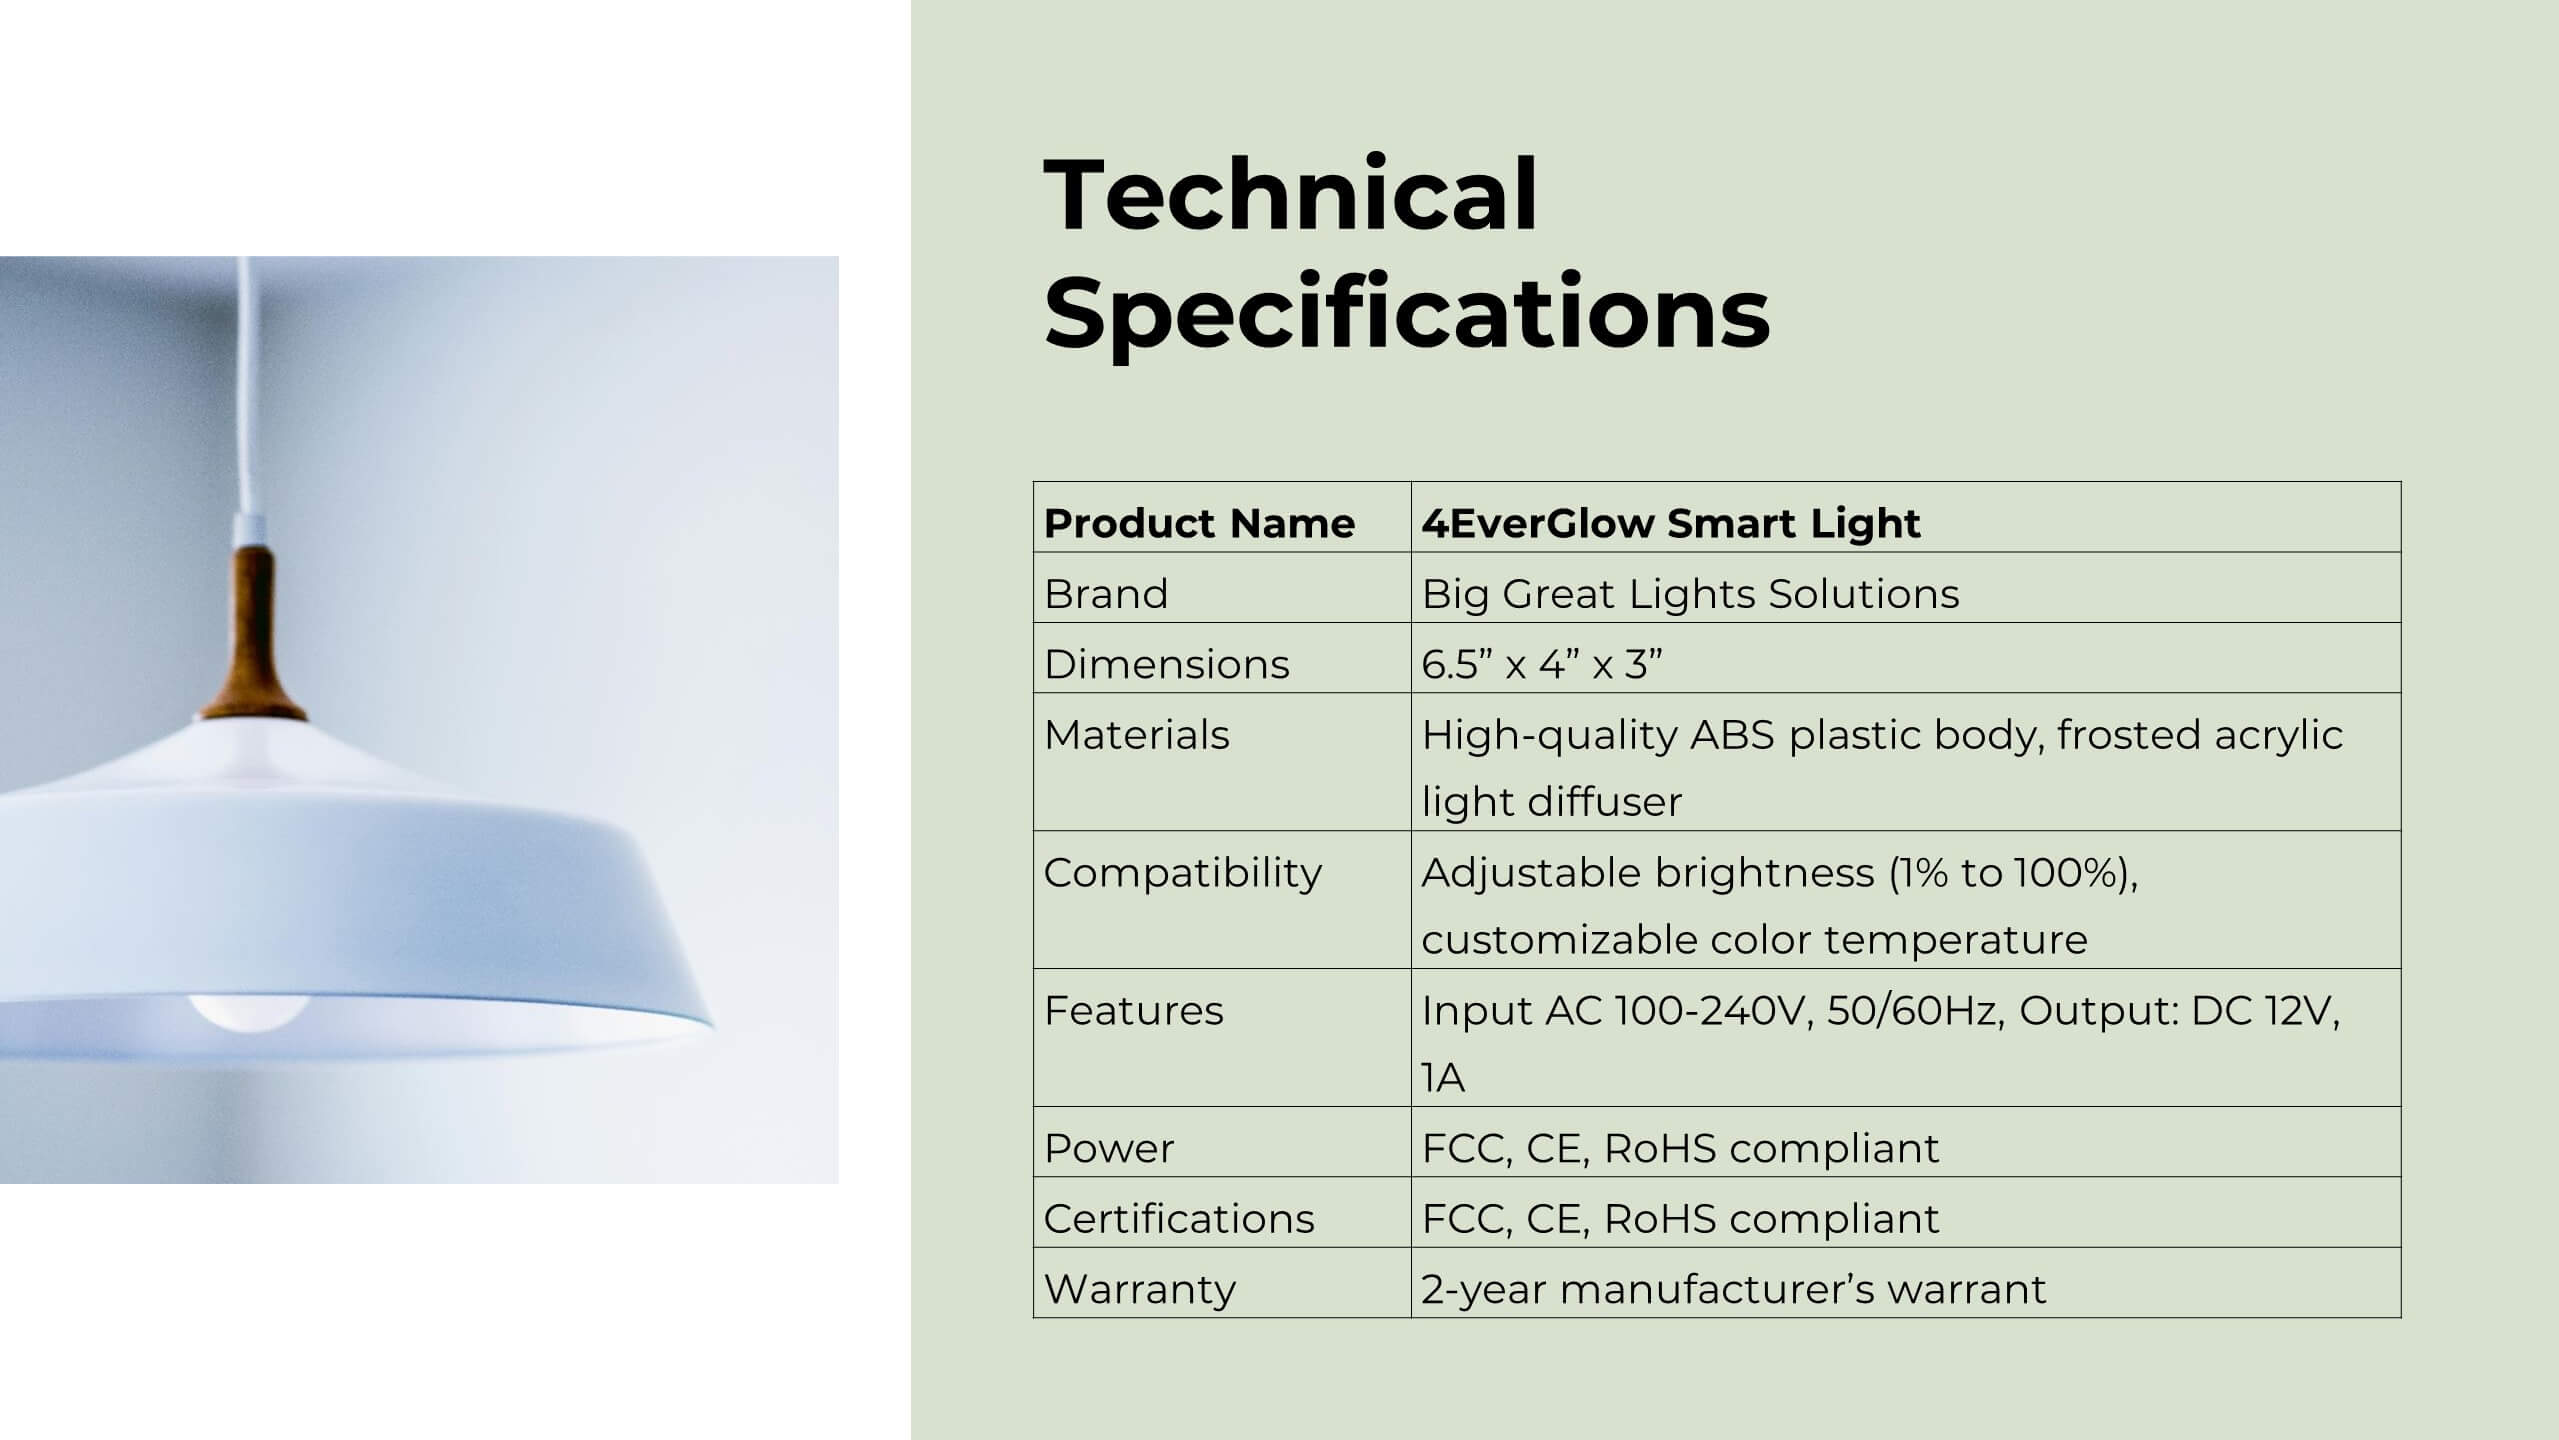
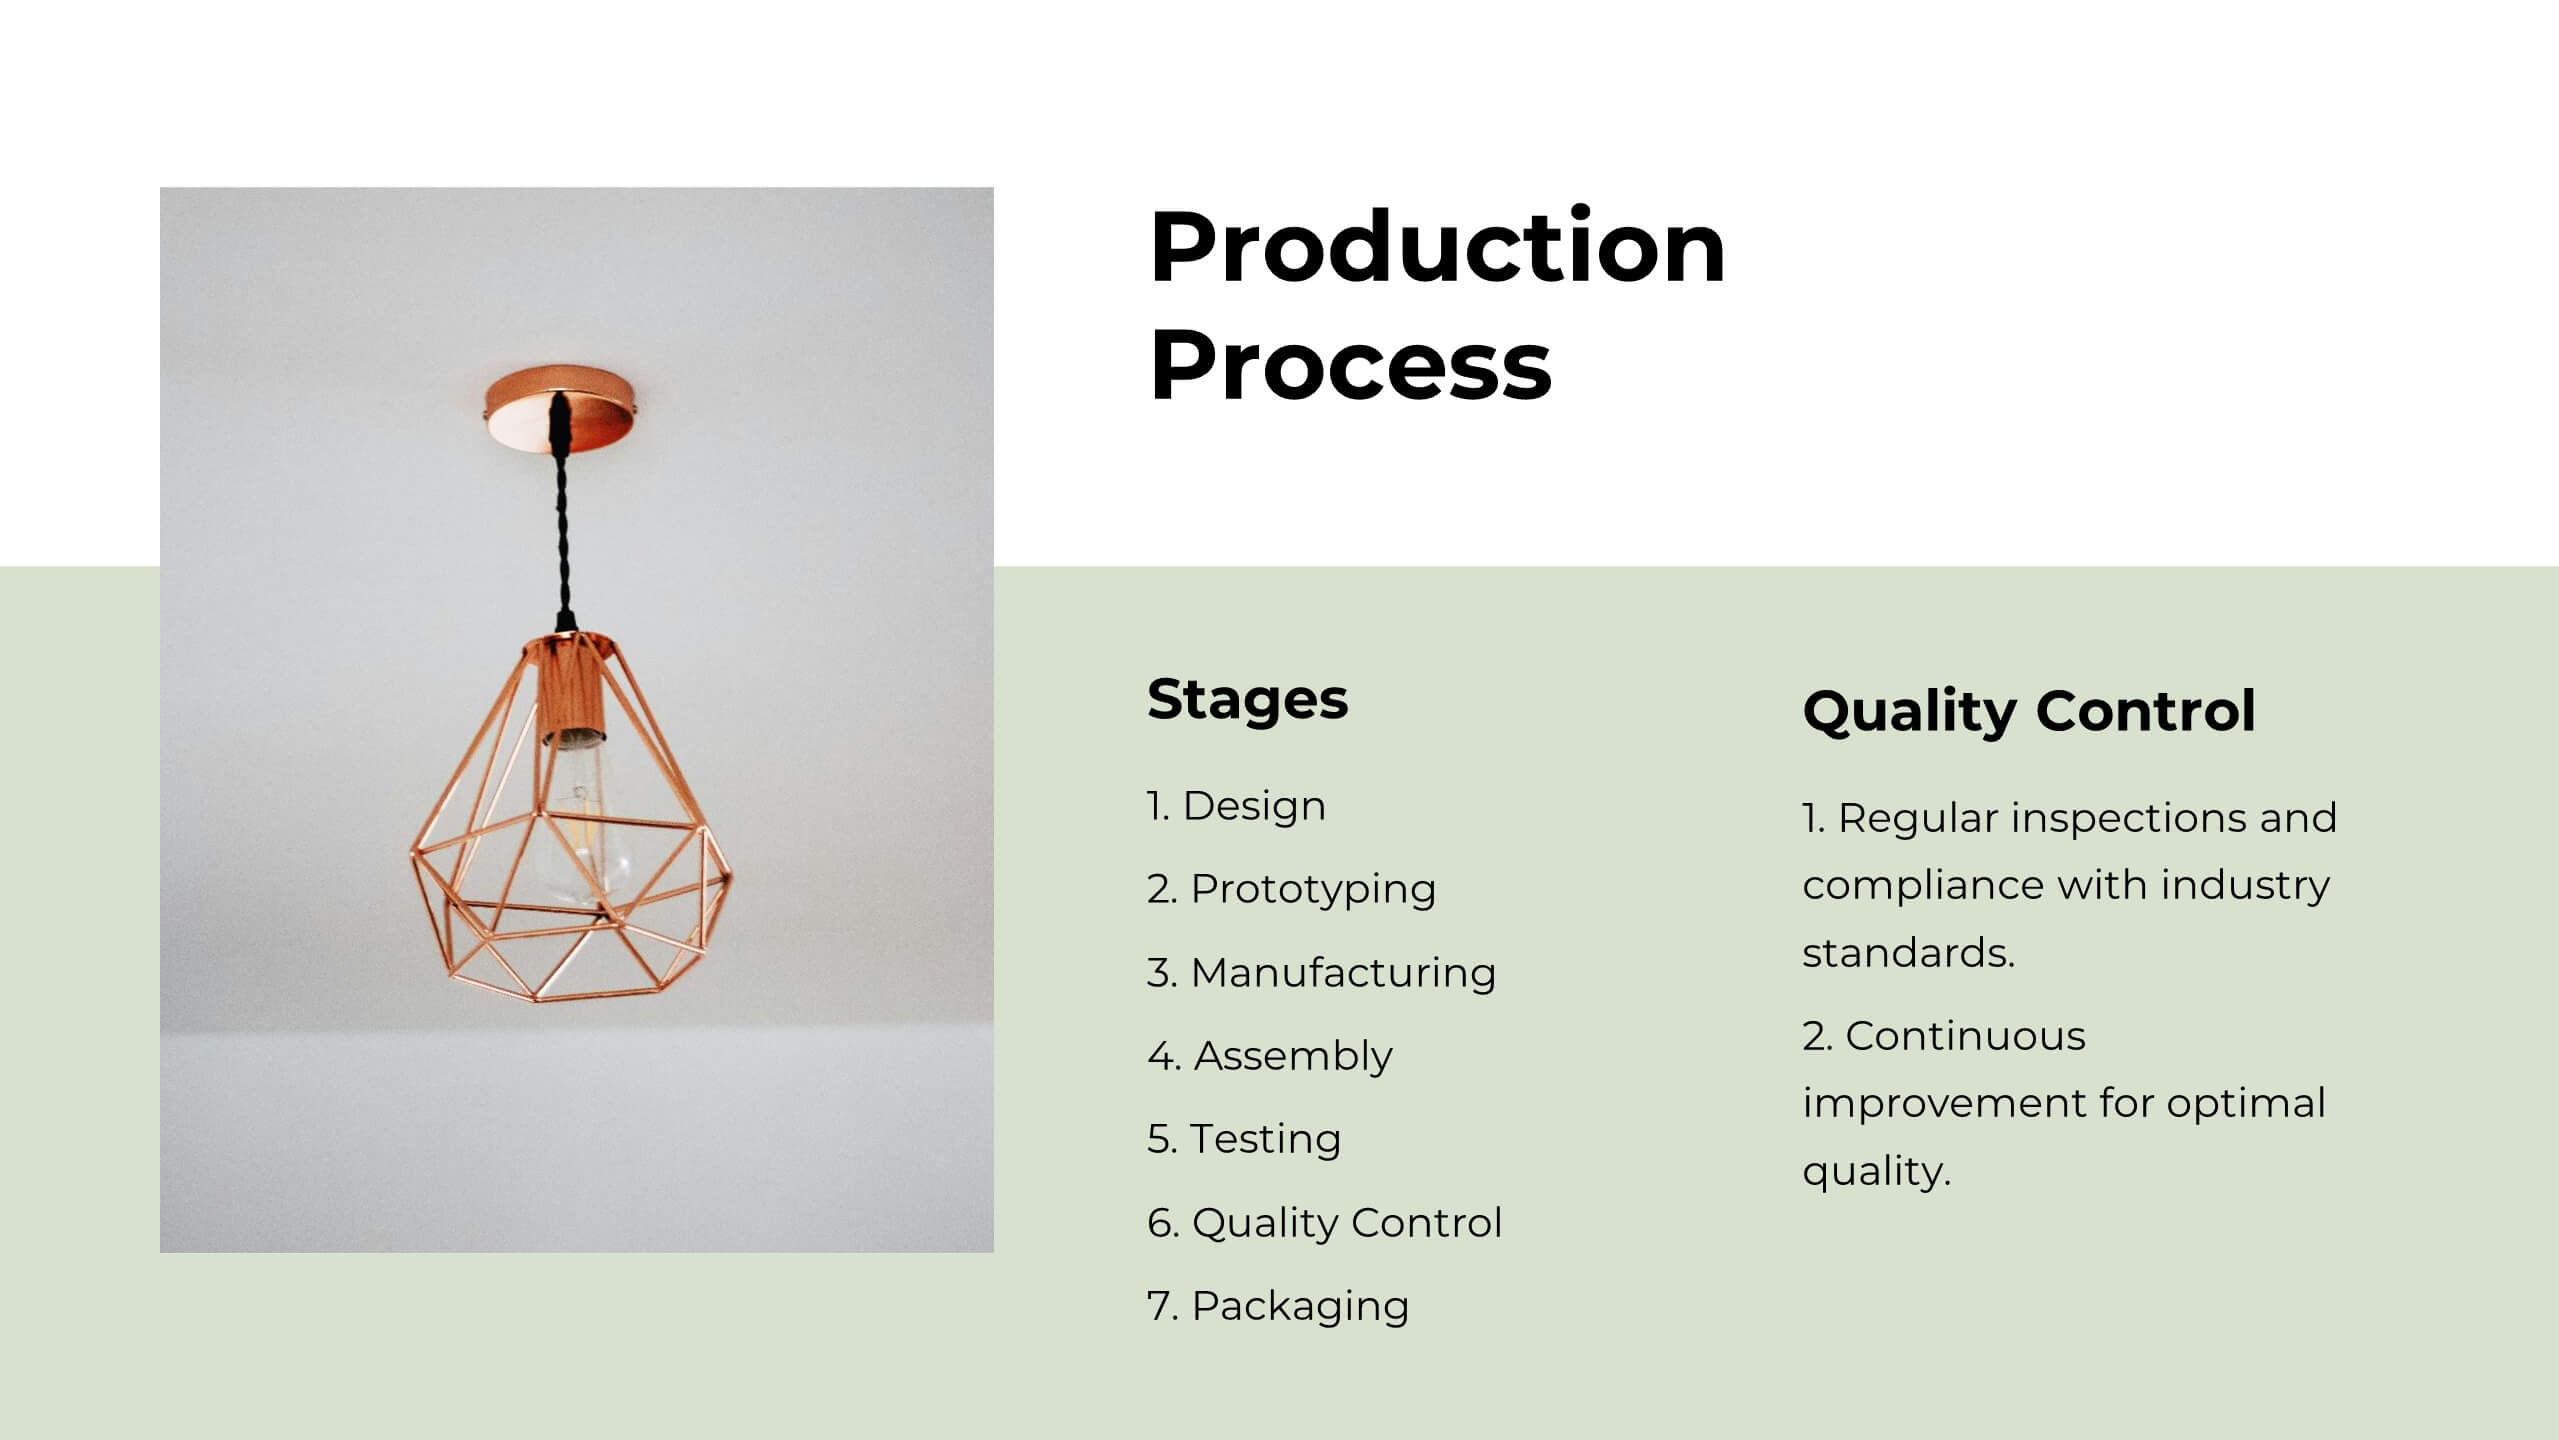
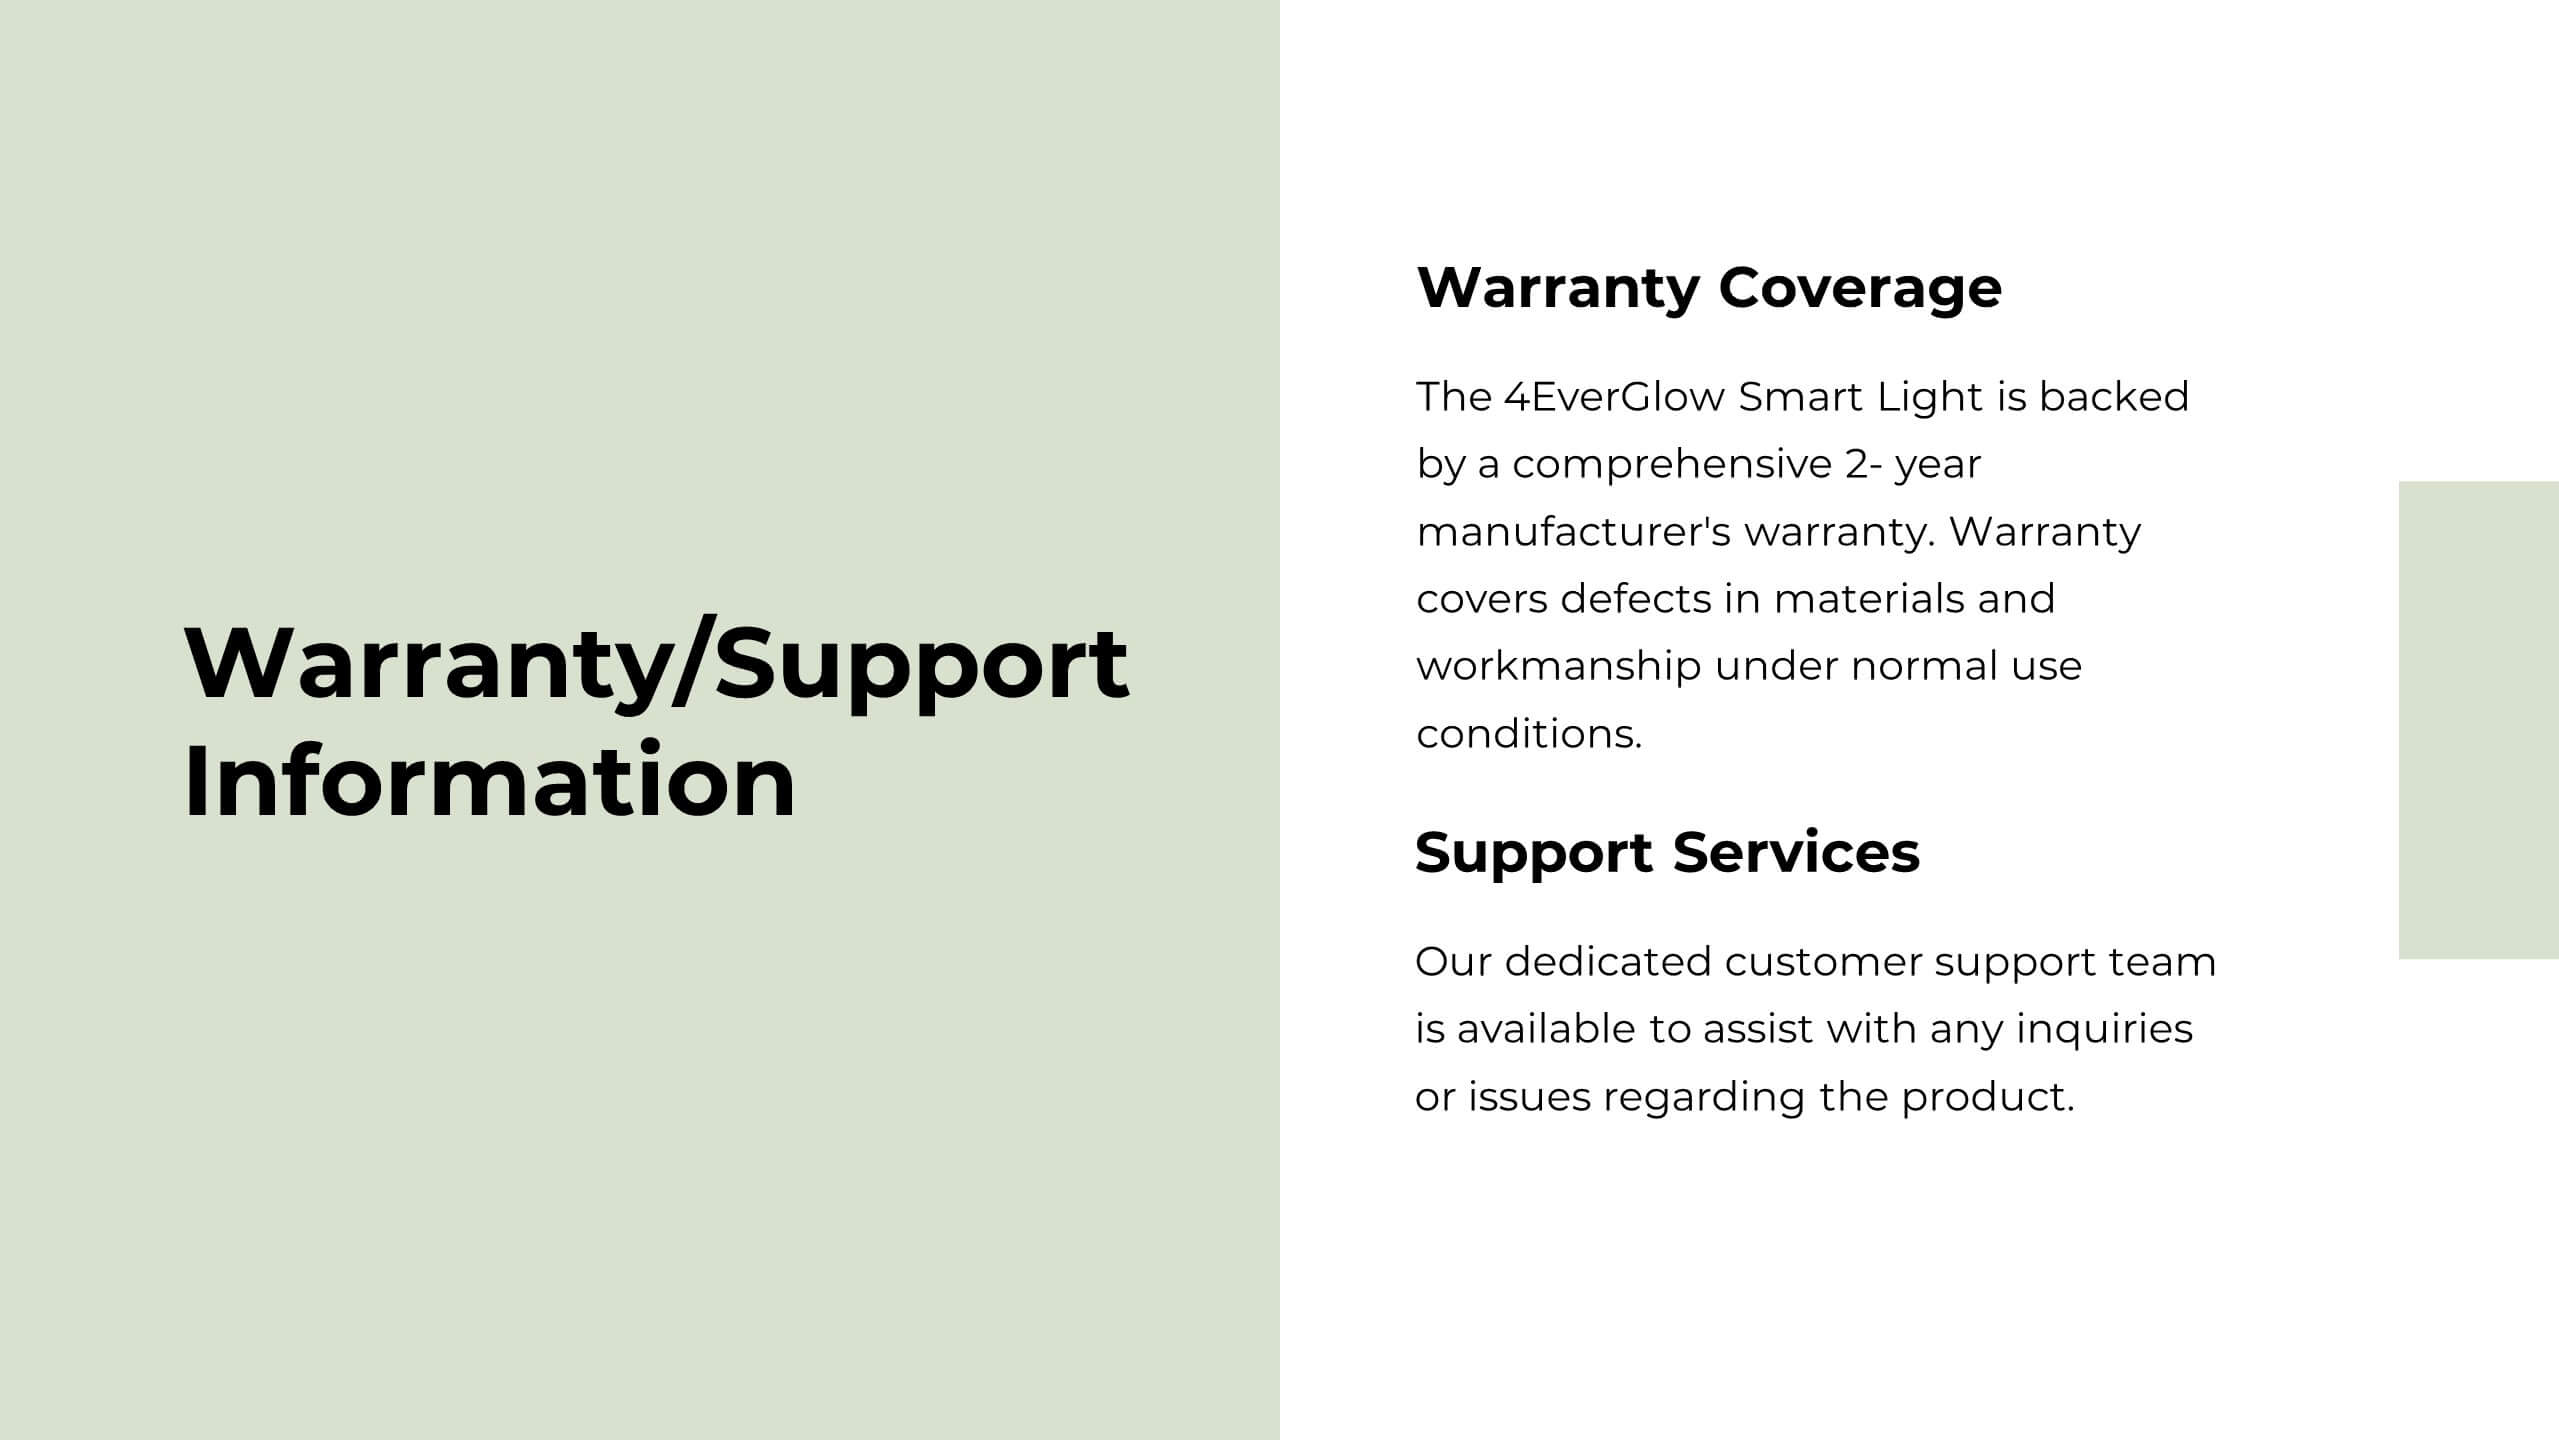
Glint Product Launch Presentation
Develop your product with confidence using this detailed product development plan template! Perfect for outlining features, market analysis, and competitive advantages. Ensure your team's efforts are aligned and maximize the impact of your product launch. Compatible with PowerPoint, Keynote, and Google Slides, it’s your ideal companion for successful product development.


6 diapositivas
Gap Analysis Strategy Infographics
Enhance your understanding of Gap Analysis Strategy with our customizable infographic template. This template is fully compatible with popular presentation software like PowerPoint, Keynote, and Google Slides, allowing you to easily customize it to illustrate and communicate various aspects of gap analysis and its strategic applications. The Gap Analysis Strategy infographic template offers a visually engaging platform to explain the principles, process, and benefits of conducting gap analysis within an organization. Whether you're a business strategist, analyst, or manager, this template provides a user-friendly canvas to create informative presentations and educational materials. Optimize your strategic planning and decision-making with this SEO-optimized Gap Analysis Strategy infographic template, thoughtfully designed for clarity and ease of use. Customize it to showcase the steps involved in gap analysis, the identification of performance gaps, and strategies for closing those gaps, ensuring that your audience gains valuable insights into this crucial tool for organizational improvement. Start crafting your personalized infographic today to excel in Gap Analysis Strategy.


20 diapositivas
Lullabyne Design Portfolio Presentation
Showcase your creative work with this modern and professional design portfolio presentation. Covering essential elements like design briefs, mood boards, prototypes, and implementation plans, this template helps you present your work with clarity and style. Fully customizable and available for PowerPoint, Keynote, and Google Slides.


22 diapositivas
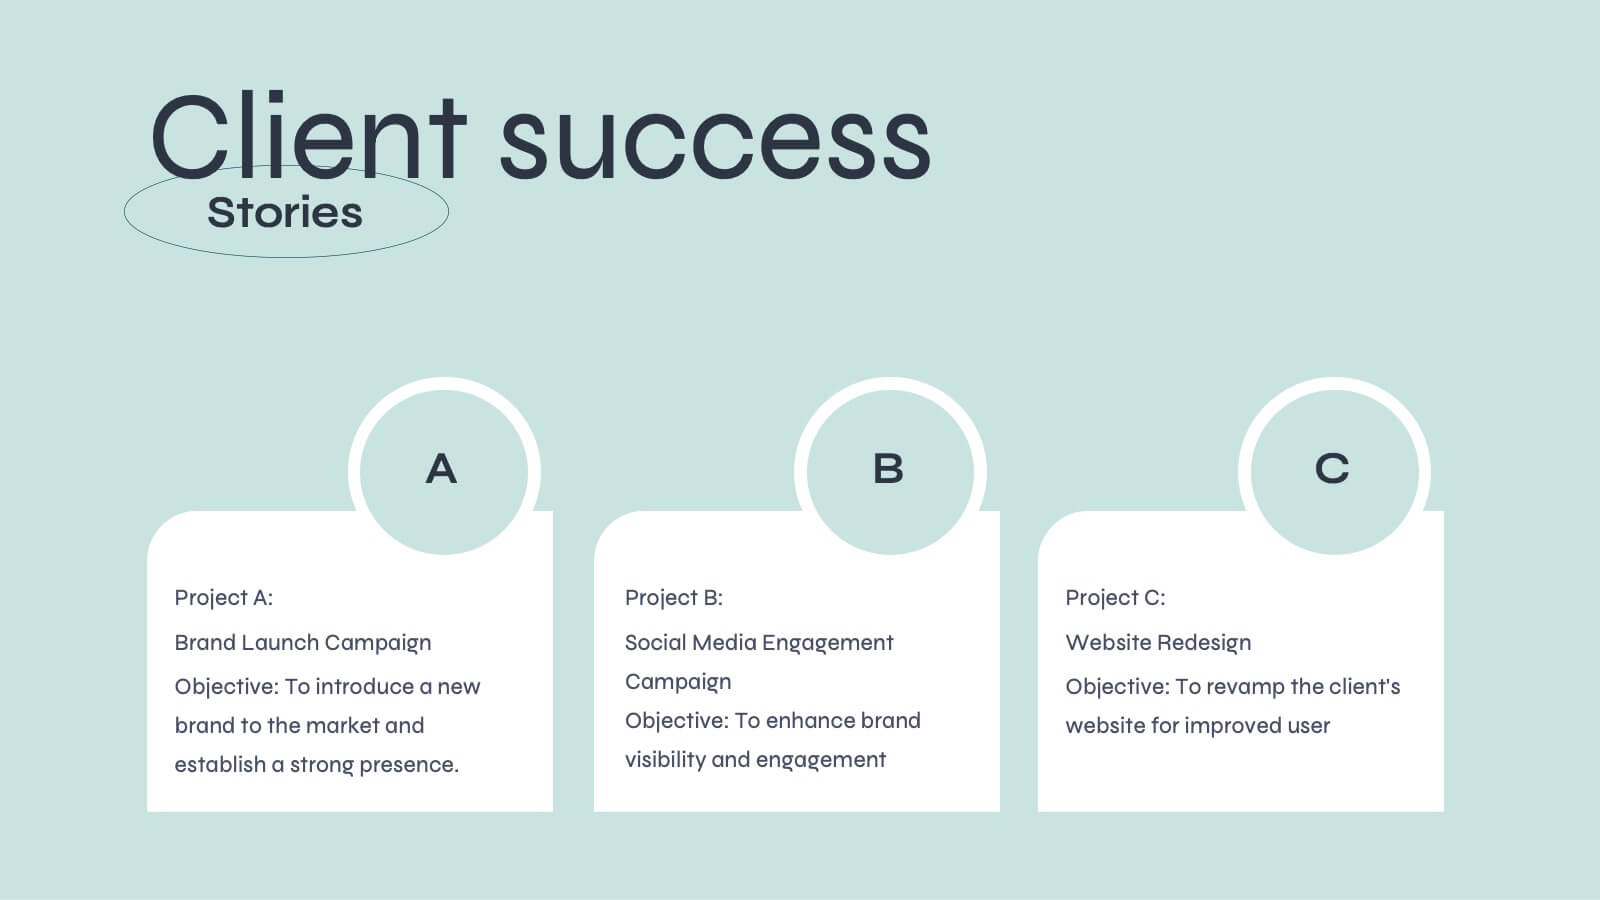
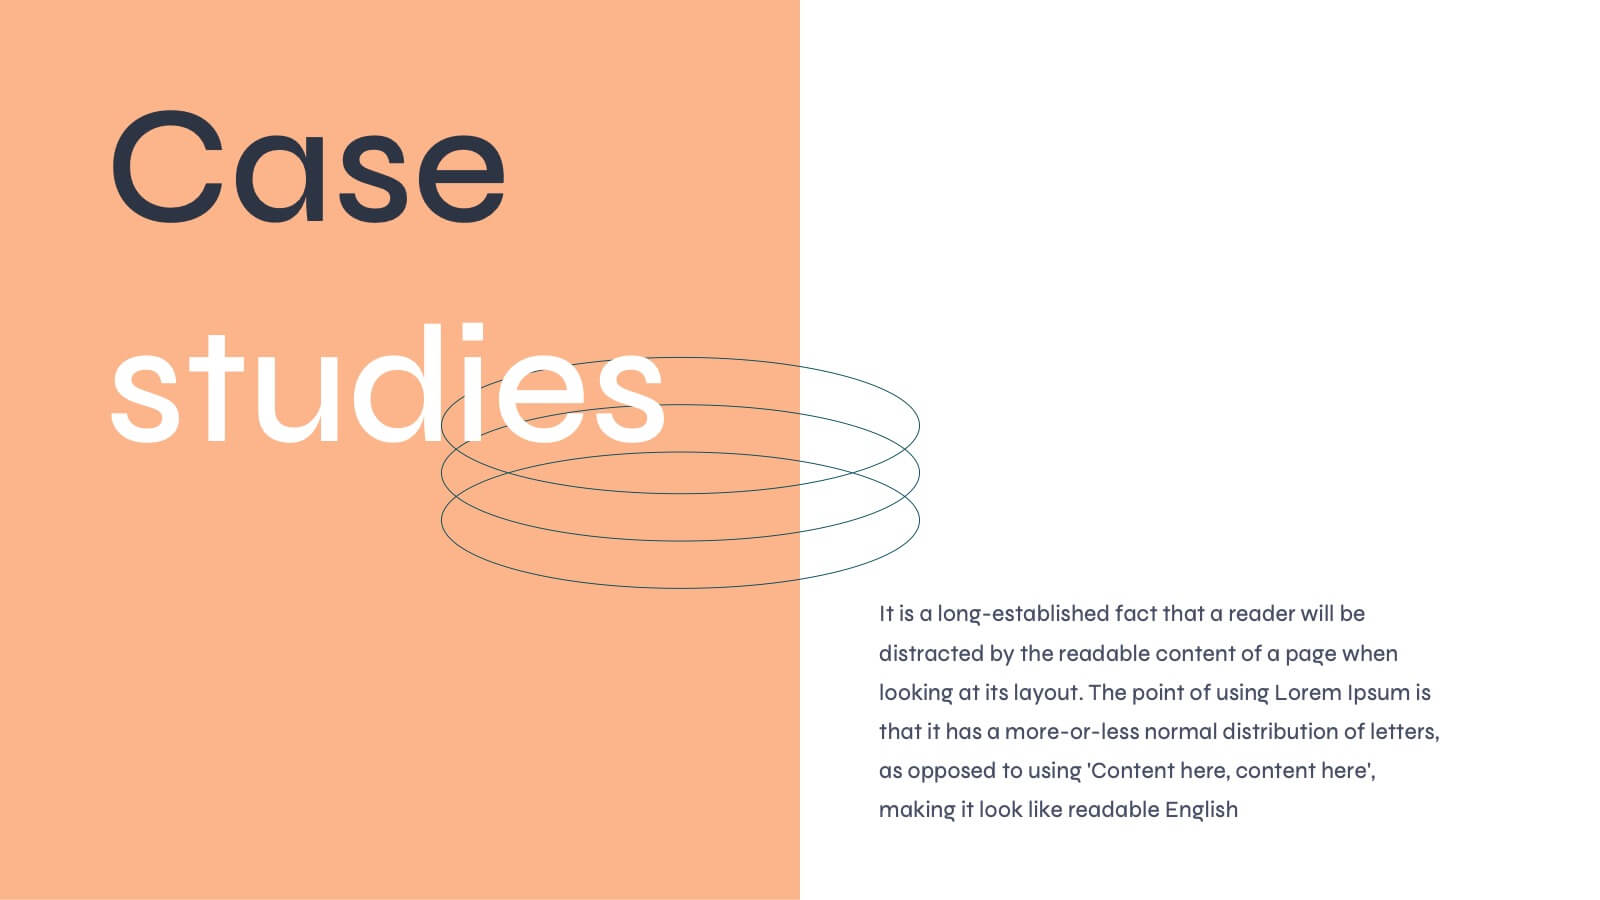
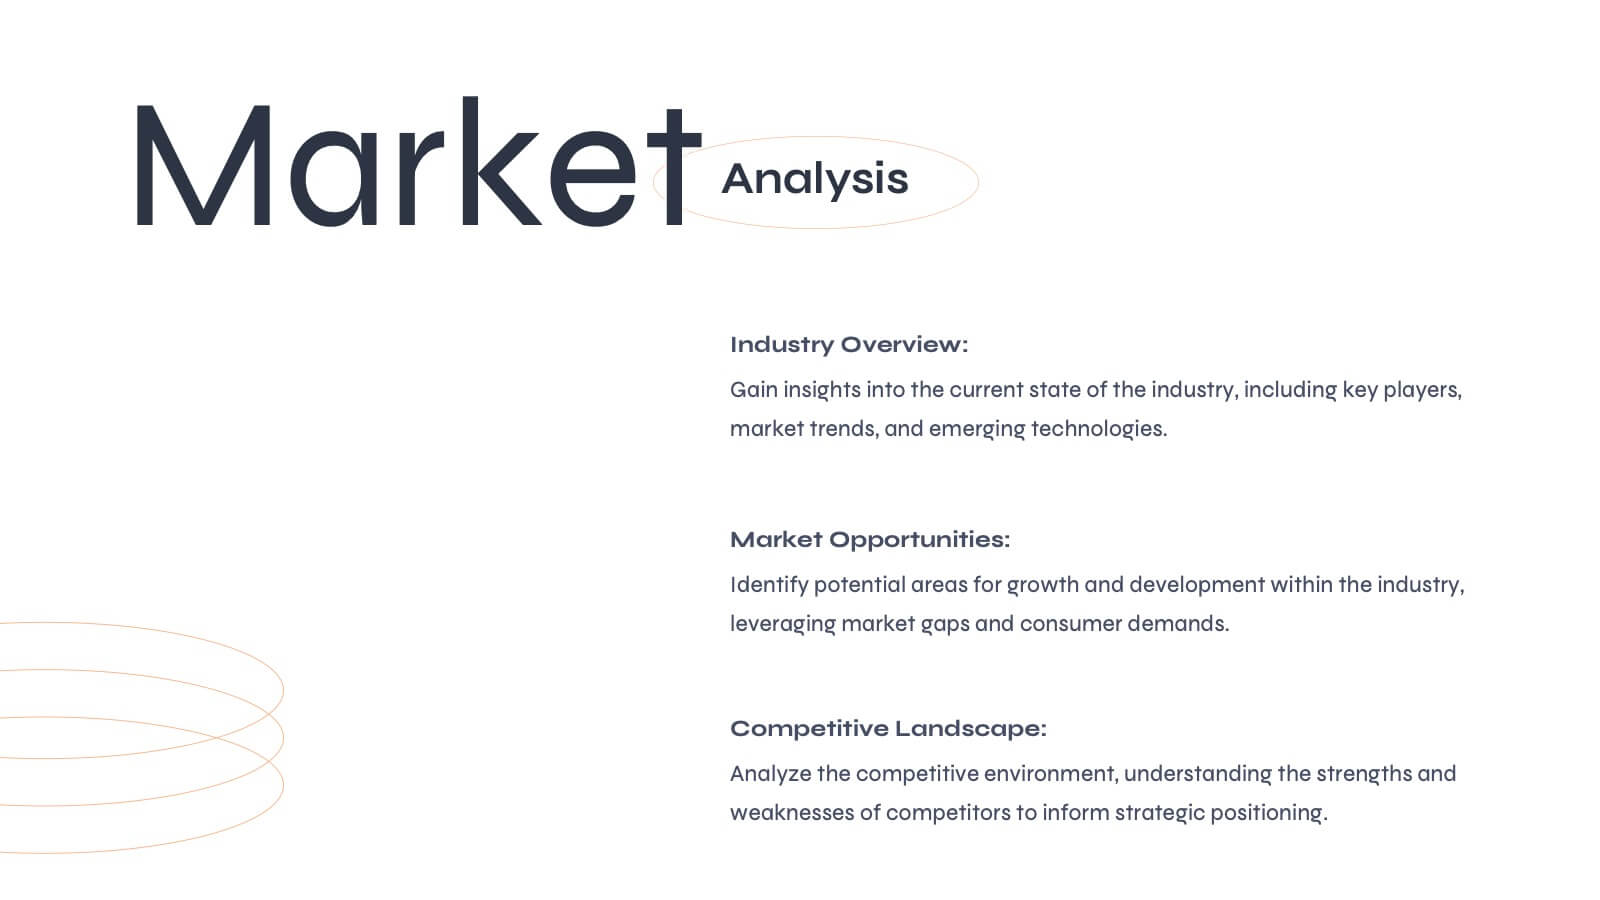
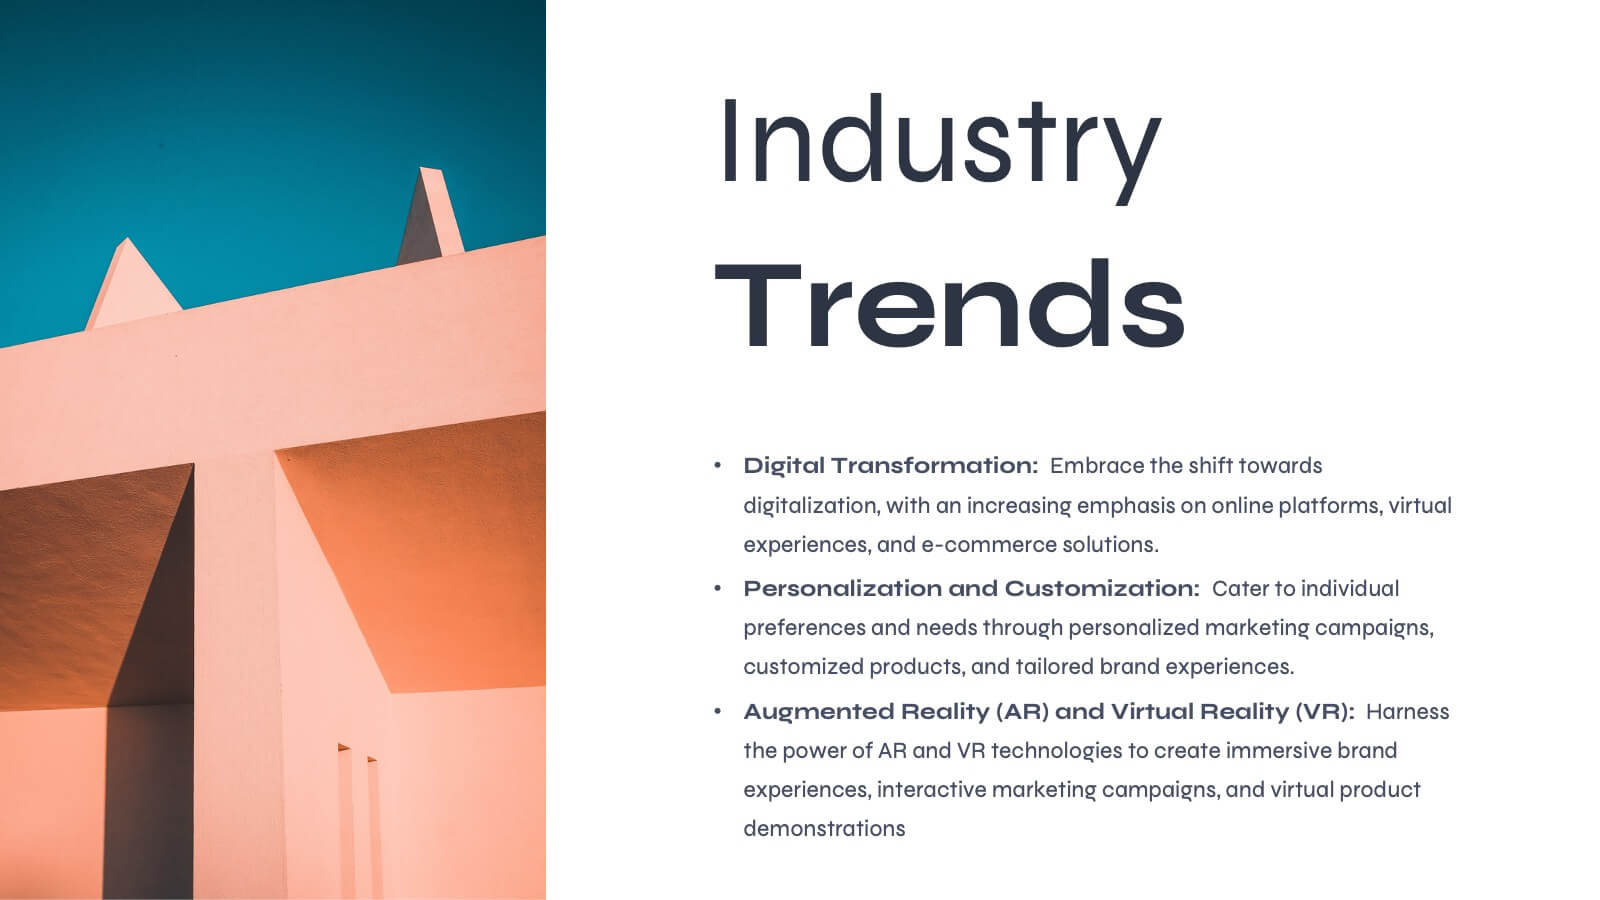
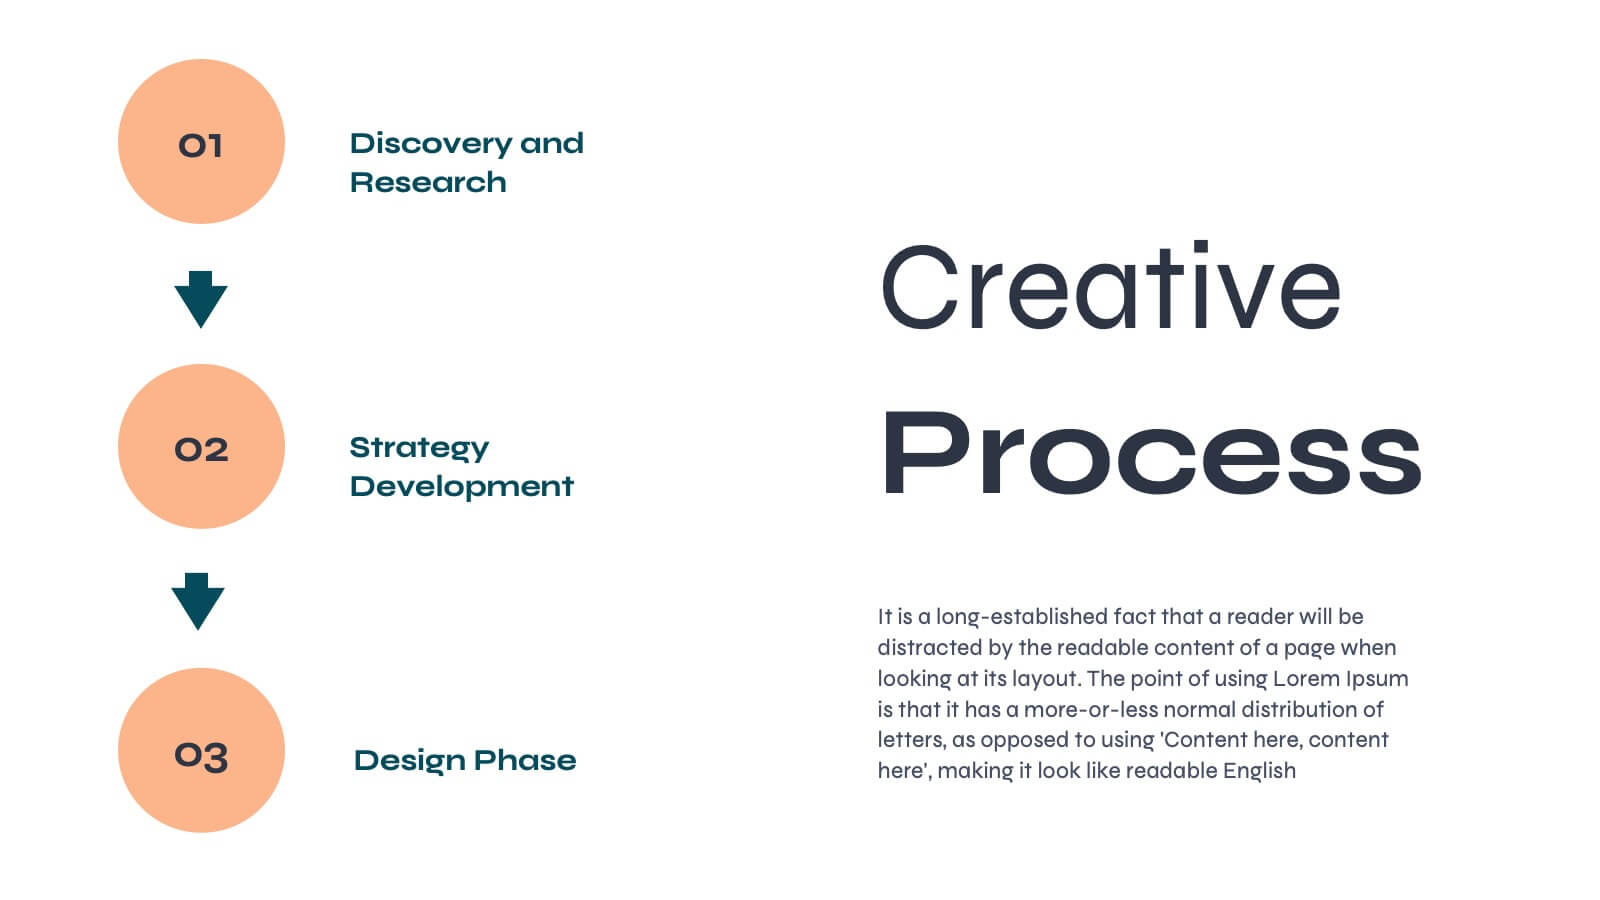
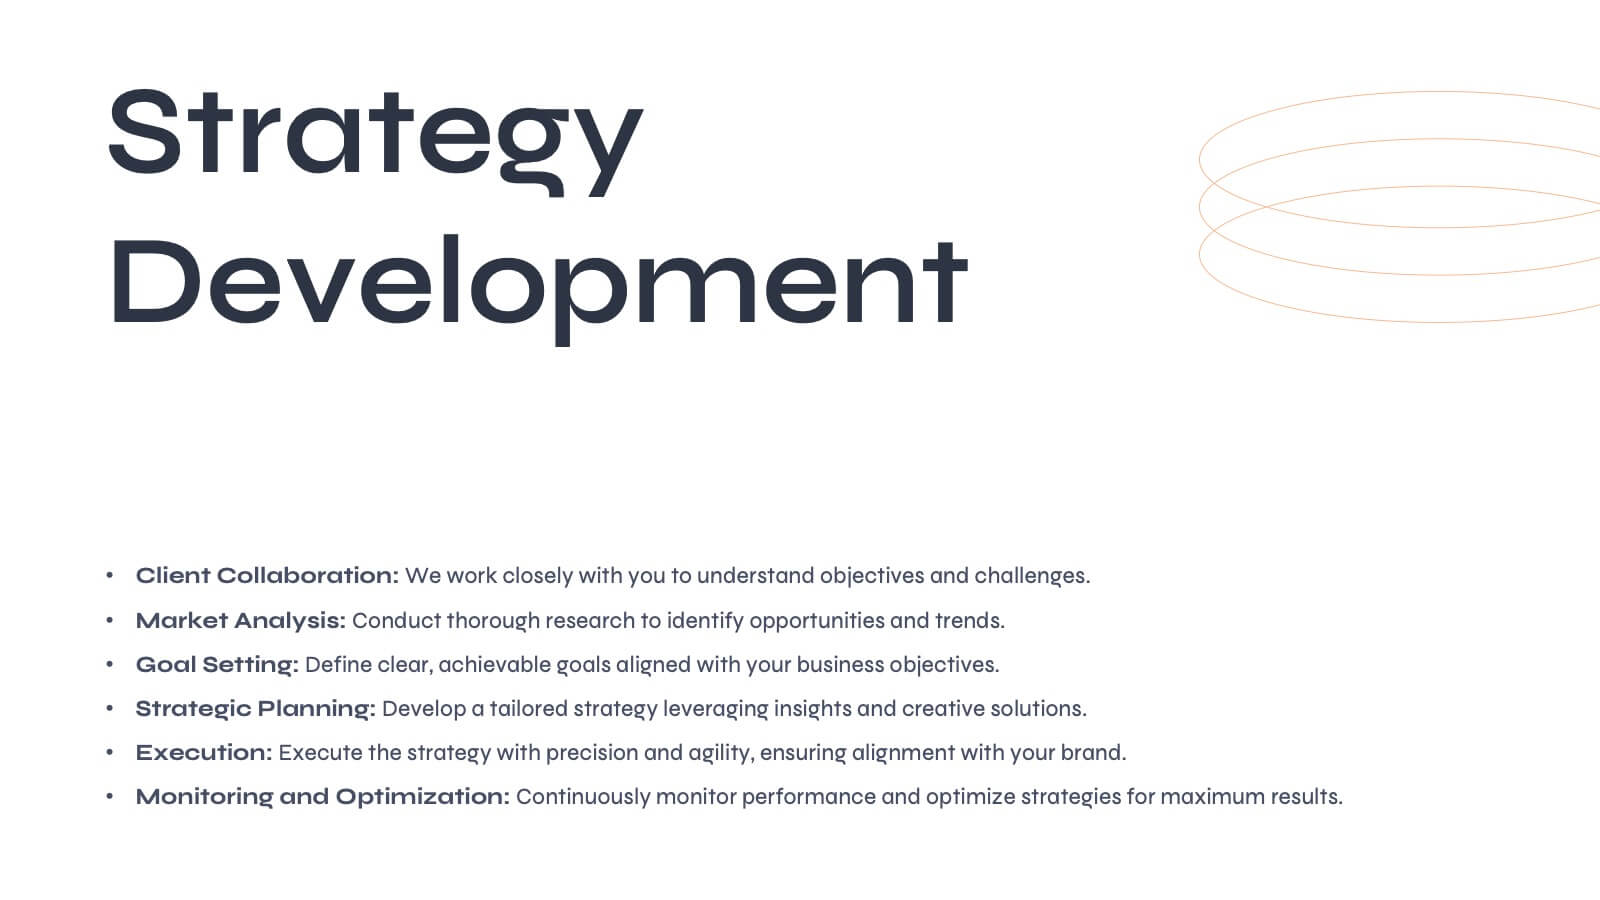
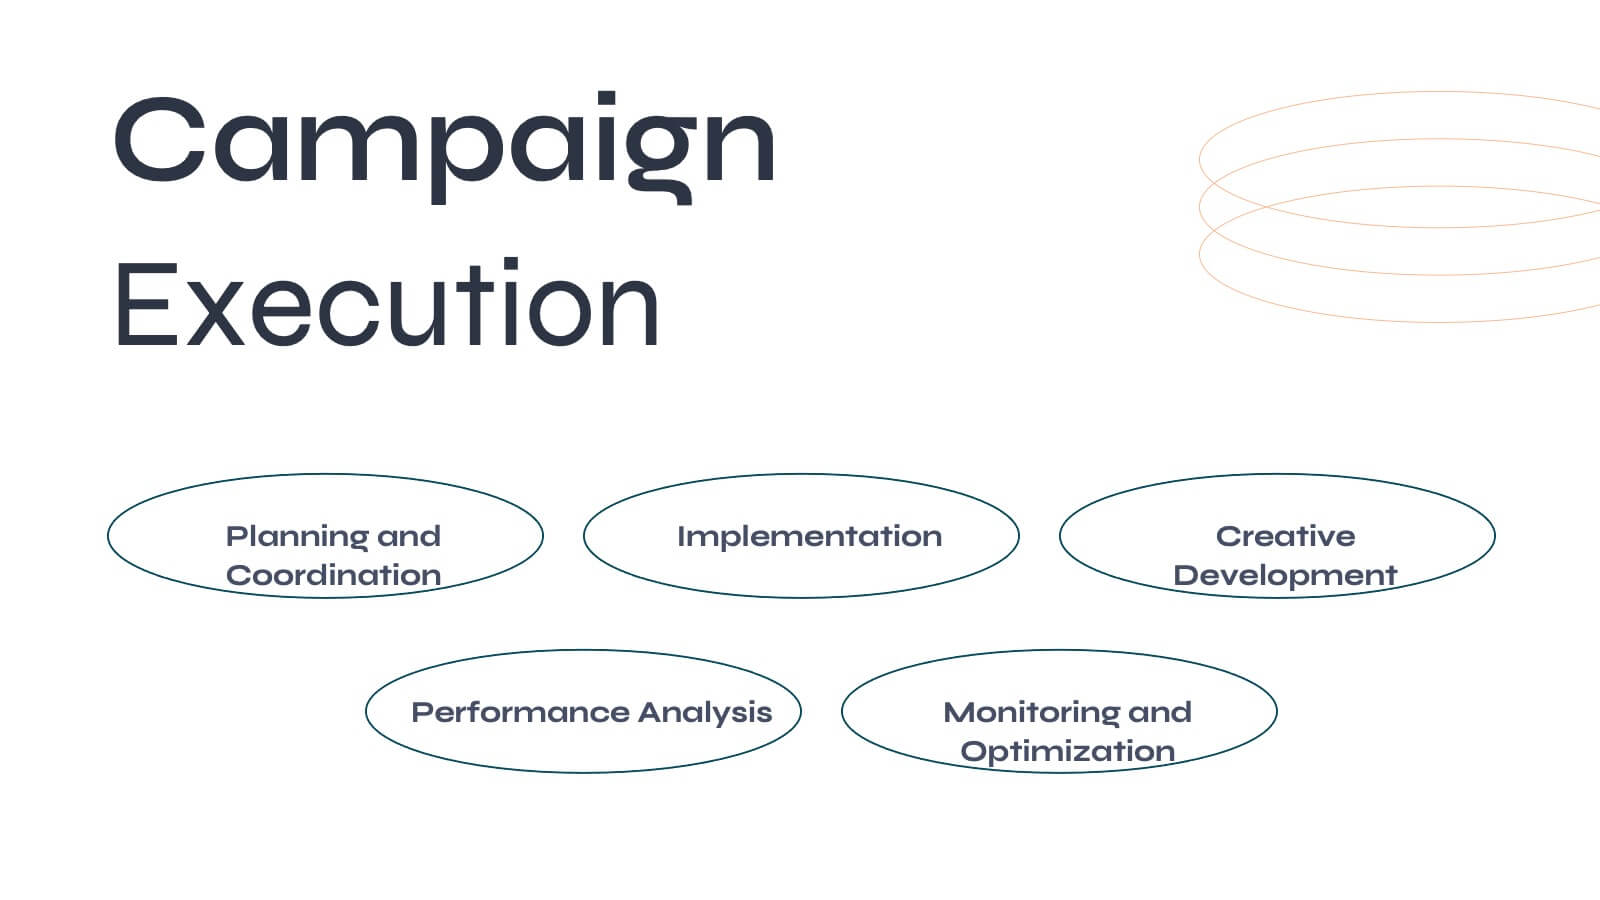
Aurora Agency Portfolio Presentation
Showcase your agency's strengths with this polished, modern presentation template. Perfect for presenting market analysis, client success stories, and creative processes, it features a clean and professional design. Highlight your team's expertise and strategic approach to impress potential clients. Compatible with PowerPoint, Keynote, and Google Slides, it ensures seamless presentations on any platform.


5 diapositivas
Architecture and Construction Strategy Presentation
Lay the foundation for success with this clean, construction-inspired presentation design. Ideal for showcasing project strategies, development phases, or architectural plans, it helps you communicate structure and vision with clarity. Fully customizable and compatible with PowerPoint, Keynote, and Google Slides for effortless editing and professional results.


6 diapositivas
Business Performance Dashboard
Enhance your business presentations with our "Business Performance Dashboard" template. This comprehensive infographic provides a detailed overview of crucial business metrics, structured within a user-friendly dashboard layout. It includes financial data like total orders and cash on hand, operational stats such as project updates, and engagement metrics including views and follows. Each section is visually distinct, with icons and color blocks that make data easy to read and analyze. Ideal for managers and analysts, this template offers a snapshot of company performance, facilitating informed decision-making and efficient reporting. Compatible with PowerPoint, Keynote, and Google Slides, it's an essential tool for any business analysis.


6 diapositivas
3D Shapes Infographic
3D shapes, also known as three-dimensional shapes or solids, are geometric figures that have three dimensions: length, width, and height (or depth). This Infographic visually explains various three-dimensional geometric shapes, their properties, and real-world applications. With this template you can summarize the benefits of the 3D Shapes in simplifying the understanding of complex shapes and encouraging practical applications in various fields. This infographic is the perfect study aid for students preparing for geometry exams. This is fully customizable and compatible with Powerpoint, Keynote, and Google Slides.