


Características


¿Tienes alguna pregunta?
Recomendar


6 diapositivas
Cultural Ecology Infographics
The "Cultural Ecology" infographic template is an insightful and captivating tool, expertly tailored for PowerPoint, Keynote, and Google Slides. This template is a valuable resource for anthropologists, environmentalists, and educators aiming to showcase the intricate relationship between human cultures and their environments in a visually compelling way. This template elegantly maps out the principles of cultural ecology, illustrating how cultural practices, societal developments, and environmental factors are interwoven. It highlights key concepts such as adaptation, sustainability, and the impact of human activities on ecosystems. The layout is designed to facilitate a deep understanding of the ways in which human cultures shape and are shaped by their natural surroundings. The design is as rich and diverse as the field it represents, with a color scheme that echoes the vibrancy of different cultures and the richness of various ecosystems. This not only makes the presentation visually striking but also reinforces the interconnectedness of culture and ecology. Whether used in academic lectures, environmental conferences, or cultural exhibitions, this template ensures that the complex and fascinating world of "Cultural Ecology" is presented in an engaging, educational, and visually arresting manner.


4 diapositivas
Data Science and AI Big Data
Visualize the core relationship between AI, data science, and analytics using this interconnected circular diagram. Ideal for tech professionals, researchers, and AI educators to explain data-driven processes clearly. Fully editable in PowerPoint, Keynote, and Google Slides for seamless customization.


21 diapositivas
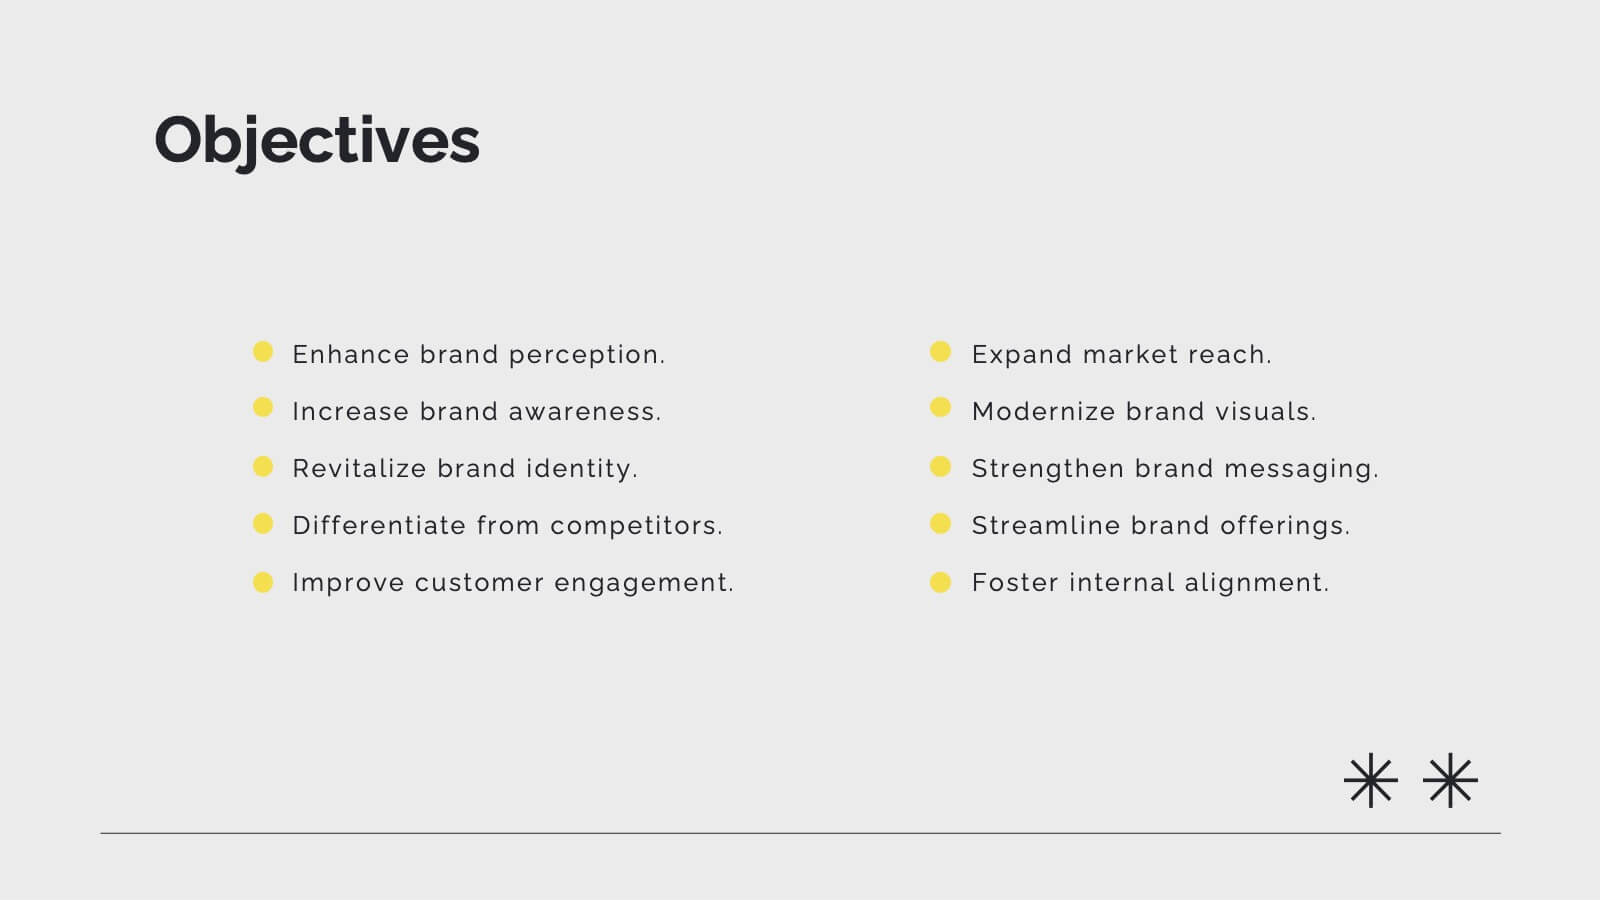
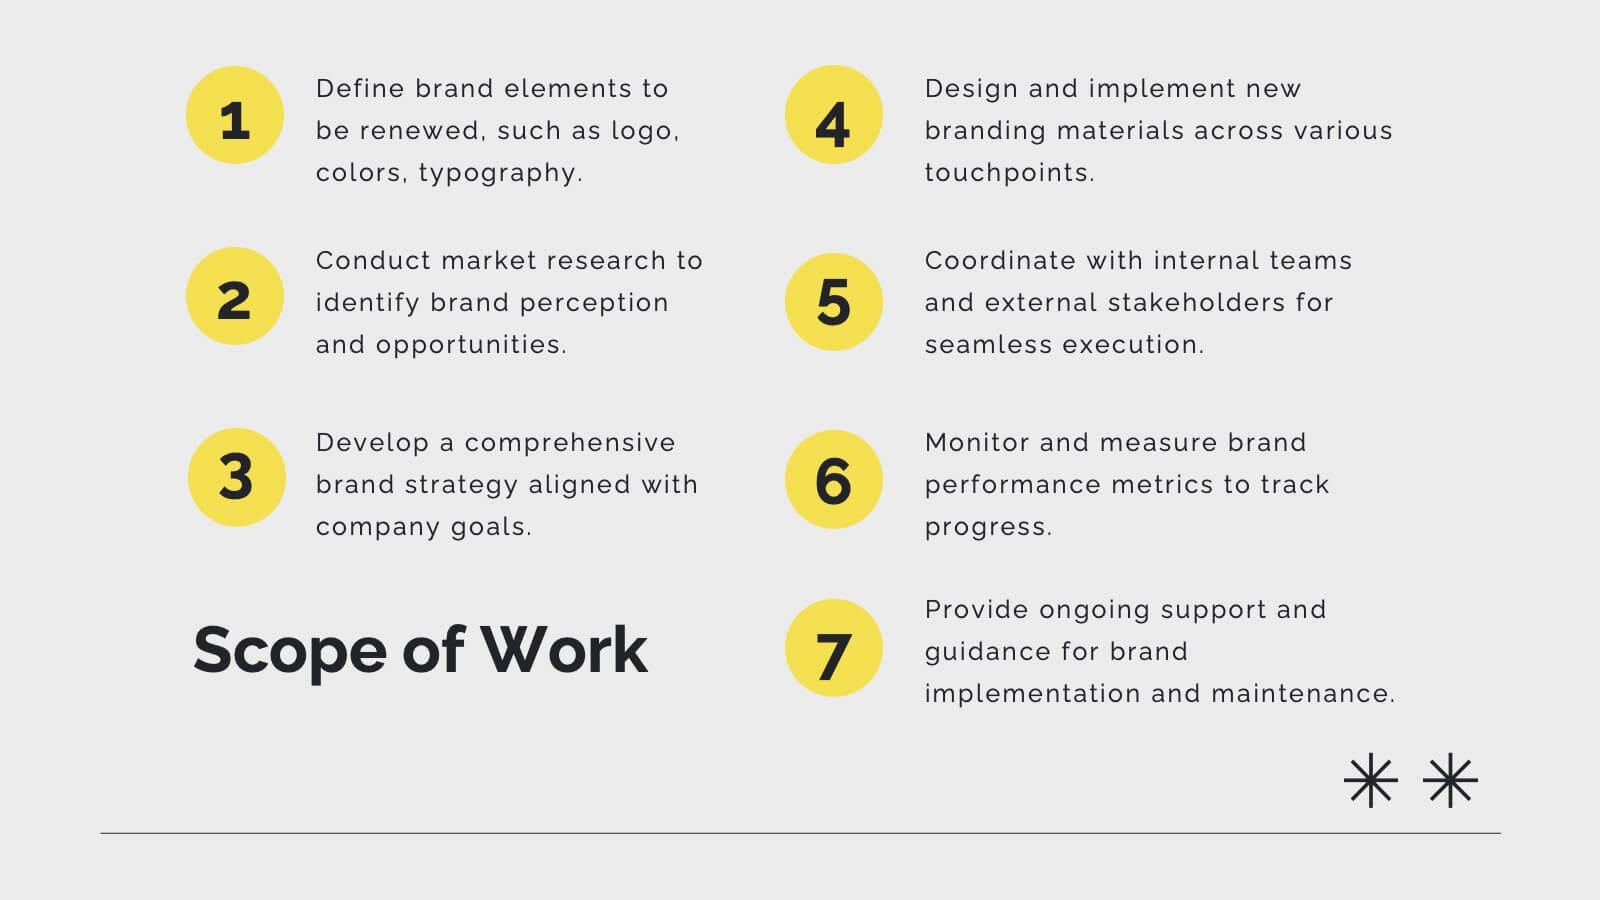
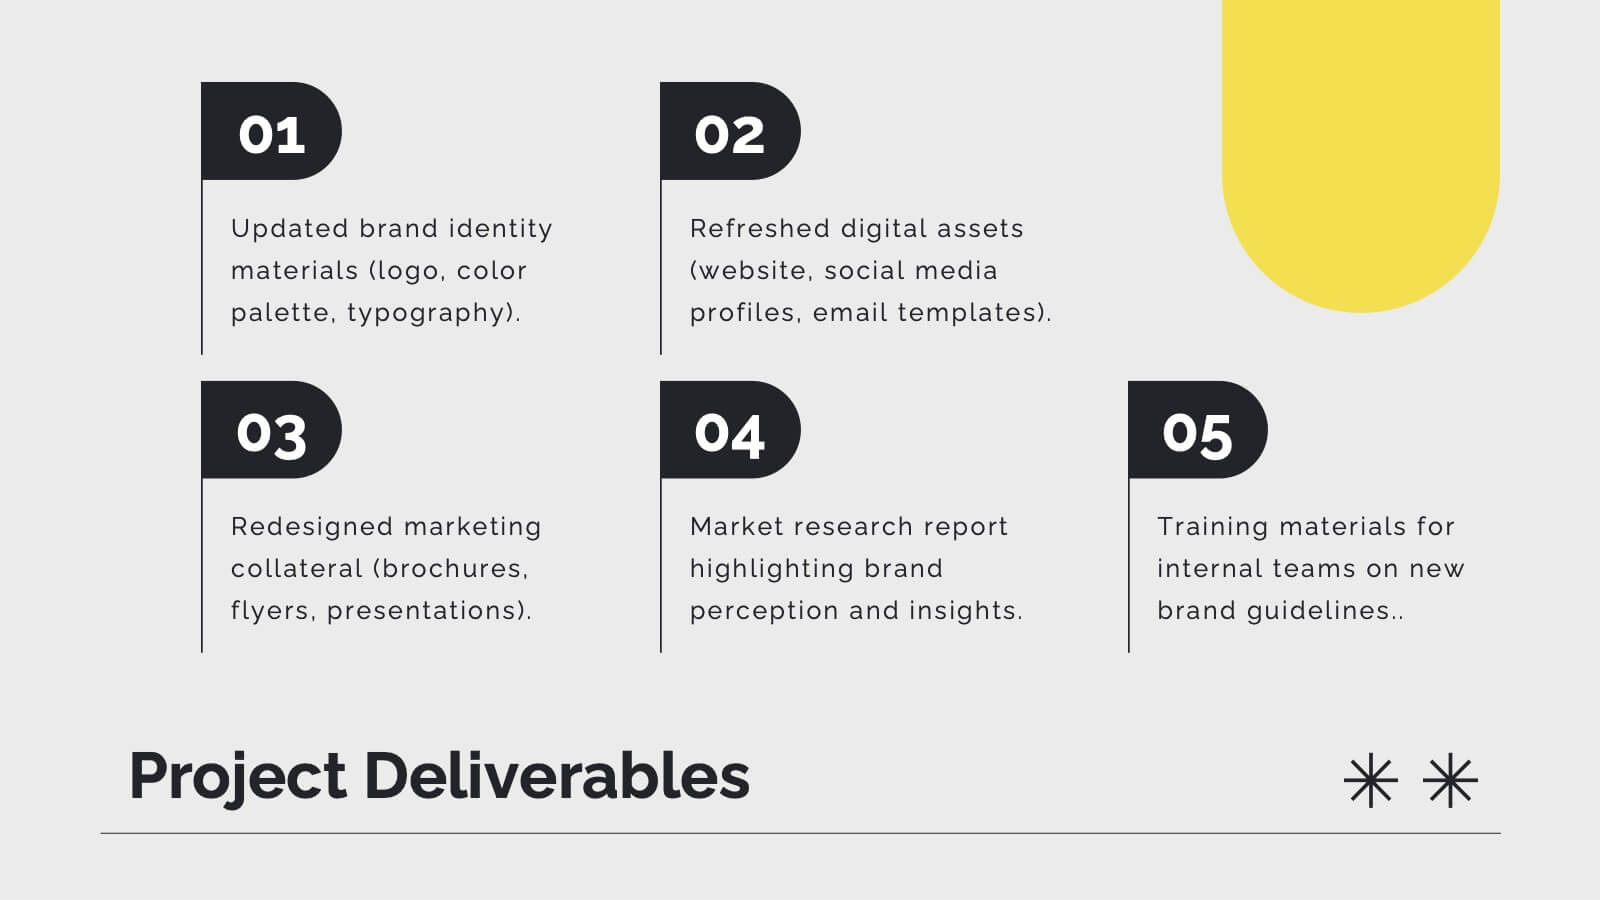
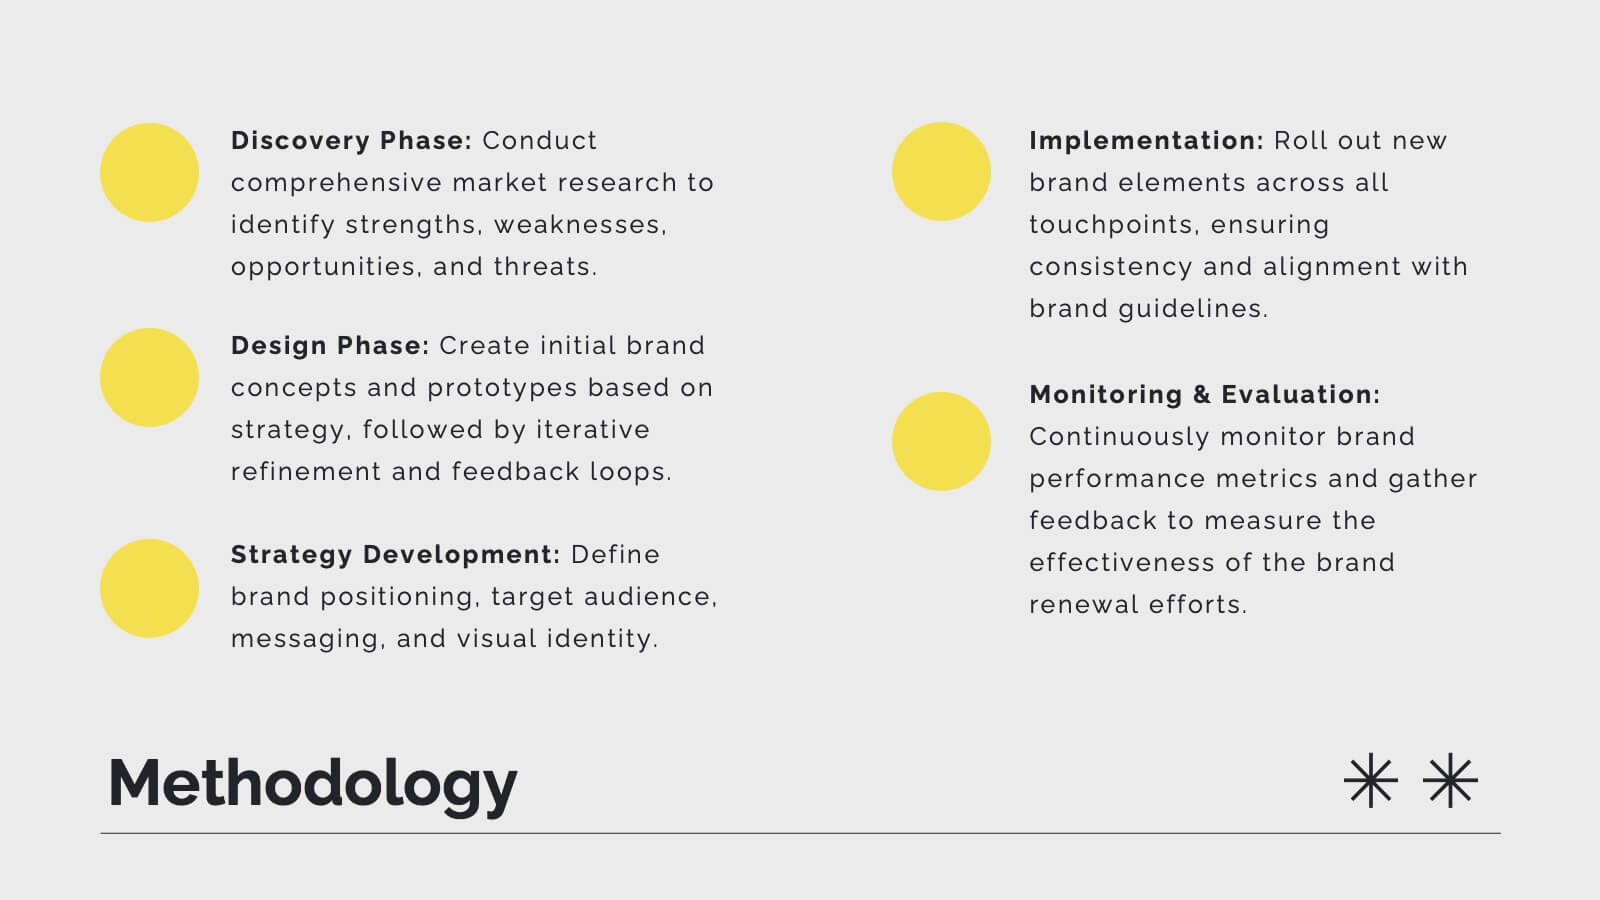
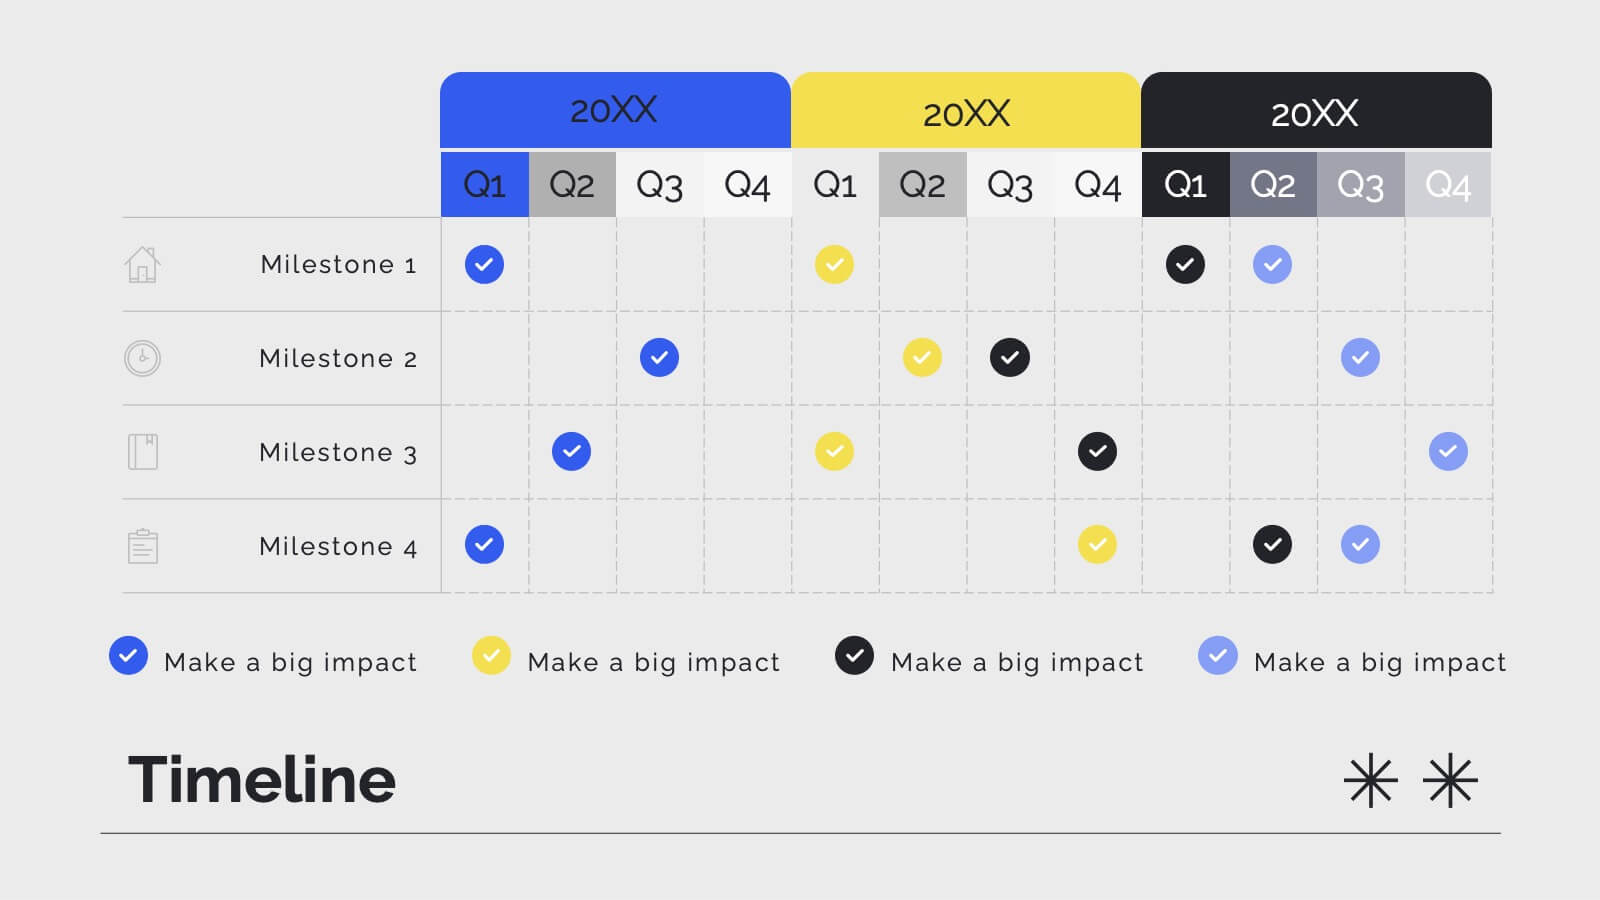
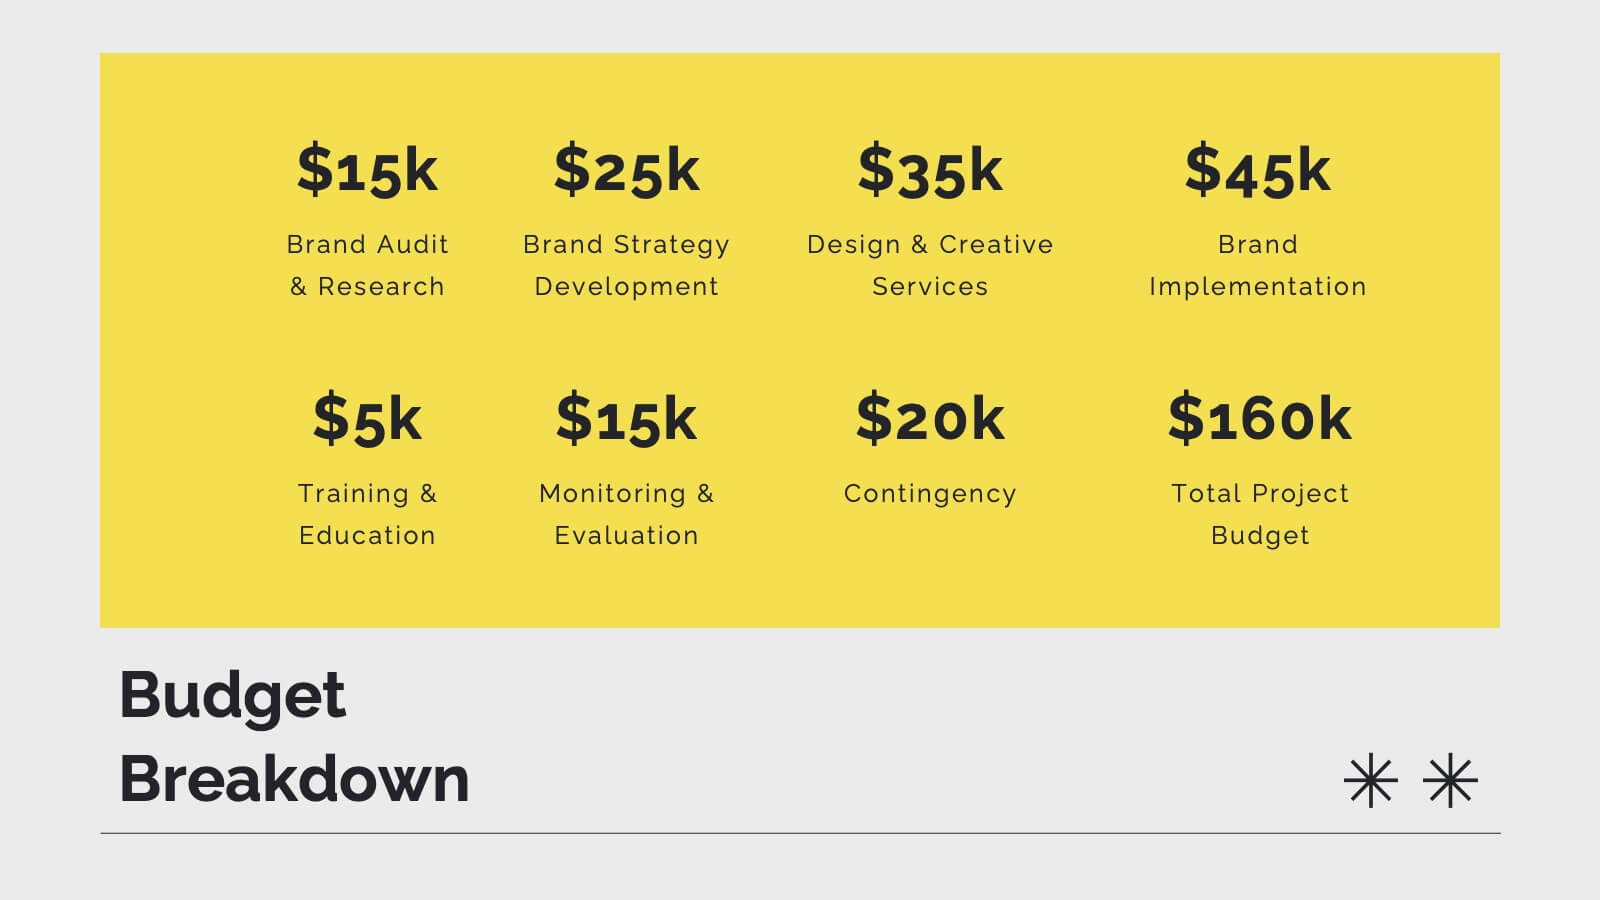
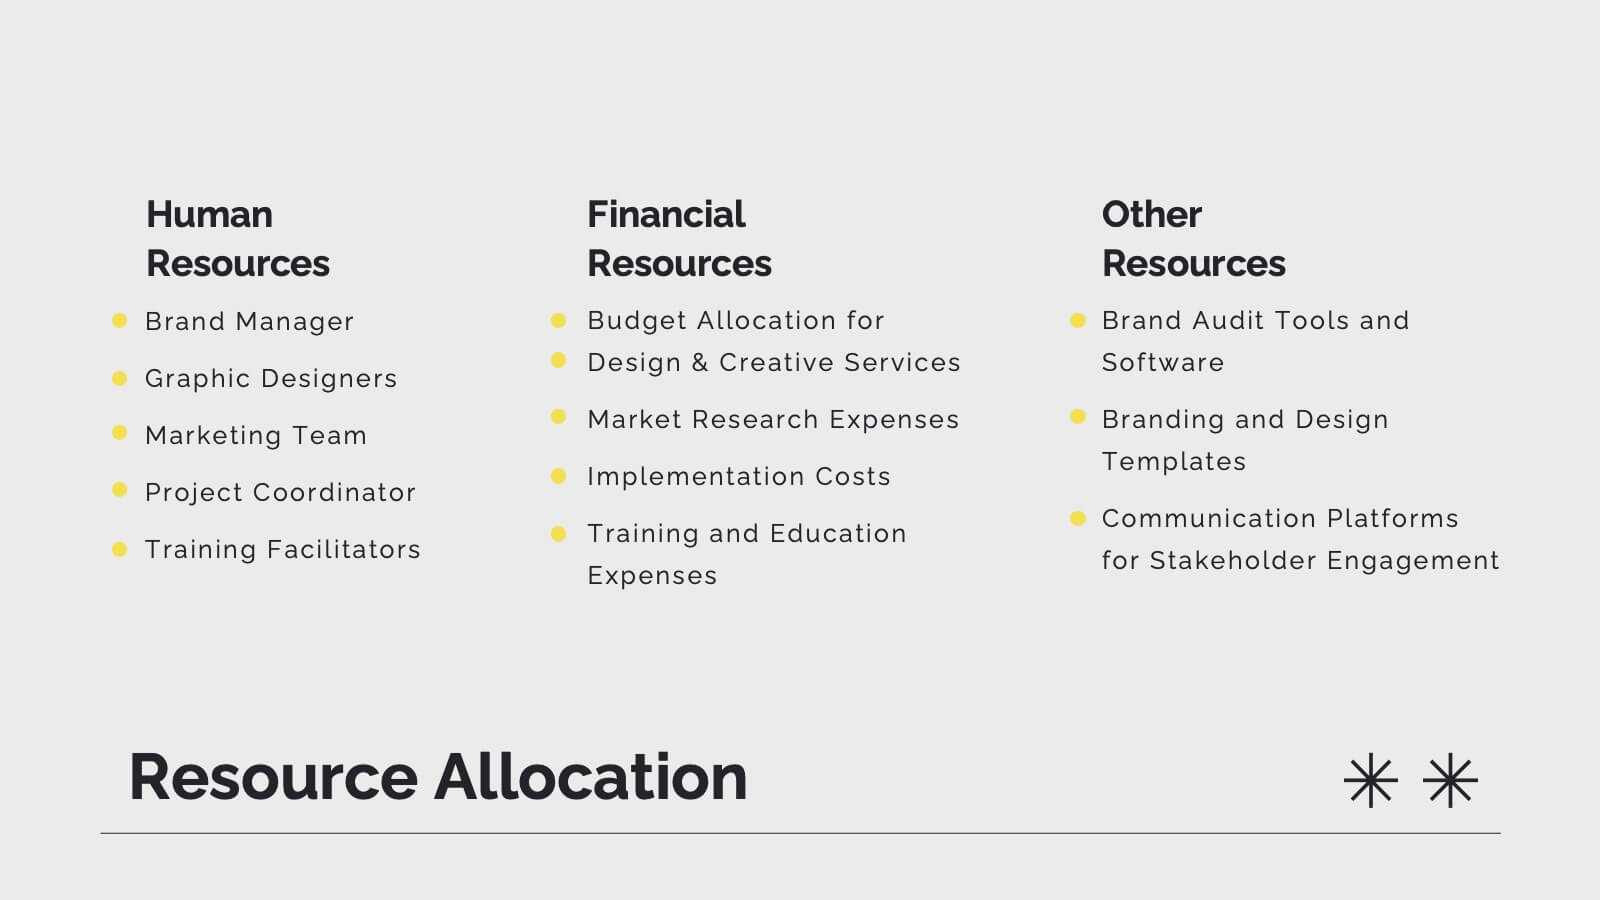
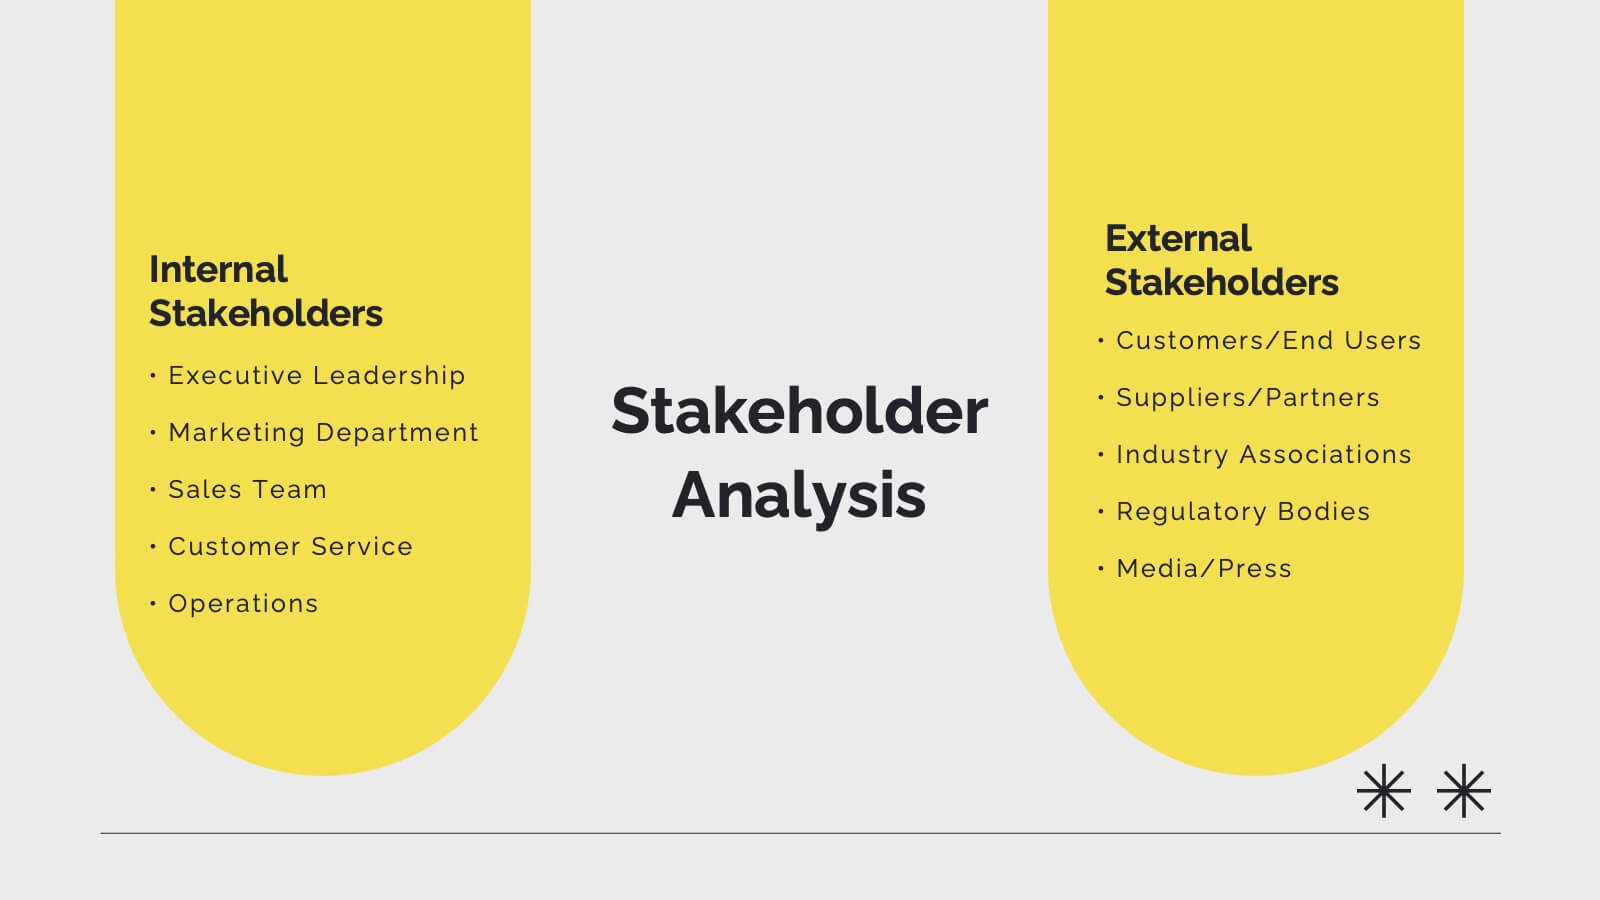
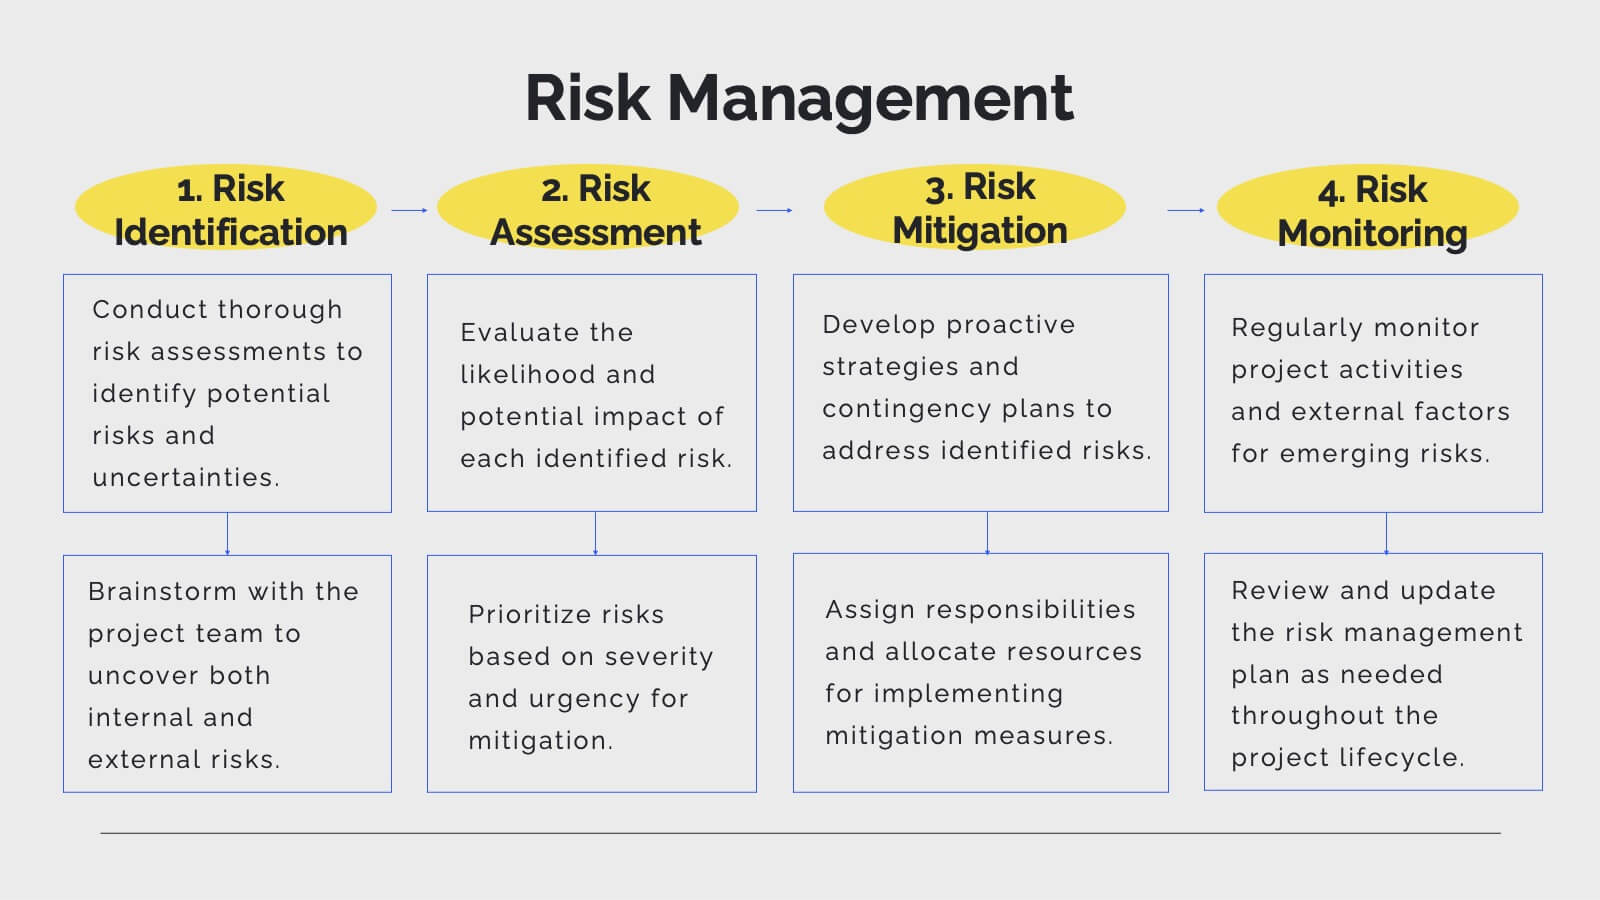
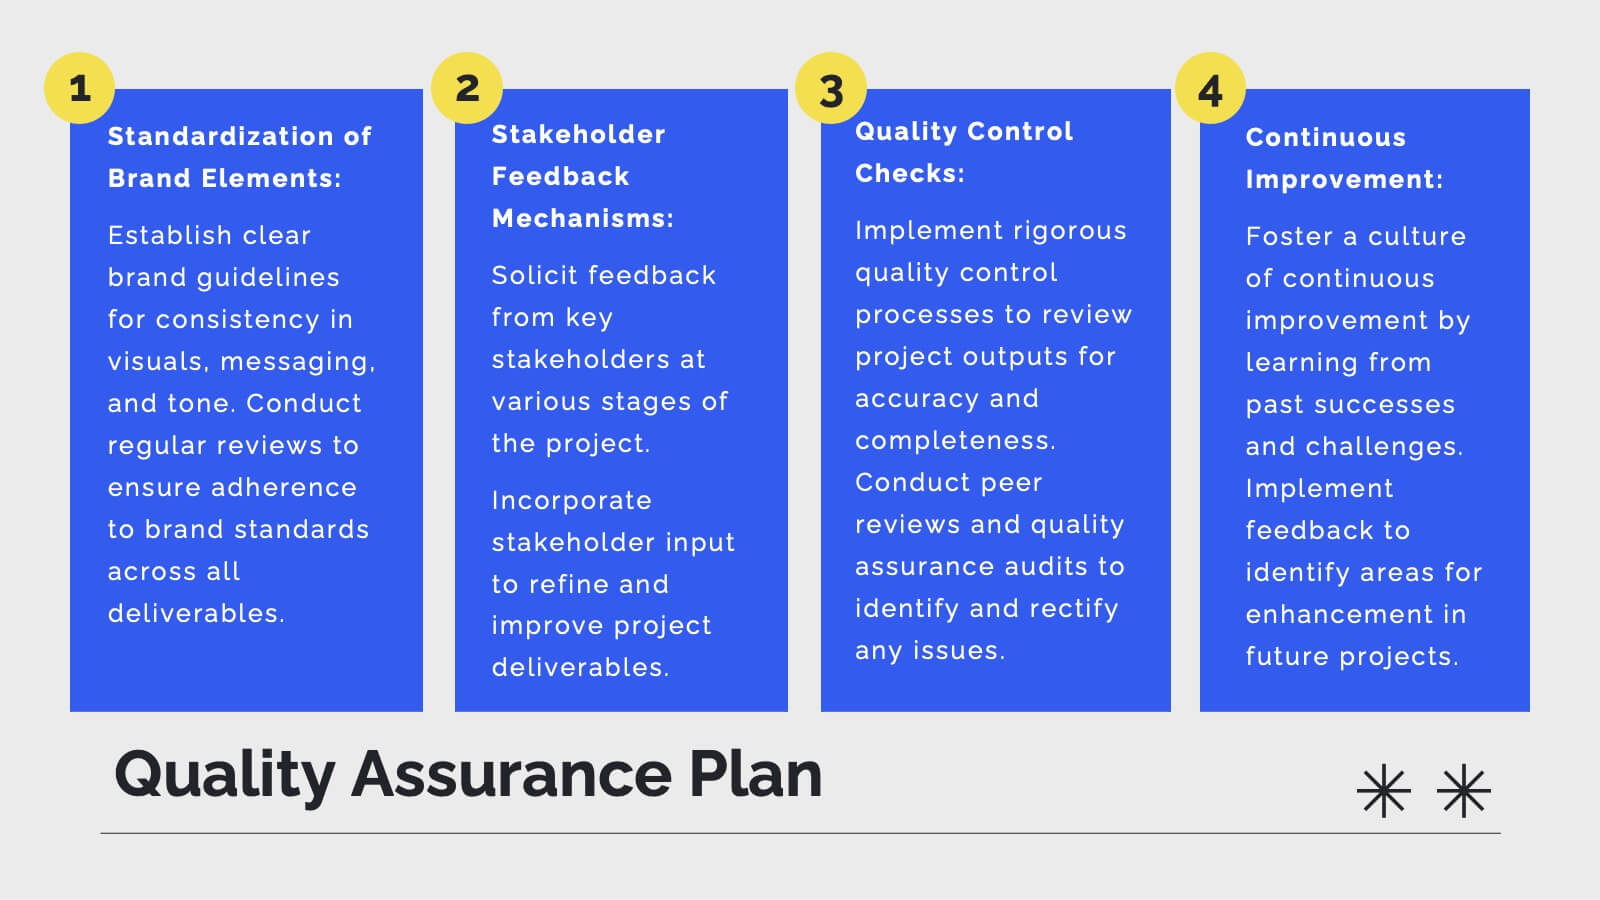
Pulse Project Management Plan Presentation
Streamline your project management with this vibrant template. It covers project overview, objectives, deliverables, methodology, timeline, budget, and risk management. Perfect for clear and engaging presentations. Compatible with PowerPoint, Keynote, and Google Slides for seamless customization.


26 diapositivas
Startup Presentation
Elevate your startup's story with this Startup Presentation template. It features slides for your mission, innovation highlights, market analysis, and growth strategy. Perfect for engaging potential investors and partners. This versatile template is compatible with PowerPoint, Keynote, and Google Slides, making it easily accessible for all your presentation needs.


19 diapositivas
Prism Design Strategy Proposal Presentation
Bring your design strategy to life with this modern and stylish presentation template! Perfect for showcasing your design concepts, processes, and elements, this template ensures that your ideas are communicated effectively. With a sleek layout for design briefs, mood boards, prototypes, and project timelines, it's the ideal tool for creative professionals. Customize it easily in PowerPoint, Keynote, or Google Slides to make a lasting impression on your audience.


5 diapositivas
Task Automation Process Flow Presentation
Streamline operations with this visual task automation flowchart. Perfect for illustrating automated sequences, decision nodes, and multi-branch logic. Clearly labeled elements guide viewers through each step. Ideal for tech teams, process designers, and workflow planning. Fully editable in PowerPoint, Keynote, and Google Slides to match your branding and automation strategy.


5 diapositivas
Business Opportunity in Europe Map Presentation
Identify key growth areas across Europe with this clean, data-driven presentation. Highlight business potential using country-based color coding and progress indicators. Perfect for market analysis, investment pitches, or strategic expansion reports. Fully editable and compatible with PowerPoint, Keynote, and Google Slides for effortless customization and professional presentation delivery.


26 diapositivas
Operational Efficiency Tips Purple Presentation
Optimize your team's workflow and showcase your strategies for improved performance with this operational efficiency template. The vibrant purples and dynamic design invite viewers into a world where streamlined processes and clear objectives lead to success. Lay out the steps of your action plan, from the CEO's vision to the team's execution, with a variety of slides designed for clear communication. Charts and diagrams turn complex data into easy-to-follow visuals, while mockups provide a real-world view of your tools and platforms. Tailored for use in popular presentation software, this set of slides is an excellent aid for managers and consultants aiming to present plans that boost productivity and cut down waste. It’s all about making the complex simple and achieving more with less, helping your audience see the path to a leaner and more effective operation.


7 diapositivas
McKinsey 7S Model Infographic Presentation Template
The McKinsey 7S model is a management framework developed by the consulting firm McKinsey & Company. The model consists of seven interdependent factors that are important for an organization's success: strategy, structure, systems, shared values, skills, staff, and style. The template can be used to visualize the 7S model hierarchy and the importance of each component to your business. This inventive presentation is designed to take an economic approach, If you’re interested in taking this strategic step to evaluating your processes and measuring performance, this presentation is for you.


26 diapositivas
Wave Brand Identity Presentation
Take your brand's identity to the next level with the Wave Brand Identity Presentation template! Designed to capture the essence of your brand in a visually striking and comprehensive format, this template is perfect for showcasing your brand's vision, values, and personality. It includes sections for brand vision and mission, core values, target audience, and brand positioning, ensuring that every aspect of your brand identity is clearly communicated. The sleek design elements and modern layout make it easy to present your brand's unique selling proposition (USP) and key differentiators, helping you to build a strong, cohesive brand story. Ideal for brand strategists, marketing teams, and creative professionals, this template is fully customizable and works seamlessly with PowerPoint, Keynote, and Google Slides. Bring your brand's story to life and leave a lasting impression with the Wave Brand Identity template!


6 diapositivas
3D Infographic Design
Visualize data like never before with this bold 3D block diagram layout. Designed to break down complex figures into three key segments, it’s perfect for presenting percentages, growth areas, or metric comparisons. Easily editable in PowerPoint, Keynote, and Google Slides.


10 diapositivas
Lean Six Sigma Business Strategy Presentation
Enhance your operational efficiency with our Lean Six Sigma Business Strategy template! This user-friendly guide helps you navigate through the core stages—Define, Measure, Analyze, Improve, and Control—optimizing processes and reducing waste. Compatible with PowerPoint, Keynote, and Google Slides, this template is perfect for professionals aiming to drive business excellence through structured problem-solving.


5 diapositivas
Green Business Sustainability Strategy
Showcase your eco-conscious roadmap with this Green Business Sustainability Strategy presentation. Featuring a 5-step, curved timeline design with nature-inspired icons, it’s perfect for environmental initiatives, CSR planning, or ESG strategy. Easily adaptable in PowerPoint, Keynote, or Google Slides for a polished, professional message.


4 diapositivas
Organizational Hierarchy Chart Presentation
A clear, engaging way to map out team structure, this presentation highlights how roles connect and flow across an organization. It visually simplifies reporting lines, helping audiences quickly understand leadership levels and team responsibilities. Perfect for planning, onboarding, or strategy discussions, and fully compatible with PowerPoint, Keynote, and Google Slides.


5 diapositivas
Global Nonprofit Help Infographics
A global nonprofit organization is a type of organization that operates on an international scale and focuses on making a positive impact on a global scale. These vertical infographics focuses on the impact and importance of nonprofit organizations worldwide. This is ideal for showcasing the achievements and goals of nonprofits in addressing various global issues, such as poverty, healthcare, and environmental conservation. The infographics include a collection of captivating icons and illustrations related to nonprofit work. These slides allow you to present compelling stories, case studies, and success stories that demonstrate the real-world impact of nonprofit work.


7 diapositivas
North America Population Infographic Presentation
North America is a continent located in the northern hemisphere of the Earth, bordered by the Pacific Ocean to the west. It includes countries such as the United States, Canada, Mexico, and several others in the Caribbean and Central America. This template can be a powerful tool to communicate information about the continent in an informative and engaging way. This can help people understand and appreciate the diversity and complexity of North America, and can be used for a variety of purposes, from education to marketing. This template is compatible with Powerpoint, Keynote and Google Slides.


7 diapositivas
Social Media Engagement Infographic
Social media is the most influential tool in today's world. This infographic template is a great way to share the benefits of your services in an easy-to-read format that's sure to get your audience excited about what you have to offer. Whether you're looking to promote a new product line or simply want to provide information to your customers so they can make informed decisions, this infographic will be perfect for your needs. This infographic will help you understand how to use social media to engage with your audience and drive traffic to your site. Fully customizable and compatible with Powerpoint, Keynote, and Google Slides.