


Características


¿Tienes alguna pregunta?
Recomendar


7 diapositivas
Real Estate Agency Infographic
Real estate refers to property consisting of land, buildings, and natural resources like minerals, water, and crops, it is a fundamental part of societies and economies globally. Embark on a visual journey through the real estate landscape with our real estate agency infographic. Bold, dynamic, and informative, this infographic is your compass in the world of properties, guiding you through the ins and outs of real estate dynamics and opportunities. Compatible with Powerpoint, Keynote, and Google Slides. This informative guide will help you navigate the world of real estate, ensuring you make informed decisions in this dynamic market.


6 diapositivas
Sales Associate Infographic
A sales associate, also known as a sales representative or salesperson, is an individual who is responsible for selling products or services to customers. This infographic template is designed to highlight the key roles, skills, and responsibilities of a sales associate. It provides an informative and engaging overview of the sales associate's role within a company or organization, showcasing their contribution to sales and customer satisfaction. This template is suitable for various industries and can be customized to fit specific company or organizational contexts. Compatible with Powerpoint, Keynote, and Google Slides, this is easily customizable.


20 diapositivas
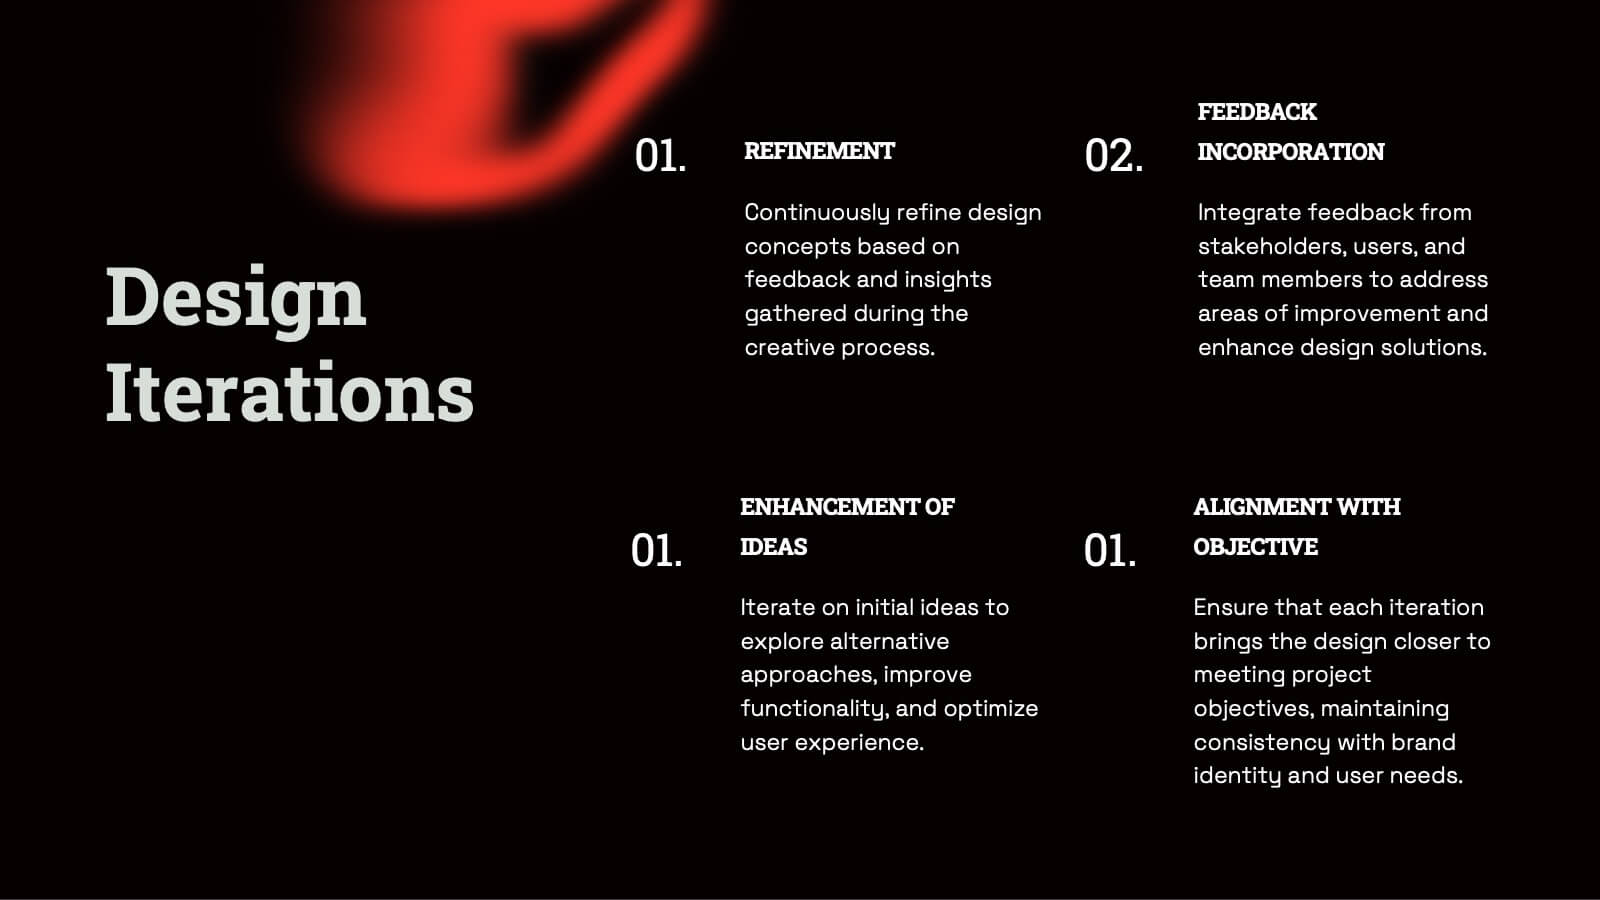
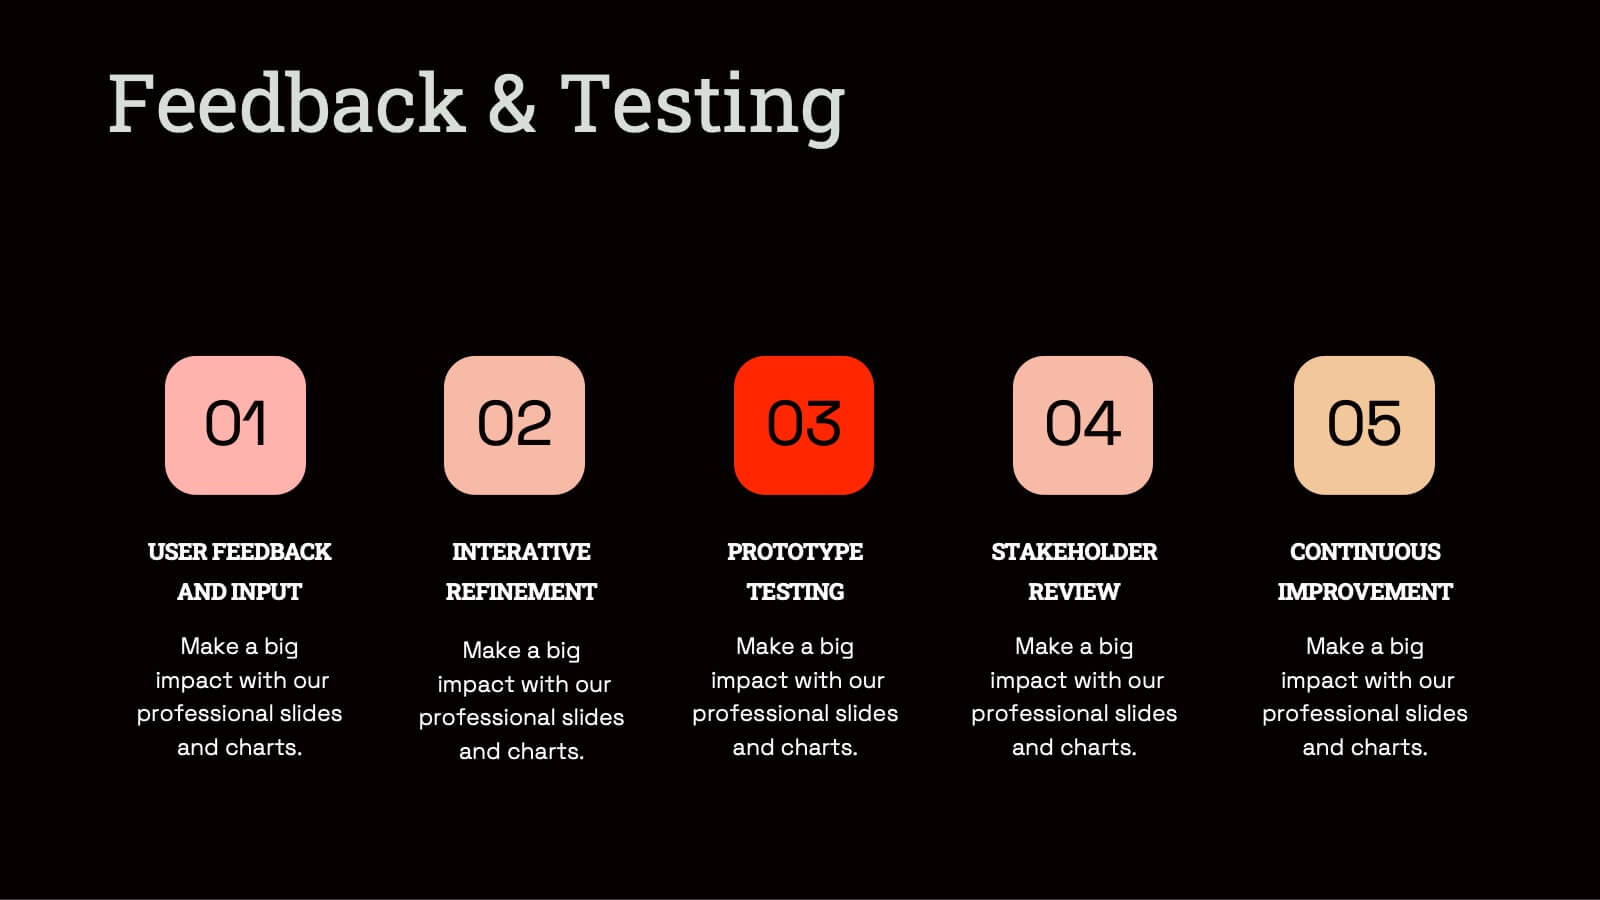
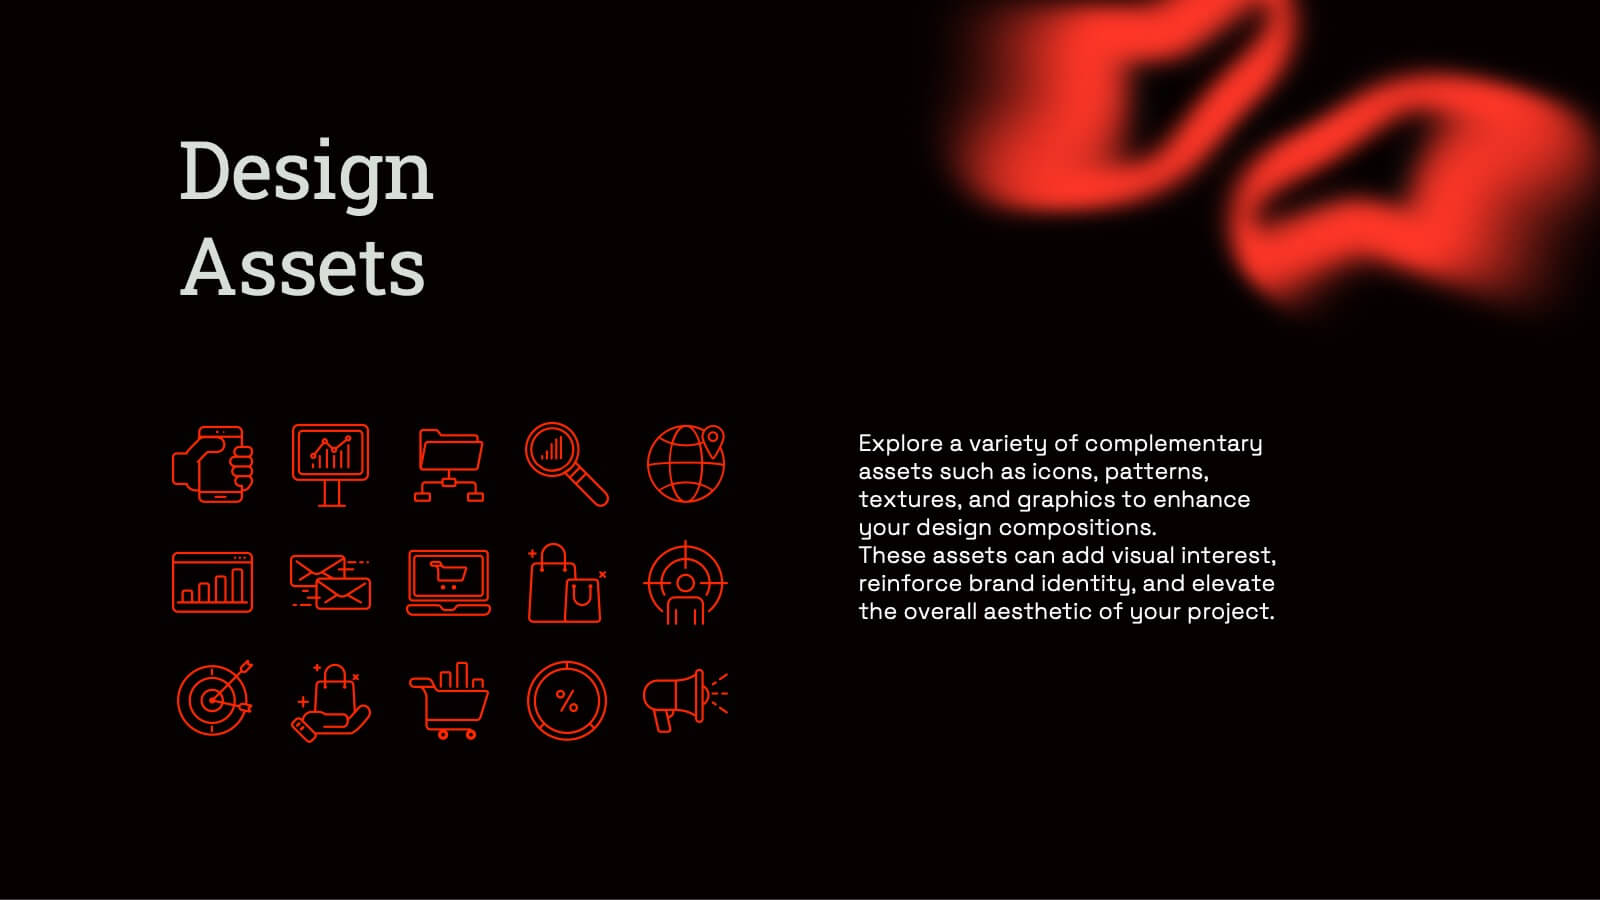
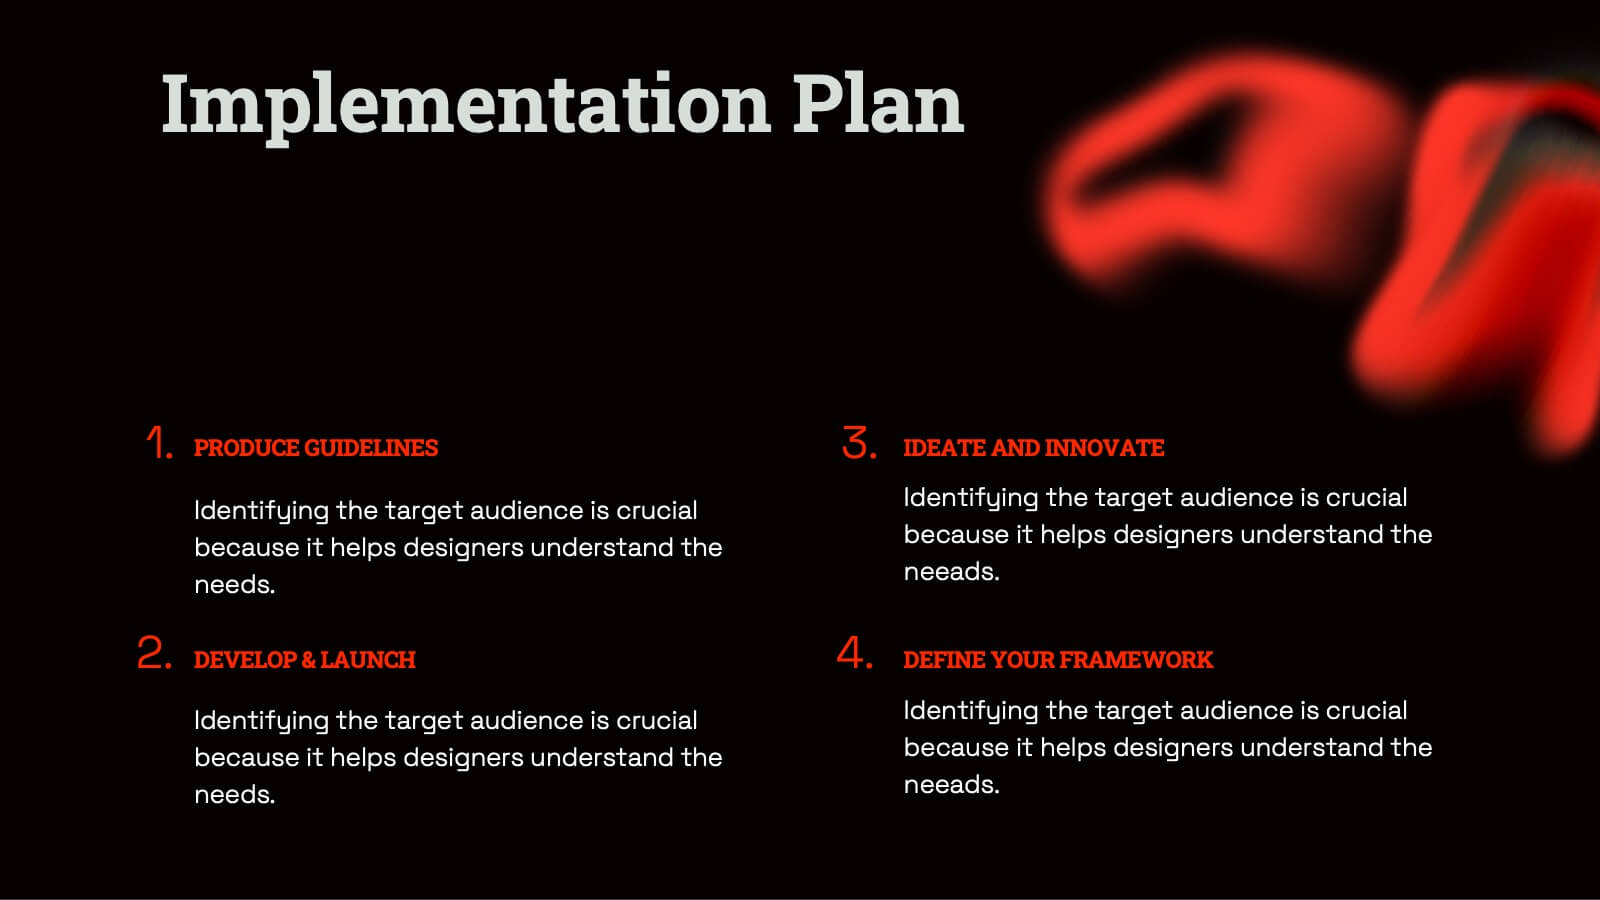
Leafsong Design Strategy Proposal Presentation
This Design Strategy Presentation Template is perfect for showcasing your creative process, key design elements, and project planning. Covering essential aspects like moodboards, prototypes, and design assets, it ensures a structured and visually appealing approach. Fully customizable and compatible with PowerPoint, Keynote, and Google Slides.


4 diapositivas
Omnichannel Marketing Plan Overview Presentation
Visualize your cross-channel marketing strategy with this modern, megaphone-themed slide. Ideal for showcasing campaigns across multiple platforms, this layout helps communicate key marketing touchpoints in a clear and impactful format. Fully editable in PowerPoint, Keynote, and Google Slides—perfect for aligning marketing teams and presenting strategic plans with ease.


6 diapositivas
Value Chain Management Infographics
Optimize your business operations with our Value Chain Management infographic template. This template is fully compatible with popular presentation software like PowerPoint, Keynote, and Google Slides, enabling you to effortlessly customize it to visualize and improve your value chain. The Value Chain Management infographic template offers a visually engaging platform to depict the various activities and processes involved in creating value for your customers. Whether you're a supply chain professional, business owner, or manager, this template provides a user-friendly canvas to create informative presentations and strategies for value chain optimization. Boost your business's efficiency and competitiveness with this SEO-optimized Value Chain Management infographic template, thoughtfully designed for clarity and ease of use. Customize it to highlight key components of your value chain, identify areas for improvement, and streamline your operations for enhanced value creation. Start crafting your personalized infographic today to excel in value chain management.


5 diapositivas
Global Warming Crisis Infographics
Global Warming refers to the long-term increase in the Earth's average surface temperature, primarily caused by the buildup of greenhouse gases in the atmosphere. This vertical infographics includes information about the effects of climate change on the planet. There are designed sections where you can feature data on rising temperatures, sea levels, and extreme weather events. These infographics feature unique designs that incorporate colors and images that convey the severity and urgency of this crisis. The goal of this template is to raise awareness about the need to address the global warming crisis and mitigate the impact of climate change.


8 diapositivas
Africa Development & Market Potential Presentation
Showcase regional opportunities with the Africa Development & Market Potential Presentation. This professional slide highlights four key countries across the continent using vibrant map markers and icons, ideal for data comparison, investment potential, or development tracking. Cleanly structured and easy to edit in PowerPoint, Keynote, Google Slides, and Canva.


5 diapositivas
Best Travel Planning Template
Bring wanderlust to life with a slide that turns trip planning into a clear, engaging journey. This presentation breaks down key travel steps—documents, packing, routes, and timing—using simple visuals that keep details organized and easy to follow. Fully customizable and compatible with PowerPoint, Keynote, and Google Slides.


7 diapositivas
Tree Diagrams Infographics Presentation Template
Tree diagrams are visual diagrams of different outcomes that can result when you take a certain action. They can be used to depict the various possible outcomes of an event or problem, helping you understand your options and choose the best one for a given purpose. They can be used to show statistical probabilities, or general issues that result in many possible ways of moving forward. Use this template to create your own tree diagram, as a new business planning tool to develop goals and objectives. This tree diagram template can help you visualize any project, large or small.


22 diapositivas
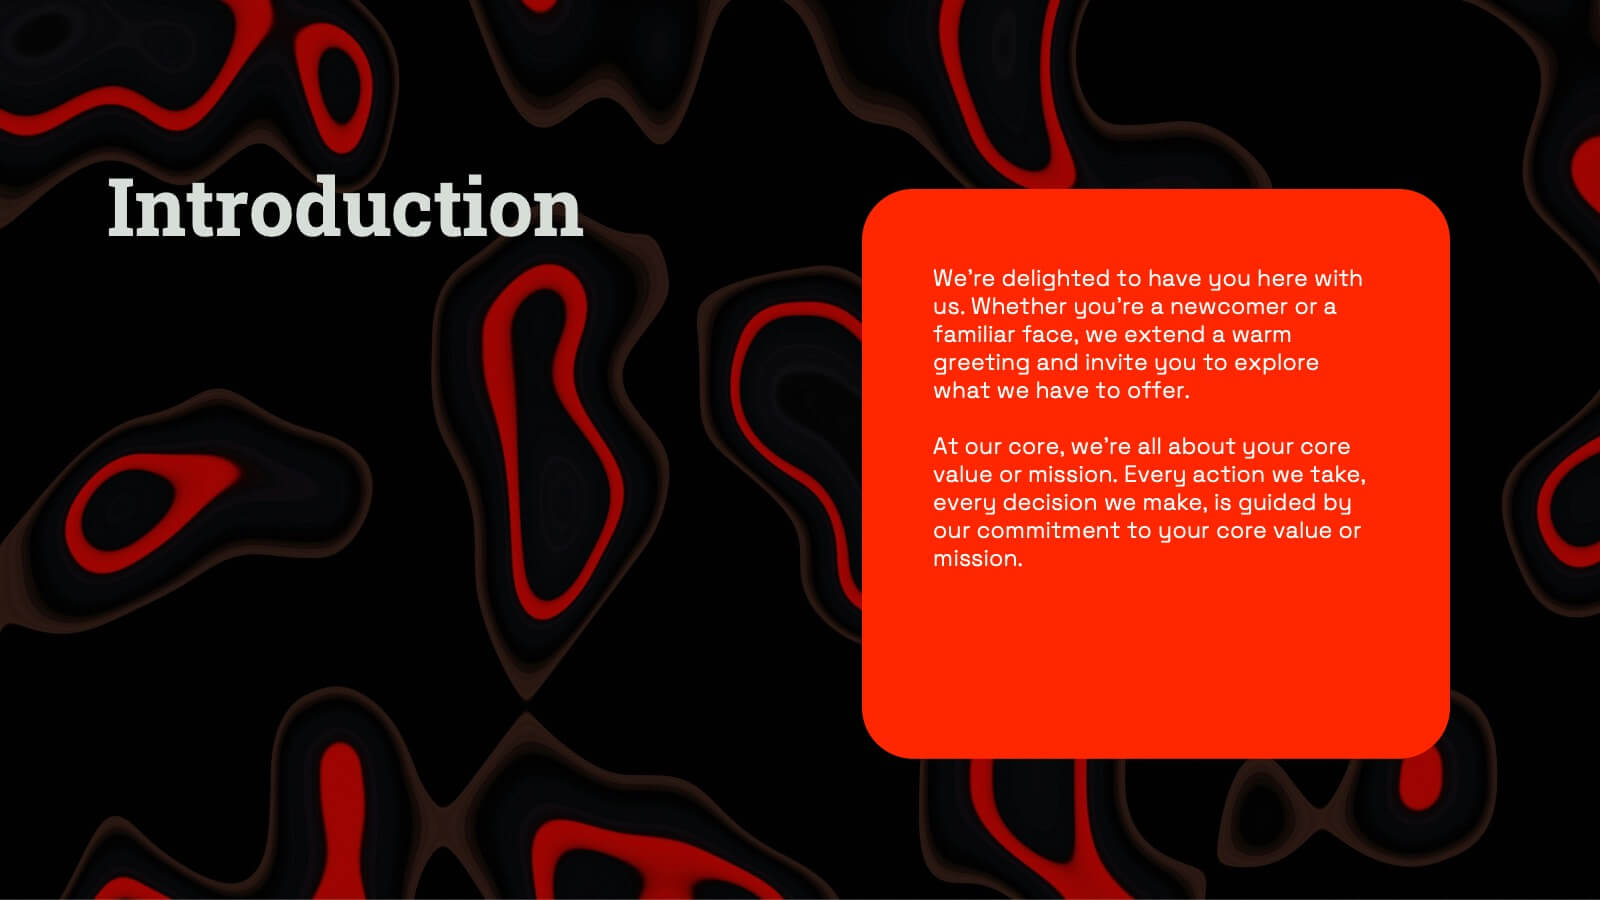
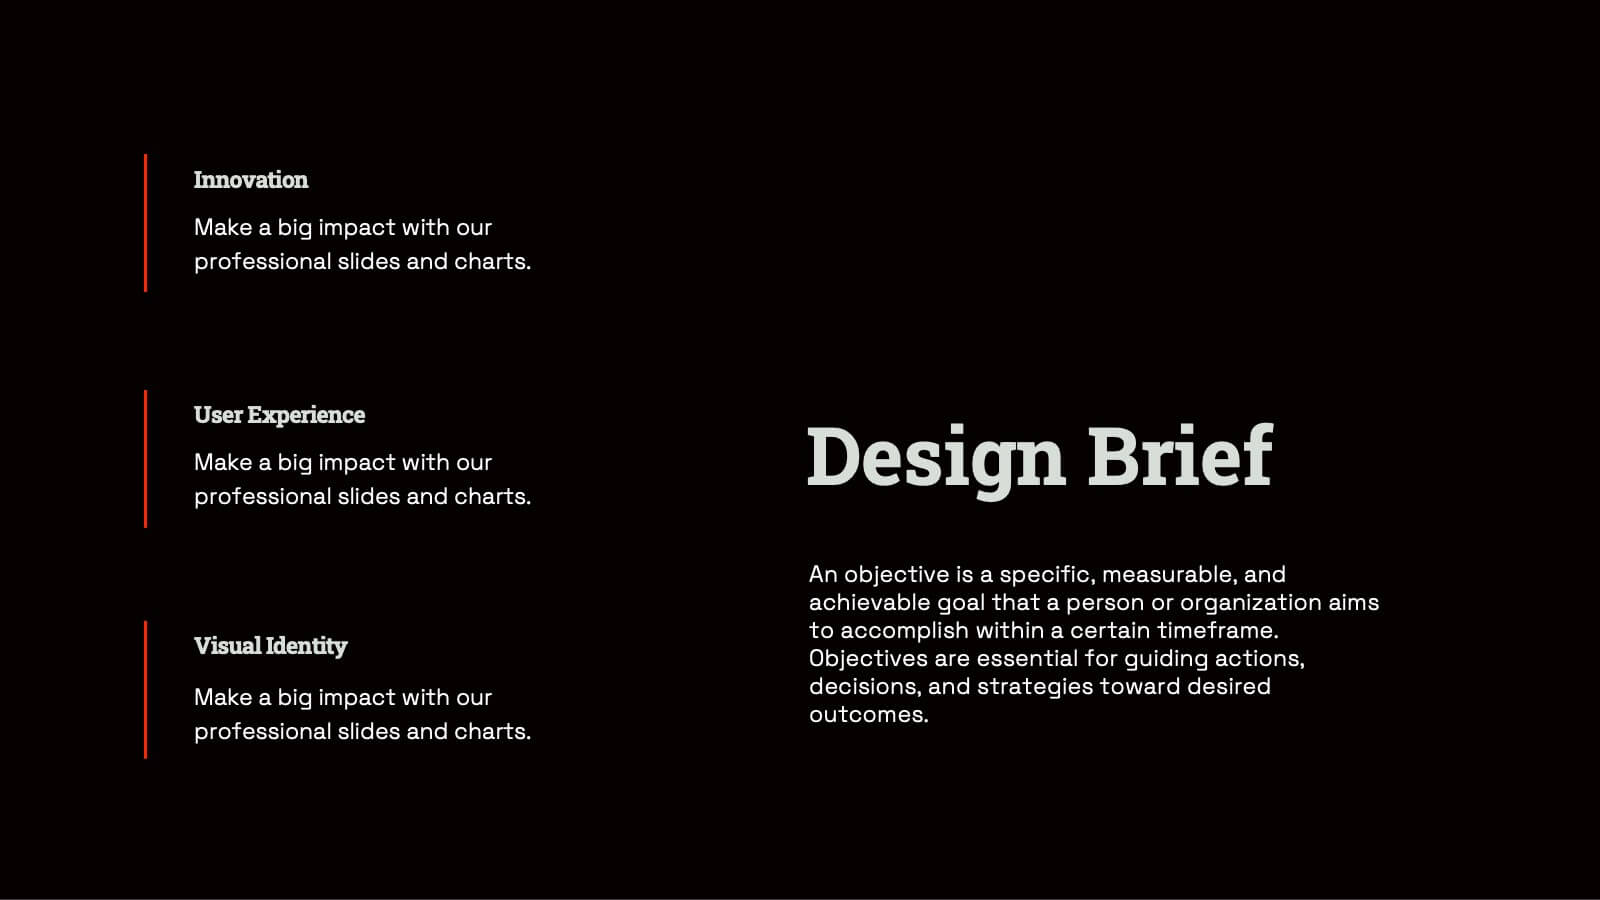
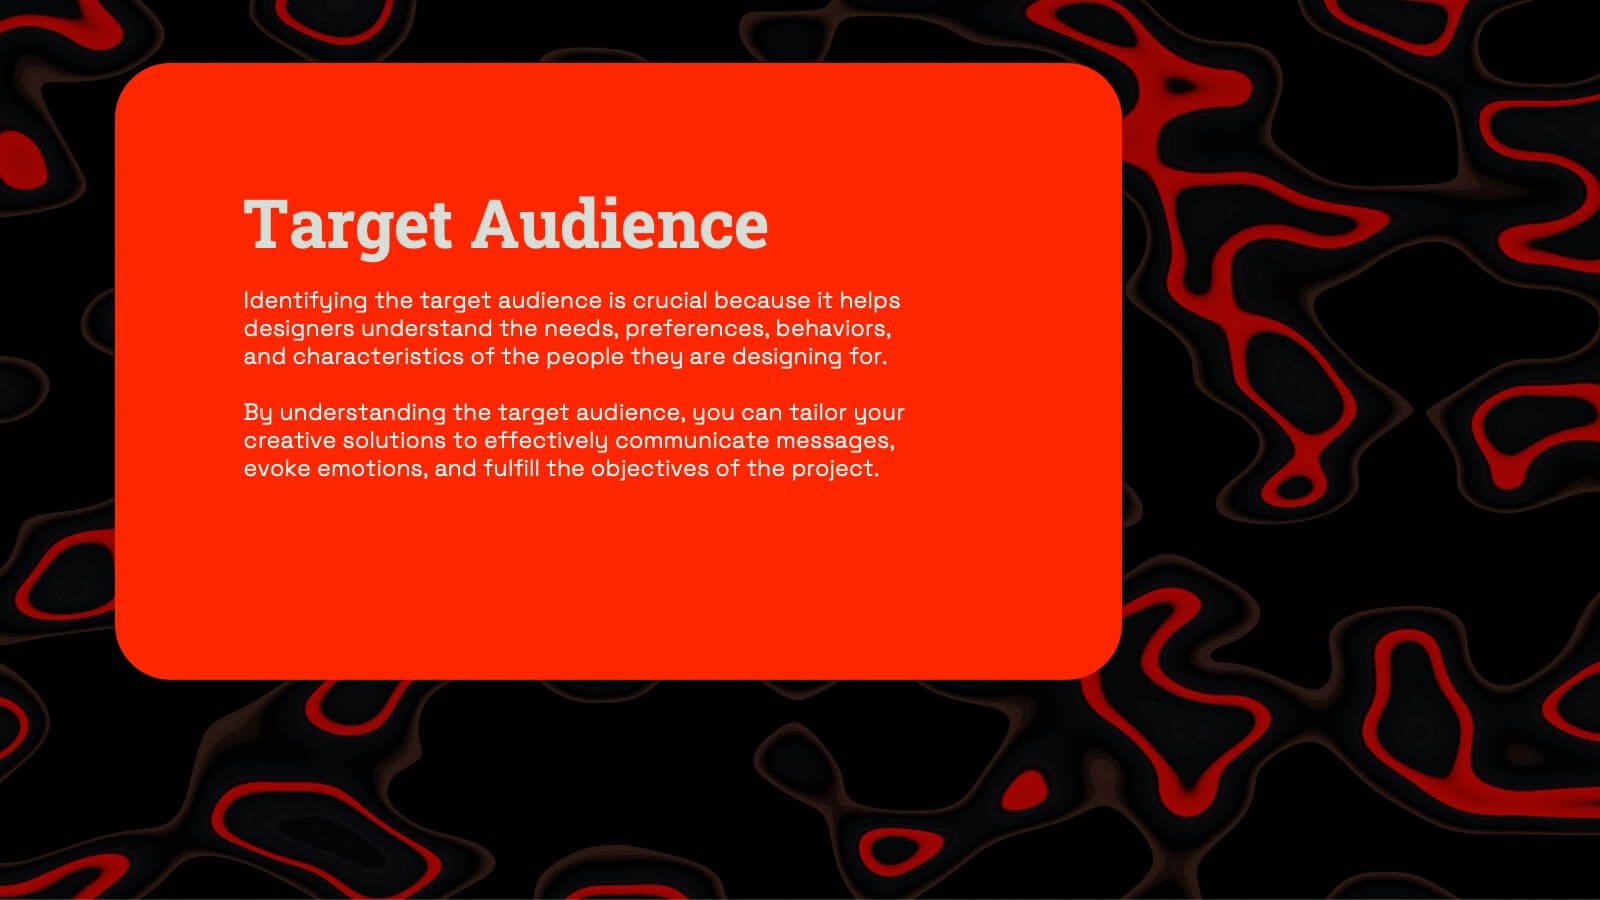
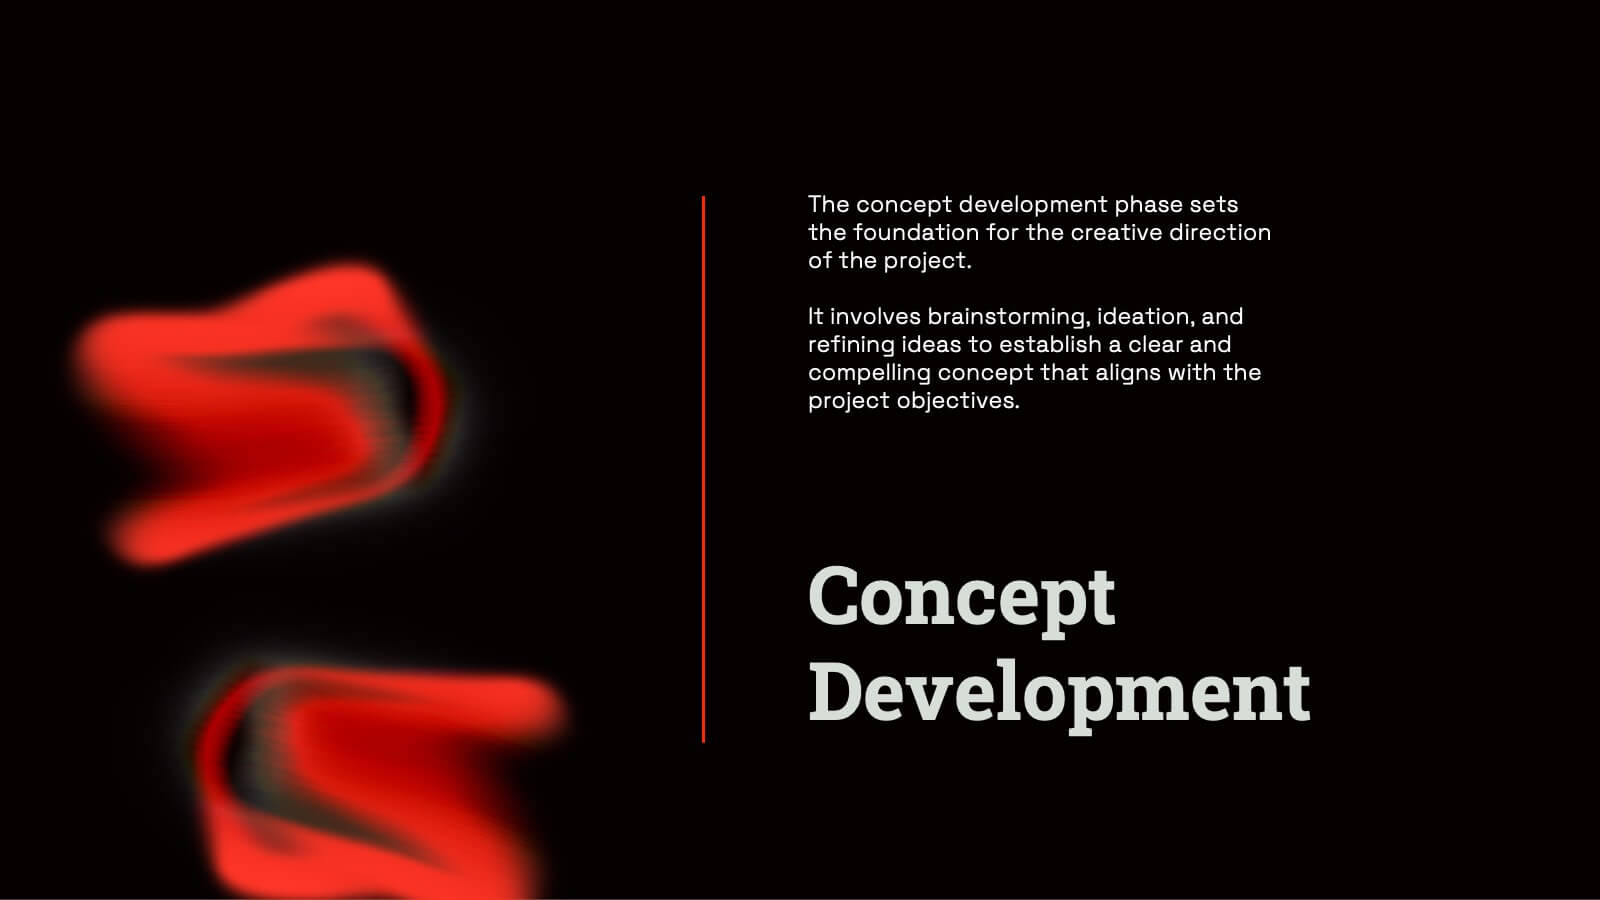
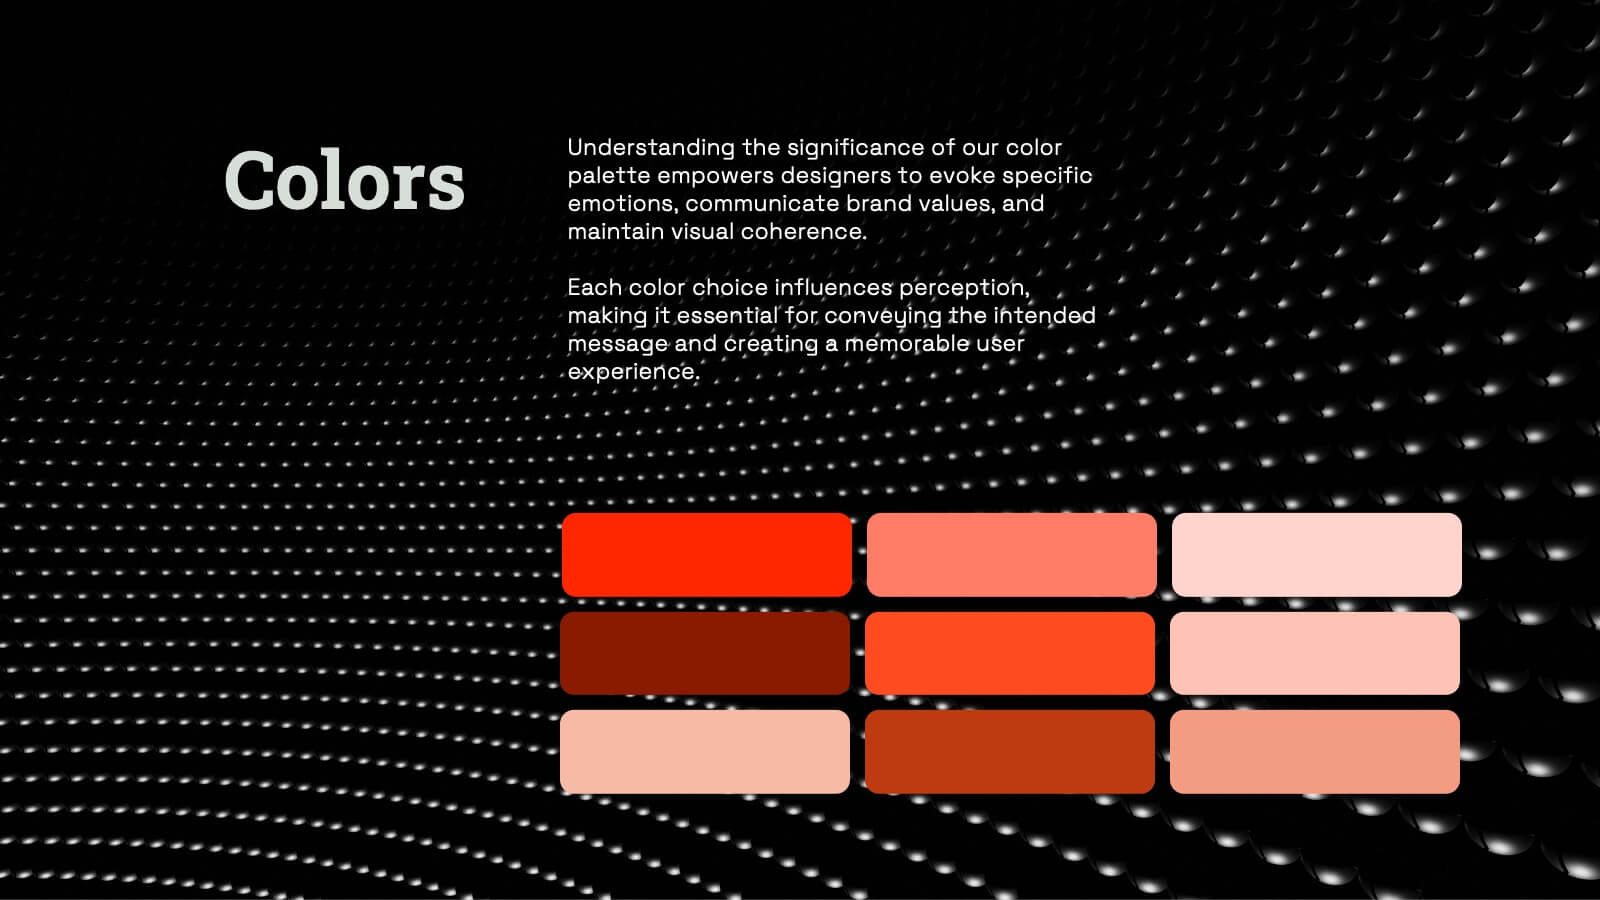
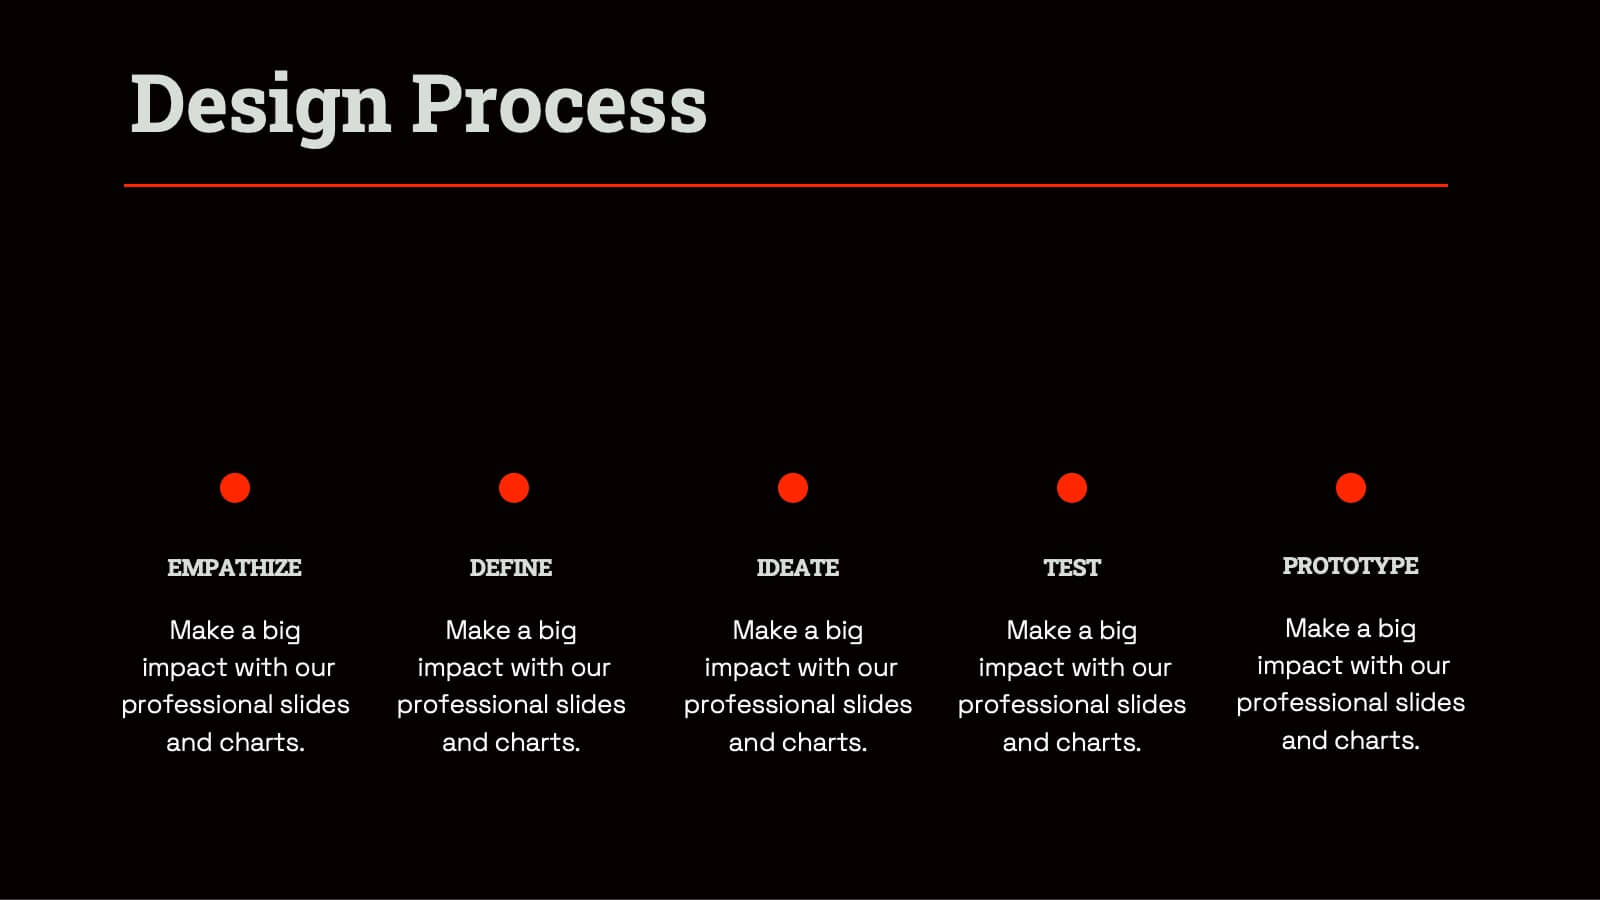
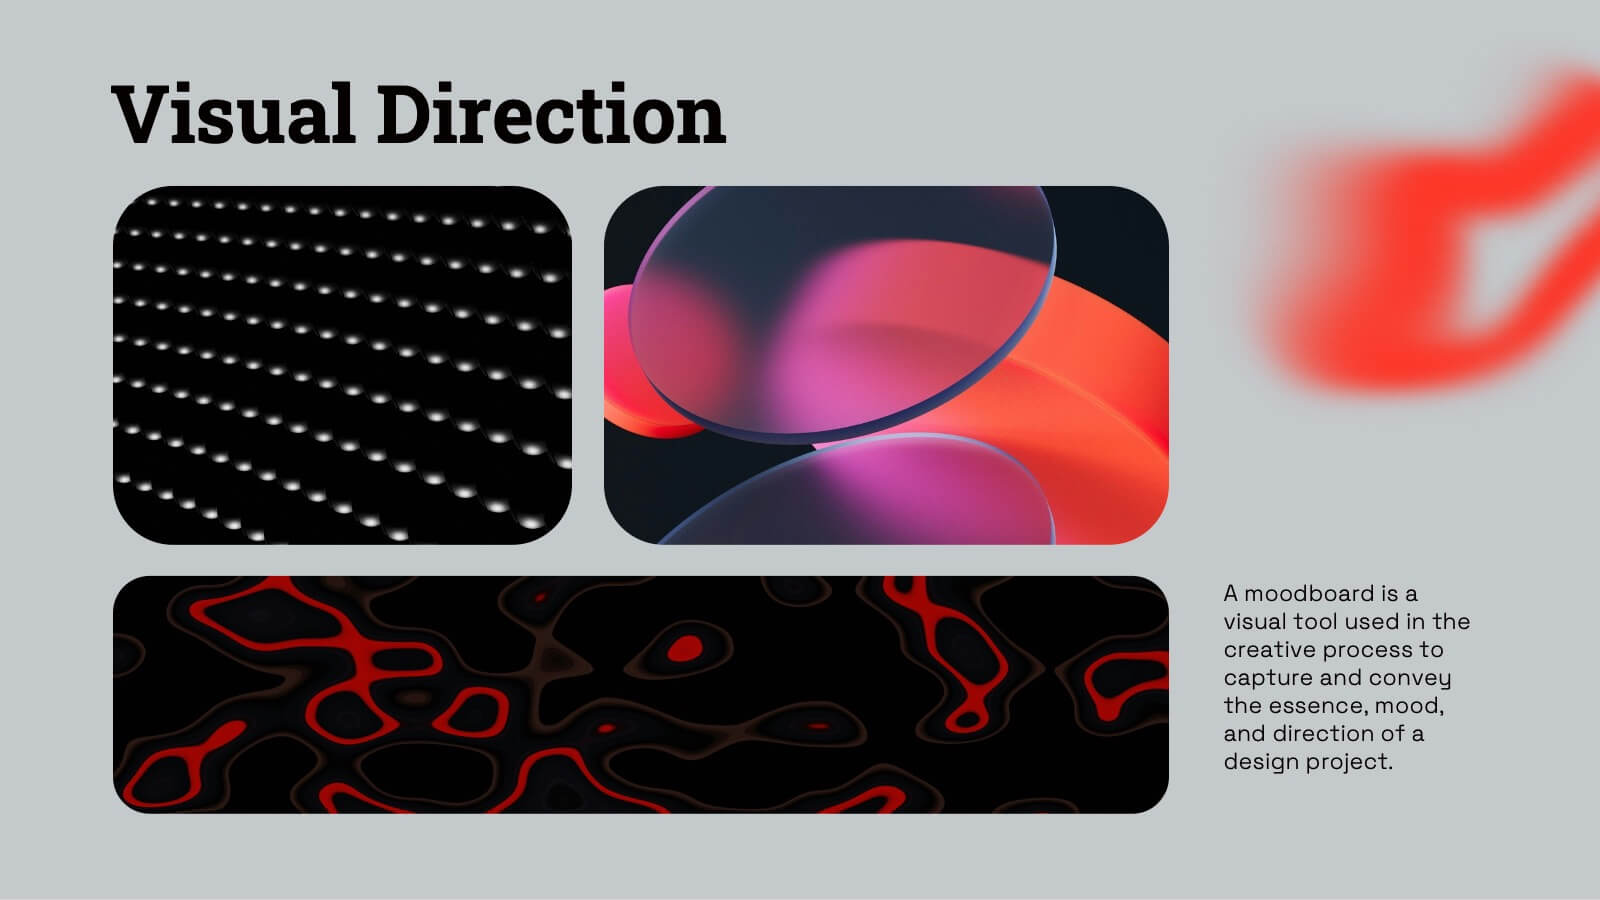
Radiant Graphic Design Project Plan Presentation
Unleash your creativity with this bold and dynamic graphic design project plan template! Perfect for showcasing design elements, textures, and typography, this template guides you through every phase, from concept development and prototyping to feedback and final presentations. Ideal for visual direction and design asset management, it’s fully compatible with PowerPoint, Keynote, and Google Slides for seamless use.


23 diapositivas
Wendigo Agency Portfolio Presentation
This sleek agency portfolio template showcases your mission, services, and success stories with modern flair. From case studies and strategy development to campaign execution and client testimonials, it’s designed to highlight your agency’s strengths. Perfect for agency presentations across PowerPoint, Keynote, and Google Slides, this template makes your content shine effortlessly.


7 diapositivas
RAPID Matrix Infographic Presentation Template
RAPID stands for Recommend, Agree, Perform, Input and Decide. The RAPID Matrix is a popular tool used to determine project planning and decision-making responsibilities. It helps ensure that the right people are involved at the right time, with the right knowledge and skills. This template makes it easy for anyone to efficiently take notes. Use it to share information on your company, business plan or vision, or for a brainstorming session with your team. Take your presentation to the next level with this easy-to-personalize template and eye catching infographic with tips for using it.


8 diapositivas
Early Detection and Prevention of Breast Cancer Presentation
Take a proactive approach to health with the Early Detection and Prevention of Breast Cancer template, designed to emphasize essential awareness and prevention strategies. This template, compatible with PowerPoint, Keynote, and Google Slides, uses intuitive icons and a clean design to effectively communicate key prevention measures and screening importance, ideal for healthcare seminars and community health initiatives.


4 diapositivas
Airline Industry Analysis and Growth Presentation
Navigate the future of aviation with the Airline Industry Analysis and Growth presentation. This template uses a dynamic runway visual to highlight four key metrics, trends, or milestones—ideal for tracking airline performance, market share, or industry forecasts. Best for aviation analysts, transport consultants, and business development teams. Fully editable in PowerPoint, Keynote, and Google Slides.


21 diapositivas
Naga Project Proposal Presentation
Present your project with confidence using this comprehensive proposal presentation! It covers crucial sections such as objectives, methodology, timeline, budget breakdown, and risk mitigation strategies, ensuring every detail is addressed clearly. Ideal for client proposals or internal planning, this template works seamlessly with PowerPoint, Keynote, and Google Slides.


19 diapositivas
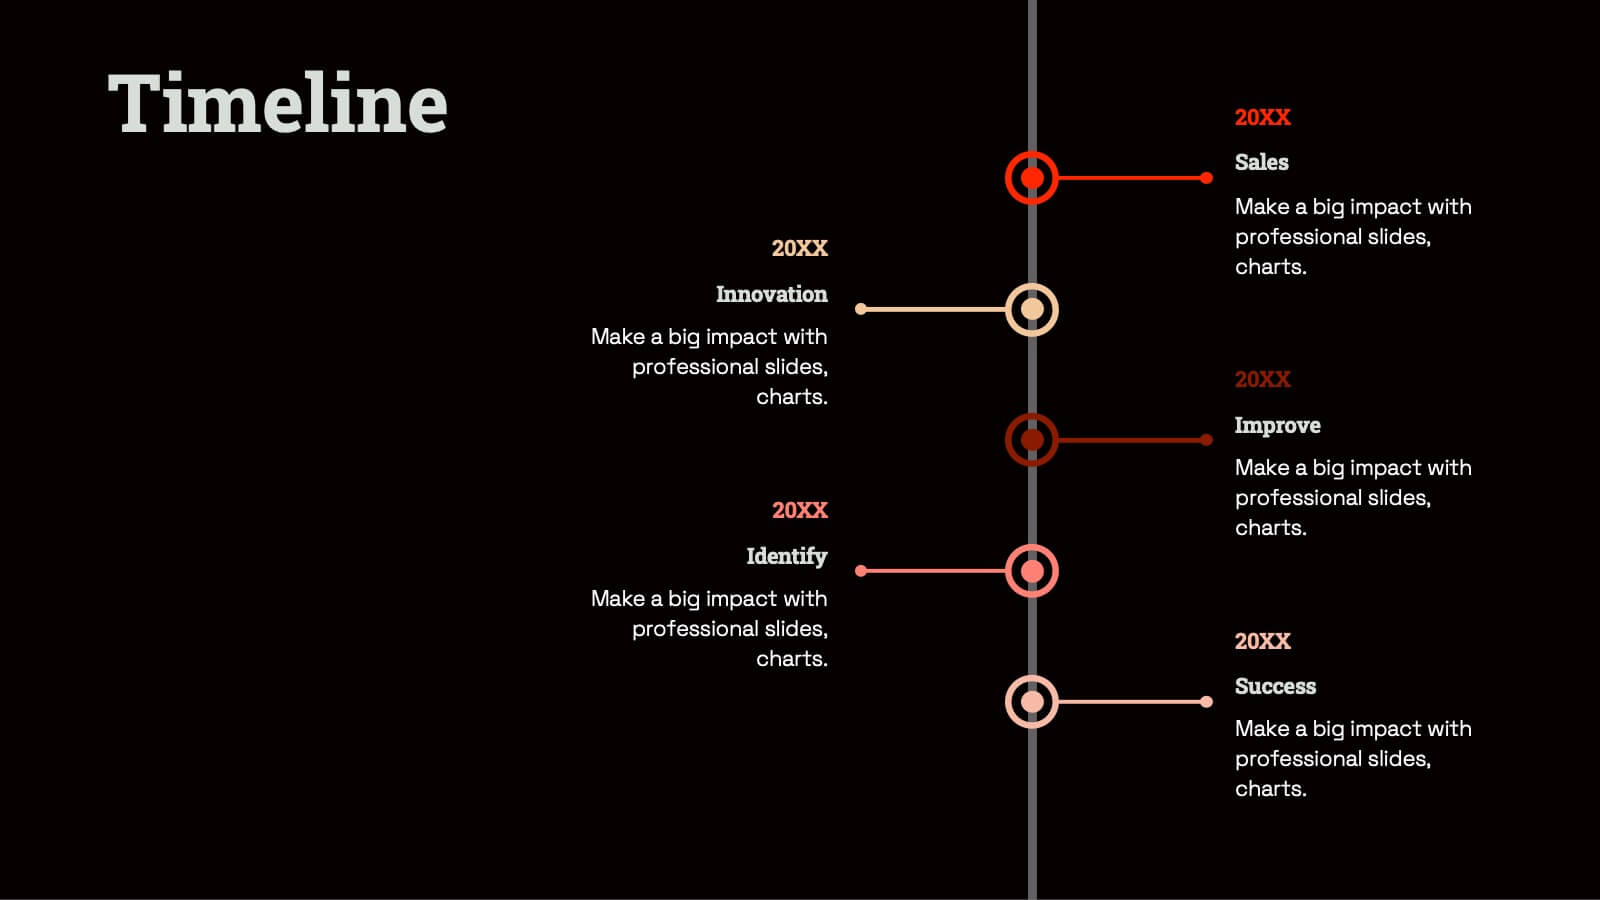
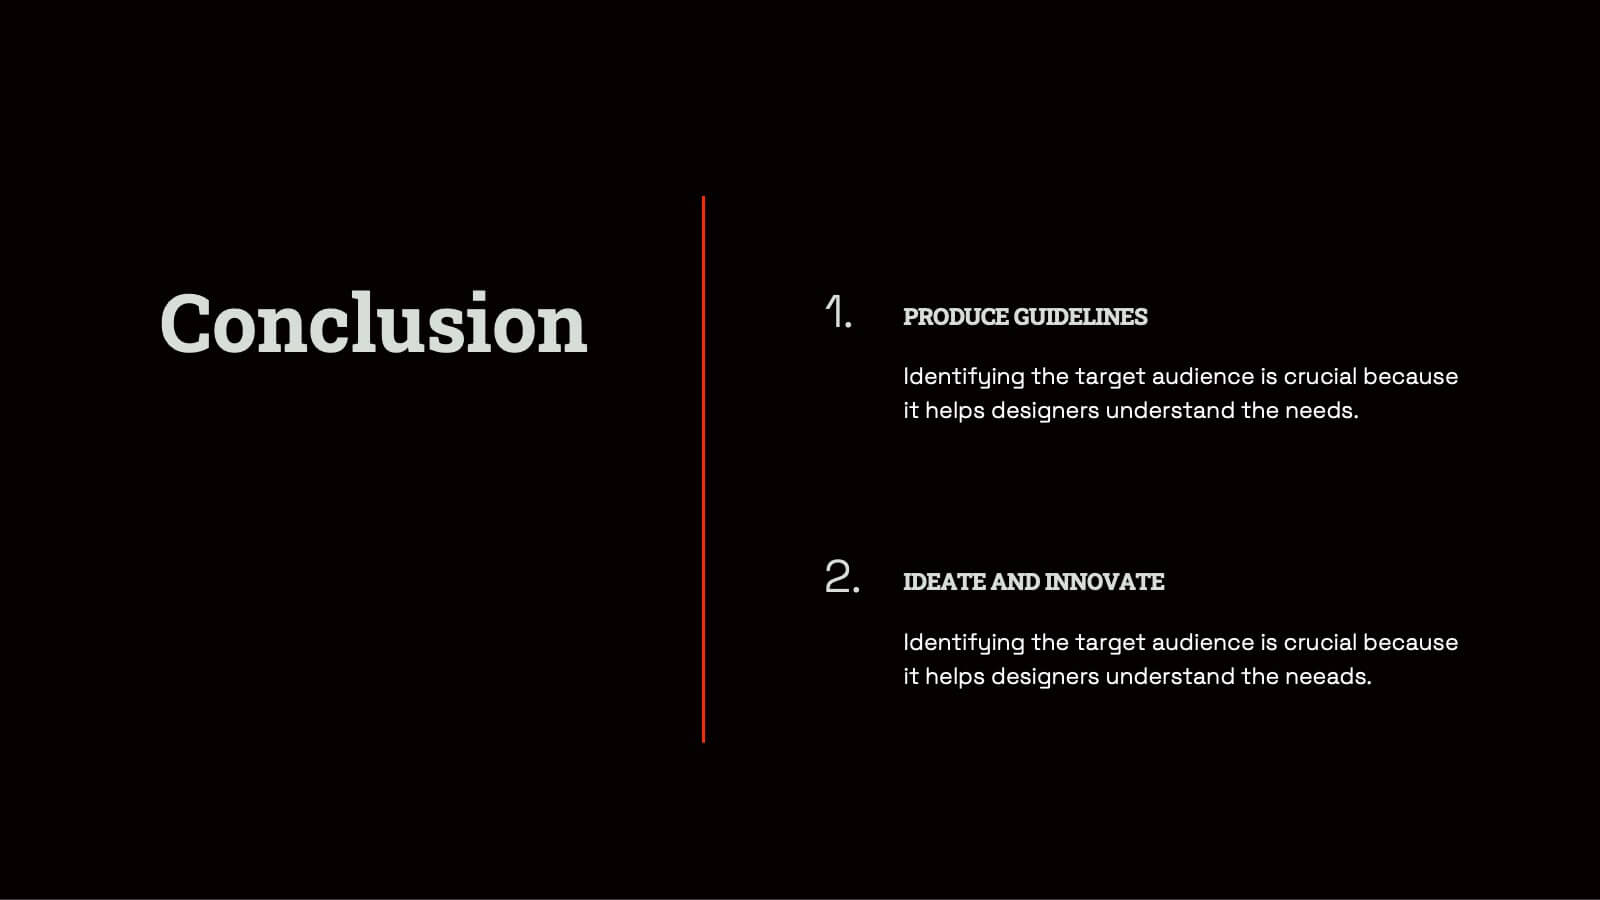
Kinetic Sales Forecast Presentation
Forecast your sales with style using this vibrant template! Perfect for detailing company overview, sales process, team, and strategy. Includes sections for case studies, pricing, and future opportunities. Ideal for sales teams to impress stakeholders. Compatible with PowerPoint, Keynote, and Google Slides.


20 diapositivas
Falcon Digital Marketing Strategy Plan Presentation
Develop a winning marketing strategy with this dynamic template. Dive into current trends, consumer behavior, and innovative techniques. Perfect for social media, influencer marketing, and data-driven campaigns. Fully compatible with PowerPoint, Keynote, and Google Slides.