


Características


¿Tienes alguna pregunta?
Recomendar


21 diapositivas
Stellar Content Marketing Pitch Deck Presentation
The Stellar Marketing Pitch Deck template is designed to make your marketing strategies shine like never before! This template is perfect for showcasing your business's potential and engaging your audience with sleek, modern designs that capture attention. Start with a powerful introduction, leading into an in-depth industry overview that highlights key trends and consumer behaviors. With dedicated sections for emerging technologies, content marketing trends, and data-driven marketing, you'll have everything you need to present your innovative approach. The template also includes slides for social media strategies, influencer marketing, and SEO trends, ensuring you're covering all the bases. Personalization trends and video marketing evolution are featured to show your forward-thinking approach, while the customer experience focus slide emphasizes your commitment to quality. Finish strong with insights into e-commerce trends, brand storytelling, and sustainability in marketing. This template is fully compatible with PowerPoint, Keynote, and Google Slides, making it versatile and easy to use for any marketing presentation.


21 diapositivas
Carmenta Project Management Plan Presentation
Organize your projects with clarity using this comprehensive project management plan template. It includes slides for objectives, timelines, risk management, budget breakdowns, and team introductions. Ideal for efficient project presentations, it’s compatible with PowerPoint, Keynote, and Google Slides, offering a structured approach to showcase every project detail.


5 diapositivas
Benefits of Yoga Infographics
Yoga offers a wide range of benefits for the mind, body, and overall well-being, these also tend to deepen with regular practice. These infographic templates highlight the numerous advantages of practicing yoga. Whether you're a yoga instructor, wellness coach, or health enthusiast, this template provides a comprehensive overview of the physical, mental, and emotional benefits of yoga. The infographics include text boxes, illustrations, and graphs that can be used to promote the advantages of incorporating yoga into one's lifestyle. Compatible with Powerpoint, Keynote, and Google Slides, these are easily customizable.


6 diapositivas
System Maintenance and Support Presentation
Streamline your technical processes with the System Maintenance and Support Presentation. This slide features a clean alphabetical list layout (A–E) paired with icons and concise text areas—ideal for illustrating maintenance protocols, support categories, or troubleshooting stages. The right-side wrench graphic adds a visual metaphor for IT upkeep. Fully editable in PowerPoint, Keynote, and Google Slides.


20 diapositivas
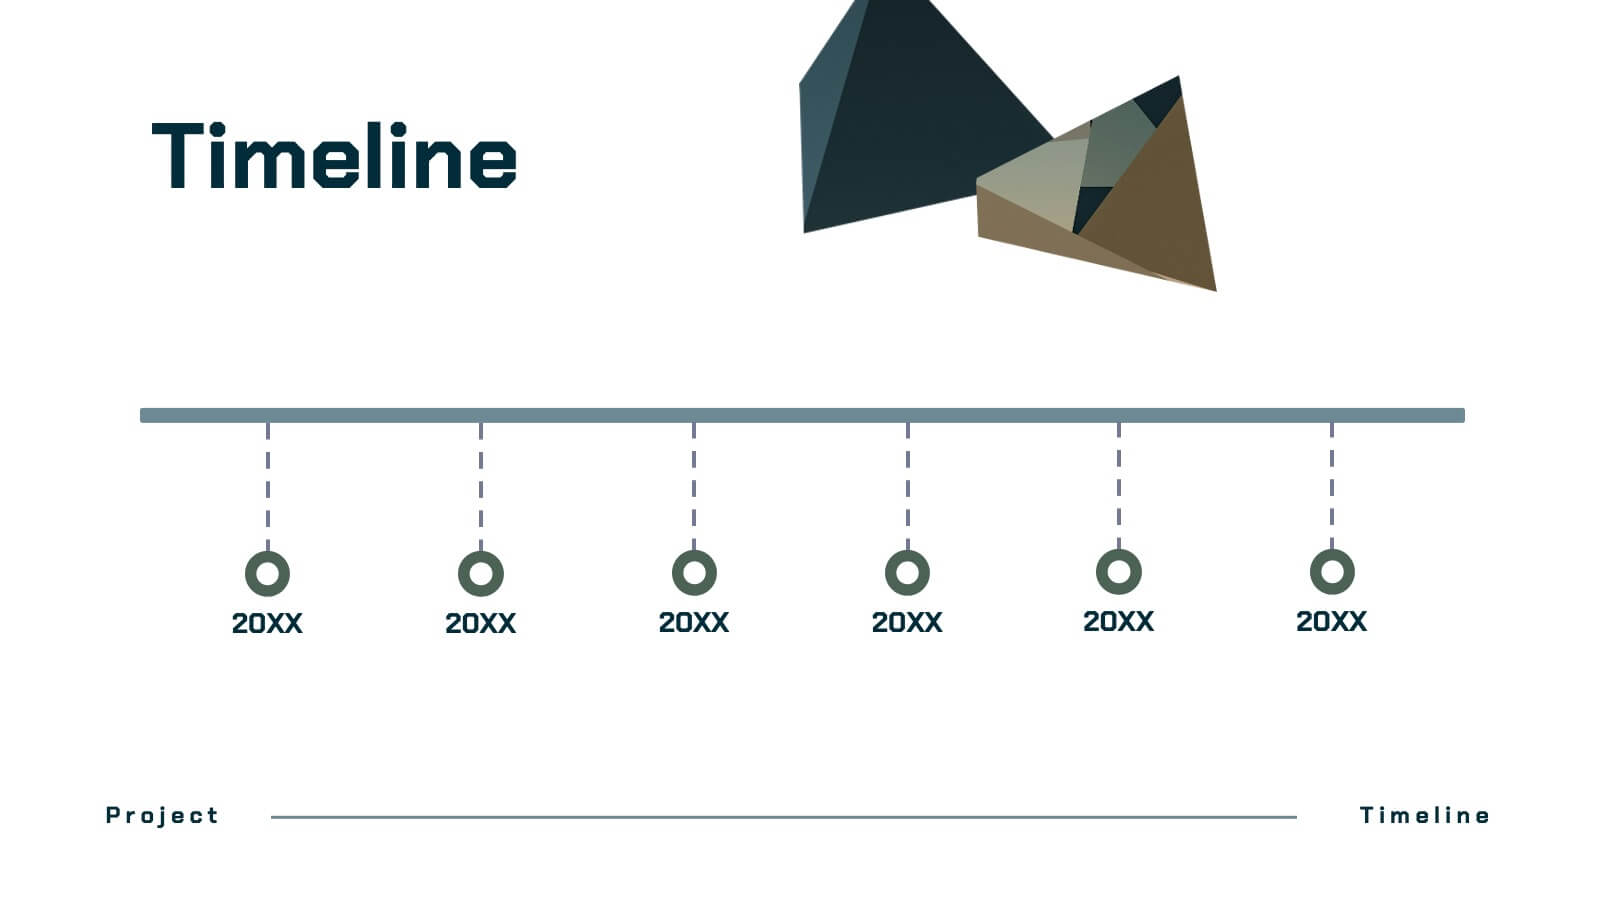
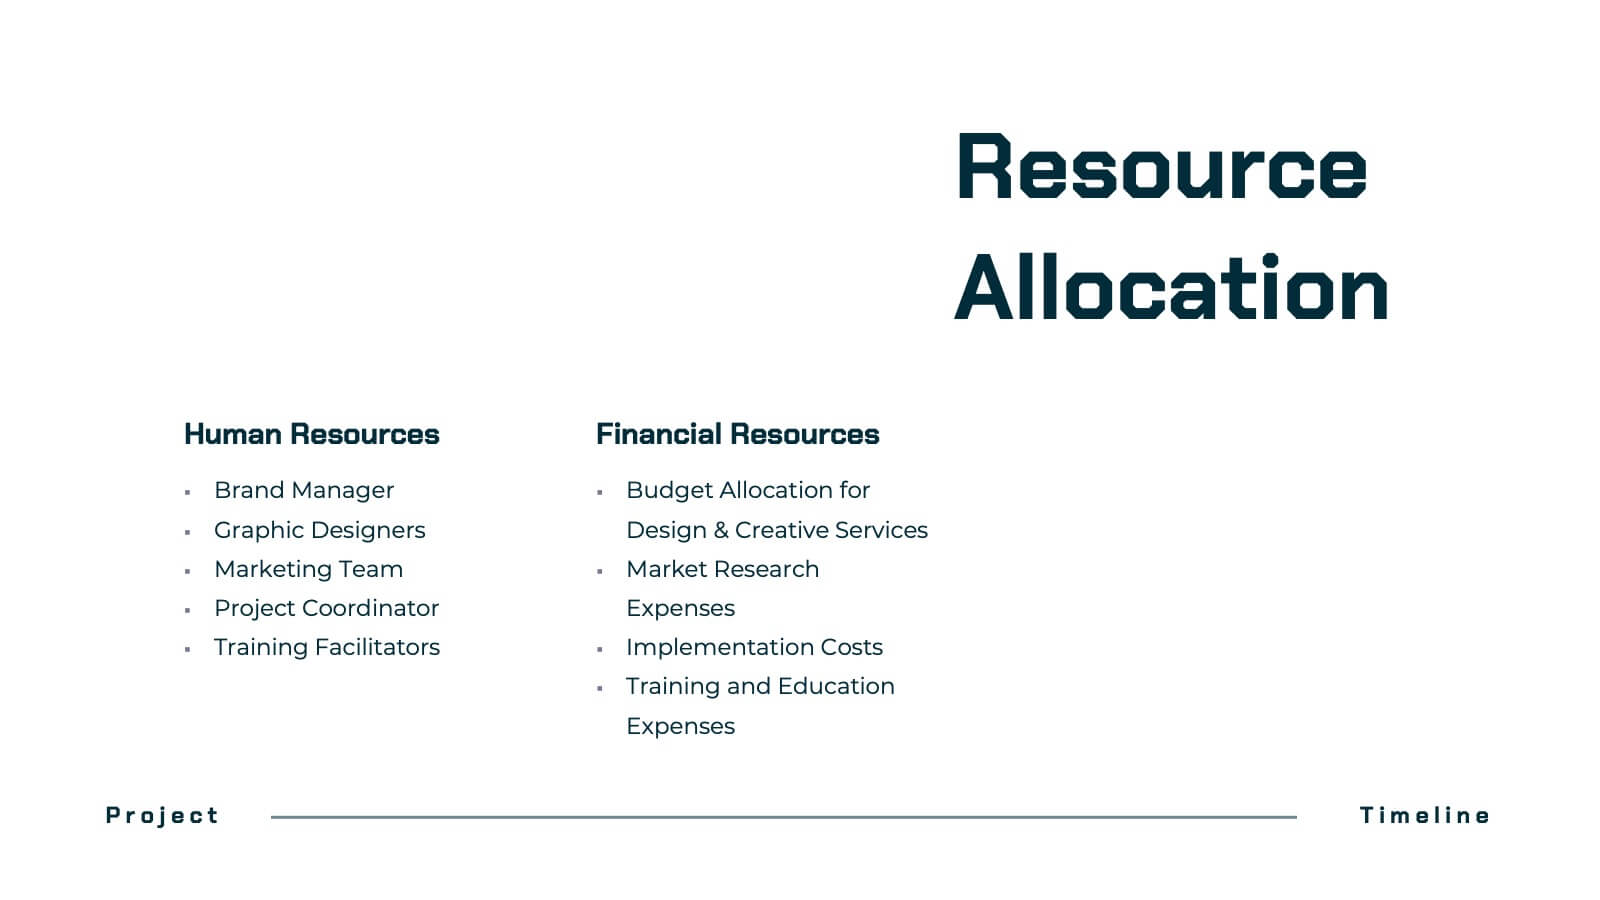
Dynastream Project Timeline Presentation
Stay on track with this detailed and well-organized project plan presentation designed for success! Covering essential areas like scope, objectives, timeline, budget breakdown, and risk management, it ensures every aspect of your project is clear and actionable. Perfect for team meetings or stakeholder updates, this template is fully compatible with PowerPoint, Keynote, and Google Slides.


22 diapositivas
Tempest Product Strategy Report Presentation
Accelerate your product strategy with this bold presentation template! Ideal for outlining your product's market opportunity, unique selling proposition, and revenue model, it includes slides for competitive analysis, marketing strategy, and financials. Impress stakeholders with dynamic visuals and clear, structured content. Compatible with PowerPoint, Keynote, and Google Slides for seamless presentations on any platform.


21 diapositivas
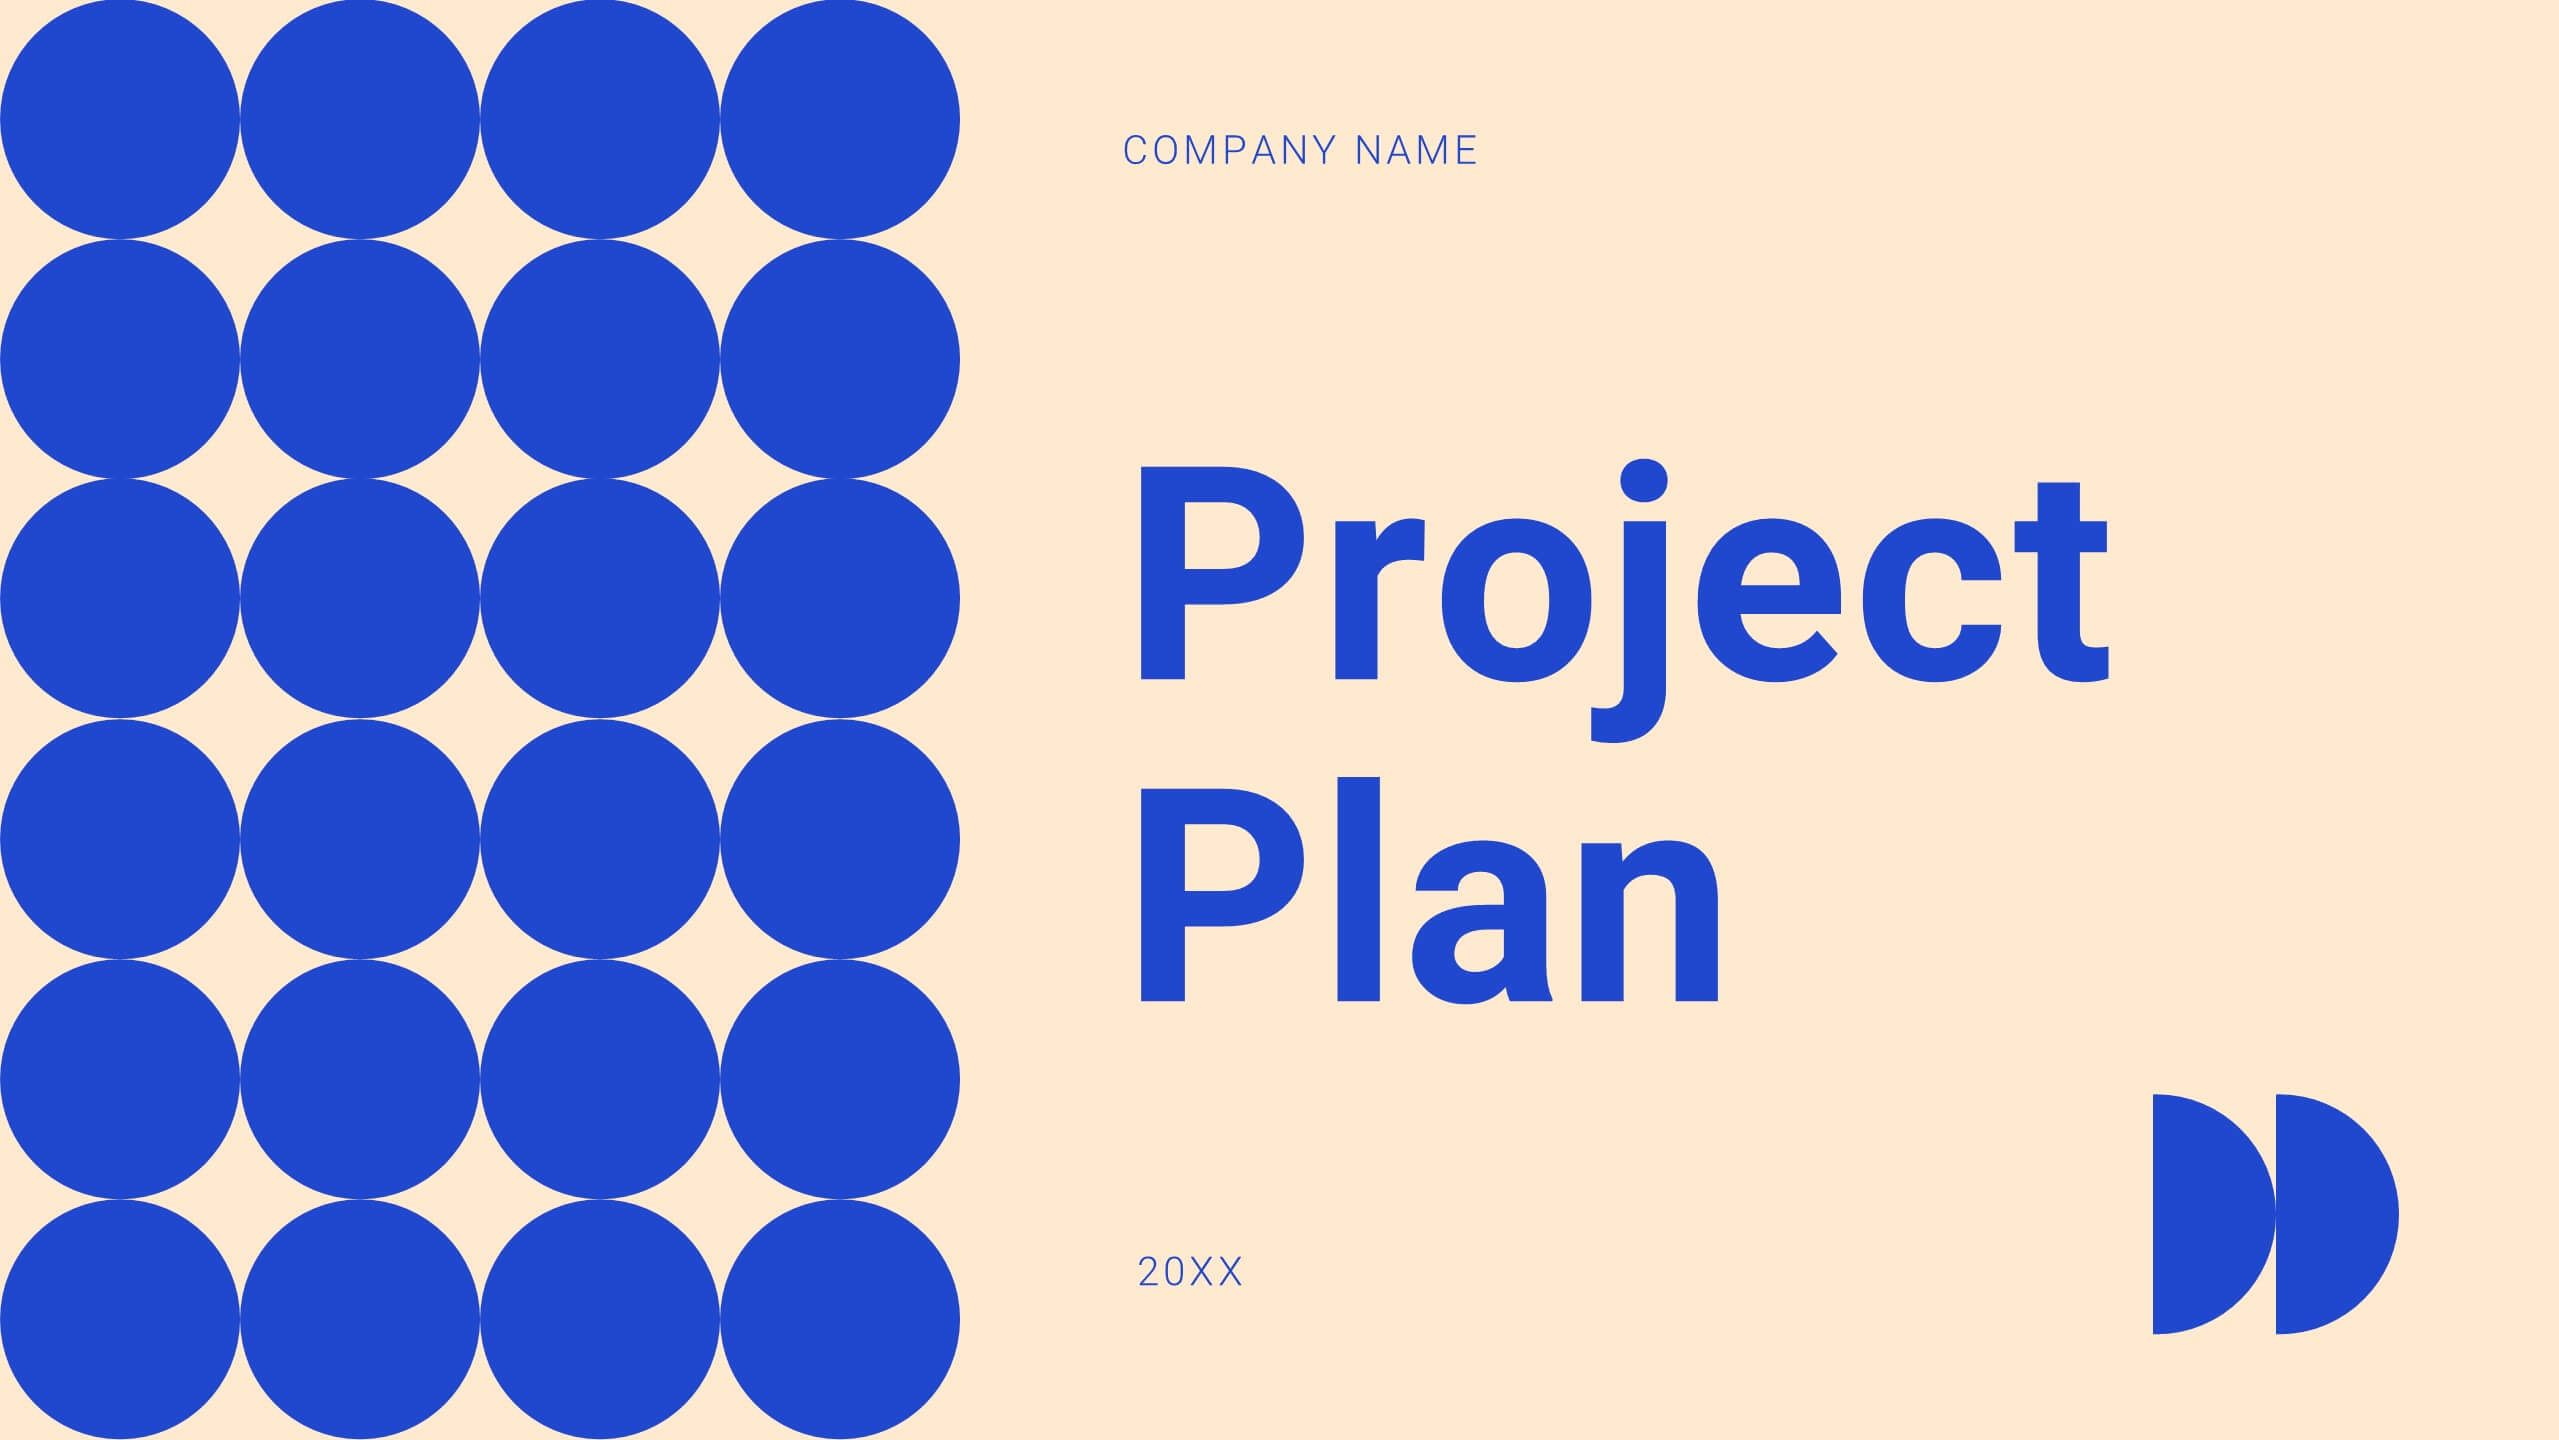
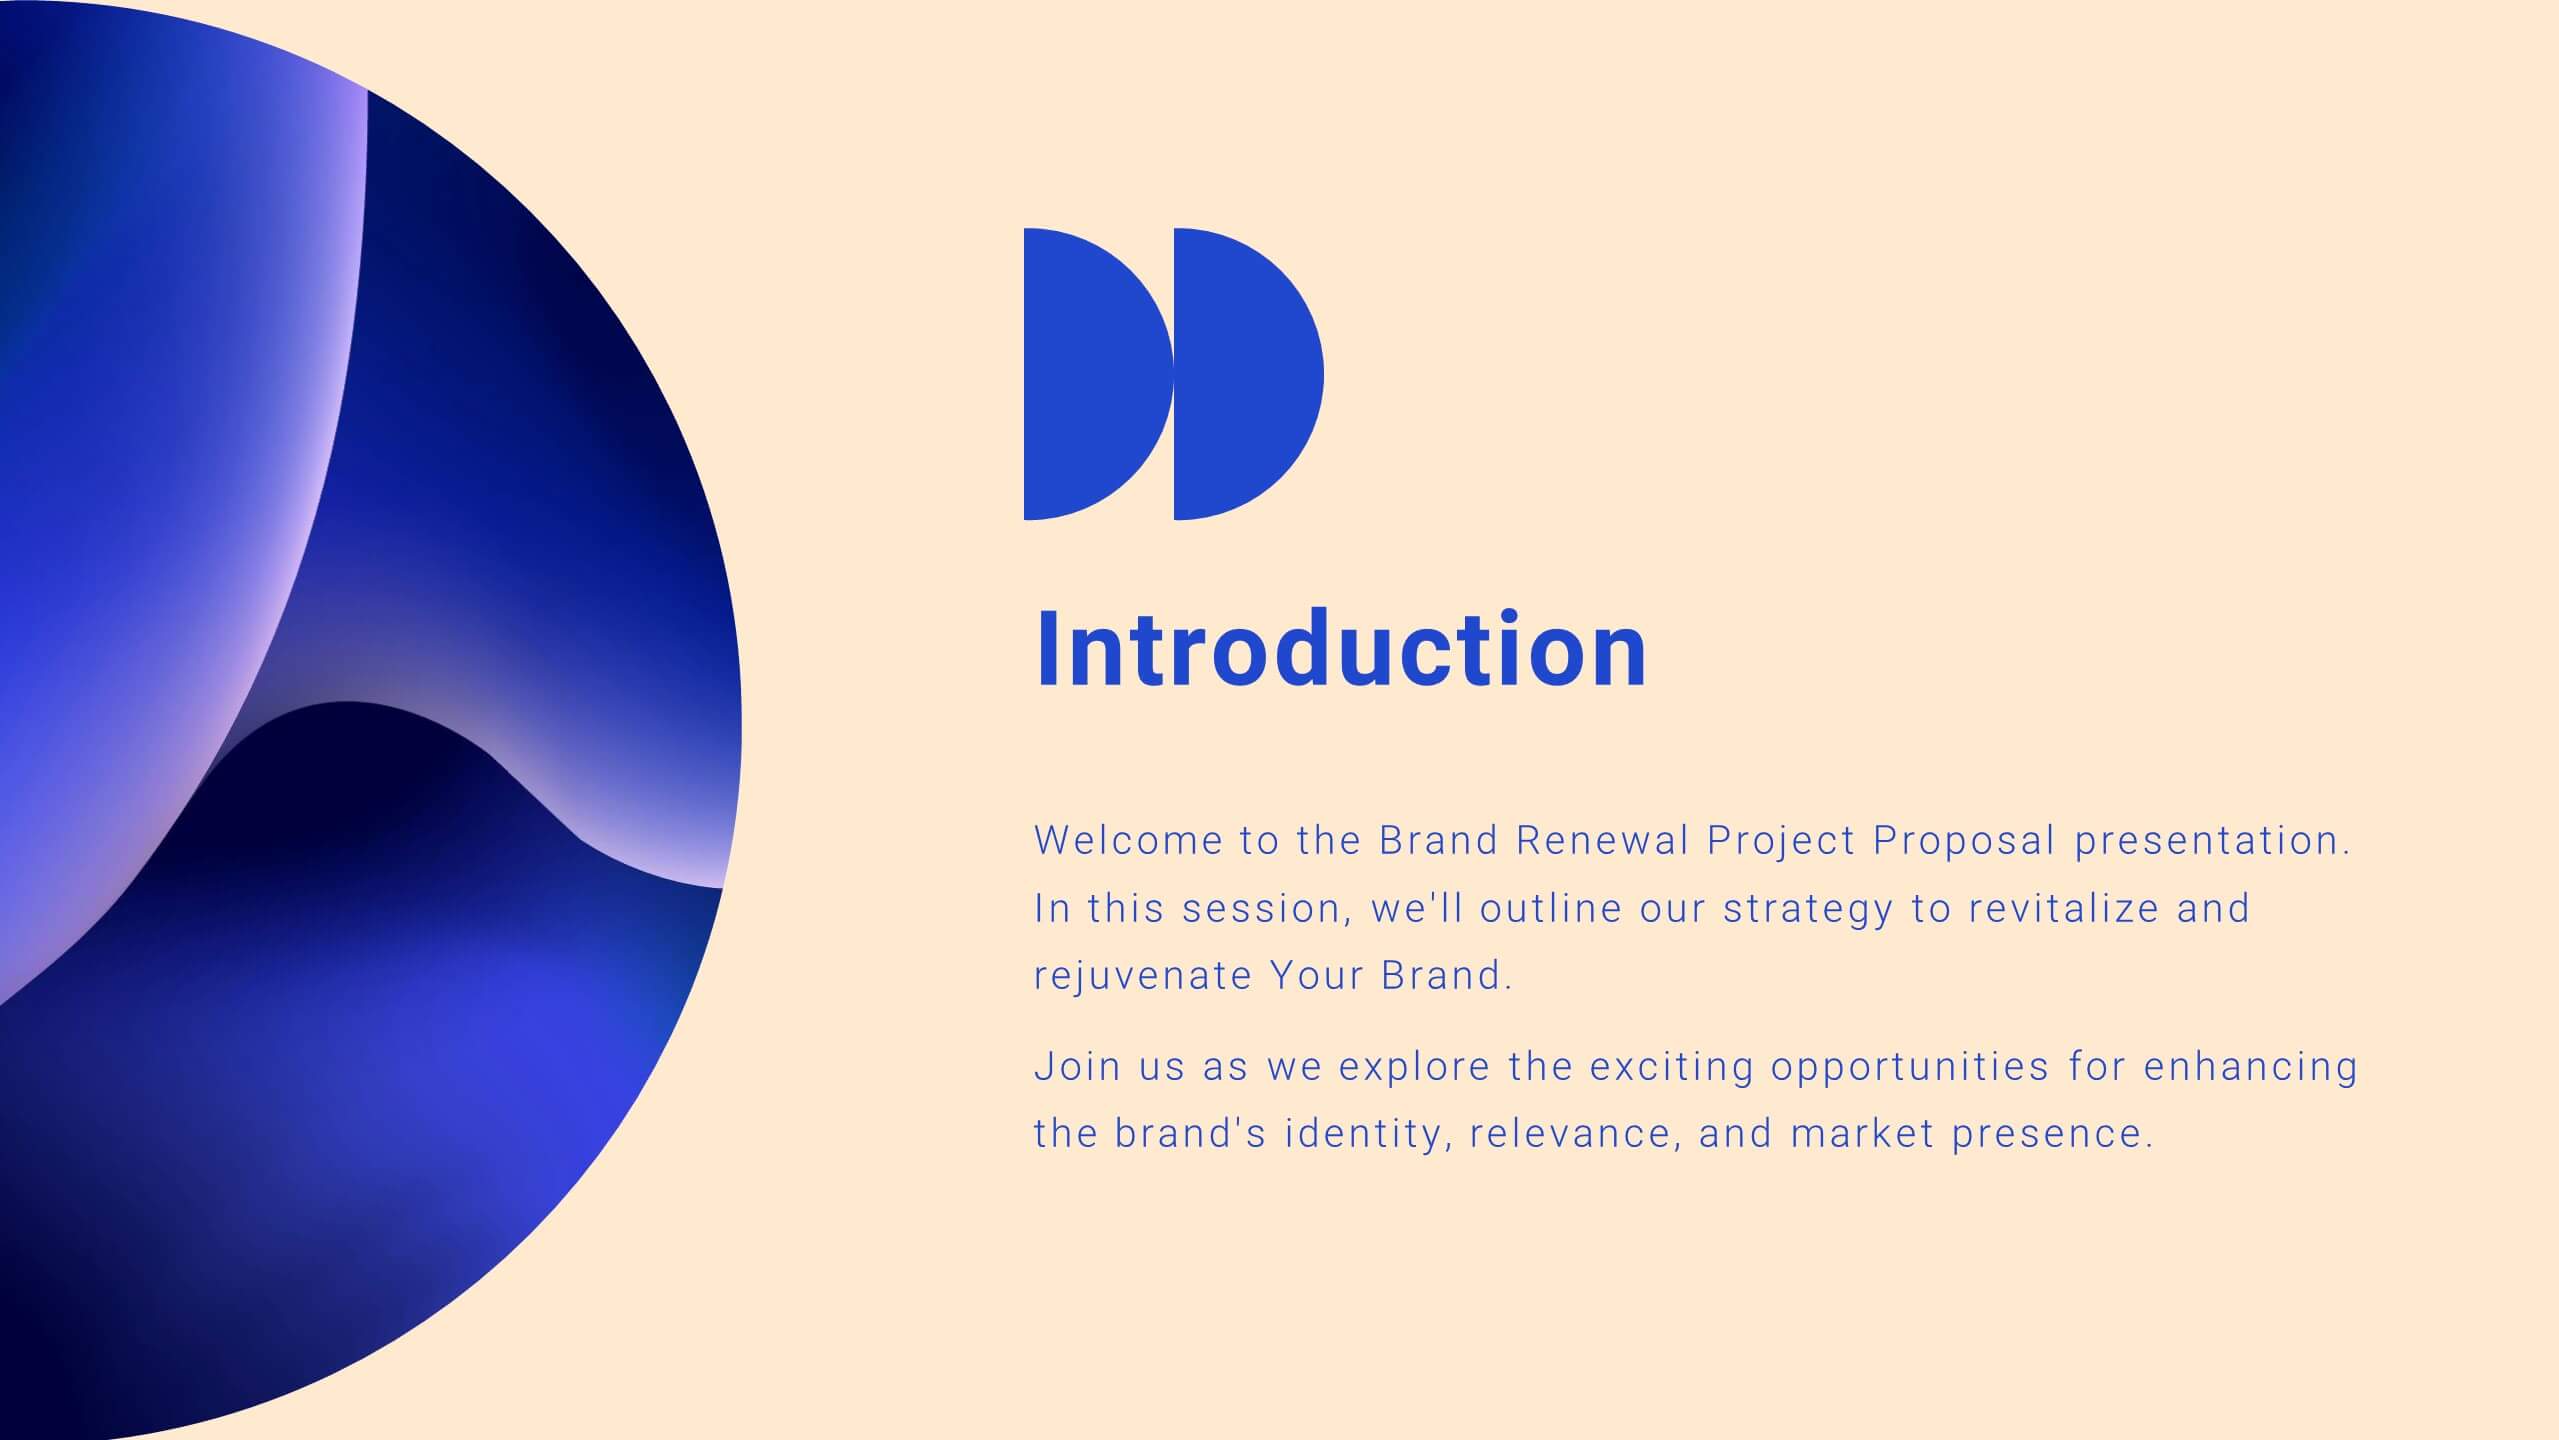
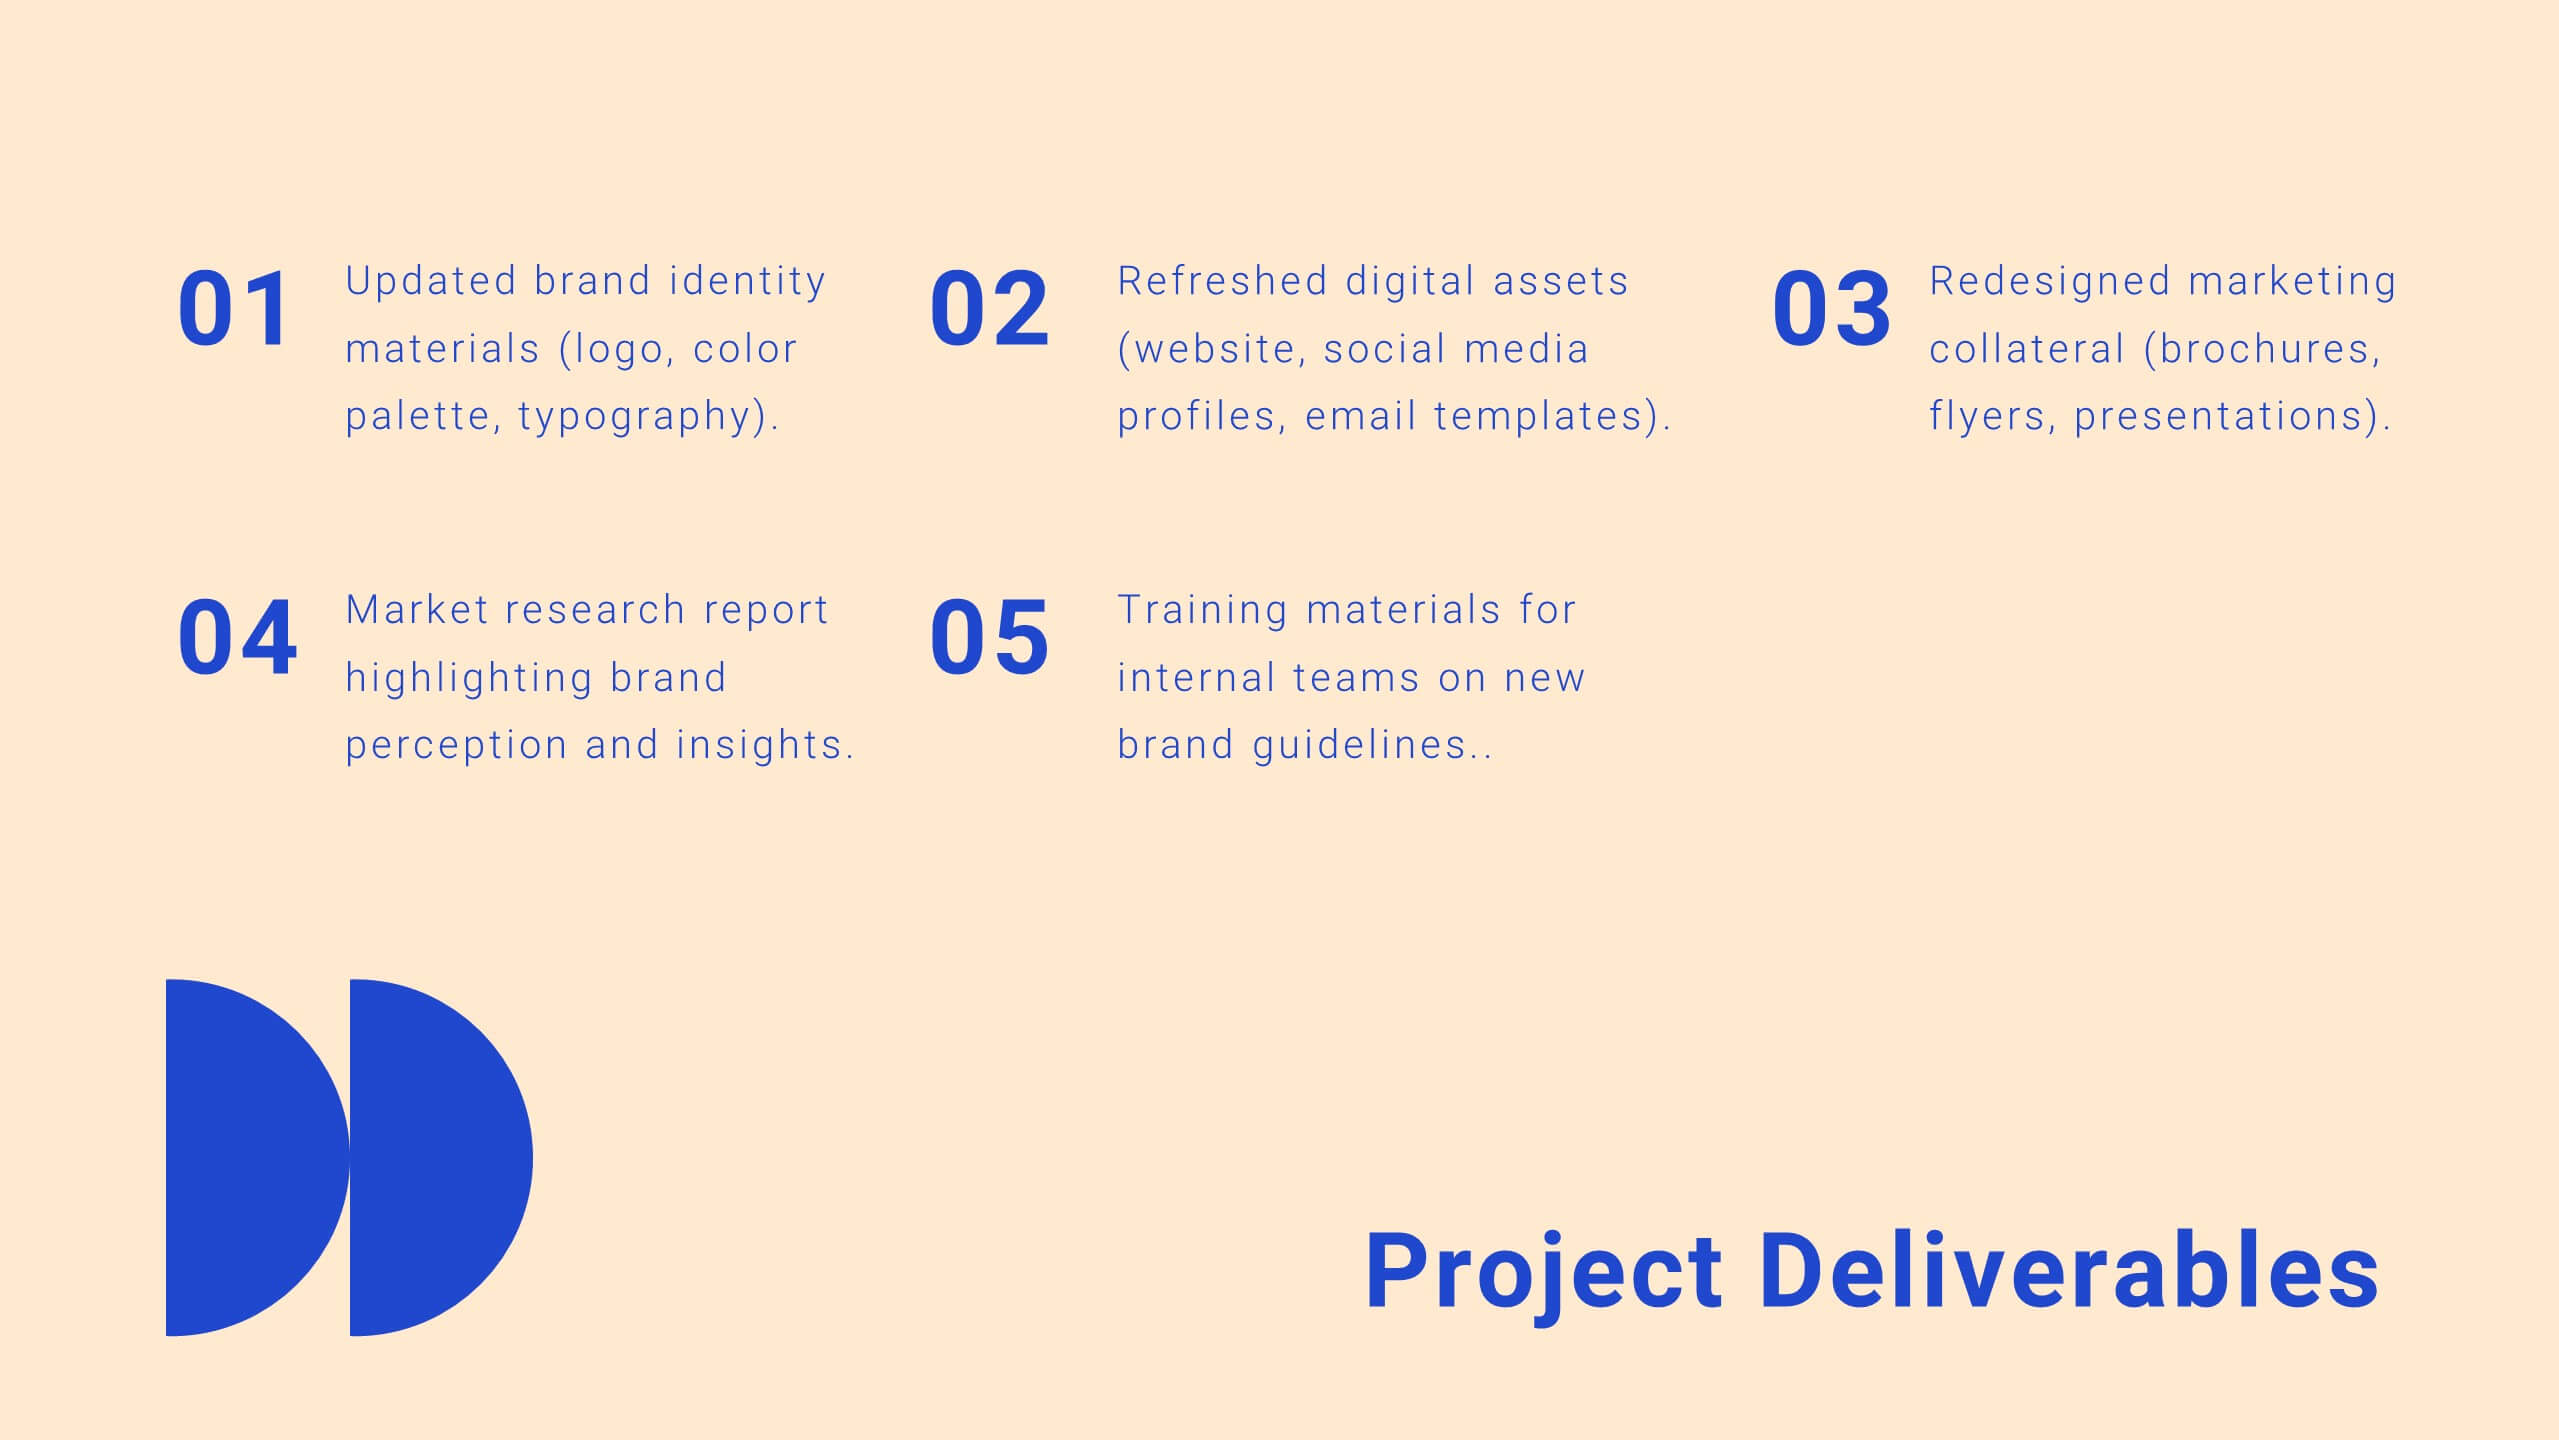
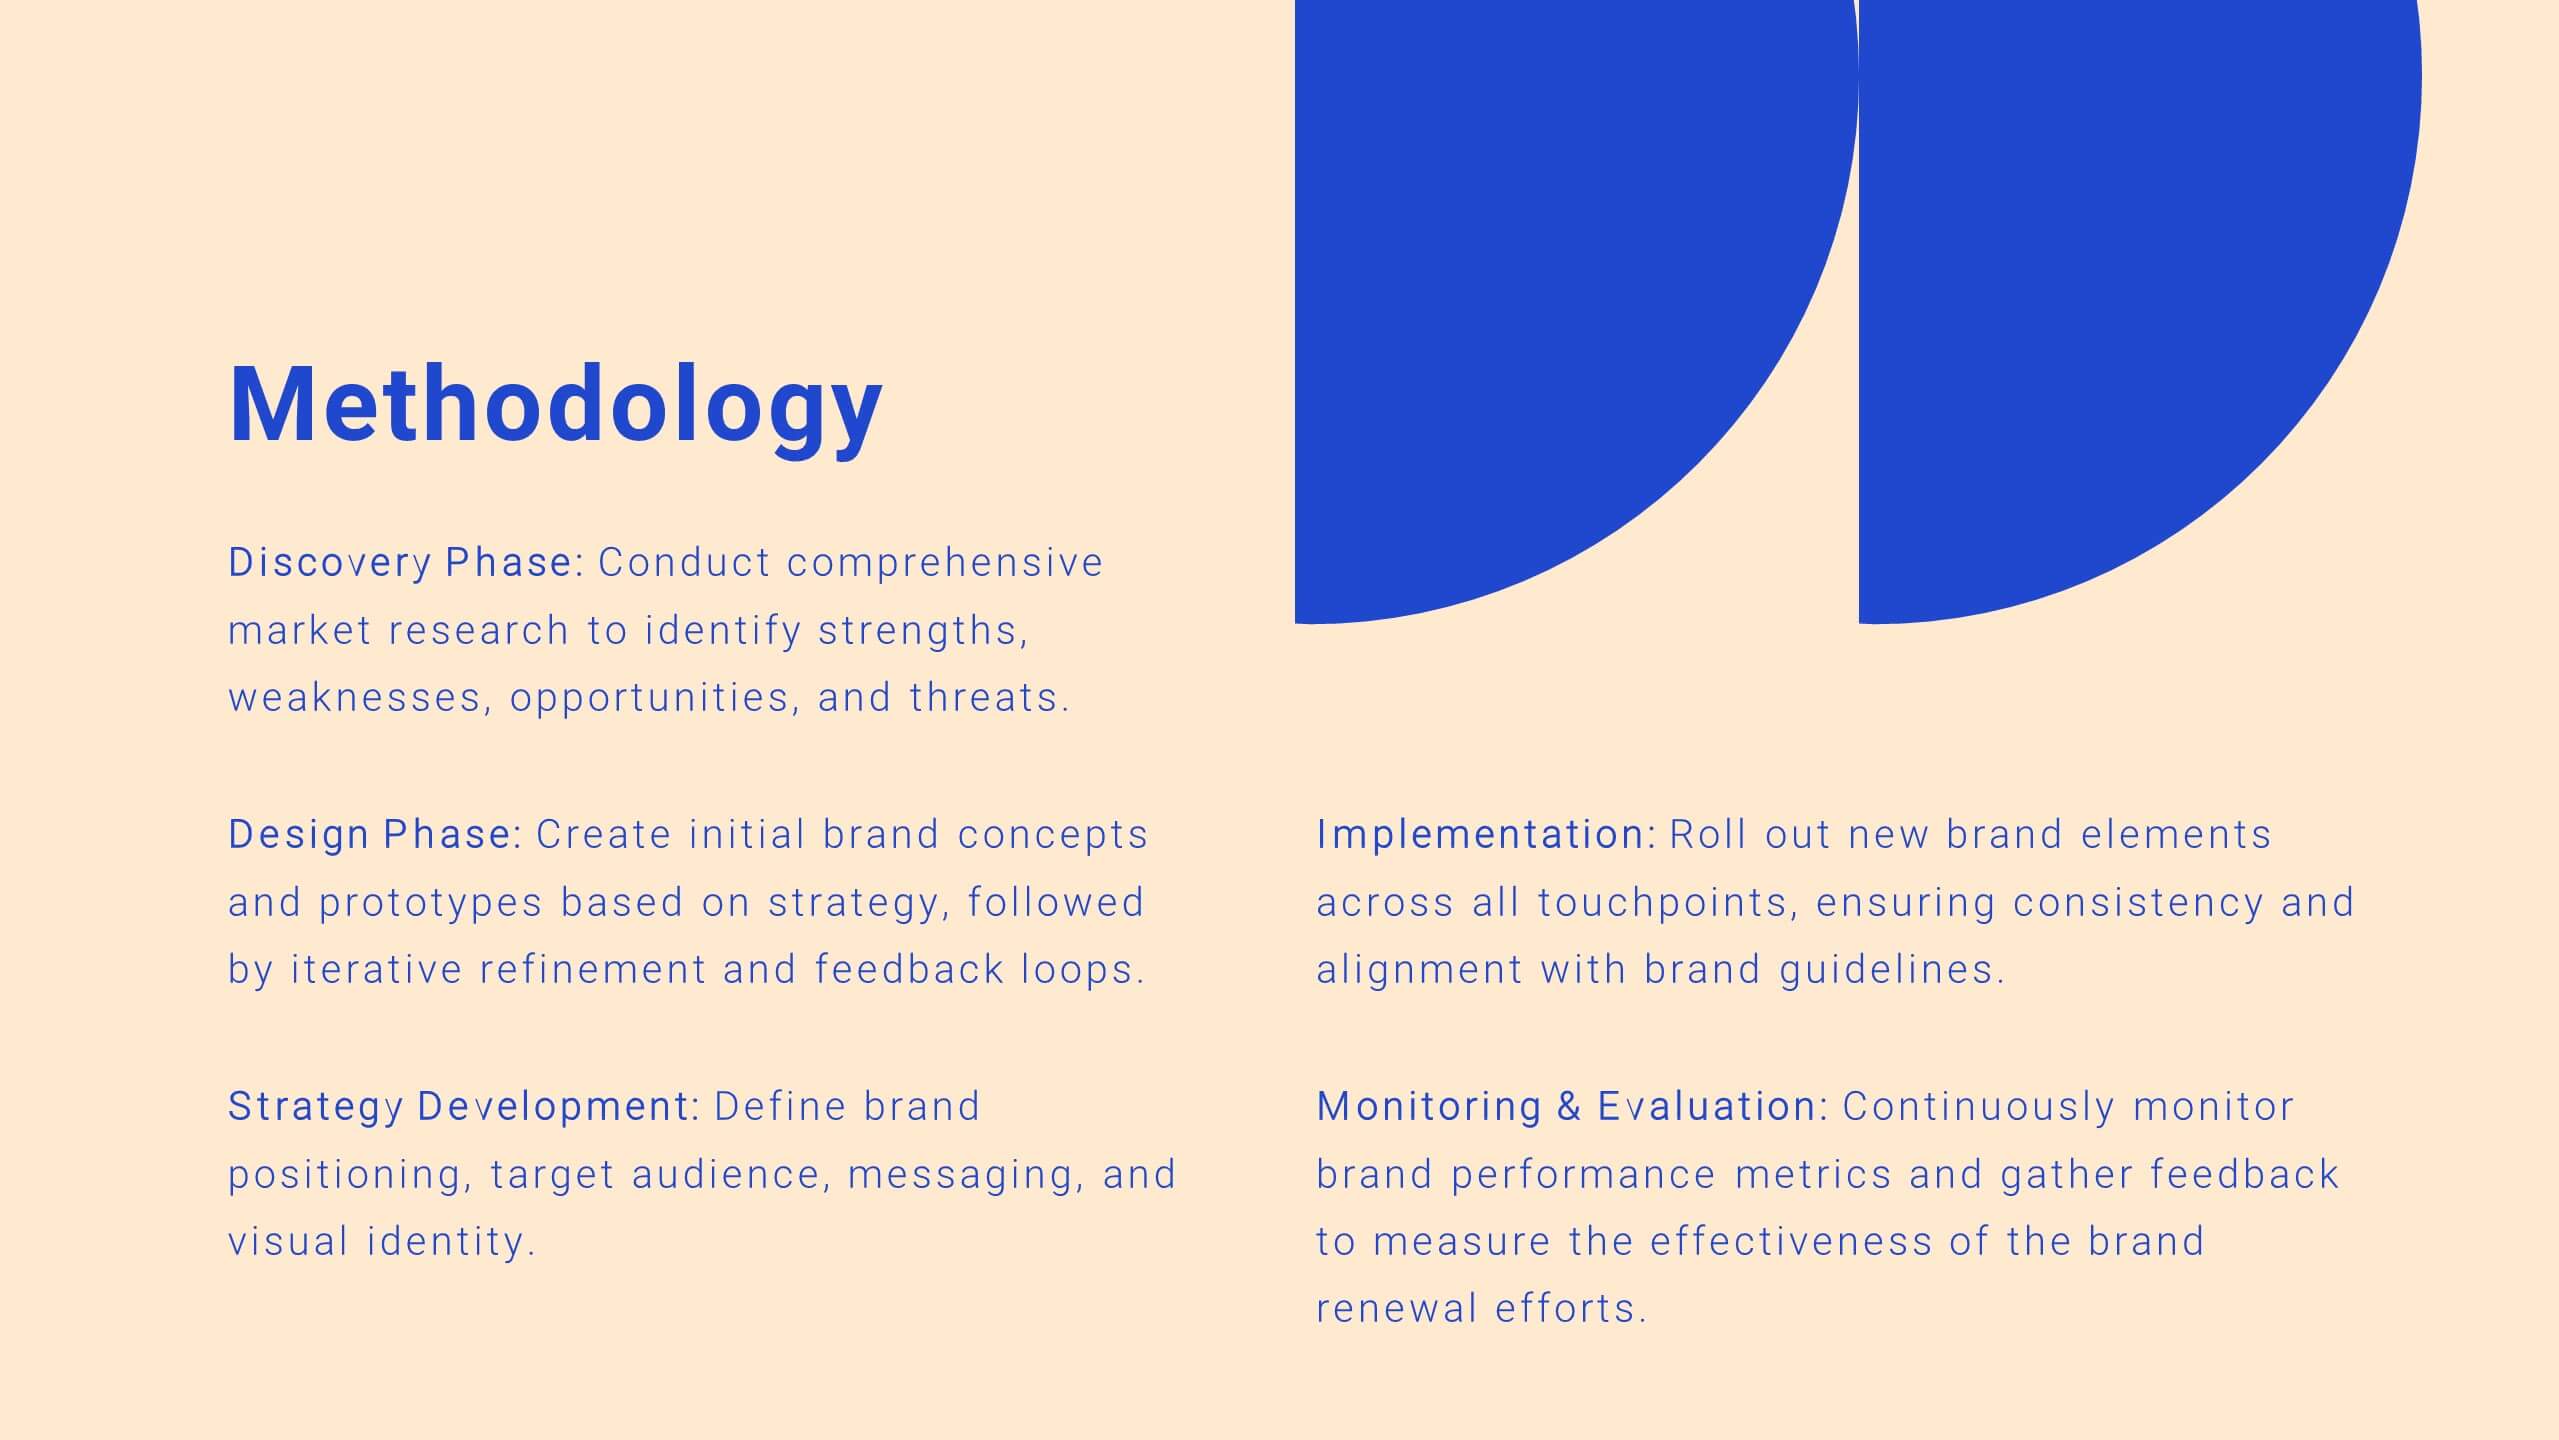
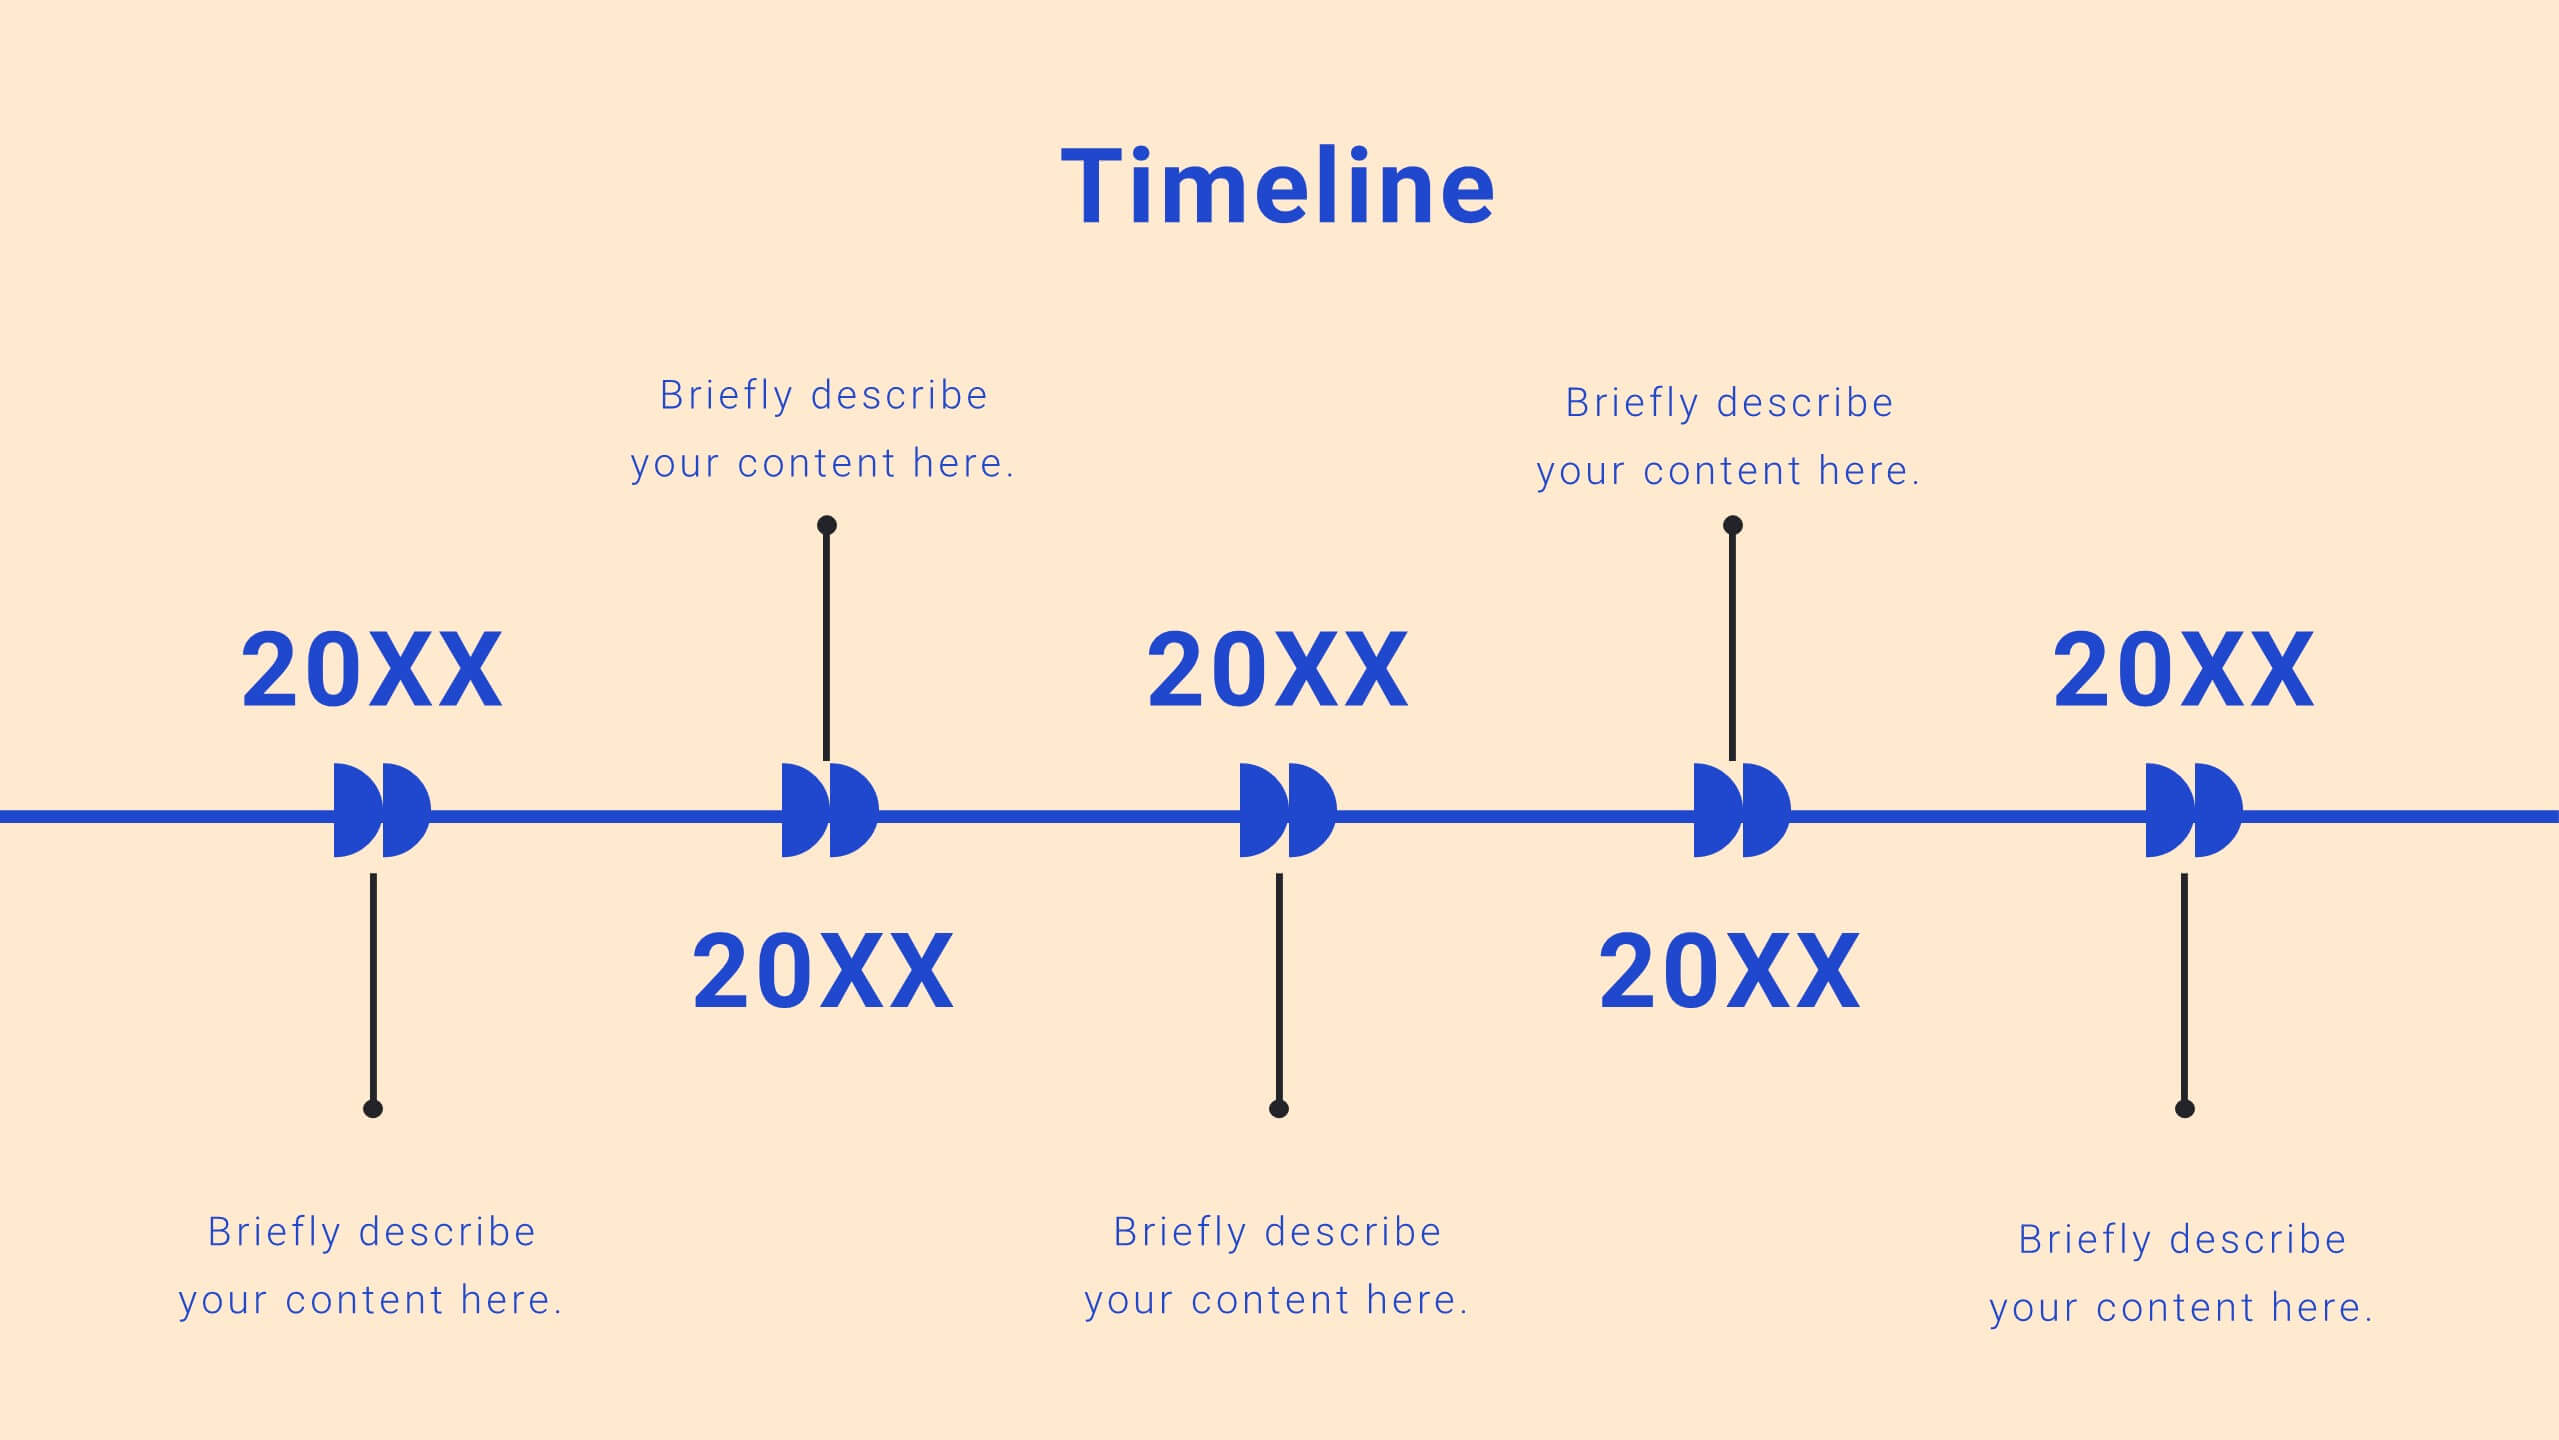
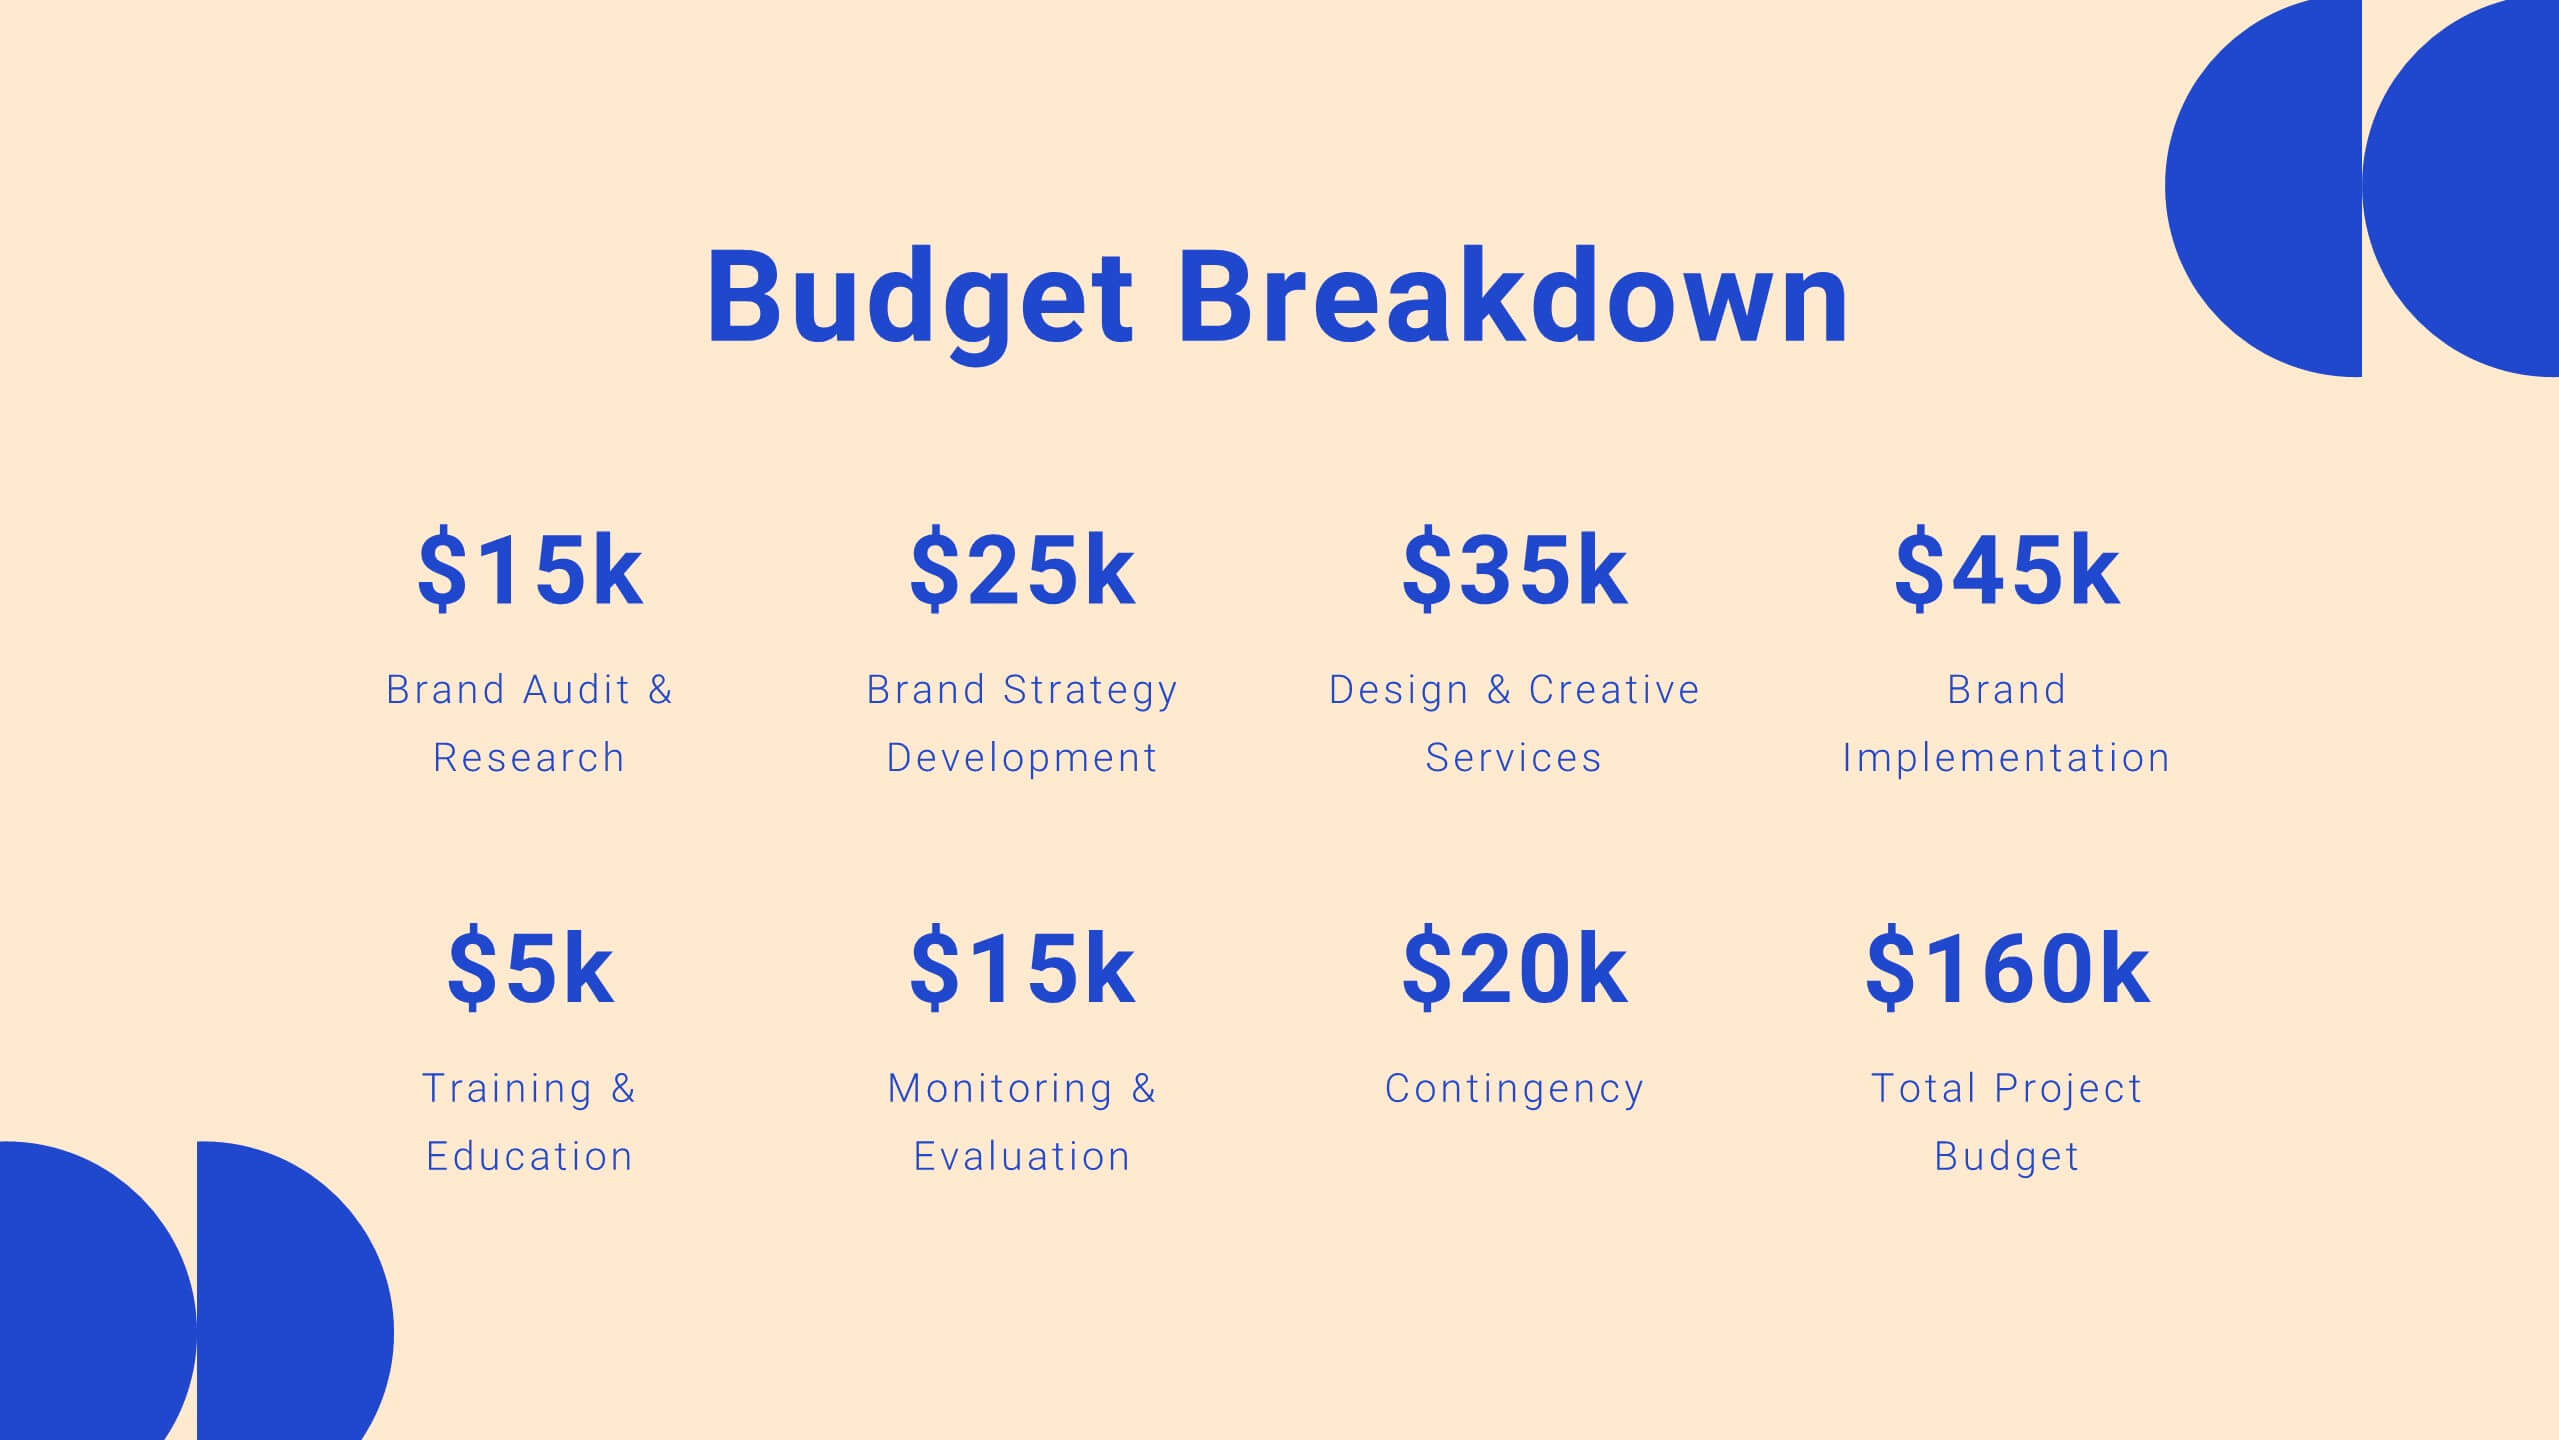
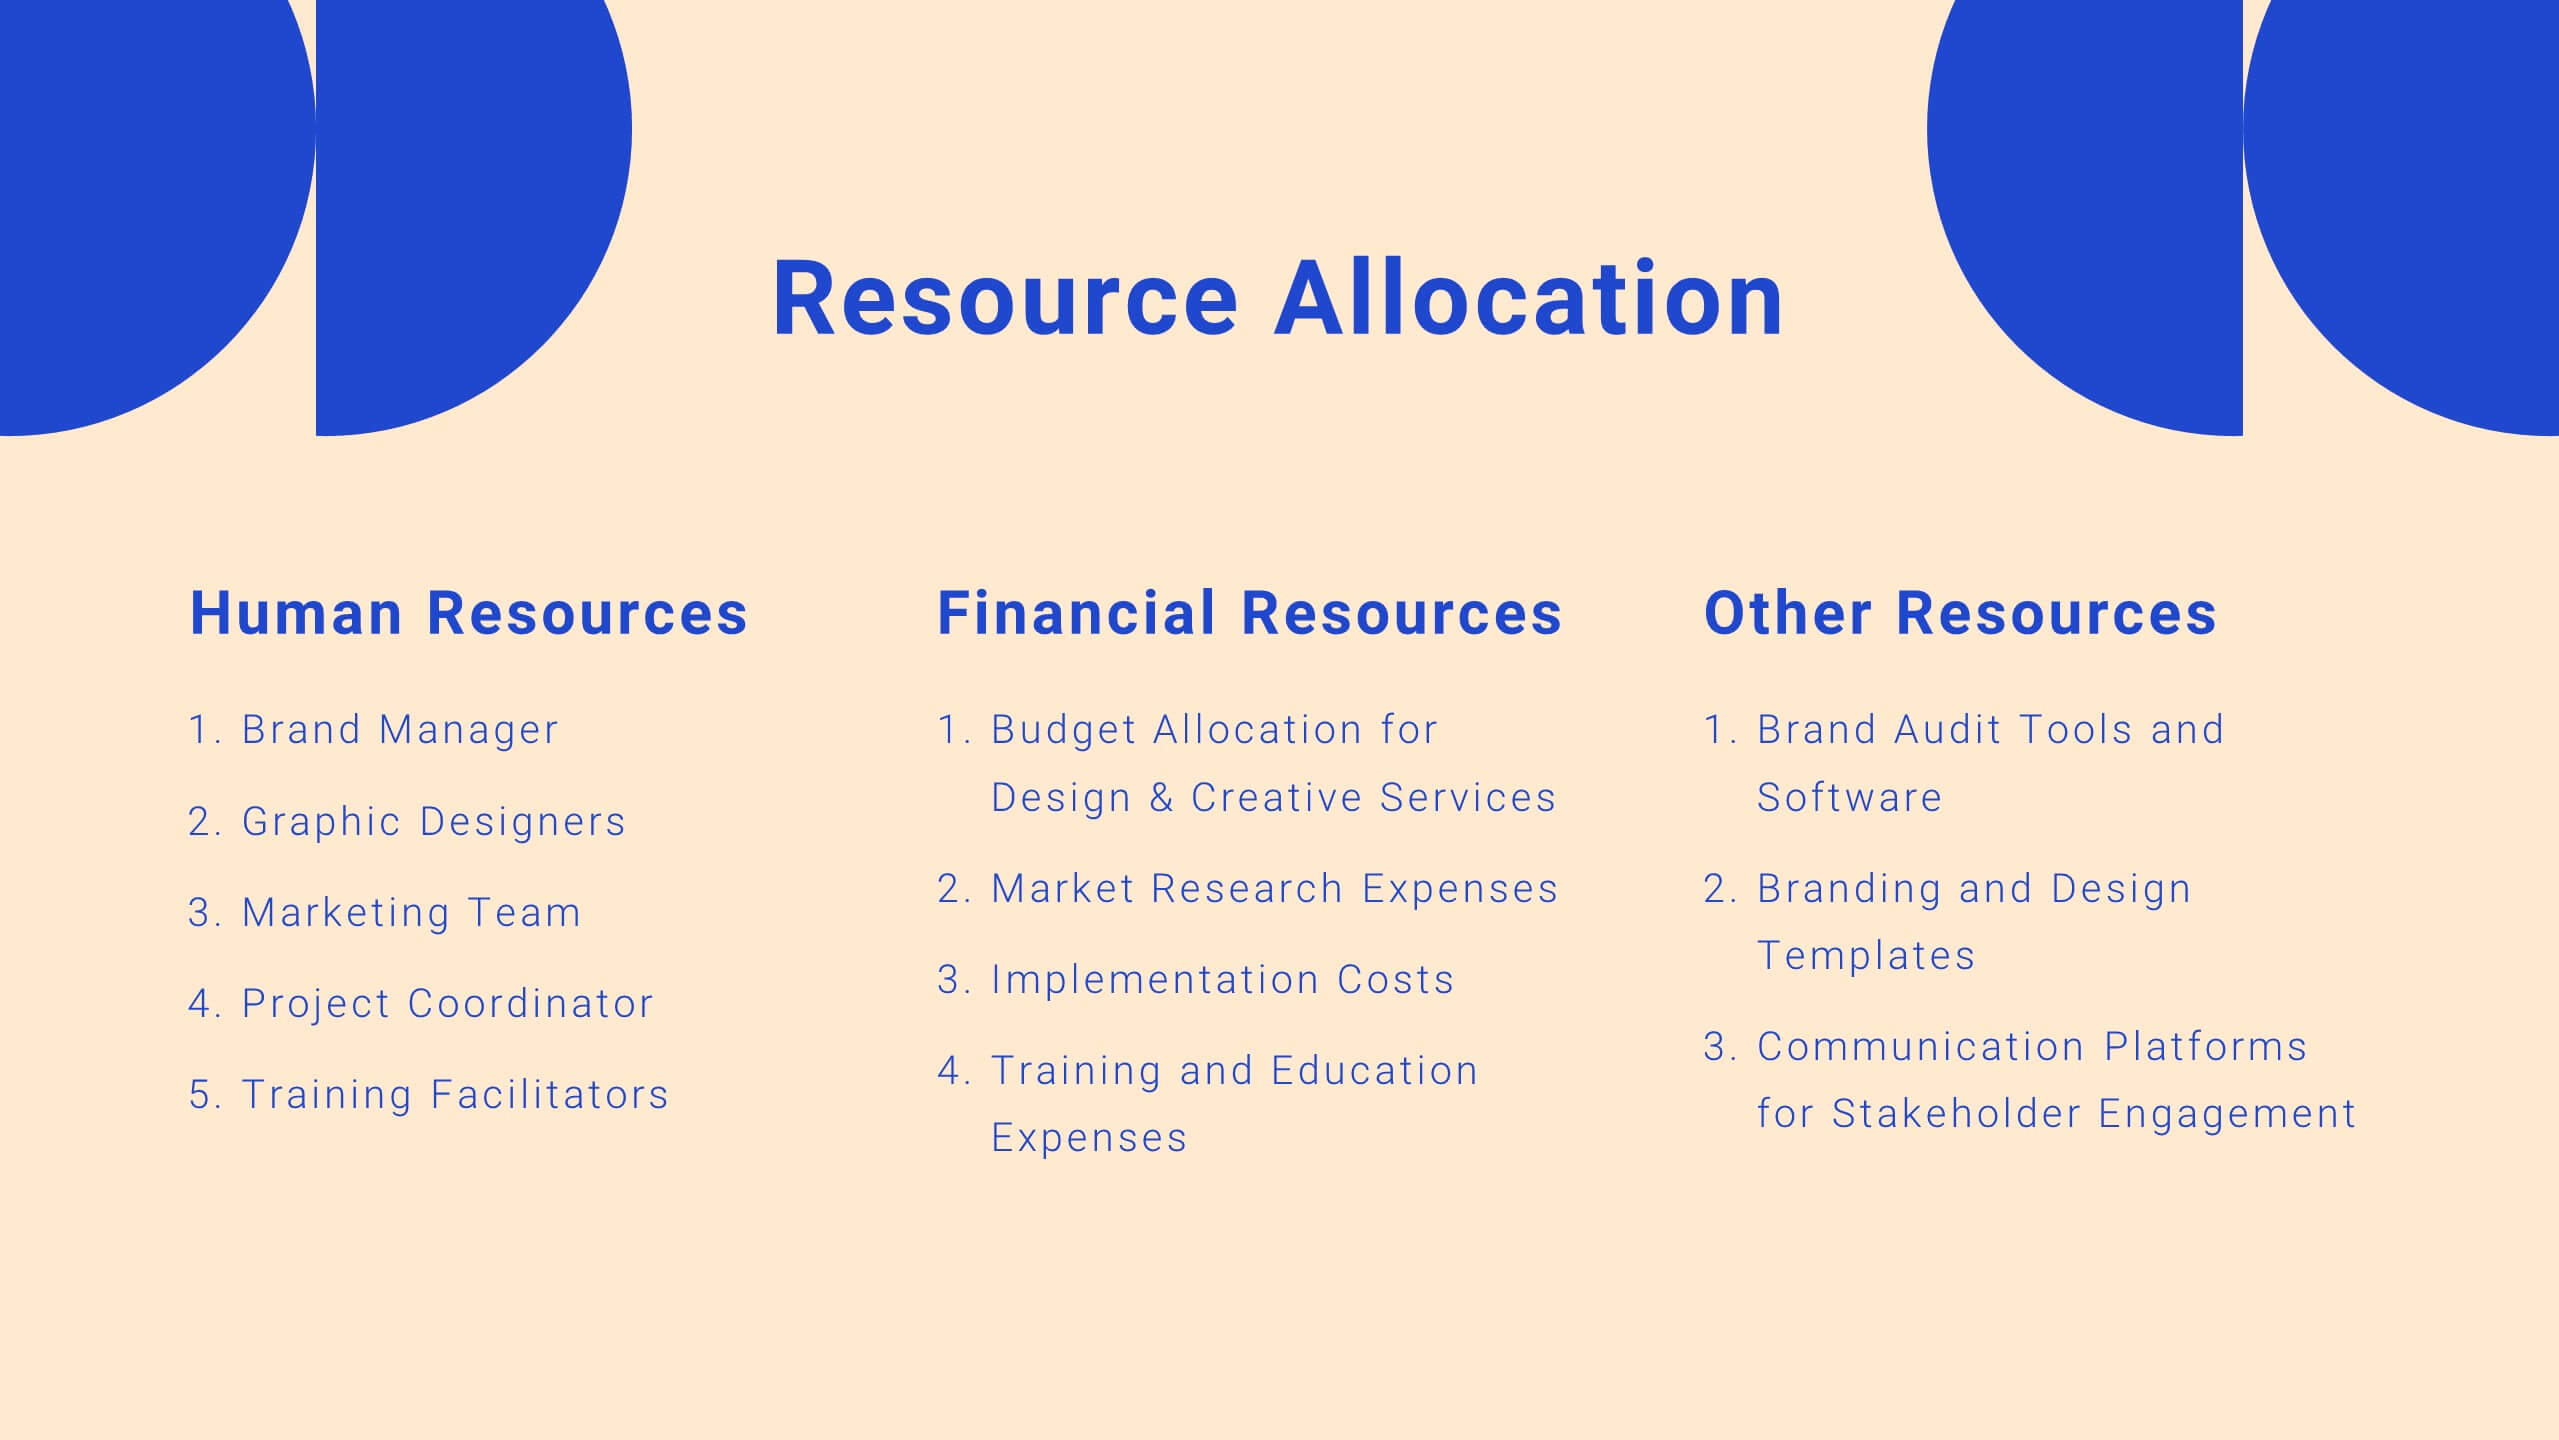
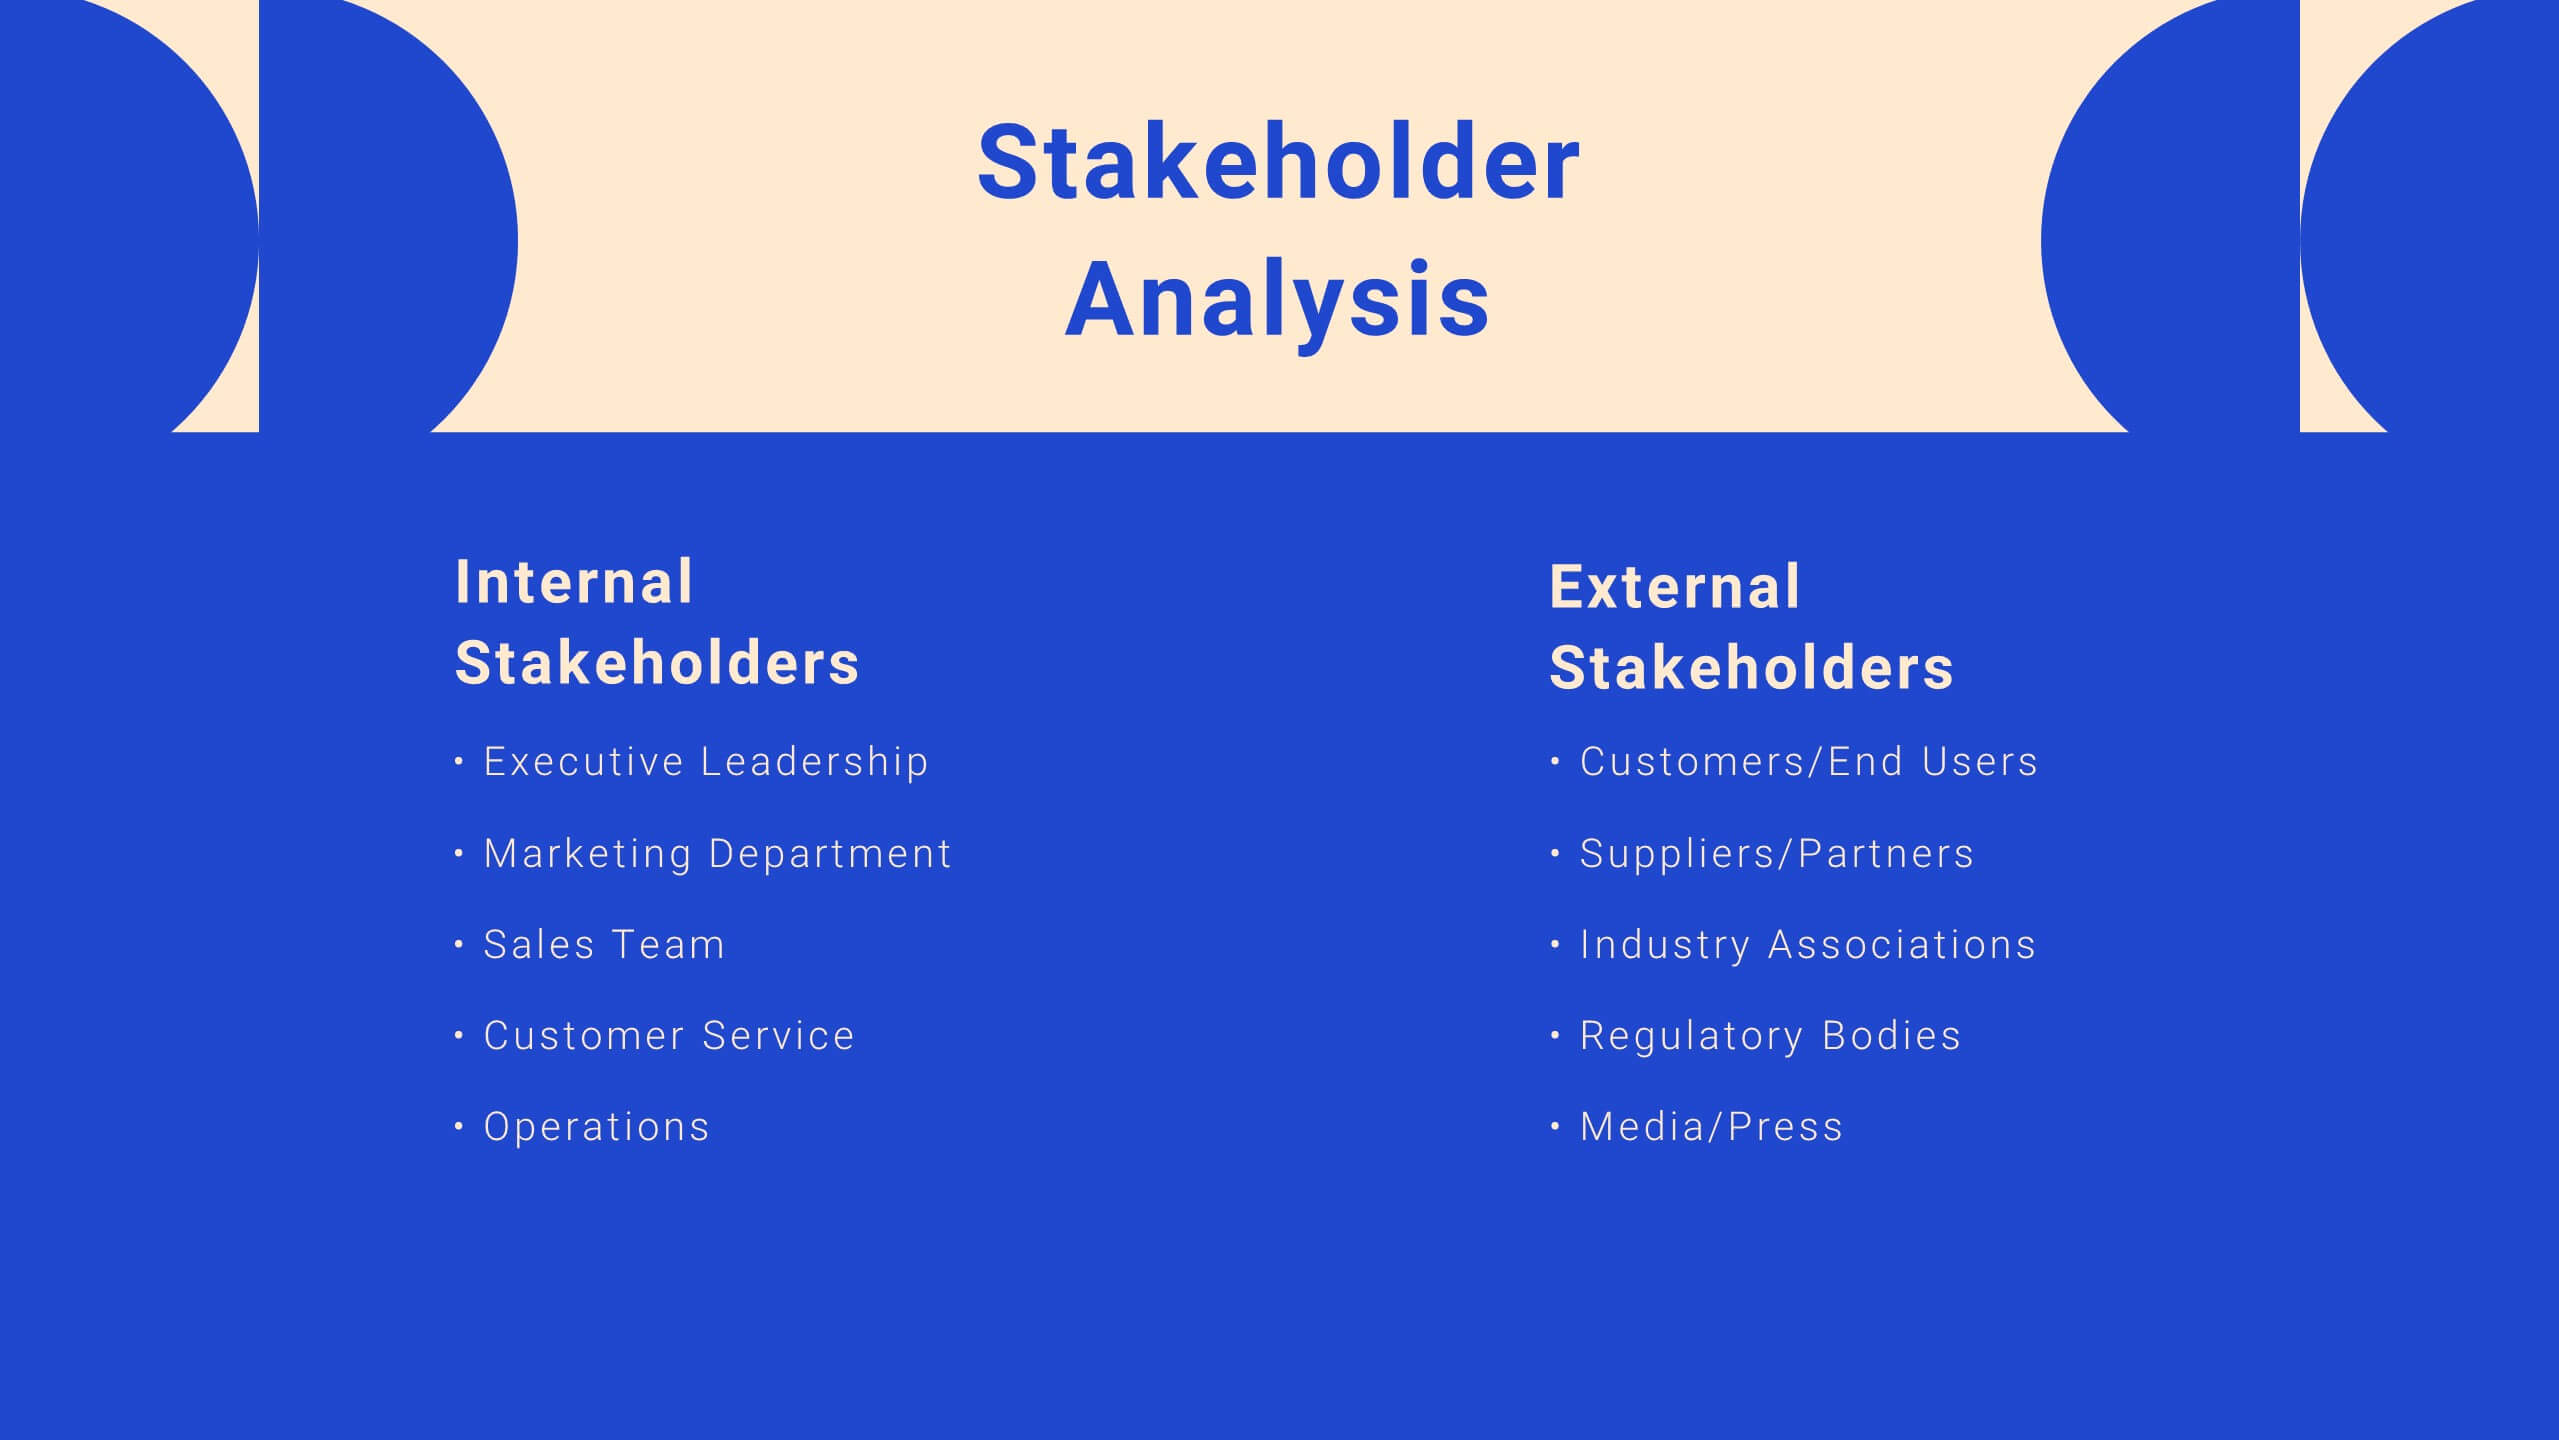
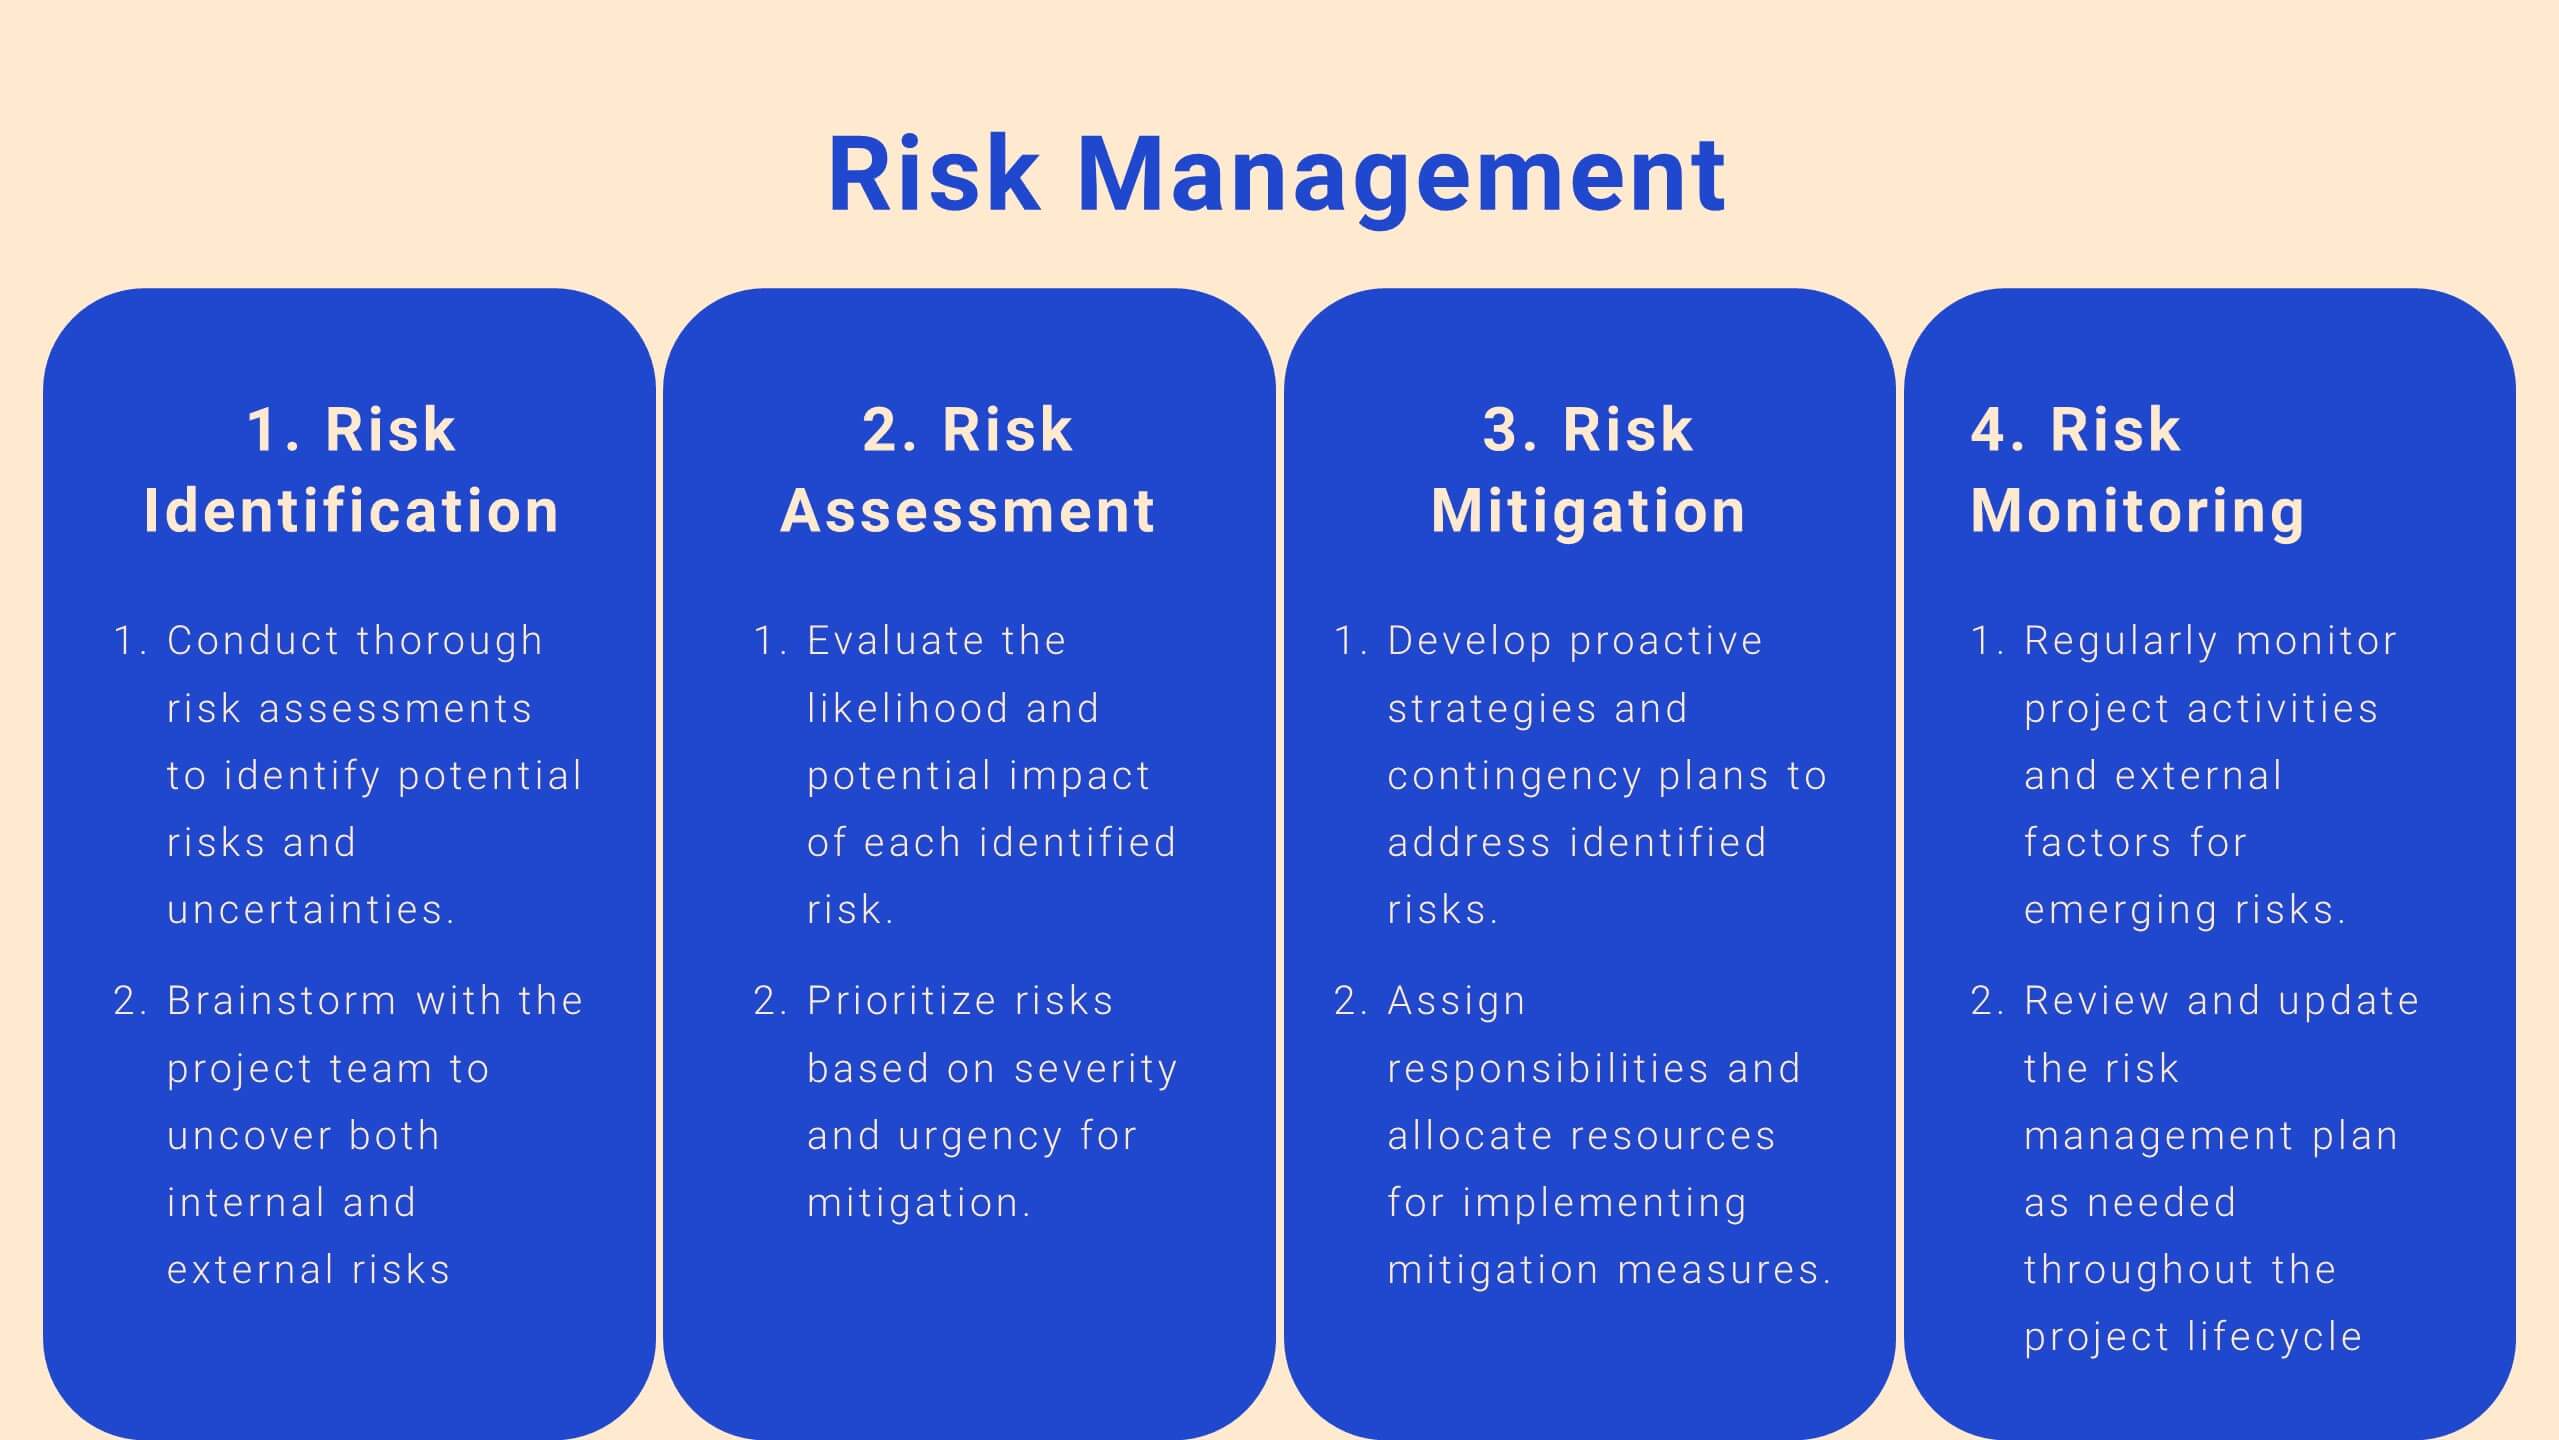
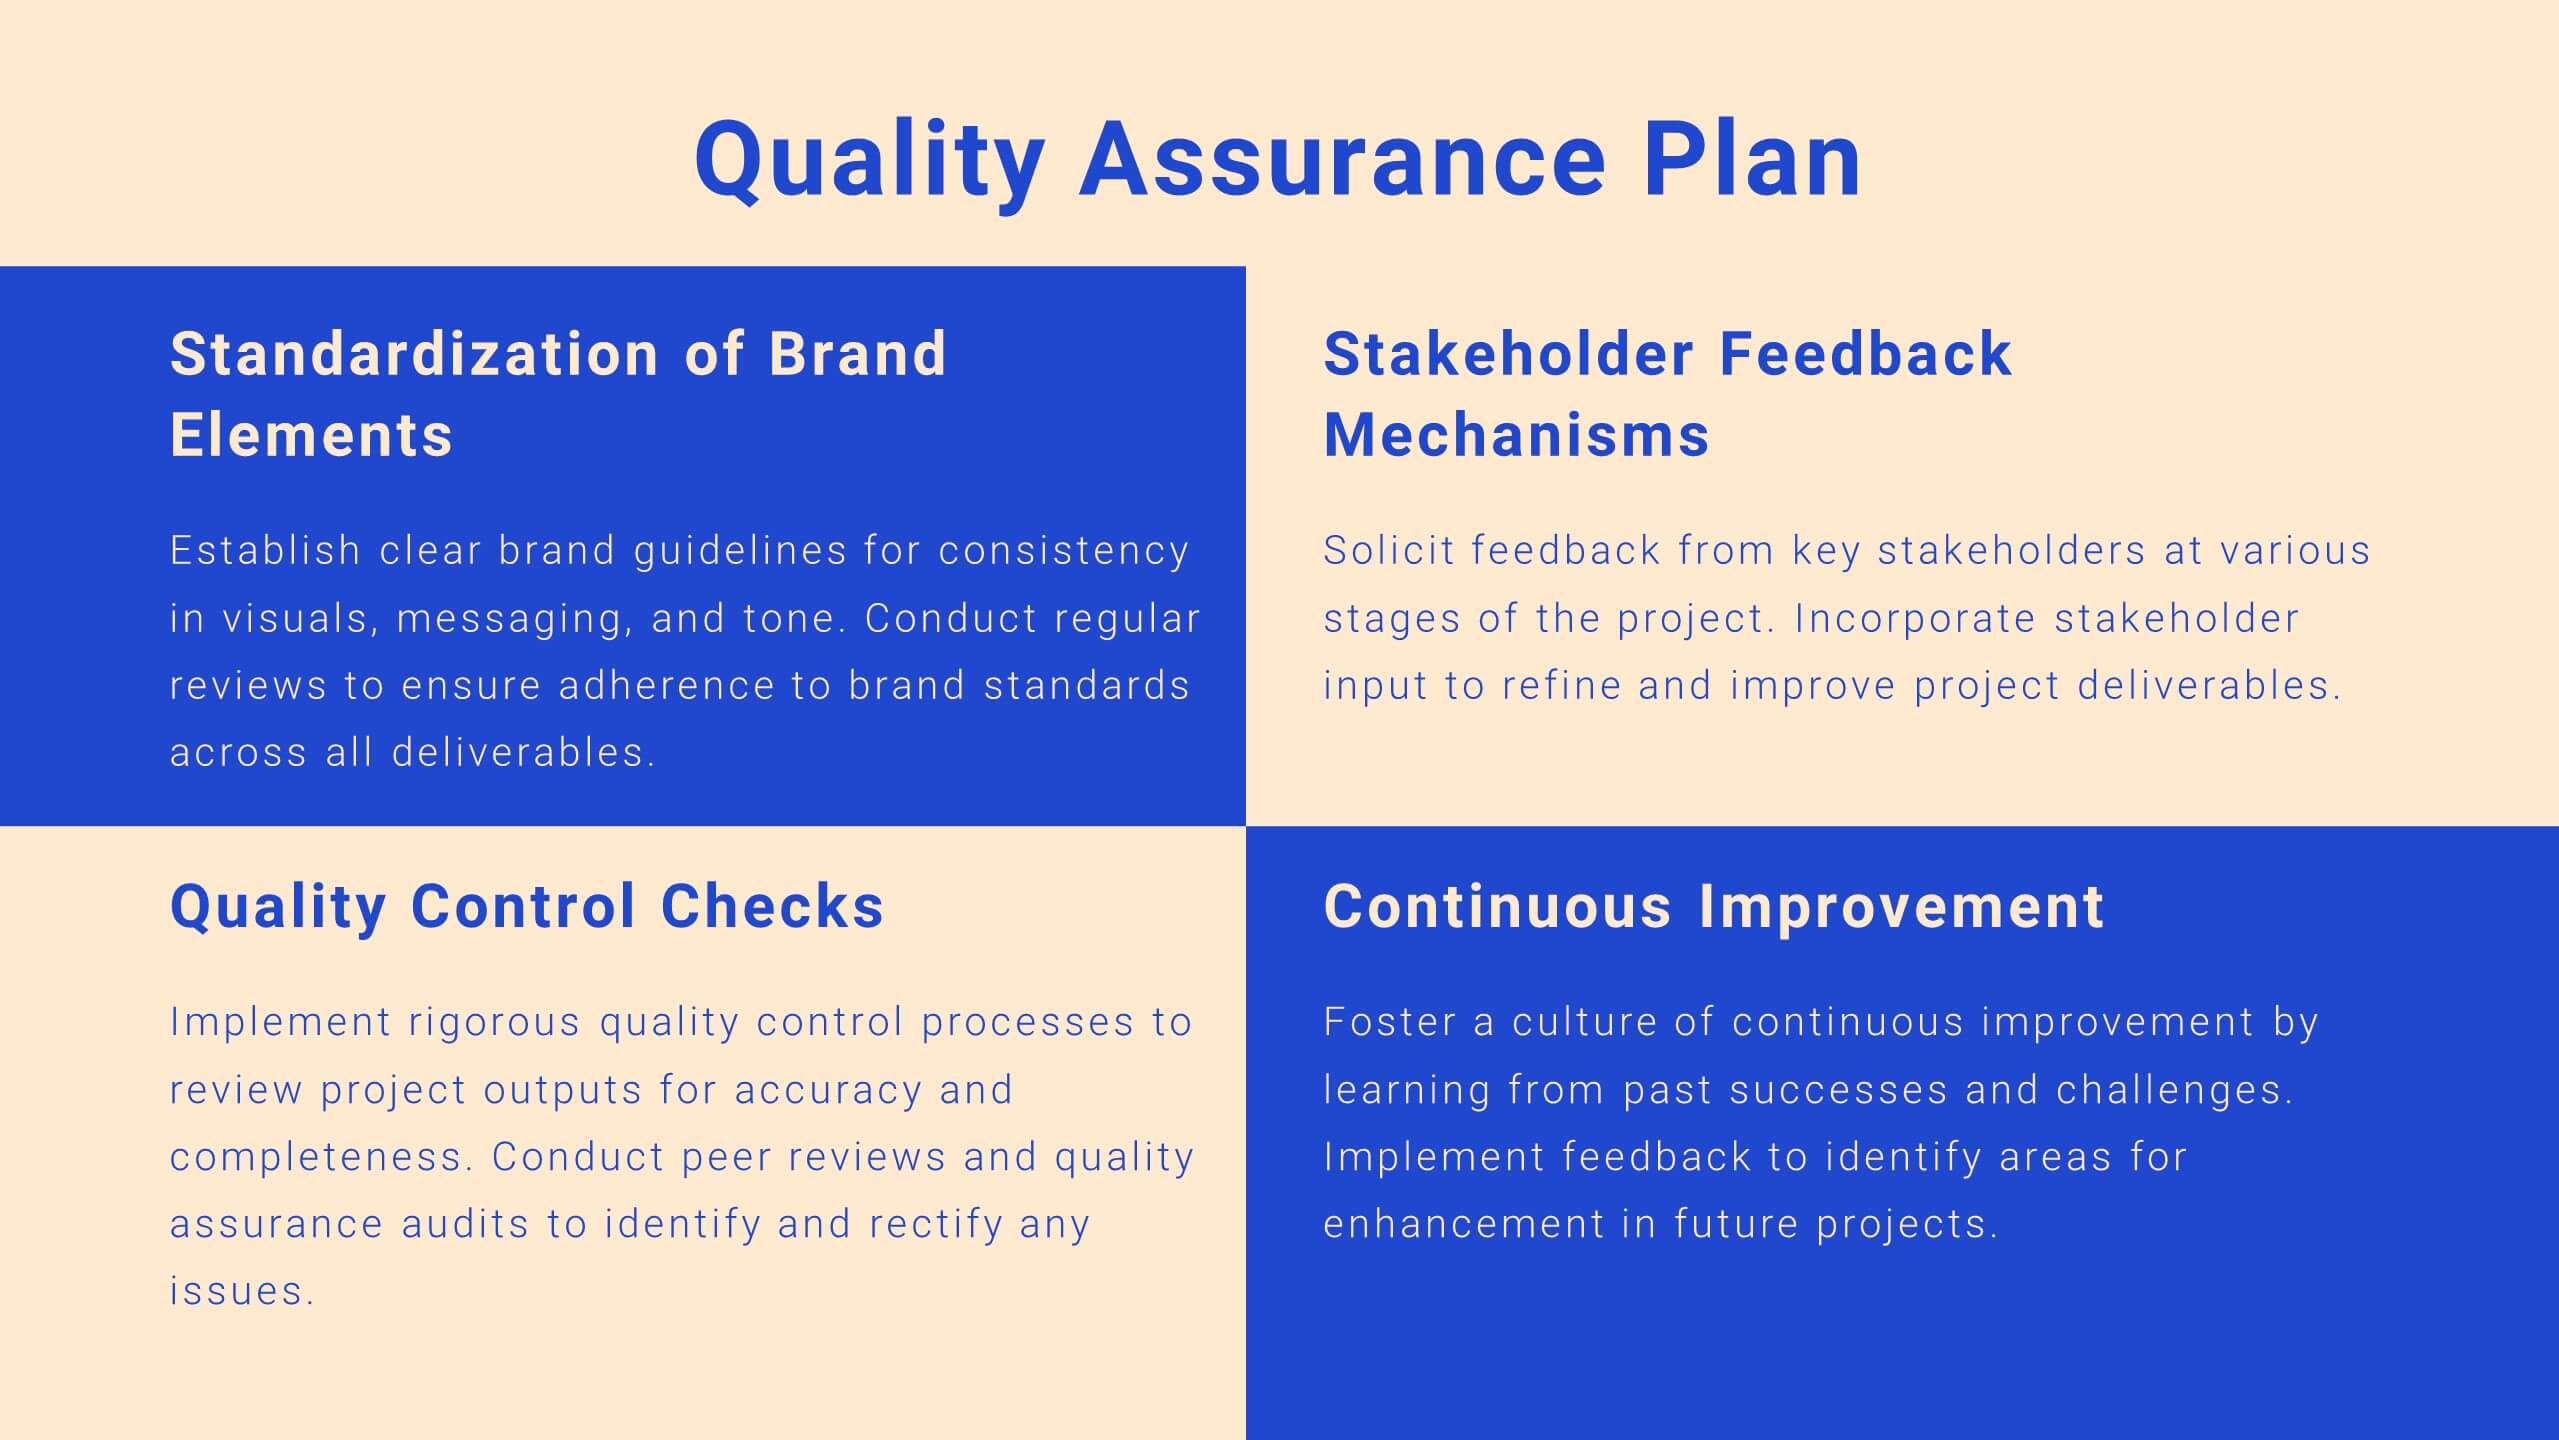
Drift Agile Project Plan Presentation
Take control of your projects with this comprehensive project plan template! From introductions to detailed objectives, this template covers scope of work, methodology, timelines, budget breakdowns, and risk management. Ideal for ensuring your project stays on track, it also includes stakeholder analysis and quality assurance plans. Compatible with PowerPoint, Keynote, and Google Slides.
6 diapositivas
Investment Insights and Budget Tracker Presentation
Stay on top of your financial strategy with the Investment Insights and Budget Tracker Presentation. This slide layout organizes six financial metrics or priorities into clear, color-coded blocks—ideal for summarizing investment options, budget breakdowns, or cost categories. Perfect for finance teams, analysts, or consultants. Fully editable in Canva, PowerPoint, Google Slides, and Keynote.


7 diapositivas
Cloud Architecture Infographic
Cloud technology is reshaping the digital landscape, and understanding its architecture is paramount. Dive into the intricacies of cloud systems with our cloud architecture infographic, crafted in a crisp white and serene blue palette. This visual tool demystifies the layers and components that constitute cloud frameworks. IT professionals, enterprise architects, and business decision-makers will greatly benefit from this structured depiction. Fully tailored for a smooth experience on PowerPoint, Keynote, and Google Slides, this infographic serves as a cornerstone for all looking to harness the potentials of cloud infrastructure.


5 diapositivas
Risk Assessment Heat Map Presentation
Evaluate risks effectively with a structured heat map. This Risk Assessment Heat Map helps visualize potential threats by mapping probability and impact levels. Ideal for risk management, business continuity planning, and decision-making. Fully customizable and compatible with PowerPoint, Keynote, and Google Slides for professional and seamless integration.


7 diapositivas
Job Title Infographic
The slides displayed offer a range of stylish and clear title designs for various business and creative presentations, ideal for introducing key concepts and sections within a professional document or presentation. Each slide is crafted to represent themes such as annual reports, digital strategies, and project retrospectives, as well as specialized areas like web design, strategic planning, and SEO. The designs incorporate modern aesthetics with clean lines, bold color palettes, and minimalist graphic elements, ensuring that the titles are not only eye-catching but also effectively convey the subject matter. This variety allows presenters to choose a slide that best fits the tone and topic of their presentation, making each section distinct and engaging for the audience. These slides are perfect for professionals looking to present complex information in an accessible and visually appealing format.


8 diapositivas
Corporate Risk Assessment and Planning Presentation
Navigate business uncertainties with the Corporate Risk Assessment and Planning template, offering a vivid and structured layout designed for professionals to meticulously detail and analyze potential risks in various business scenarios. It uses hexagonal and circular elements to emphasize the interconnectedness of various risk factors, supporting clear visualization and effective strategic planning. This template is compatible with PowerPoint, Keynote, and Google Slides, making it a versatile tool for comprehensive risk management presentations.


7 diapositivas
Goals Infographic Presentation Template
A goals infographic is a set of goals, objectives, or plans, often used for personal or organizational planning and development. This template allows you to include information about your specific goals, the steps required to achieve them, the timeline for completion, and any relevant metrics or targets. The purpose of our goals infographic is to help you provide a clear and concise overview of what is to be accomplished, and help you keep focus on achieving those goals. This well-designed infographic can help you prioritize and track progress, and can serve as a visual reminder.


5 diapositivas
User Experience Customer Path Map
Visualize the full customer journey with the User Experience Customer Path Map Presentation. This engaging slide illustrates five key touchpoints in the user experience cycle using a connected flow design with bold icons and captions. Perfect for mapping onboarding steps, product interactions, or decision-making stages. Fully editable in PowerPoint, Keynote, and Google Slides.


5 diapositivas
Annual Overview Report Template Presentation
Bring your yearly achievements to life with this sleek and structured layout designed for clarity and impact. Ideal for summarizing company performance, milestones, and future goals, it organizes data into easy-to-follow visuals. Fully editable and compatible with PowerPoint, Keynote, and Google Slides for a smooth presentation experience.


20 diapositivas
Fusion Product Roadmap Presentation
Elevate your product roadmap presentations with this sleek and modern template! Perfect for detailing product features, target market, and competitive analysis. Ideal for product managers and teams aiming to align strategy and execution. Compatible with PowerPoint, Keynote, and Google Slides, it’s an essential tool for showcasing your product journey effectively.


8 diapositivas
Educational Lesson Plan Presentation
The "Educational Lesson Plan Presentation" template offers a vibrant and engaging method to display educational strategies and frameworks. This template uses a stacked blocks design that visually represents the hierarchical structure of lesson components. Each block is color-coded, facilitating easy distinction between different sections such as Title 01, Title 02, Title 03, and Title 04, which can be customized with specific educational goals or key points. This format is ideal for educators planning their lessons or for presentations at educational seminars, workshops, or teacher training sessions, where clarity and visual structure enhance communication and understanding.