


Características


¿Tienes alguna pregunta?
Recomendar


5 diapositivas
AIDA Funnel for Marketing Strategy Presentation
This presentation template breaks down the AIDA model—Attention, Interest, Desire, Action—into a clean, engaging layout. Perfect for marketing strategies, campaign planning, or customer journey mapping. Easily customizable in Canva, it combines modern icons, bold typography, and horizontal flow to clearly visualize your marketing funnel in a compelling, structured format.


23 diapositivas
Quest Qualitative Research Findings Presentation
This dynamic and sleek research template presents qualitative findings with style and clarity. Dive into research objectives, data collection, key findings, and future directions, all showcased with a minimalist black-and-white design. Perfect for impactful presentations, this template is compatible with PowerPoint, Keynote, and Google Slides, making it versatile for any audience!


23 diapositivas
Dragonveil Product Launch Pitch Deck Presentation
The Product Launch Pitch Deck Presentation Template features 23 fully customizable slides designed to outline key aspects such as market opportunity, revenue model, and sales strategy. Ideal for startups and businesses launching new products, it ensures a compelling pitch. Compatible with PowerPoint, Keynote, and Google Slides.


6 diapositivas
Economic Trends in Africa Map Presentation
The Economic Trends in Africa Map template visually presents economic data across Africa. It displays regional economic shifts and trends, using an interactive map and related graphs. Ideal for analysts and investors, it offers clear insights for strategic decisions. Compatible with PowerPoint, Keynote, and Google Slides.


5 diapositivas
Procurement Strategy Presentation
ChatGPT PlusBring clarity and structure to your business process with this modern, visually engaging presentation. Perfect for outlining purchasing plans, supplier relationships, and cost-saving strategies, it helps convey information with precision and flow. Fully customizable and compatible with PowerPoint, Keynote, and Google Slides for seamless editing and professional results.


3 diapositivas
Workflow Optimization Flow Chart Presentation
Streamline your processes with this Workflow Optimization Flow Chart presentation. Designed to help teams identify inefficiencies, visualize task flows, and improve decision-making. Featuring clearly labeled paths and decision points, it's ideal for process audits, operations planning, or training sessions. Fully editable in PowerPoint, Canva, and Google Slides.


4 diapositivas
Cost Analysis and Budget Overview Presentation
Break down financial details with clarity using the Cost Analysis and Budget Overview Presentation. This slide helps you present cost structures, budget allocations, and key financial metrics side by side using icons and visual data blocks. Perfect for reports, planning, or investment decks. Fully editable in PowerPoint, Google Slides, Keynote, and Canva.


6 diapositivas
Onboarding 30-60-90 Day Roadmap Presentation
Get your team excited from day one with this colorful, easy-to-follow visual layout! This presentation template helps clearly map out onboarding goals and key activities across 30, 60, and 90 days. Perfect for HR professionals and team leads, it's fully editable and works with PowerPoint, Keynote, and Google Slides.


7 diapositivas
Corporate Sustainability Management
Visualize your sustainability priorities with this hexagon-based framework slide, designed to highlight areas like environmental impact, health, welfare, and ethical governance. Ideal for CSR reporting, ESG strategy sessions, or internal sustainability initiatives. Easy to customize in PowerPoint, Keynote, and Google Slides.

23 diapositivas
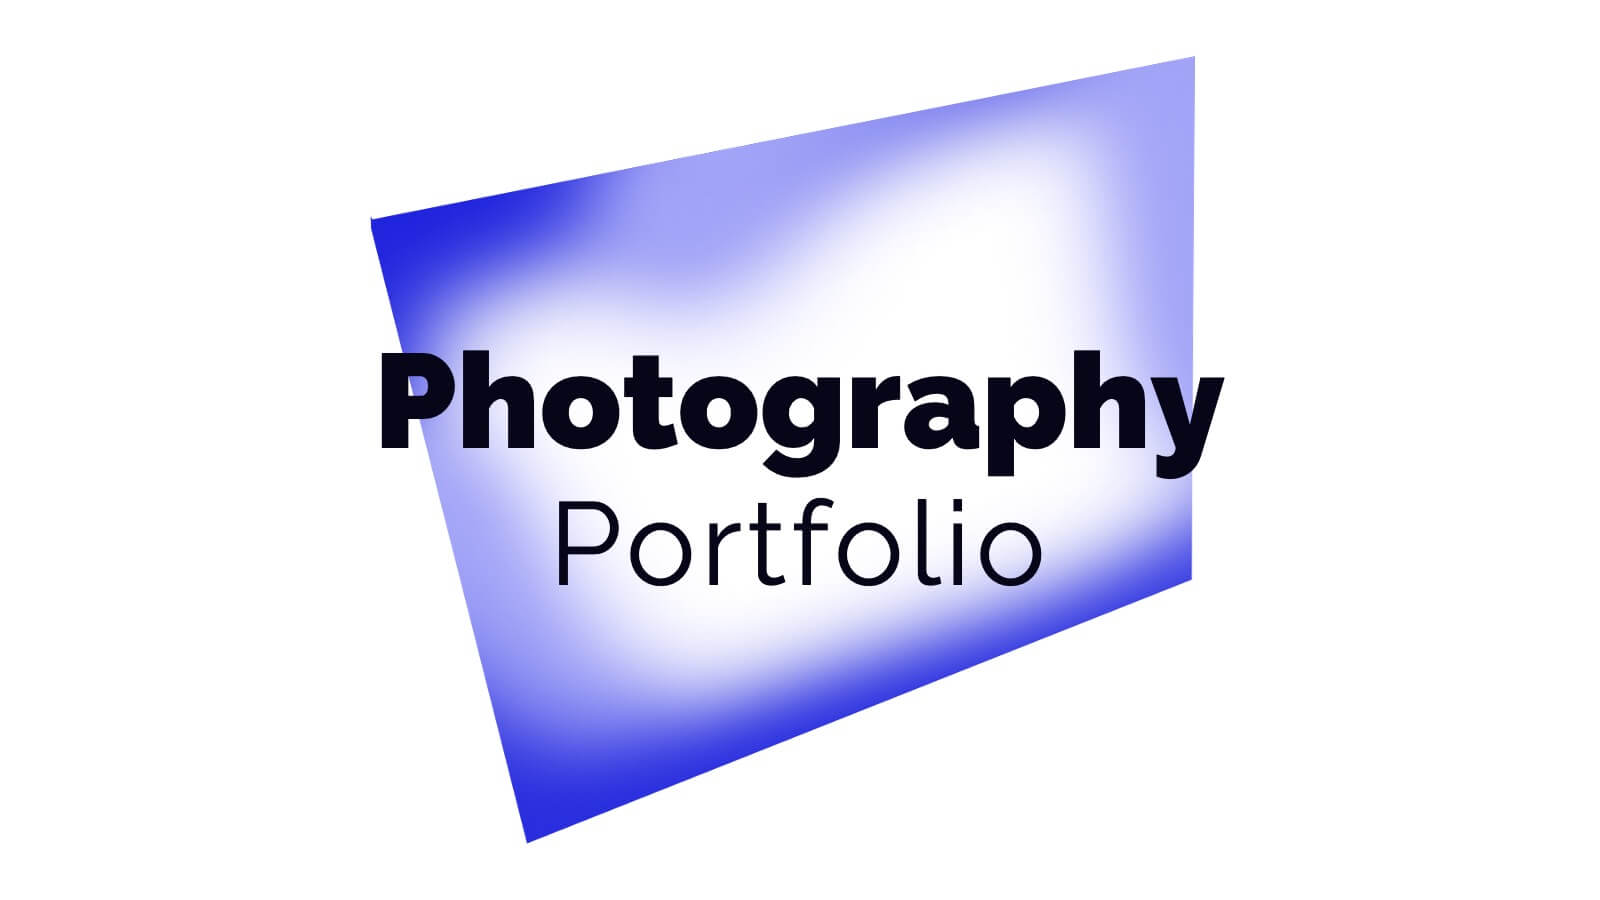
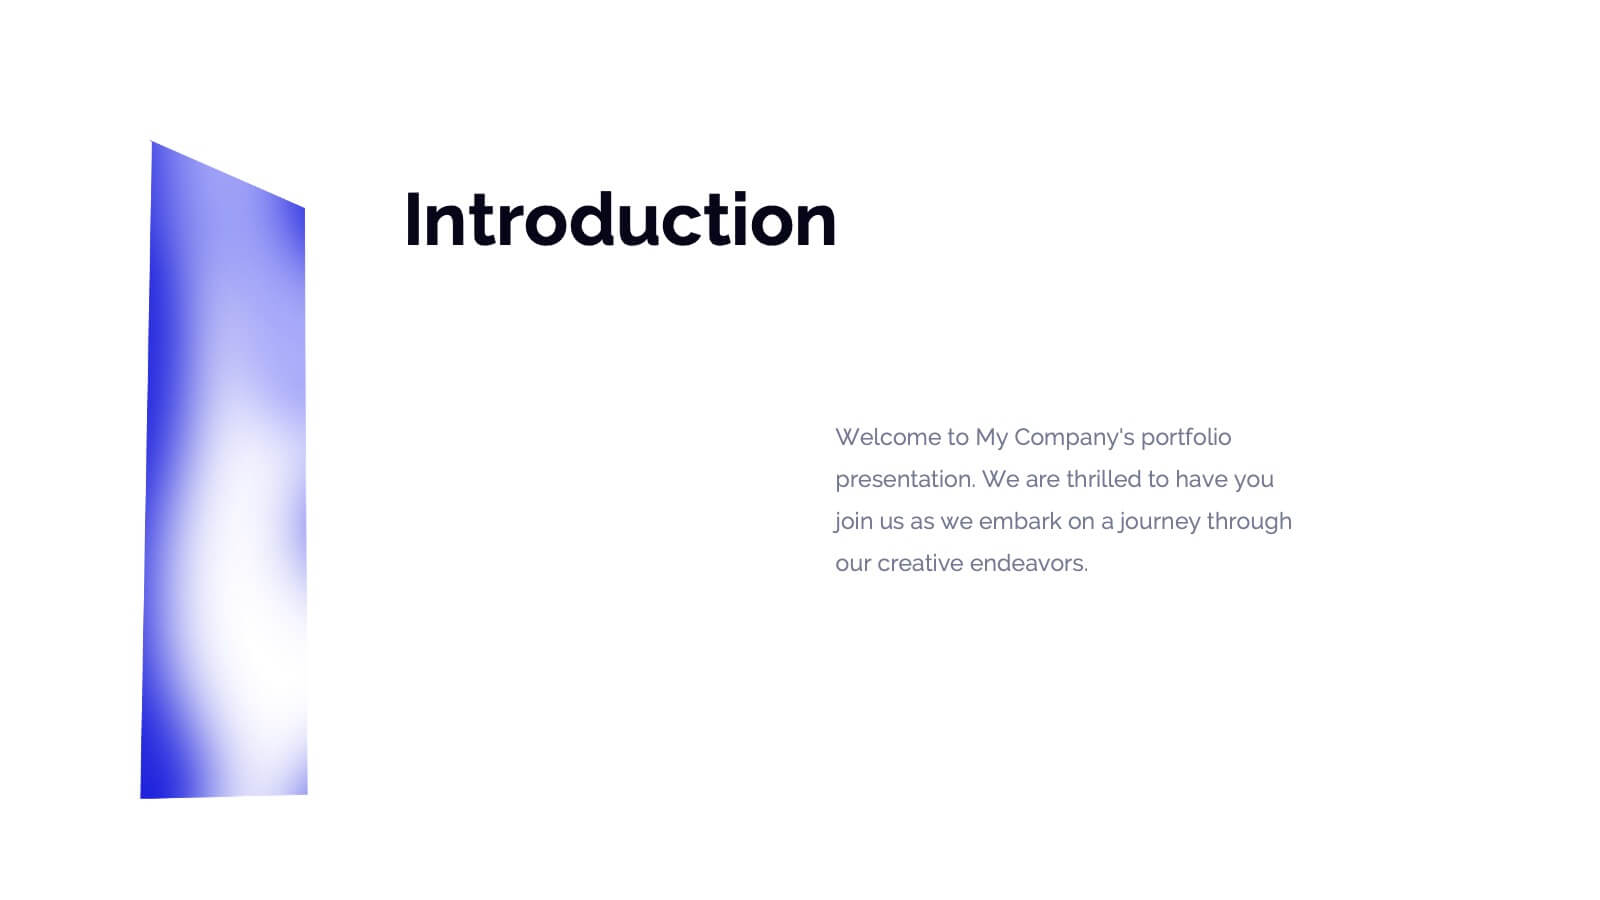
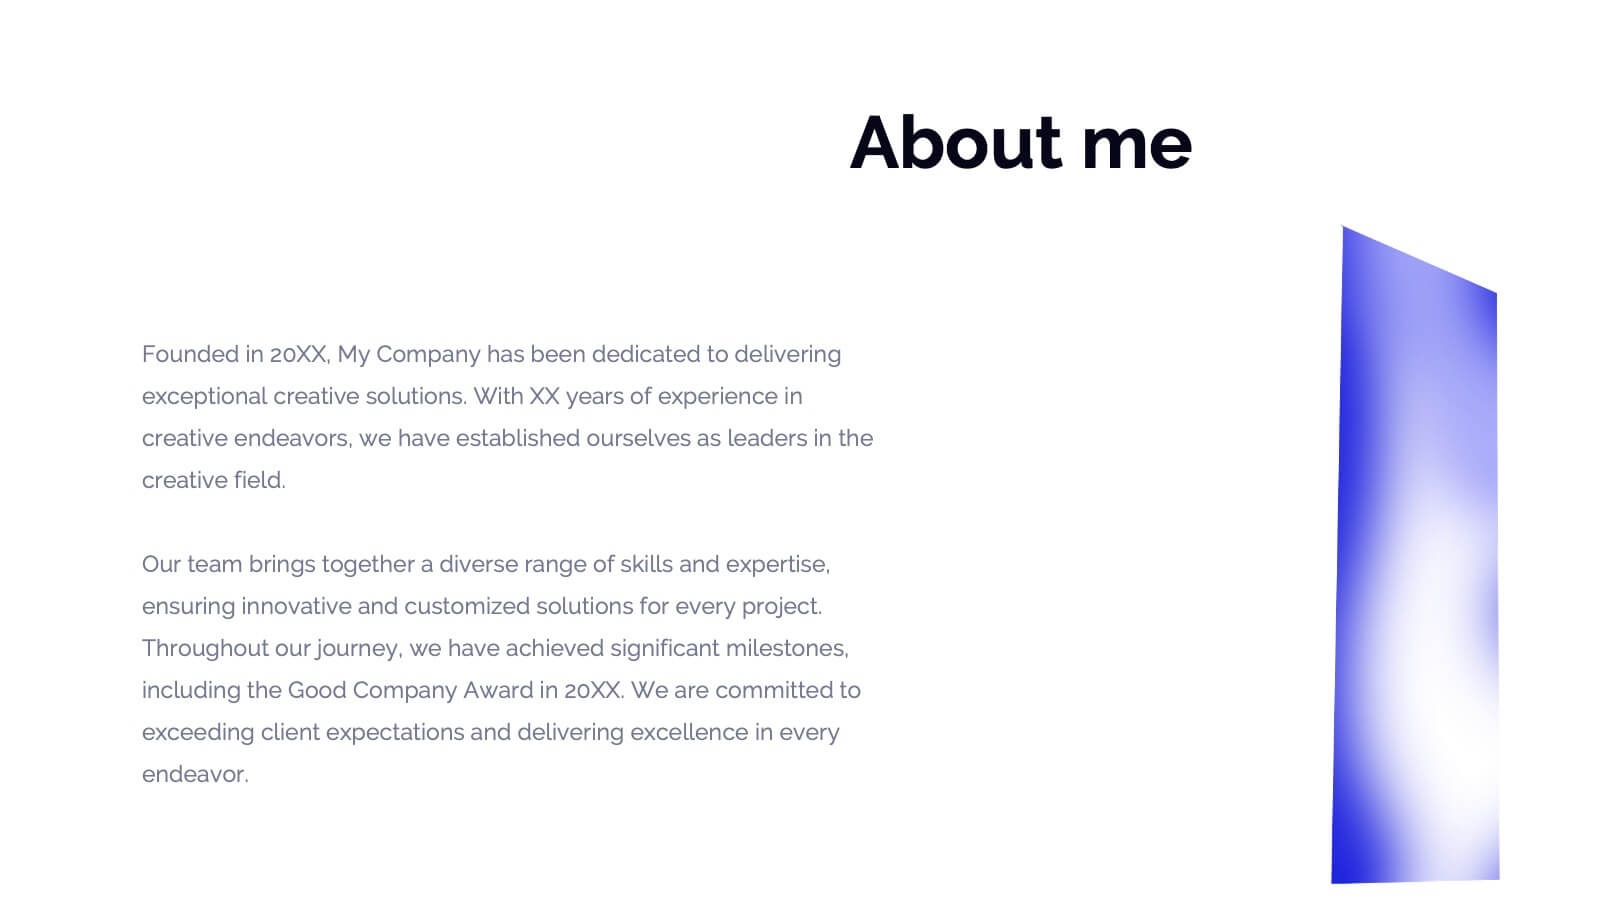
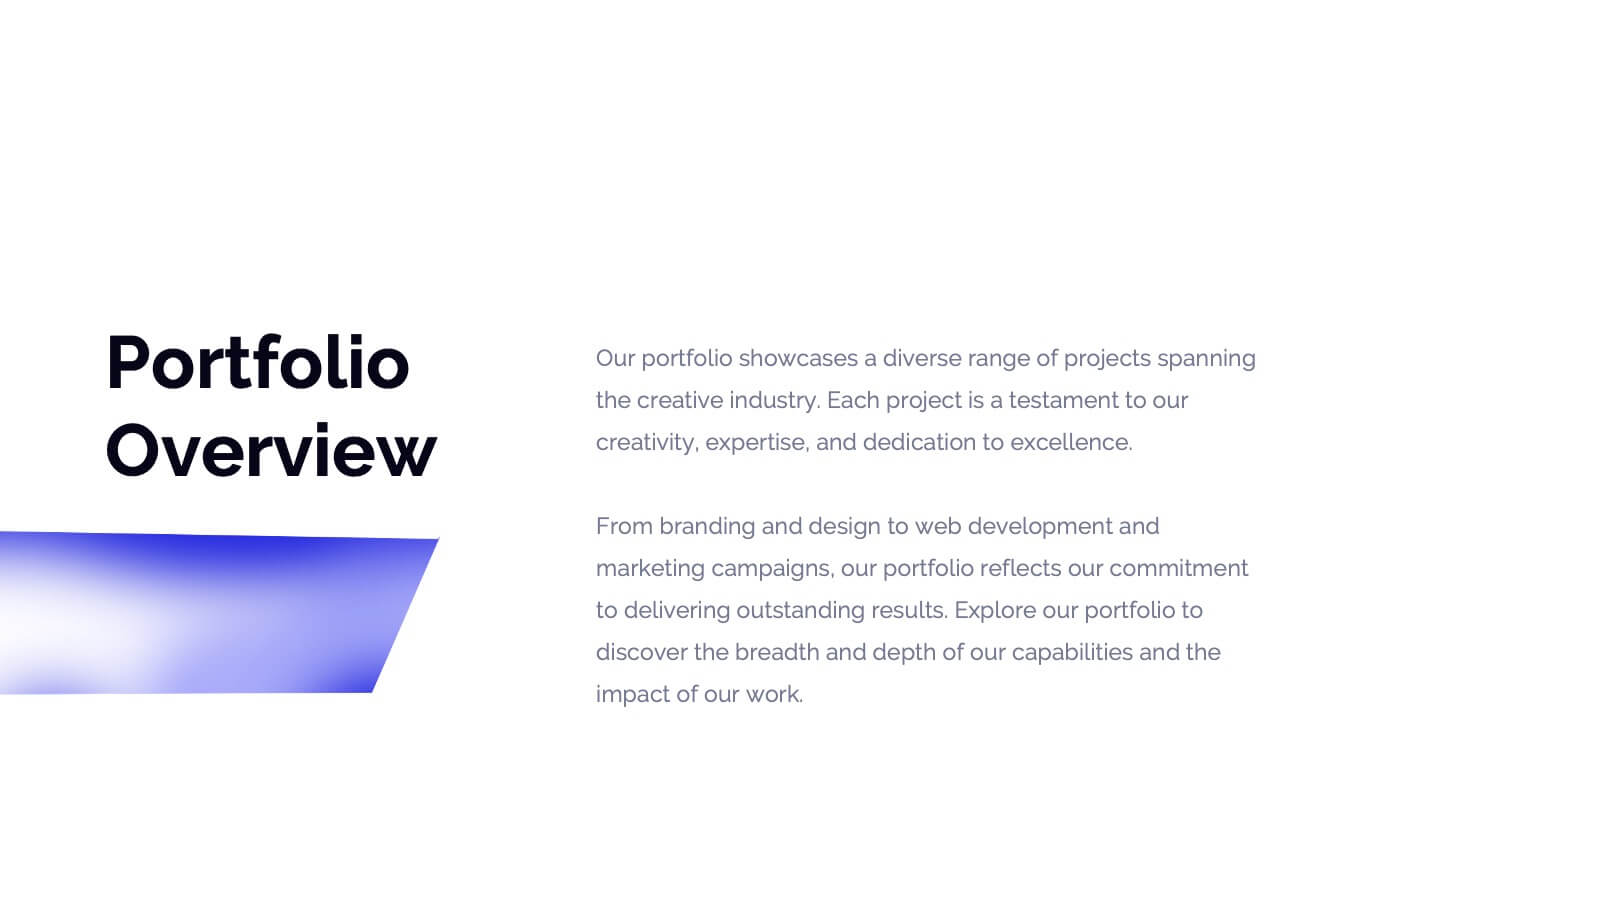
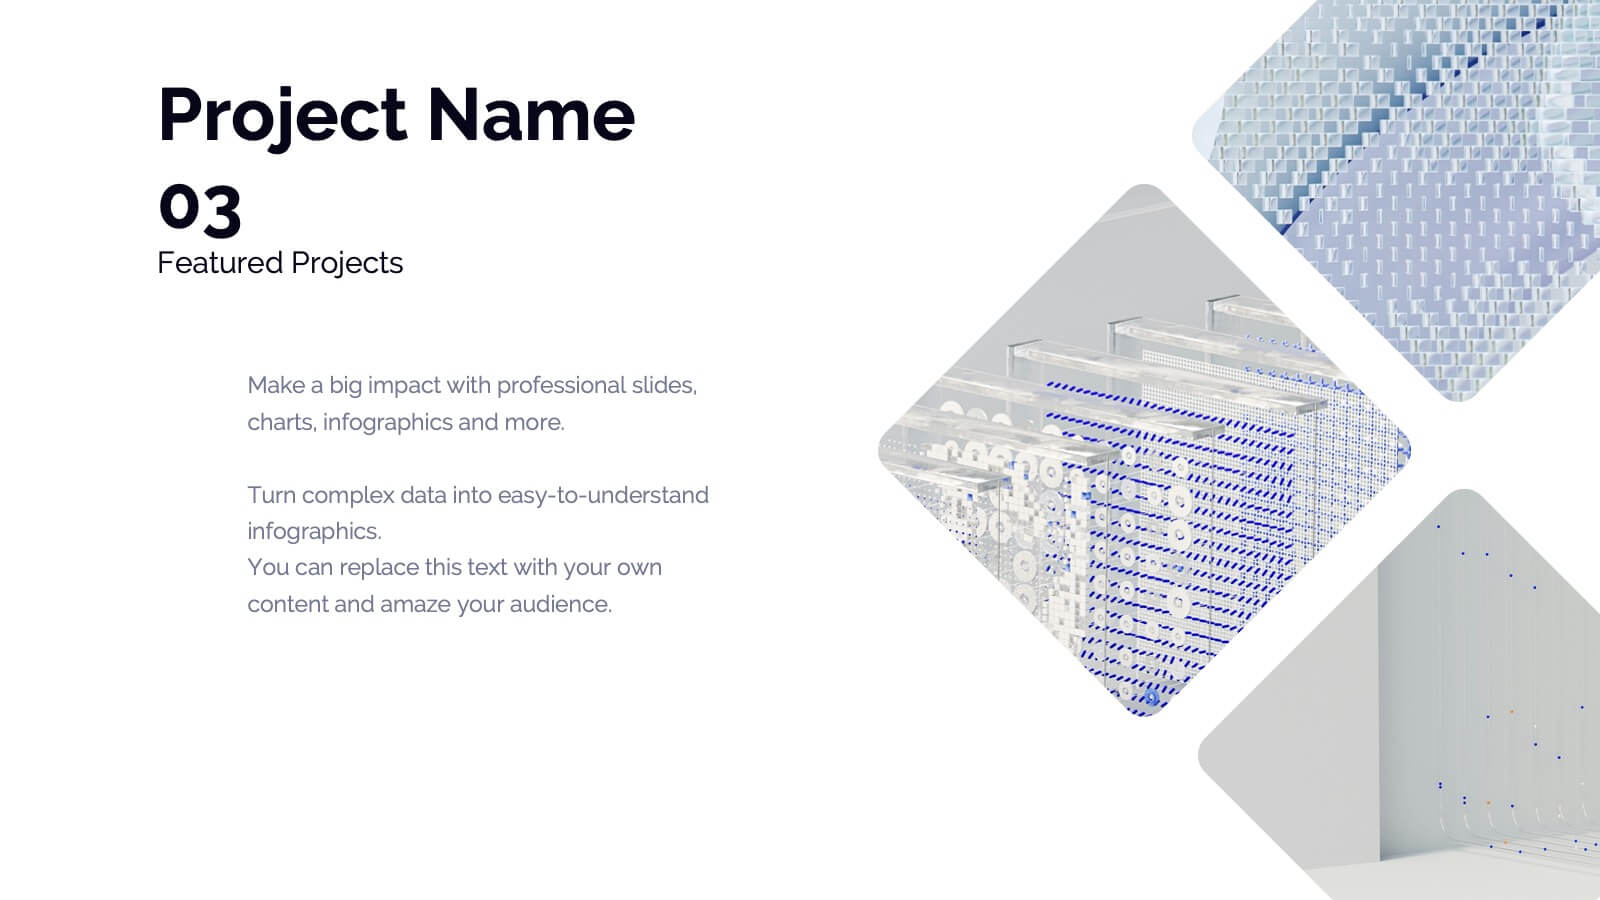
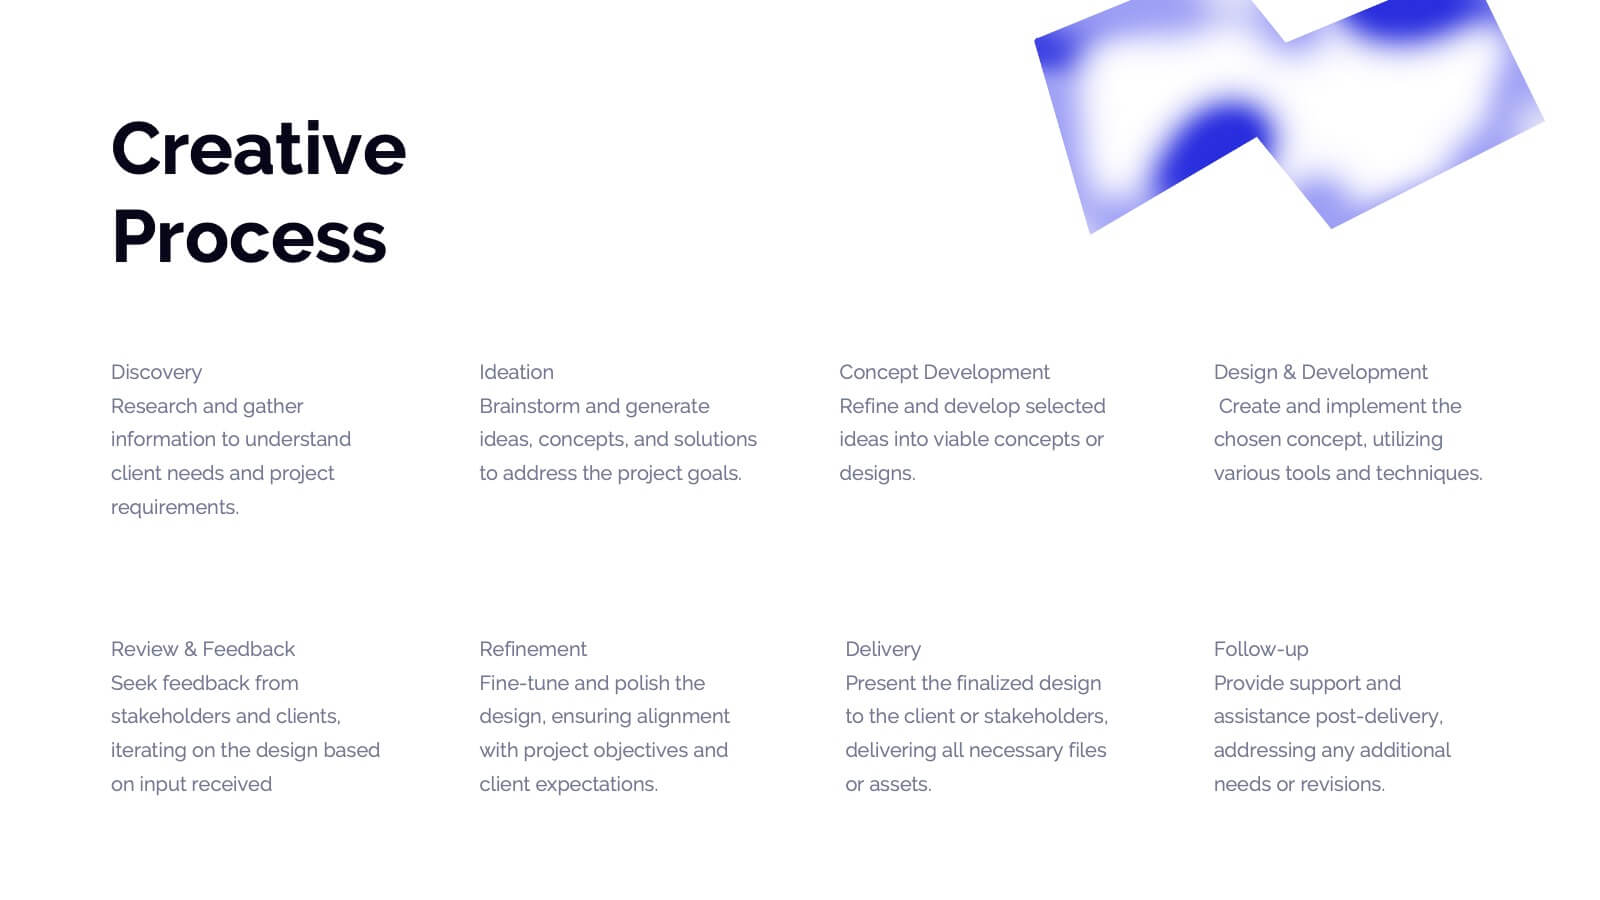
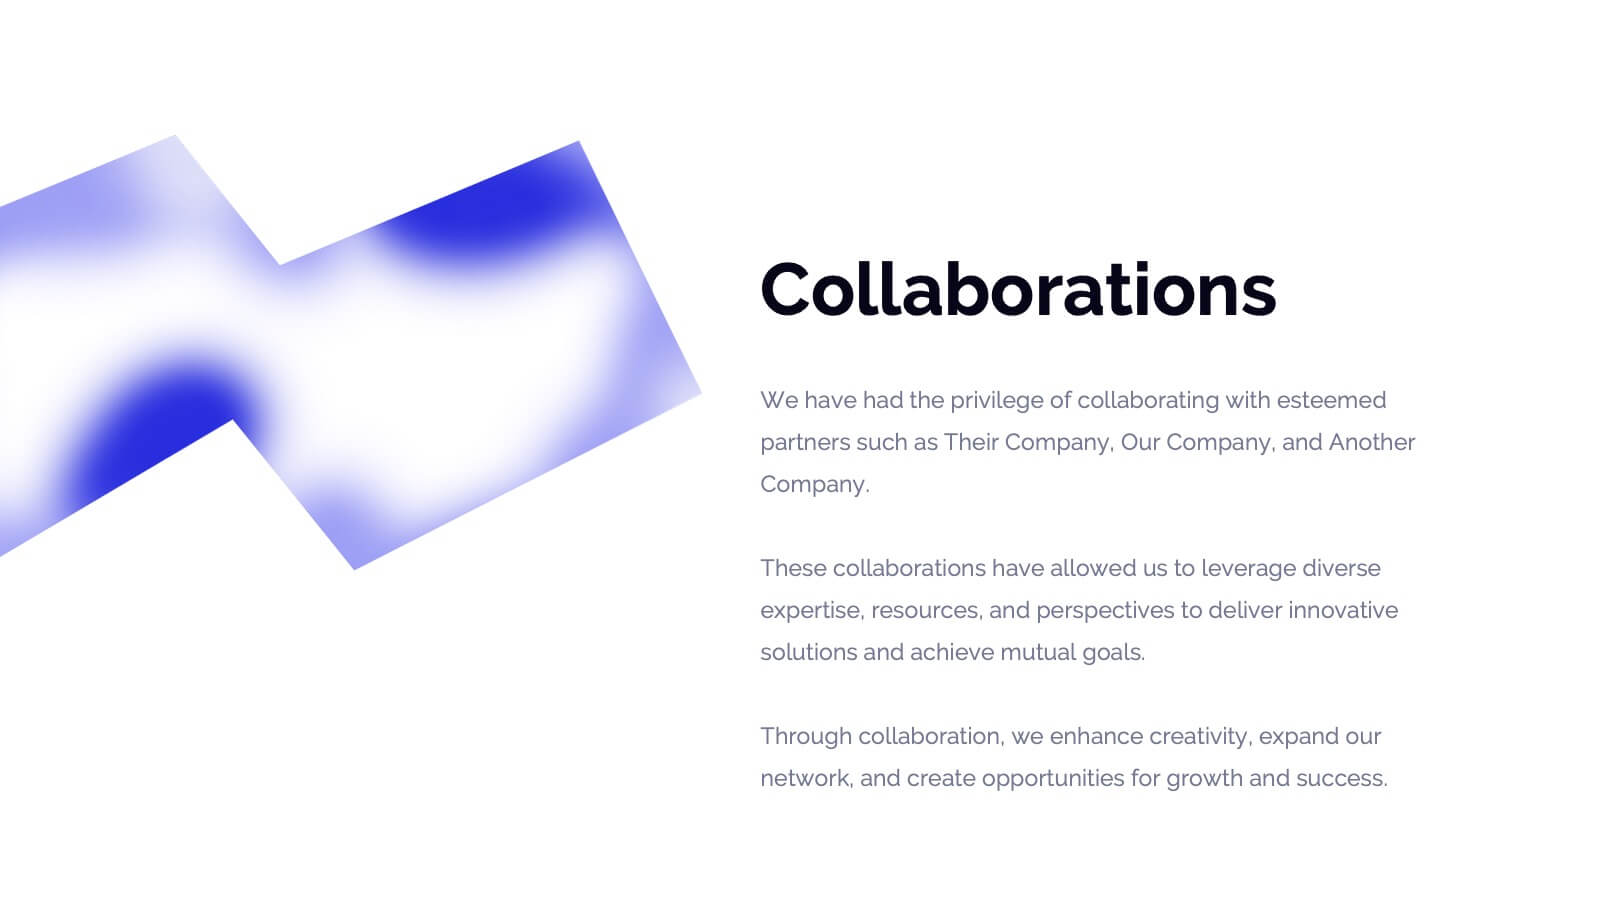
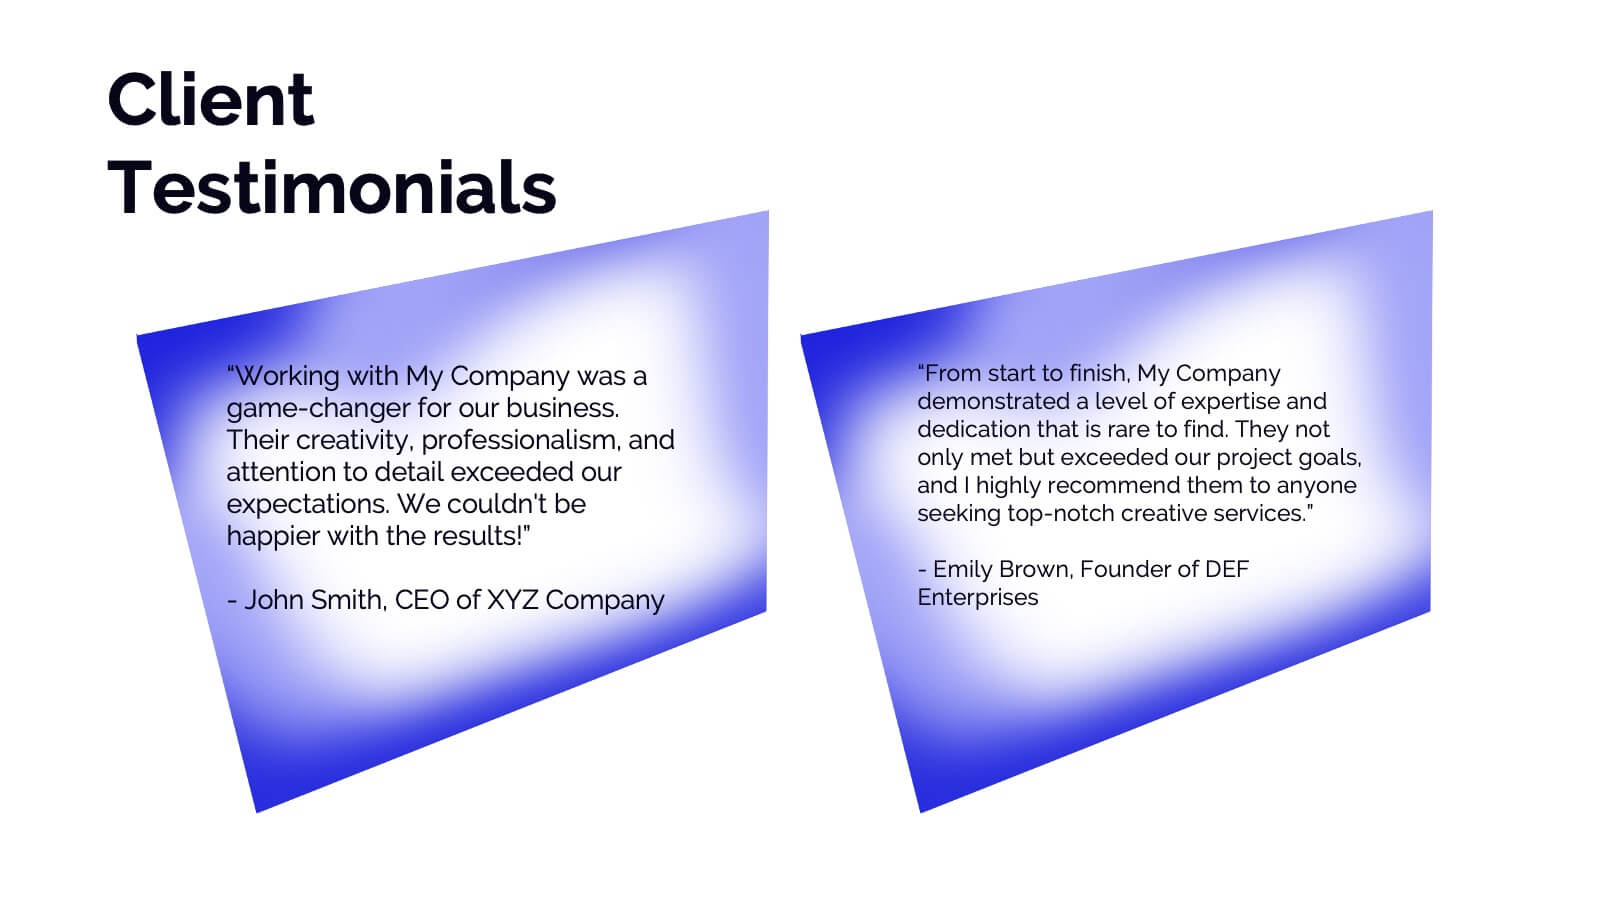
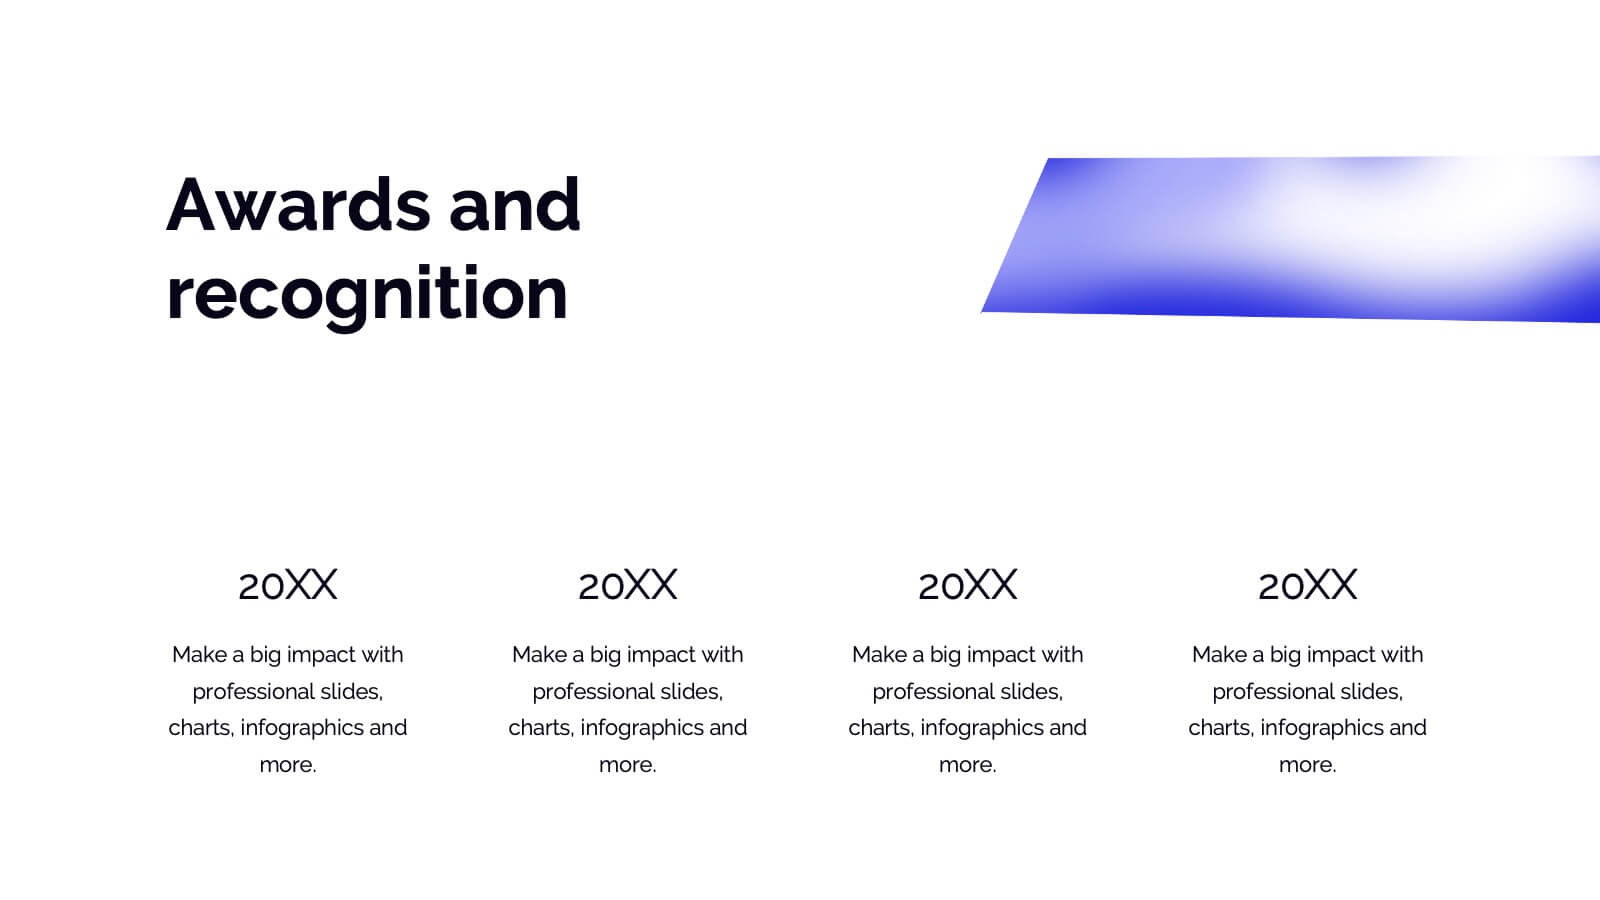
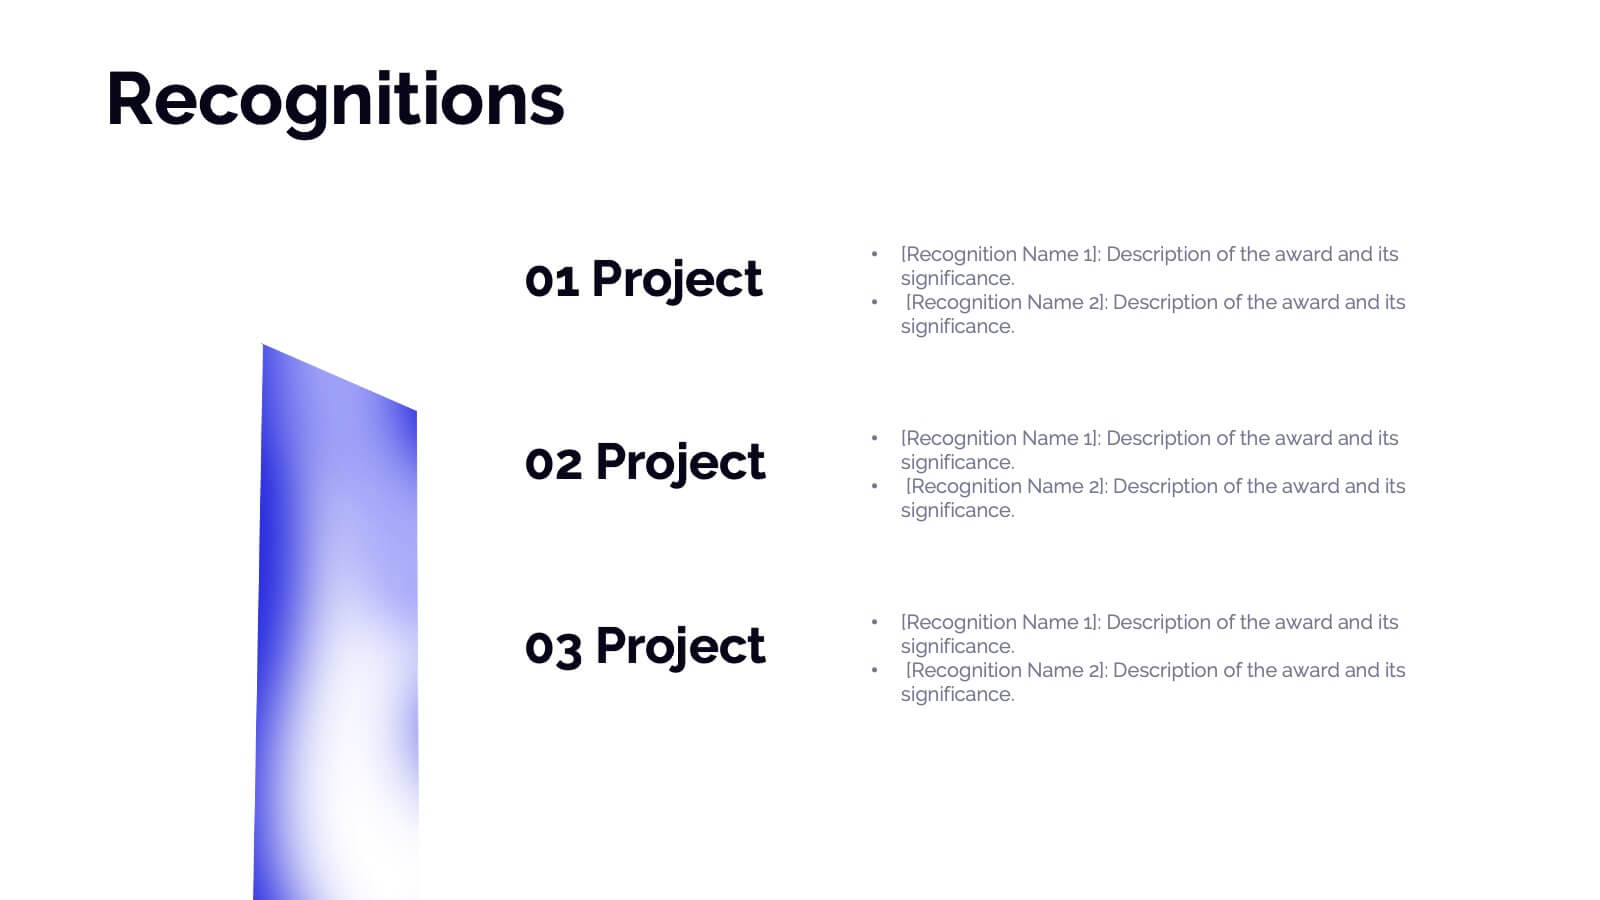
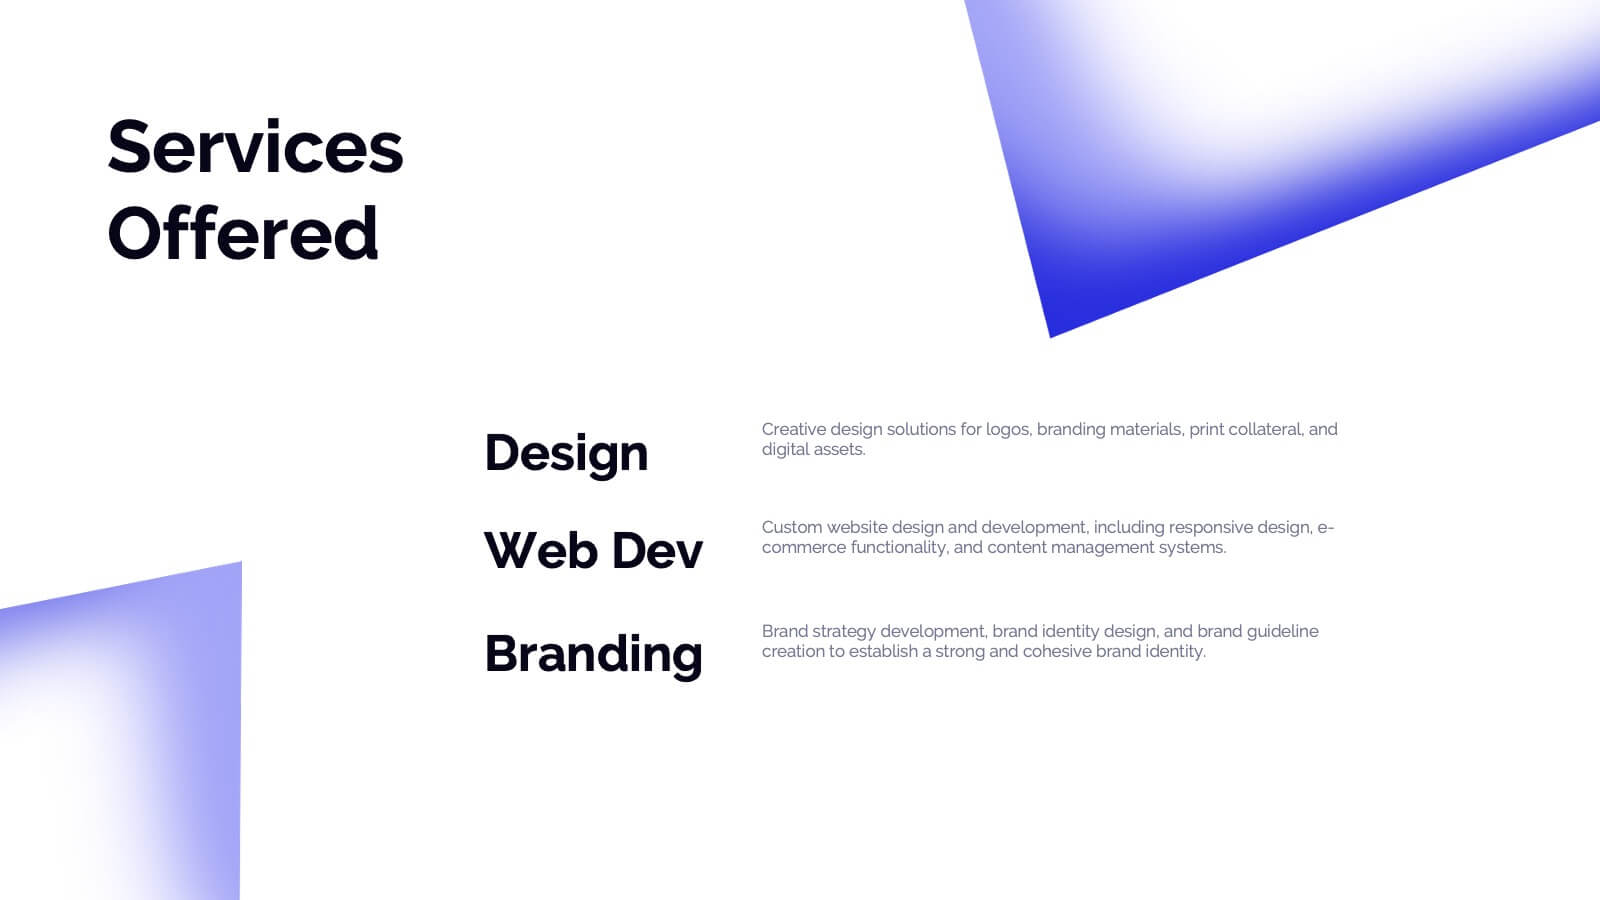
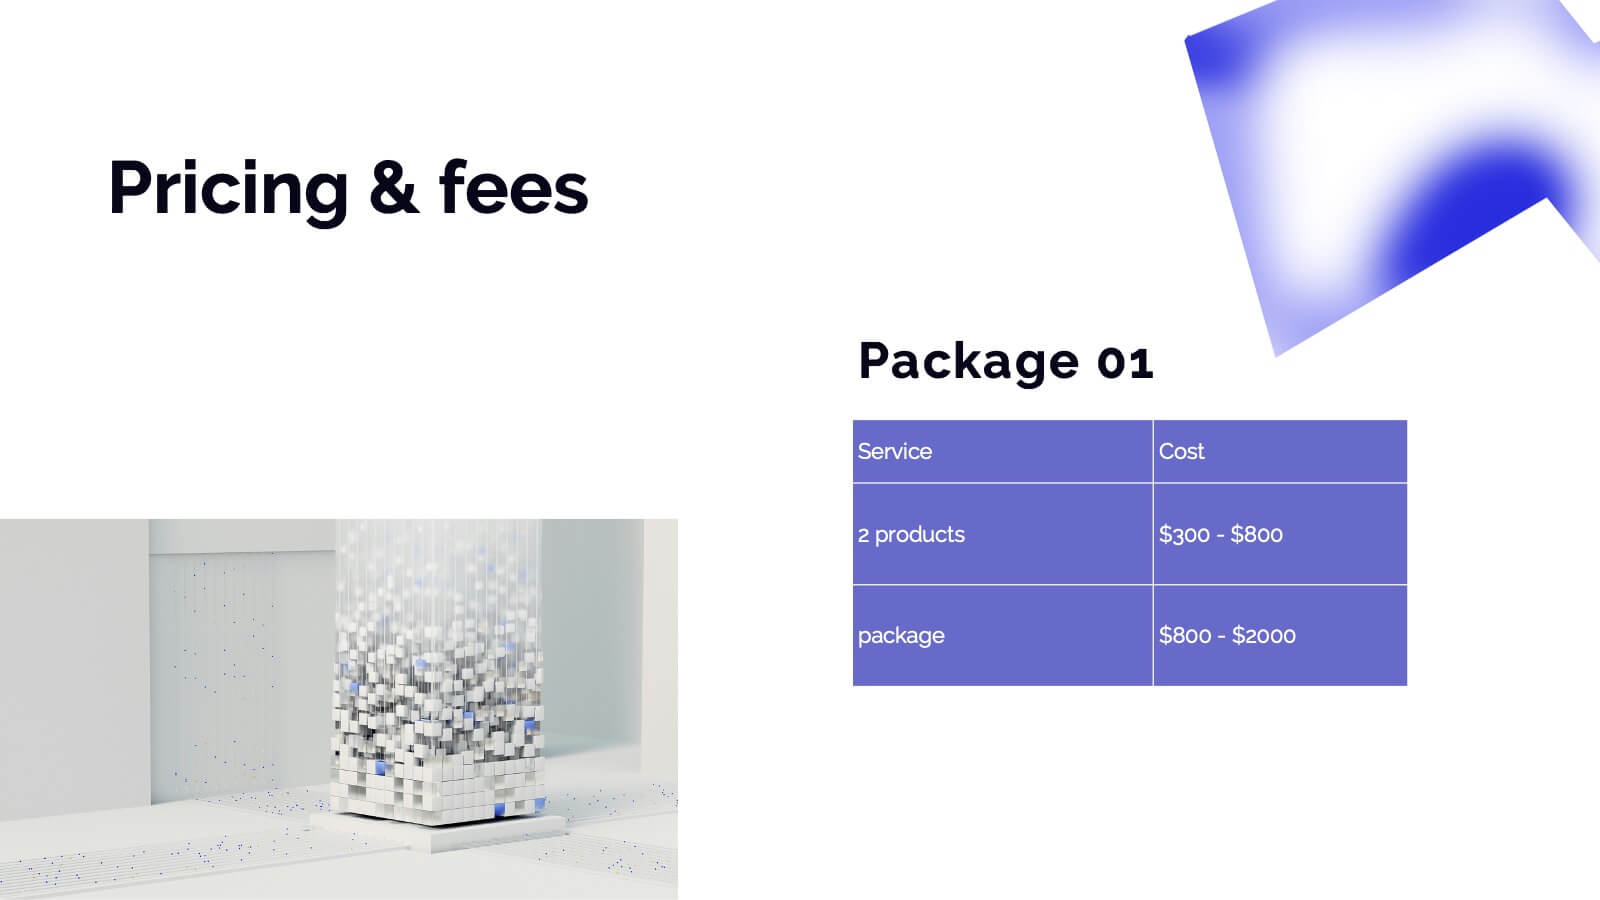
Dryad Photography Portfolio Template Presentation
Showcase your photography skills with this elegant and professional portfolio presentation template! Perfect for highlighting your projects, style, and creative process, this template covers everything from client testimonials to pricing and services offered. It’s ideal for photographers wanting to present their work with style and clarity. Compatible with PowerPoint, Keynote, and Google Slides for effortless sharing and presentations.


8 diapositivas
Lean Business Model Canvas Framework Presentation
Visualize your entire business strategy on a single slide with this Lean Business Model Canvas. Ideal for startups or strategic planning, each editable block represents a key area: value propositions, customer segments, revenue, and more. Streamlined and clear, it's perfect for team alignment or investor-ready business model pitches.


4 diapositivas
Current vs Future State Gap Presentation
Take your audience on a journey of progress with this dynamic slide, designed to clearly compare where things stand today and where they’re headed next. It helps highlight key gaps, improvement areas, and strategic opportunities with a simple, visual flow. Fully compatible with PowerPoint, Keynote, and Google Slides.


6 diapositivas
Business Calendar and Monthly Overview Presentation
Bring structure to your chaos with a bold and colorful visual planner! This easy-to-use layout helps track tasks, deadlines, or projects across multiple months in one glance. Ideal for team coordination or solo planning. Fully editable and compatible with PowerPoint, Keynote, and Google Slides for seamless calendar-based presentations.


8 diapositivas
Training and Development Onboarding Presentation
Streamline the training and development process for new hires with a structured onboarding funnel. This Training and Development Onboarding template provides a clear, step-by-step visualization of how employees progress through the learning process. Perfect for HR managers, trainers, and corporate educators. Fully editable and compatible with PowerPoint, Keynote, and Google Slides for easy customization.


4 diapositivas
Meeting Agenda Slide Presentation
Start your presentation with structure and clarity using this sleek, professional layout designed to outline key discussion points with style. Perfect for business meetings, workshops, or team updates, it keeps information clear and visually balanced. Fully compatible with PowerPoint, Keynote, and Google Slides for effortless editing and customization.


20 diapositivas
Elysium Product Launch Presentation
Launch your new skincare product with this stylish presentation template. Highlight key features, target market, pain points, and unique selling propositions. Perfect for marketing strategies and production processes. Fully compatible with PowerPoint, Keynote, and Google Slides.


5 diapositivas
Brainstorming Spider Chart Presentation
Turn your ideas into action with a clean, modern design that keeps every thought connected and easy to follow. This presentation helps teams brainstorm, organize concepts, and refine strategies with clarity and flow. Fully editable and compatible with PowerPoint, Keynote, and Google Slides for seamless collaboration.