


Características


¿Tienes alguna pregunta?
Recomendar


2 diapositivas
Target Audience and Persona Development Presentation
Bring your audience straight into the heart of your ideal customer with a vibrant, story-focused slide that highlights goals, motivations, data insights, and key pain points. This presentation makes it easy to communicate who you’re targeting and why it matters. Fully compatible with PowerPoint, Keynote, and Google Slides.


5 diapositivas
Product Life Cycle Diagram Presentation
Bring your business insights to life with this dynamic visual layout designed to simplify complex growth stages. Ideal for showcasing product performance, innovation timelines, or strategic planning, it transforms data into a clear, engaging narrative. Fully editable and compatible with PowerPoint, Keynote, and Google Slides for professional use.


5 diapositivas
Project Execution Next Steps Presentation
Streamline your workflow with the Project Execution Next Steps Presentation template. Designed for project managers and teams, this visual slide helps break down execution phases into clear, actionable steps. The connected chain layout ensures smooth project tracking, making it easy to communicate progress and responsibilities. Fully customizable in PowerPoint, Keynote, and Google Slides for seamless project planning and execution.


4 diapositivas
Objectives and Key Results Overview Presentation
Set your goals, define success, and visualize progress with a sleek, easy-to-follow layout that connects objectives to measurable outcomes. Ideal for business strategy, team performance, or quarterly reviews, this presentation keeps your message clear and professional. Fully compatible with PowerPoint, Keynote, and Google Slides for effortless editing.


5 diapositivas
Business Opportunity in Europe Map Presentation
Identify key growth areas across Europe with this clean, data-driven presentation. Highlight business potential using country-based color coding and progress indicators. Perfect for market analysis, investment pitches, or strategic expansion reports. Fully editable and compatible with PowerPoint, Keynote, and Google Slides for effortless customization and professional presentation delivery.


7 diapositivas
Sustainability Business Management Infographic Presentation
Sustainability Management presents information related to sustainable business practices and management strategies. The goal of this template is to help you create a balance between environmental factors to ensure long-term success for a business or organization. This infographic can cover a variety of topics, including sustainable supply chain management, energy, resource efficiency, and waste reduction. This template has different layouts including diagrams and graphs. It also includes icons, symbols, and color-coding to make the information more accessible and easier to understand.


6 diapositivas
Amortization Schedule Infographic
An amortization schedule is a detailed table that outlines the repayment of a loan over time. This infographic can be a helpful way to visually explain the repayment schedule of a loan or mortgage. Divide it into sections, including an introduction, explanation of terms, example calculations, and key takeaways. Compatible with Powerpoint, Keynote, and Google Slides. Use icons or visuals to represent loan-related concepts, such as a house for mortgages, a money bag for payments, or a graph for interest rates. The line graphs included can show the decreasing principal balance over time, with interest and principal portions highlighted.


20 diapositivas
Mythion Business Idea Pitch Deck Presentation
Communicate your business vision with clarity and impact using this comprehensive pitch deck presentation template. Perfect for entrepreneurs, startups, and innovators, this template is designed to help you effectively present your idea to investors, stakeholders, or partners. Cover every essential aspect of your business journey with slides dedicated to the problem statement, solutions, market overview, and target audience. Showcase your business model, revenue projections, and unique selling proposition with visually appealing layouts. Highlight your marketing strategy, growth projections, and funding requirements to build a strong, persuasive case. Fully customizable and compatible with PowerPoint, Google Slides, and Keynote, this template allows you to tailor each slide to suit your business identity and goals. Whether you're pitching a new idea or seeking investment, this template ensures you present with professionalism and confidence.


8 diapositivas
Data-Driven Market Segmentation
Visualize customer insights with clarity using the Data-Driven Market Segmentation Presentation. This dynamic circular infographic displays four key segments, each with percentage labels and curved connectors pointing to detailed descriptions. Ideal for marketing analysts, product strategists, or data-driven teams aiming to present behavioral, demographic, or purchasing trends. The sleek, radial layout makes comparisons intuitive and engaging. Fully editable in PowerPoint, Keynote, and Google Slides—customize colors, icons, and data points to match your brand and message.


6 diapositivas
Communication Plan Infographic
A communication plan is a strategic document that outlines how an organization or project team intends to communicate with various stakeholders. This infographic template is designed with a structured approach to deliver consistent and effective messages to ensure that all viewers are informed, engaged, and aligned. This template outlines the strategies and tactics for effectively conveying information within an organization or to a target audience. Compatible with Powerpoint, Keynote, and Google Slides. This serves as a quick reference guide for effective communication strategies and help your audience understand the key elements of your plan.

23 diapositivas
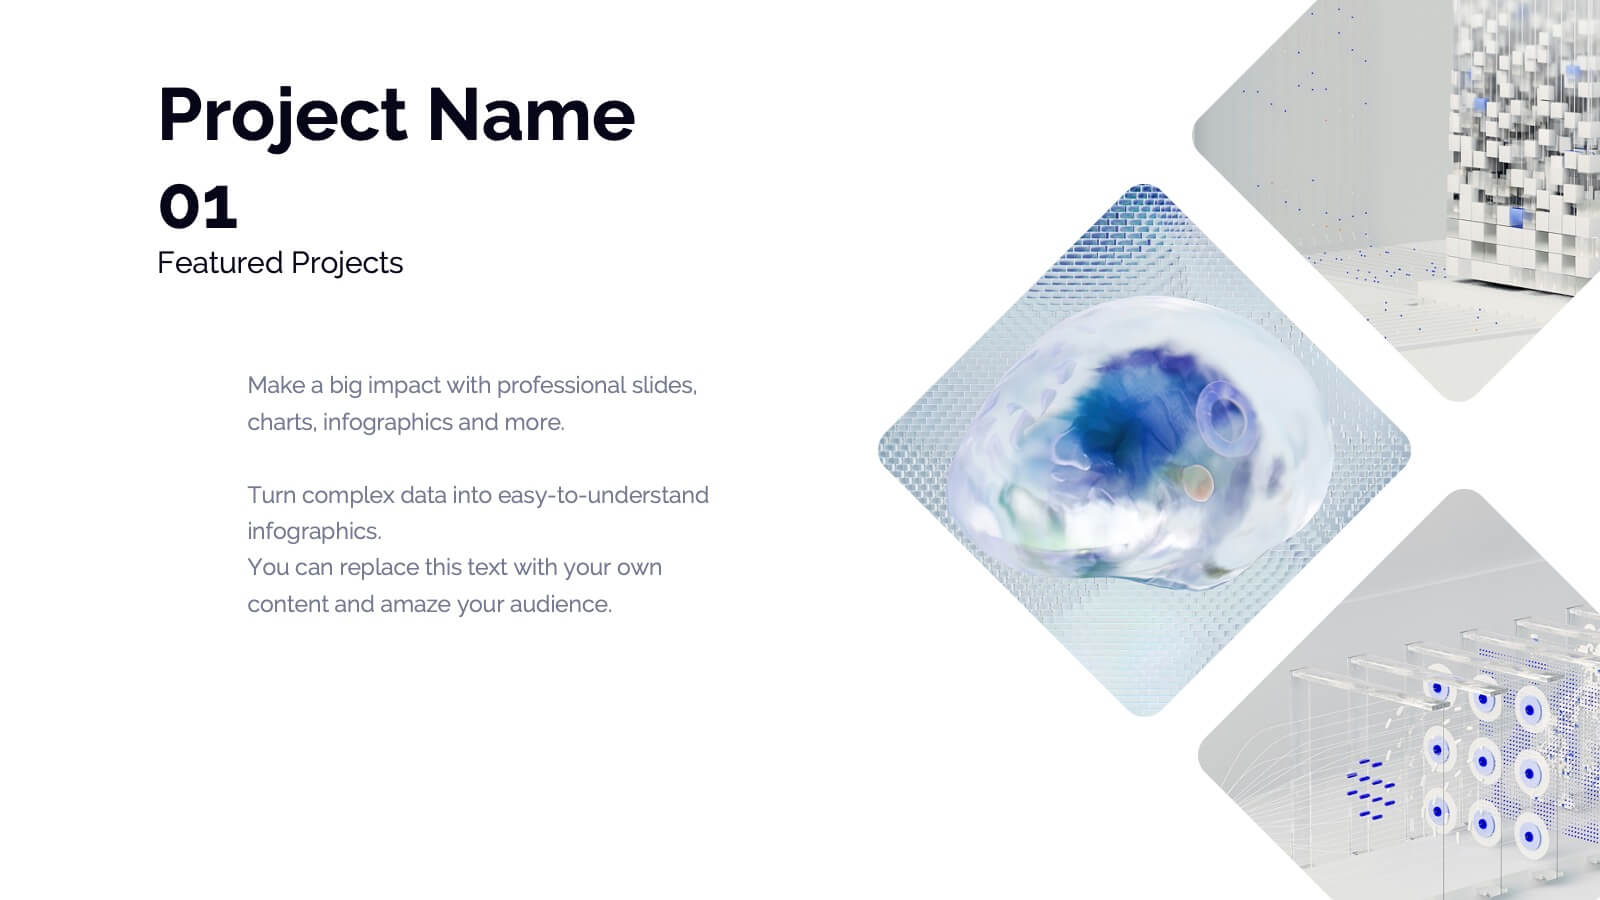
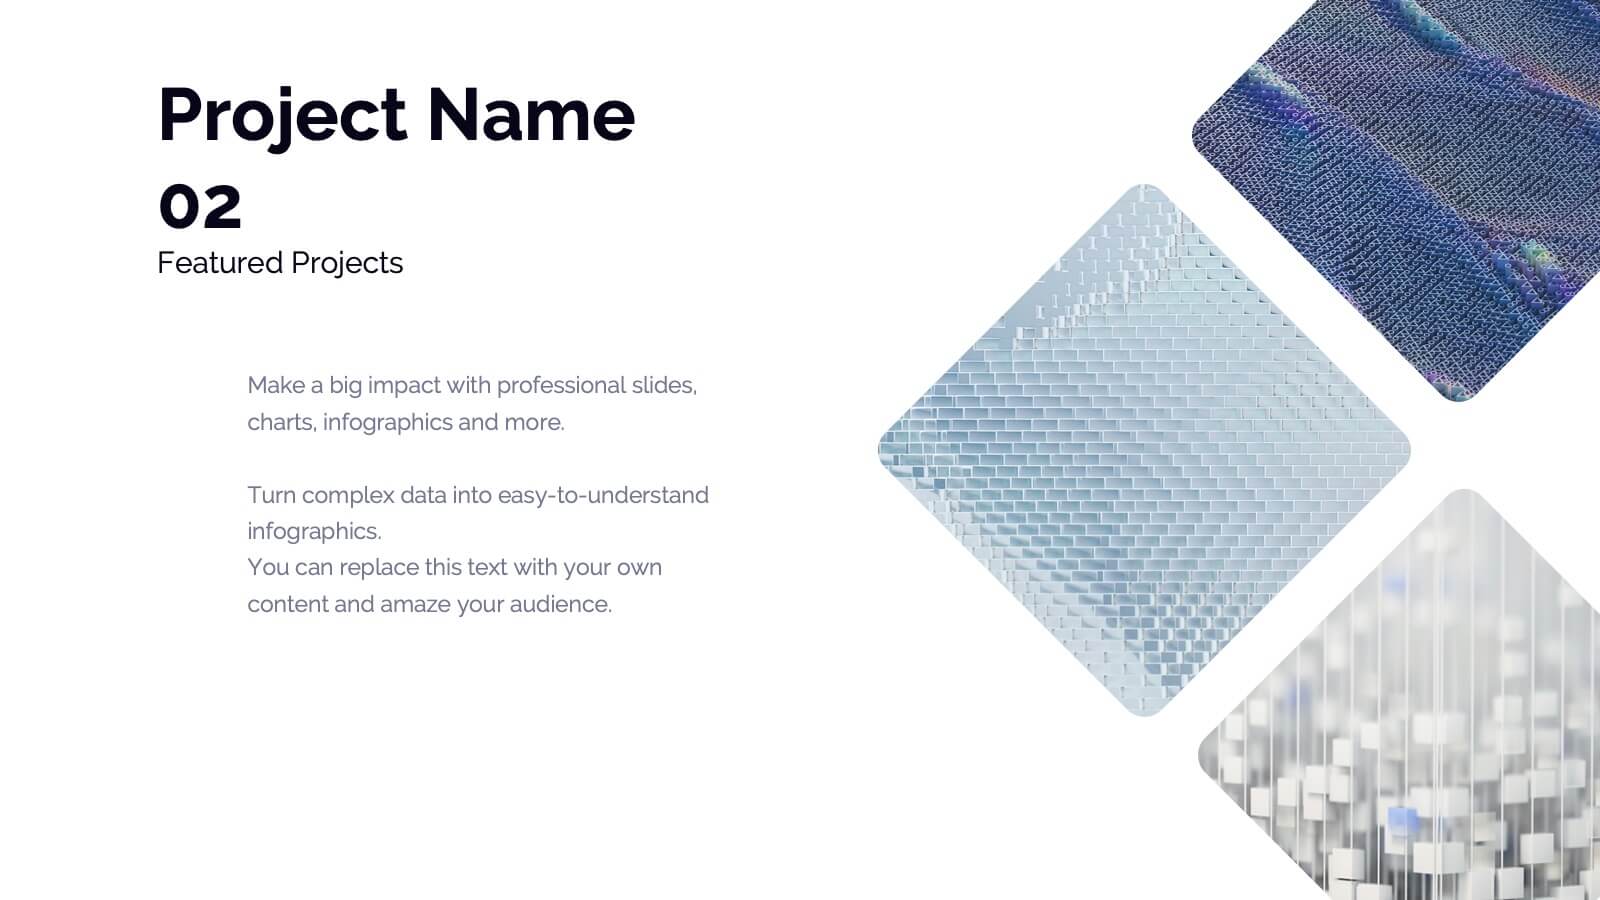
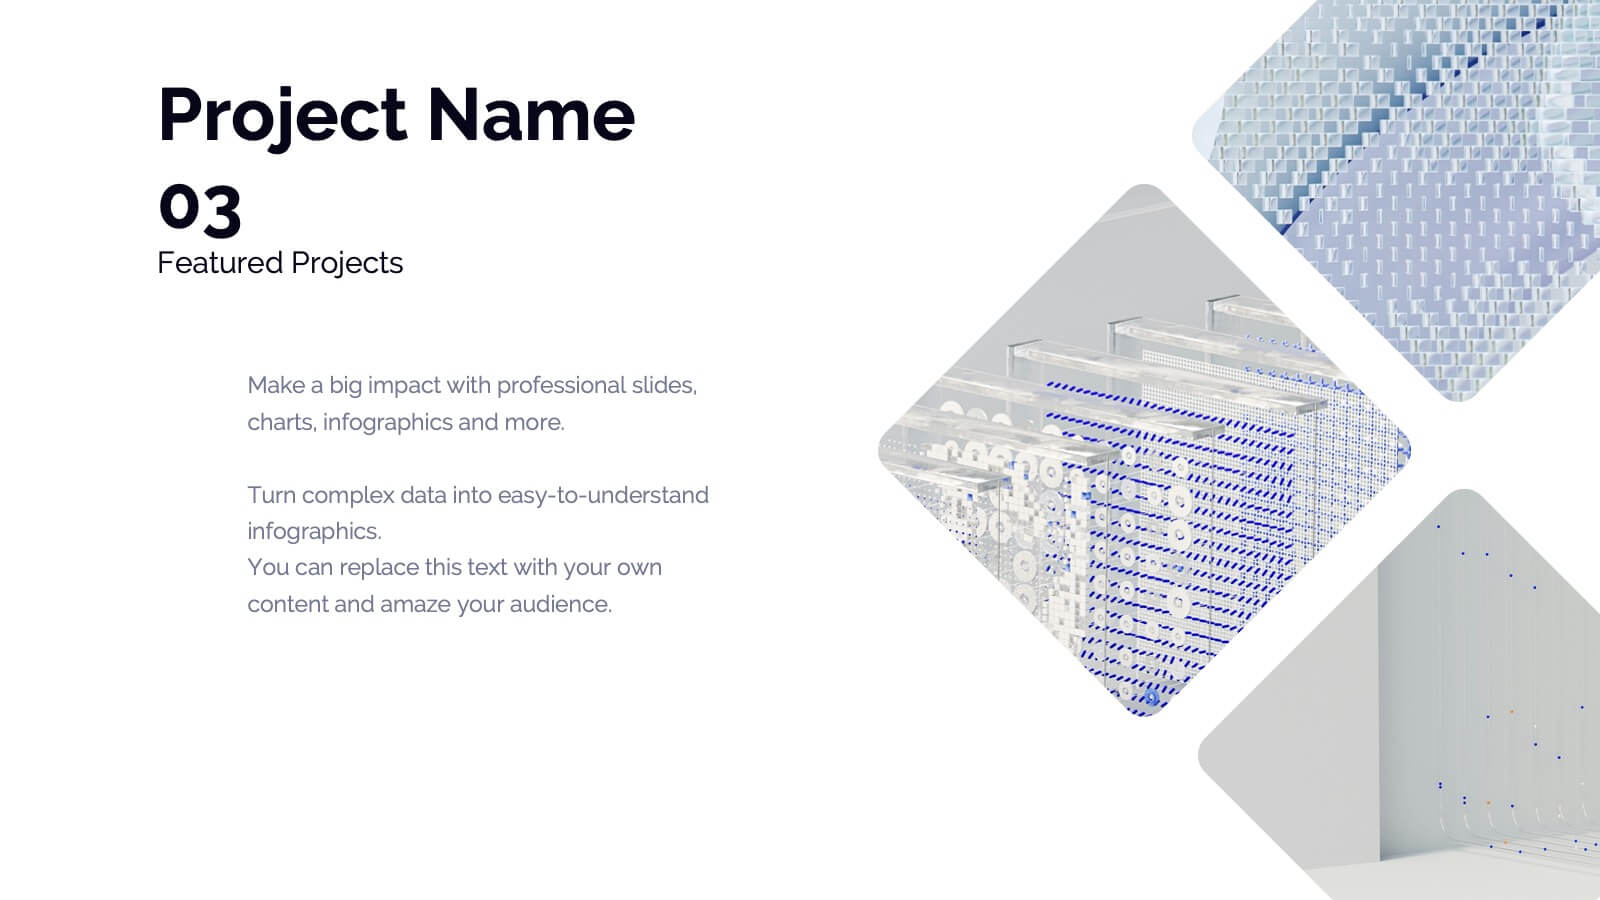
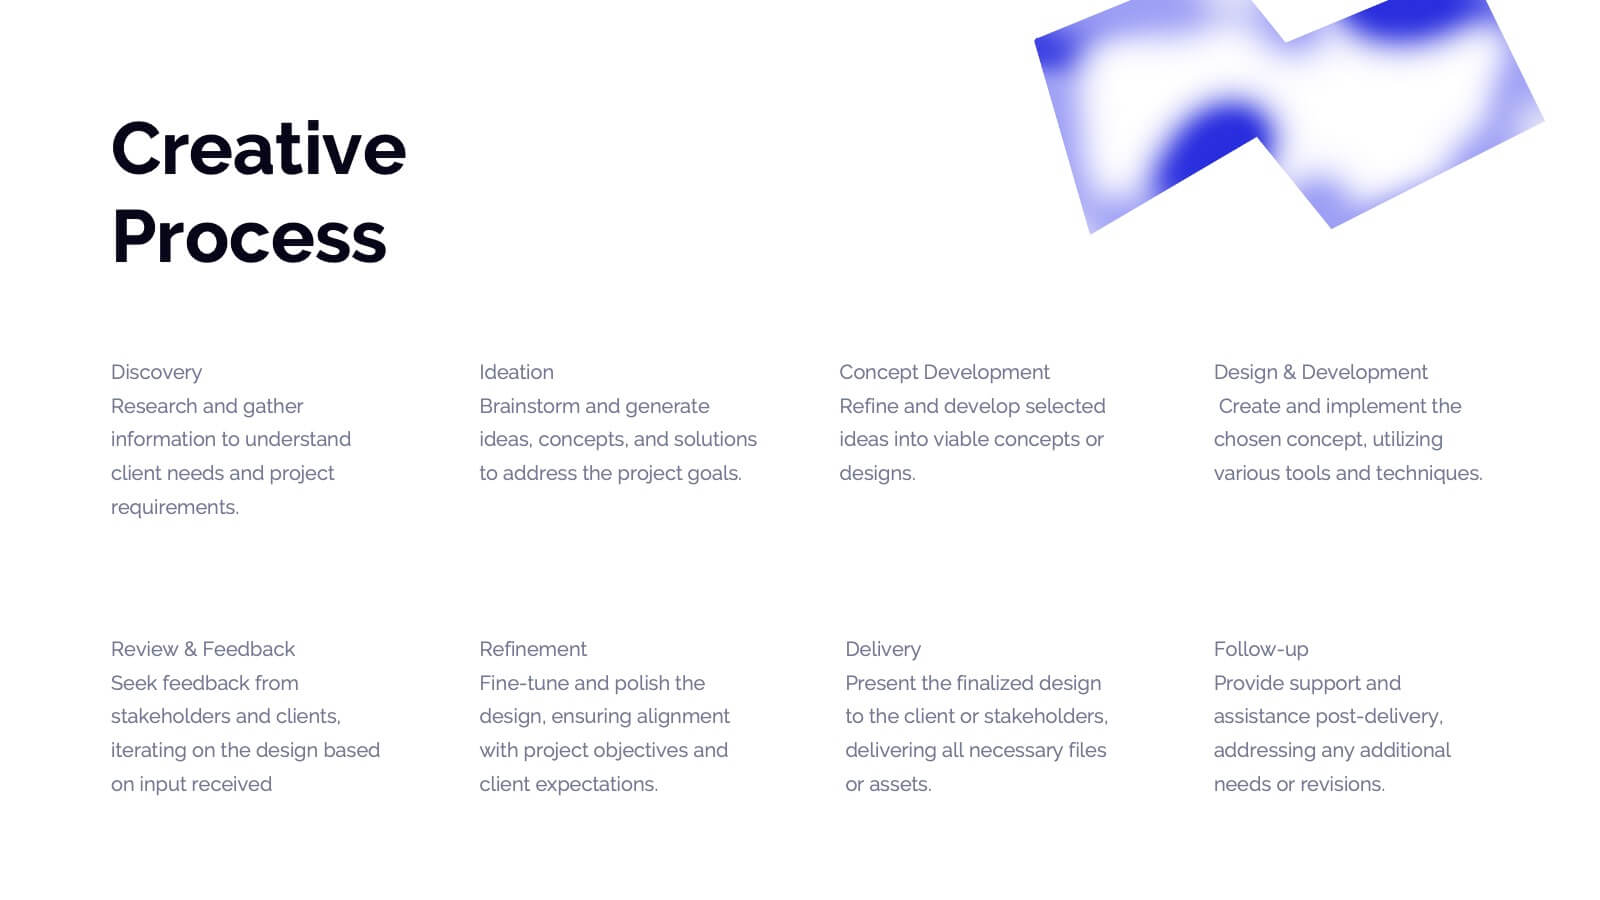
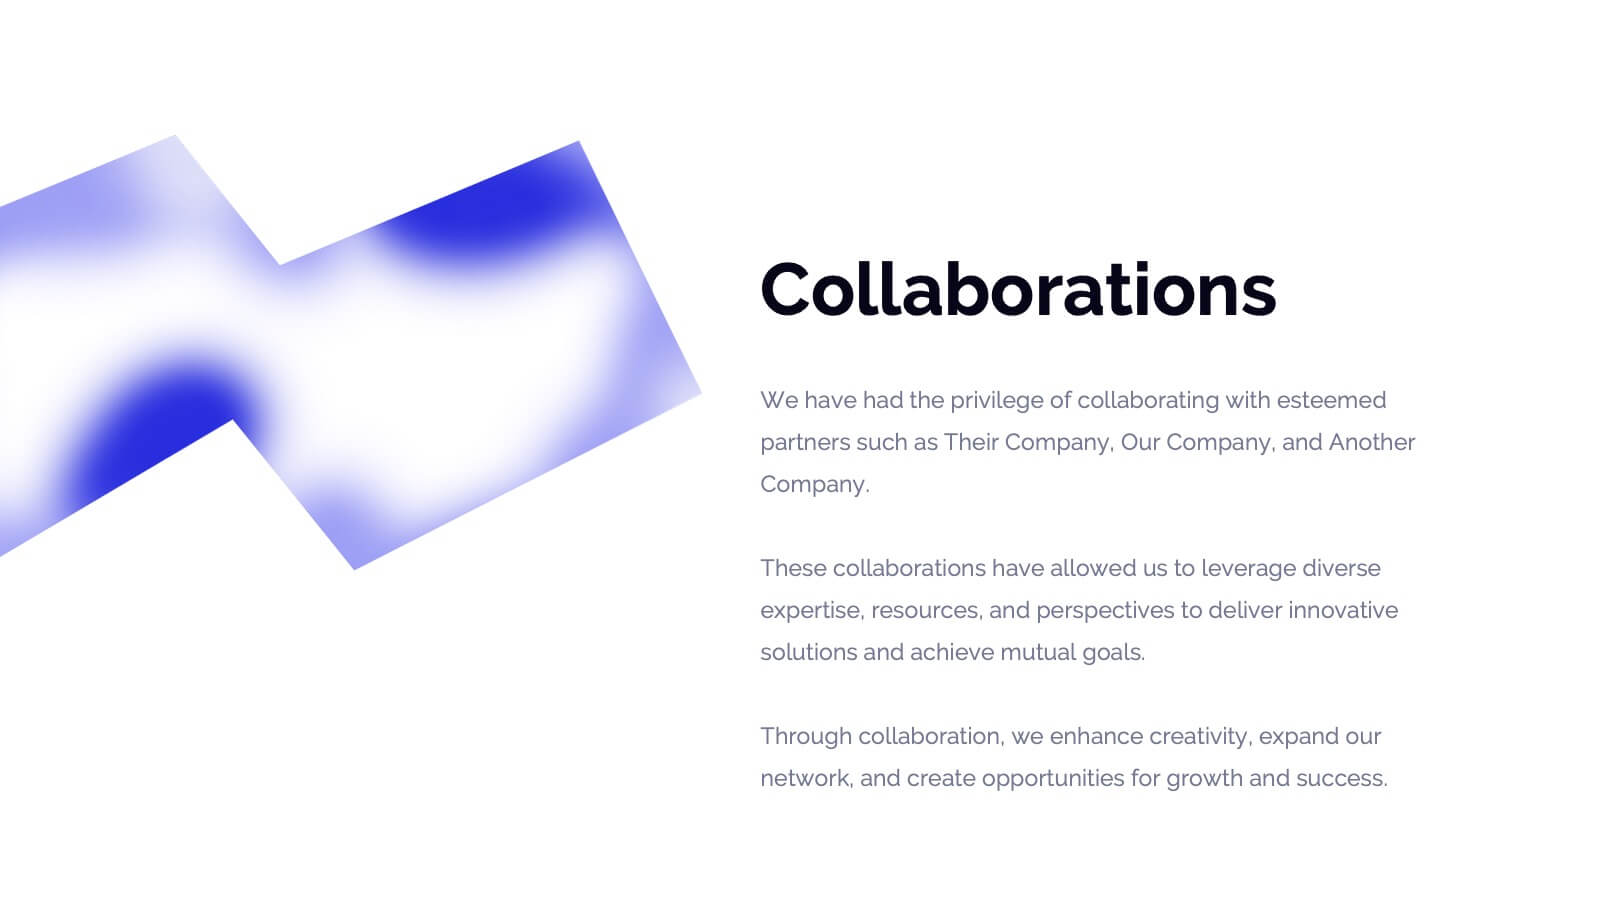
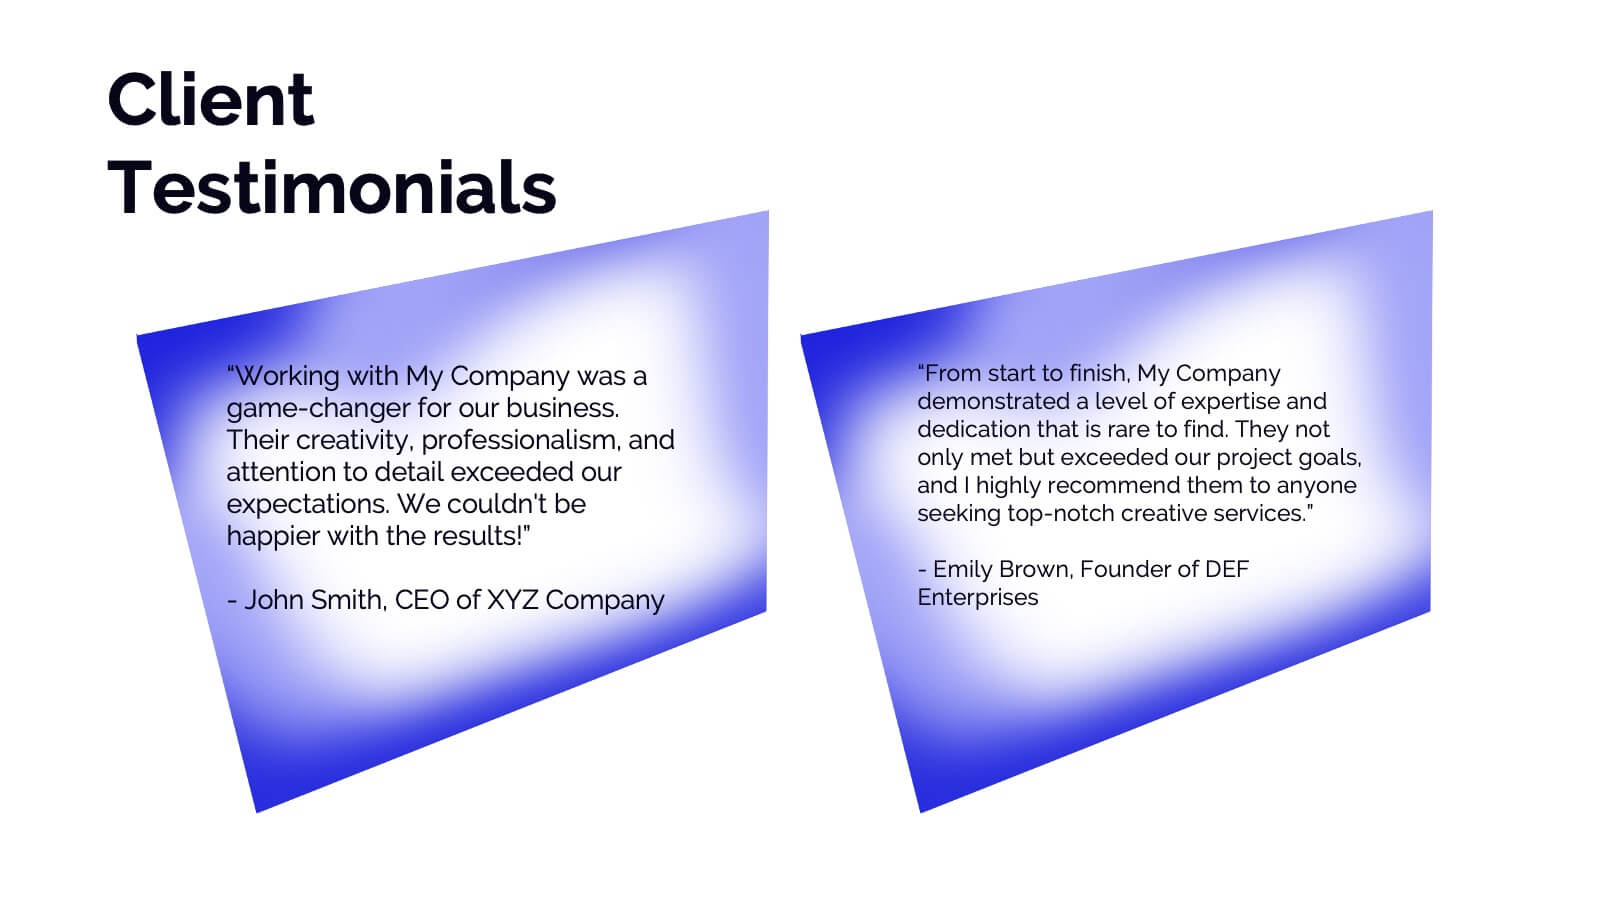
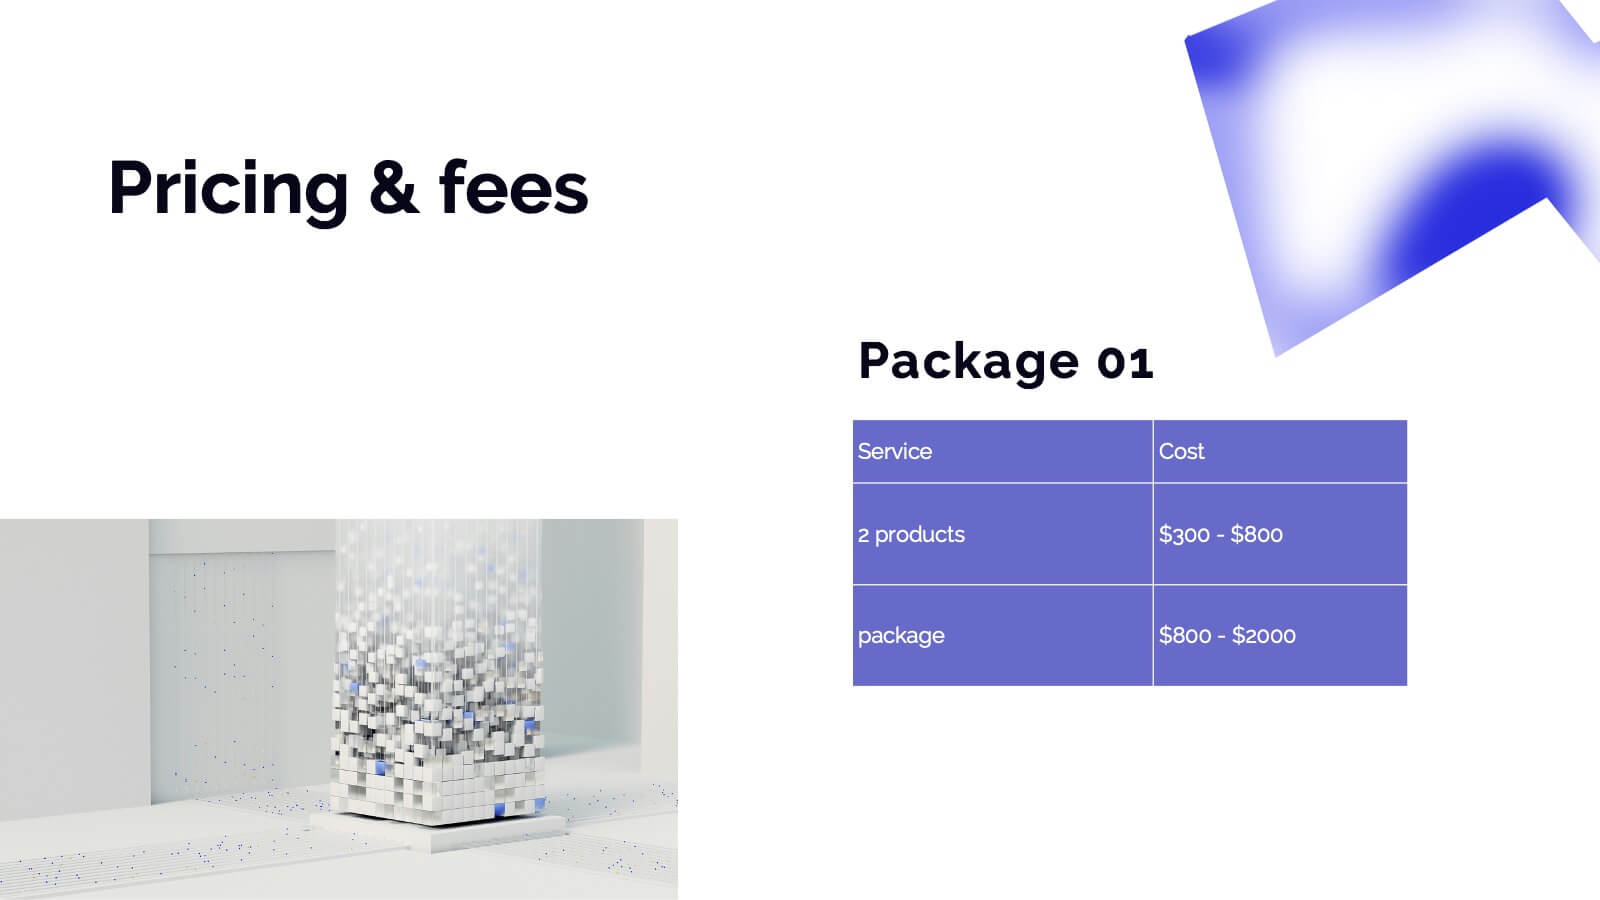
Dryad Photography Portfolio Template Presentation
Showcase your photography skills with this elegant and professional portfolio presentation template! Perfect for highlighting your projects, style, and creative process, this template covers everything from client testimonials to pricing and services offered. It’s ideal for photographers wanting to present their work with style and clarity. Compatible with PowerPoint, Keynote, and Google Slides for effortless sharing and presentations.


6 diapositivas
Governance Structure Overview Presentation
A clear, polished flow of ideas makes this slide instantly engaging, guiding viewers through each essential component with ease. This presentation explains how an organization structures oversight, responsibilities, and decision-making to ensure accountability and performance. Clean icons and balanced spacing keep everything easy to follow. Fully compatible with PowerPoint, Keynote, and Google Slides.


34 diapositivas
MVP Startup
An MVP Startup is a type of business that focuses on developing and launching a minimal version of their product or service with the basic features required to test its viability in the market and gather feedback. This template is designed with a bold and dynamic red color palette, perfect for start-ups that want to convey a sense of passion, innovation, and urgency. It features a range of customizable slides that are specifically tailored for start-up presentations to showcase your MVP concept, market validation, and growth strategy. Compatible with Powerpoint, Keynote, and Google slides, all 34 slides are fully editable.


8 diapositivas
Beginner's Guide to Stock Market Presentation
Turn complex financial ideas into simple, engaging visuals with this sleek, data-driven design. Perfect for explaining market basics, investment growth, and trading concepts in a way that’s easy to follow and visually appealing. Fully compatible with PowerPoint, Keynote, and Google Slides for effortless editing and presentation customization.


5 diapositivas
AI Trends and Innovations Presentation
The "AI Trends and Innovations" presentation template is elegantly designed to help you convey the latest advancements and trends in artificial intelligence. Each slide focuses on different key points such as machine learning, neural networks, robotics, and data analytics, represented by interconnected icons that visually map the flow of information and ideas. This layout is perfect for professionals seeking to illustrate complex AI concepts in a digestible format, making it ideal for educational presentations, tech conferences, or internal company meetings focused on technological growth and innovation.


6 diapositivas
Behavioral Psychology Insights
Discover what drives decision-making with the Behavioral Psychology Insights Presentation. This template is perfect for exploring user behavior, mindset patterns, or psychological triggers in business, marketing, or HR. Professionally designed for PowerPoint, Keynote, and Google Slides—fully editable and easy to adapt.


6 diapositivas
Environmental Protection and Ecology Plan Presentation
Highlight your green initiatives with the Environmental Protection and Ecology Plan Presentation. Featuring a lightbulb-leaf graphic, this template helps you present sustainability goals, eco strategies, and key action steps clearly. Ideal for environmental reports, proposals, or educational content. Fully customizable in Canva, PowerPoint, or Google Slides.