Foundation of Success Pillars Presentation
PowerPoint Template and Google Slides Theme


Características
- Eliminar de favoritos
Plantilla de PowerPoint
1 MB
Plantilla de Google Slides
Enlace externo
Plantilla de Keynote
1 MB
Recomendar
- Eliminar de favoritos
Plantilla de PowerPoint
1 MB
Plantilla de Google Slides
Enlace externo
Plantilla de Keynote
1 MB
6 diapositivas
Business Task Checklist Presentation
Bring order and focus to your workflow with a clean, structured layout that tracks progress and priorities at a glance. Ideal for project updates, task planning, or performance reviews, this presentation makes organization effortless. Fully compatible with PowerPoint, Keynote, and Google Slides for easy customization and professional use.
- Eliminar de favoritos
Plantilla de PowerPoint
1 MB
Plantilla de Google Slides
Enlace externo
Plantilla de Keynote
1 MB
7 diapositivas
Geometric Series Infographic
Geometric series have various applications in mathematics, physics, engineering, economics, and other fields. Get ready for a joyful expedition into the world of numbers, shapes, and patterns with our geometric series infographic. This template is a celebration of mathematical elegance, presented with a burst of enthusiasm to make learning a delightful adventure. This is fully customizable and compatible with Powerpoint, Keynote, and Google Slides. This allows you to paint a vivid picture by relating geometric series to real-life scenarios. Showcase how these mathematical visuals resonates in unexpected places.
- Eliminar de favoritos
Plantilla de PowerPoint
1 MB
Plantilla de Google Slides
Enlace externo
Plantilla de Keynote
1 MB
7 diapositivas
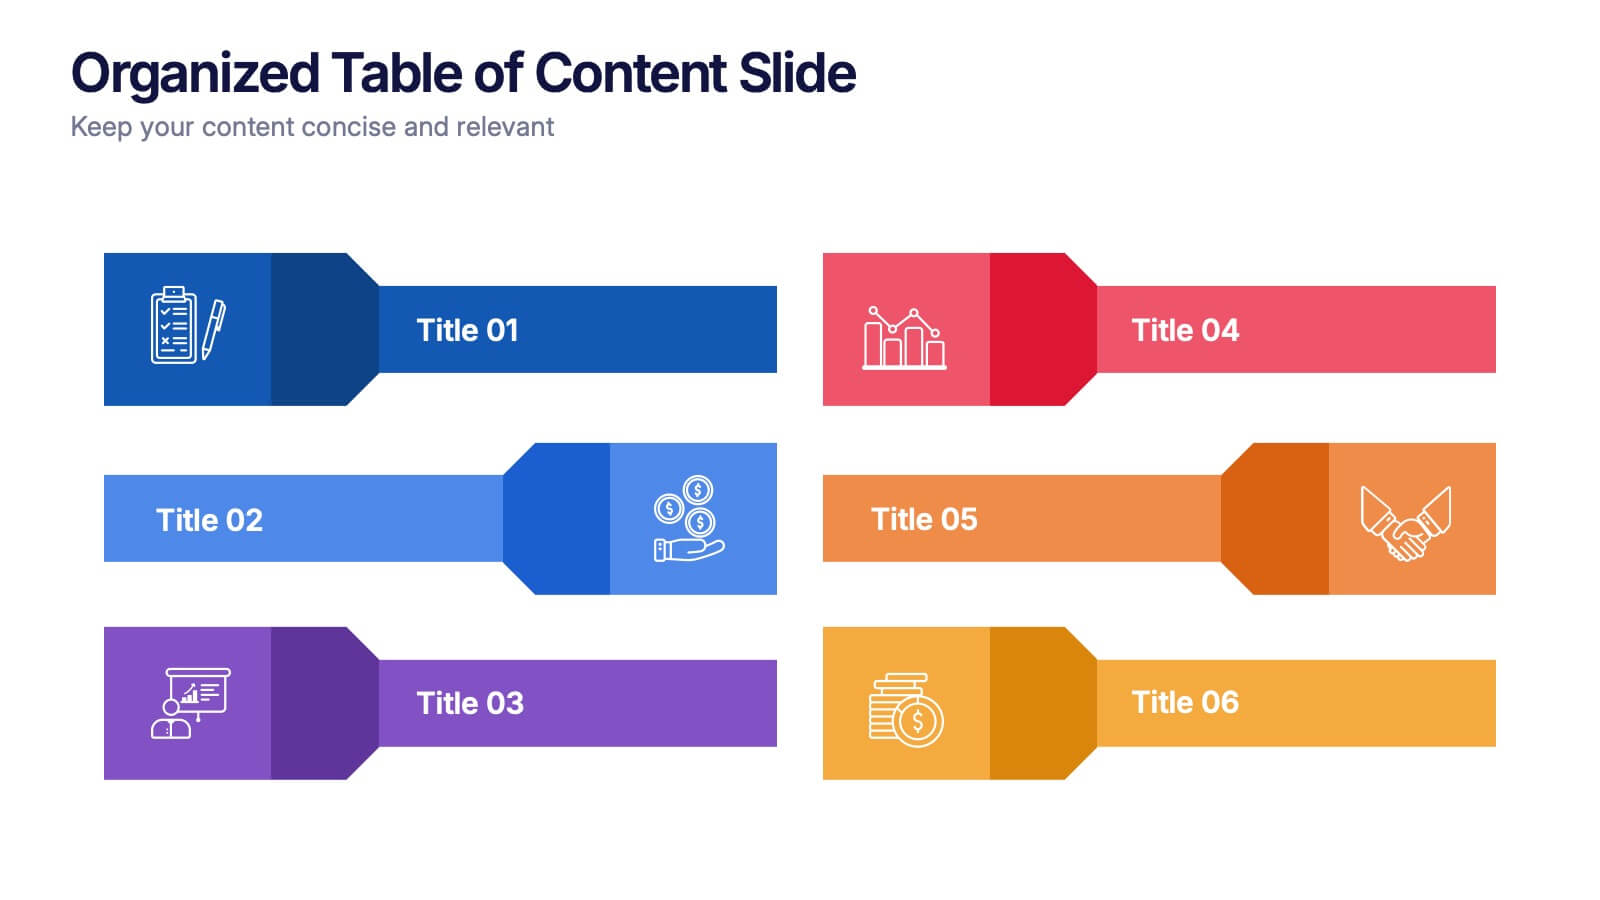
Organized Table of Content Slide Presentation
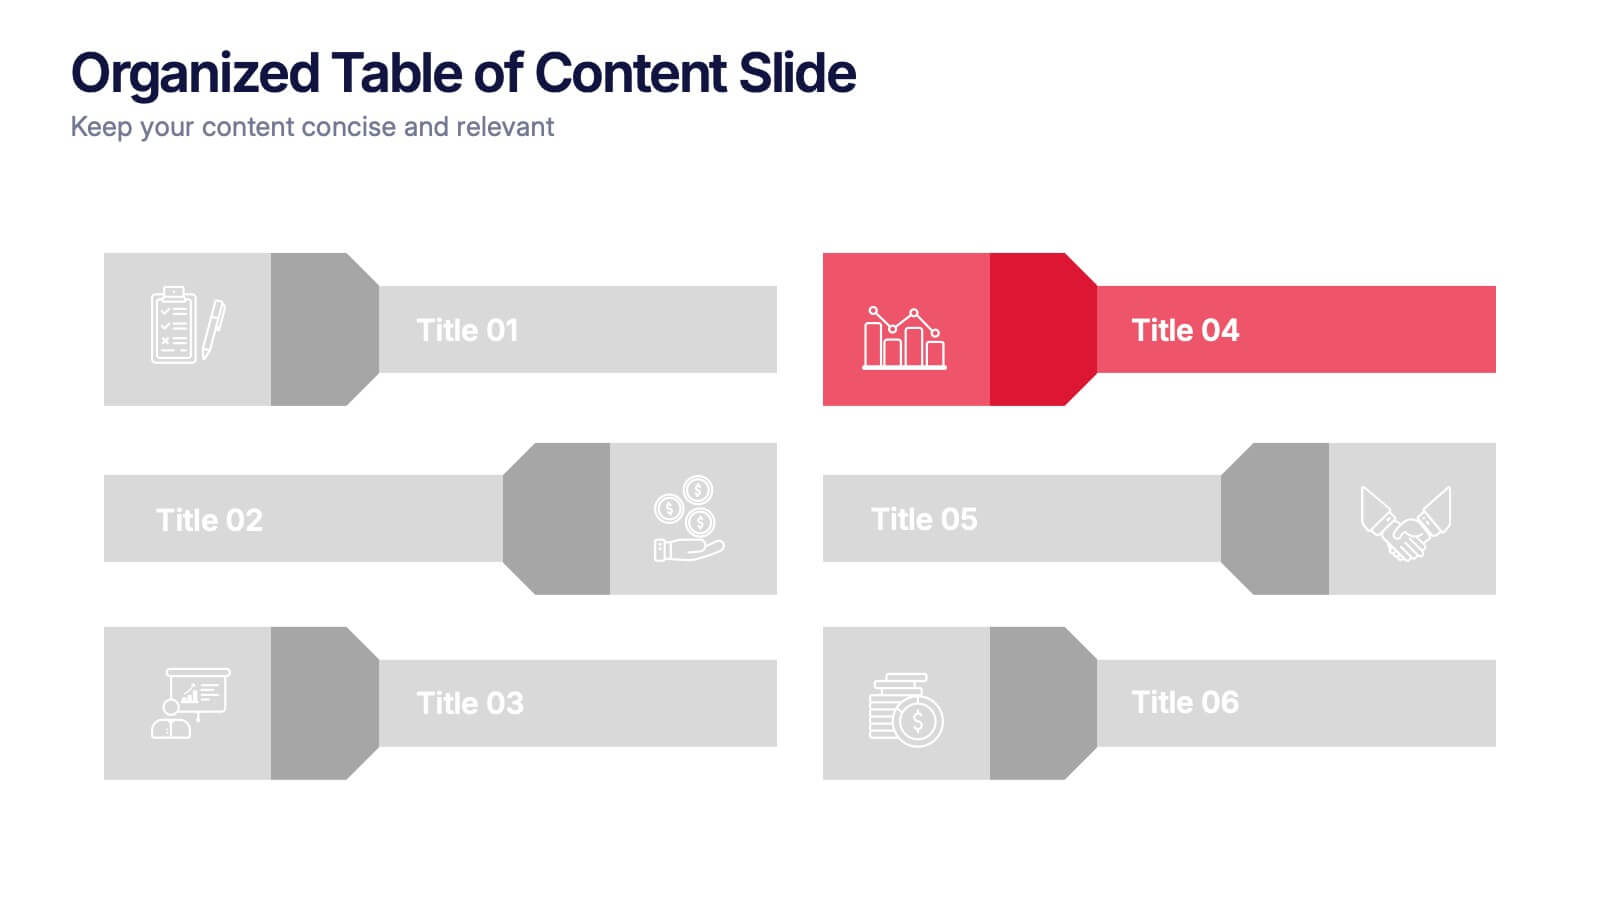
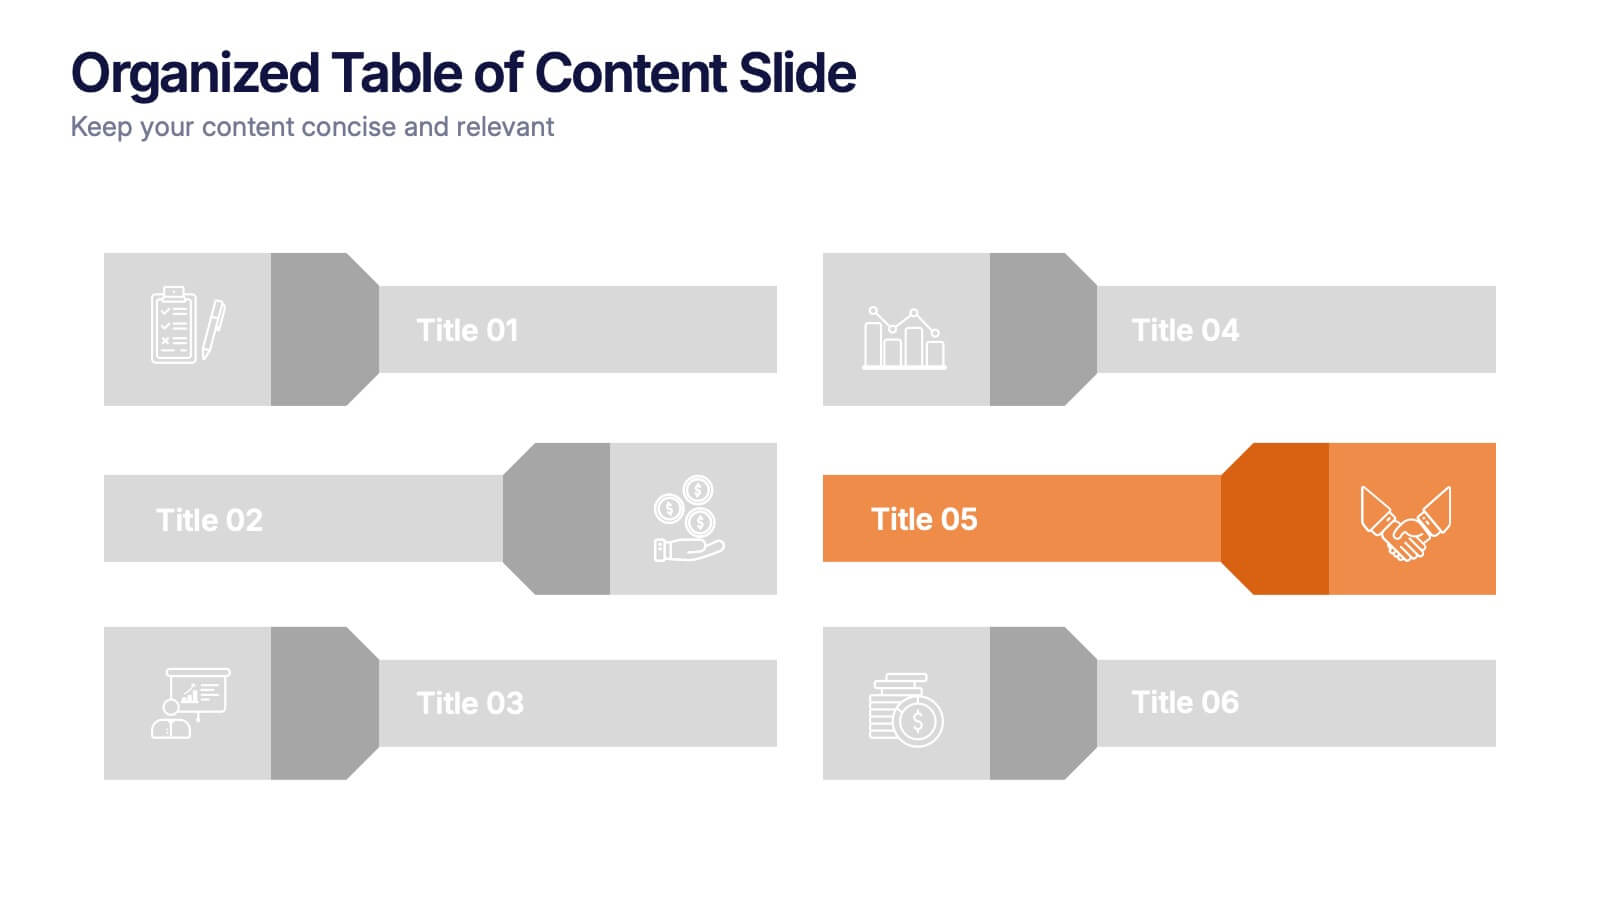
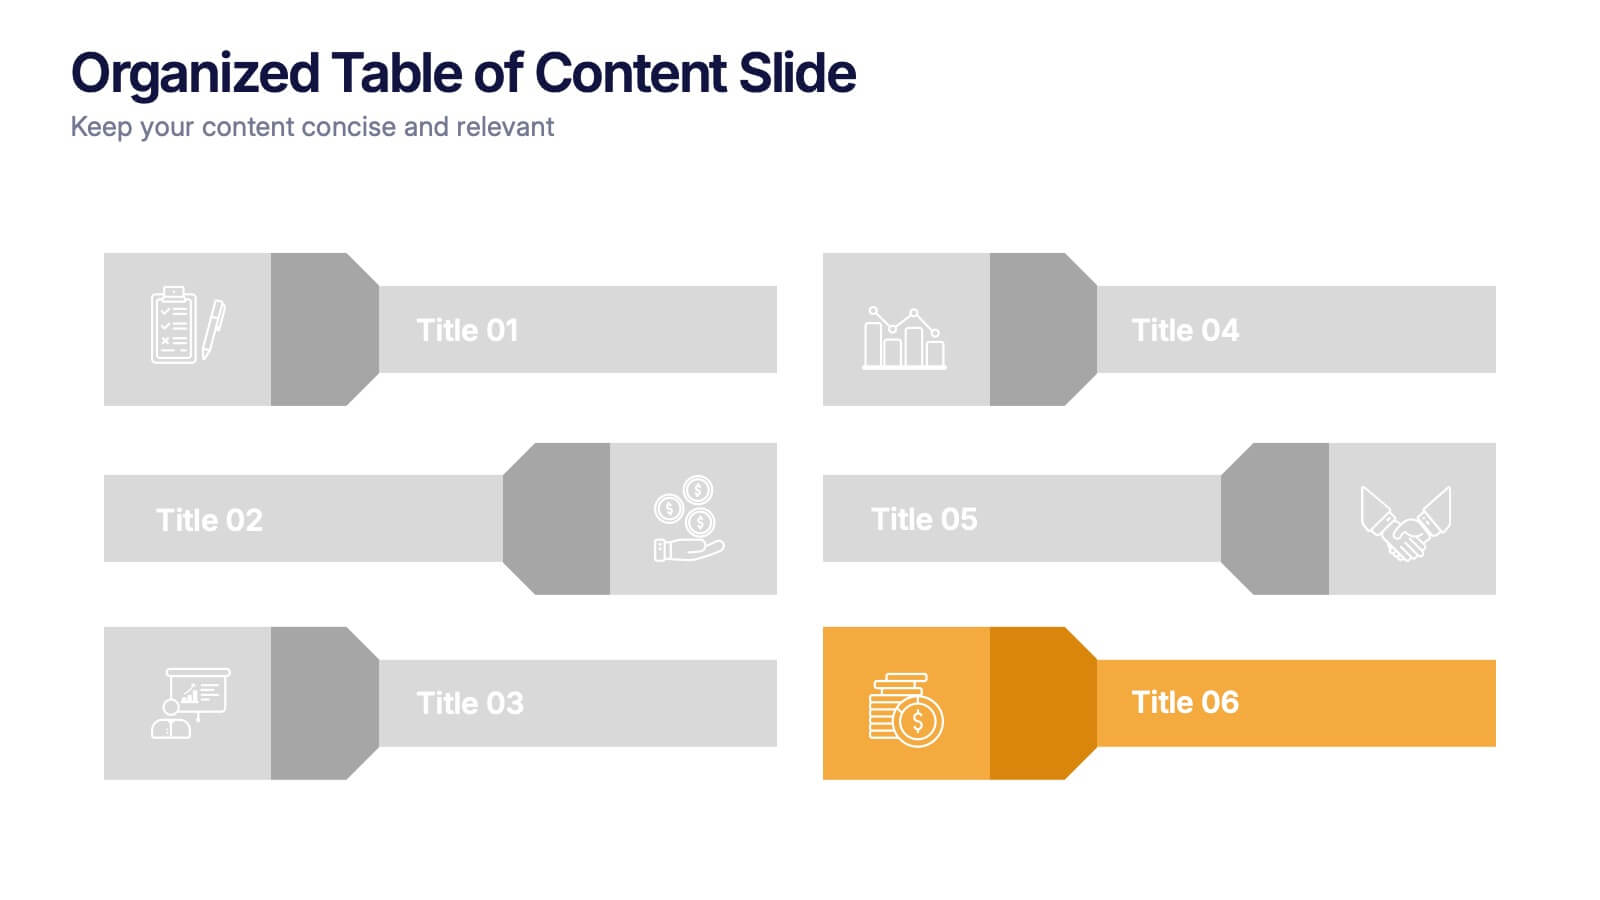
Present your topics with clarity using this Organized Table of Content Slide template. Designed for structured overviews, it features clean, modern layouts with customizable section markers and icons. Ideal for reports, proposals, and presentations. Fully editable in Canva, PowerPoint, and Google Slides to fit your brand’s style and color palette.
- Eliminar de favoritos
Plantilla de PowerPoint
1 MB
Plantilla de Google Slides
Enlace externo
Plantilla de Keynote
1 MB
7 diapositivas
Puzzle Piece Infographic Presentation Template
A puzzle piece infographic is a visual representation of information that uses puzzle pieces as a metaphor to show how different pieces of information fit together to form a complete picture. The puzzle pieces are usually arranged in a specific pattern. This template It's great for explain process or systems, or showing how different pieces of data or information are related to one another. It's compatible with Powerpoint, Keynote, and Google Slides, so you can use it on any device. This template It's perfect for anyone who wants to make their presentations more engaging and interactive.
- Eliminar de favoritos
Plantilla de PowerPoint
1 MB
Plantilla de Google Slides
Enlace externo
Plantilla de Keynote
1 MB
5 diapositivas
WFH Policy Overview Presentation
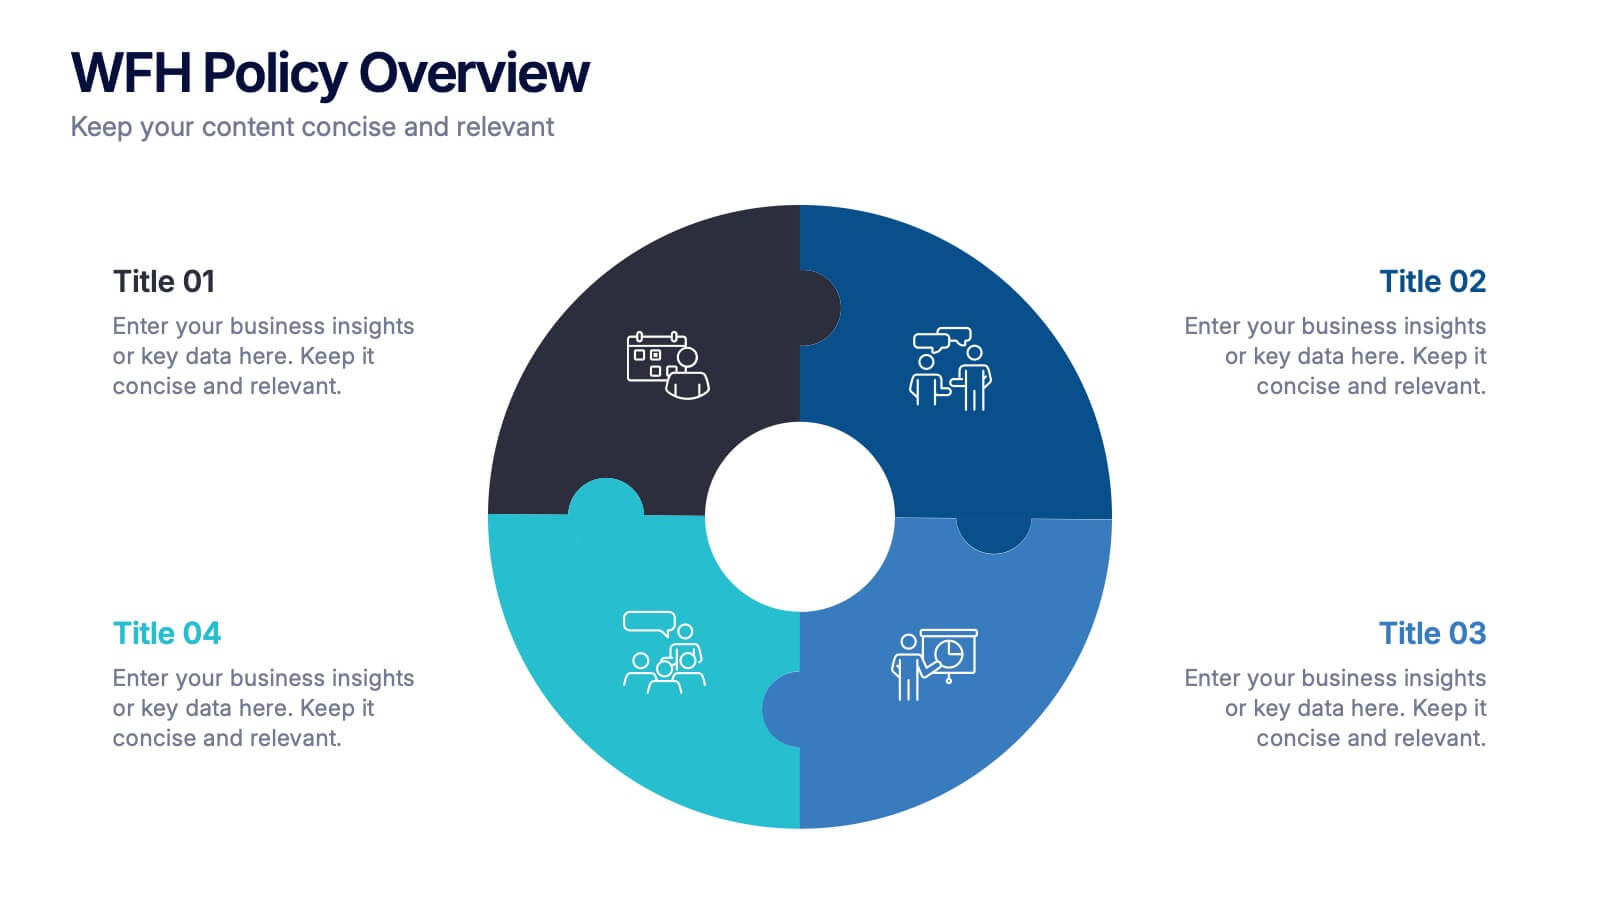
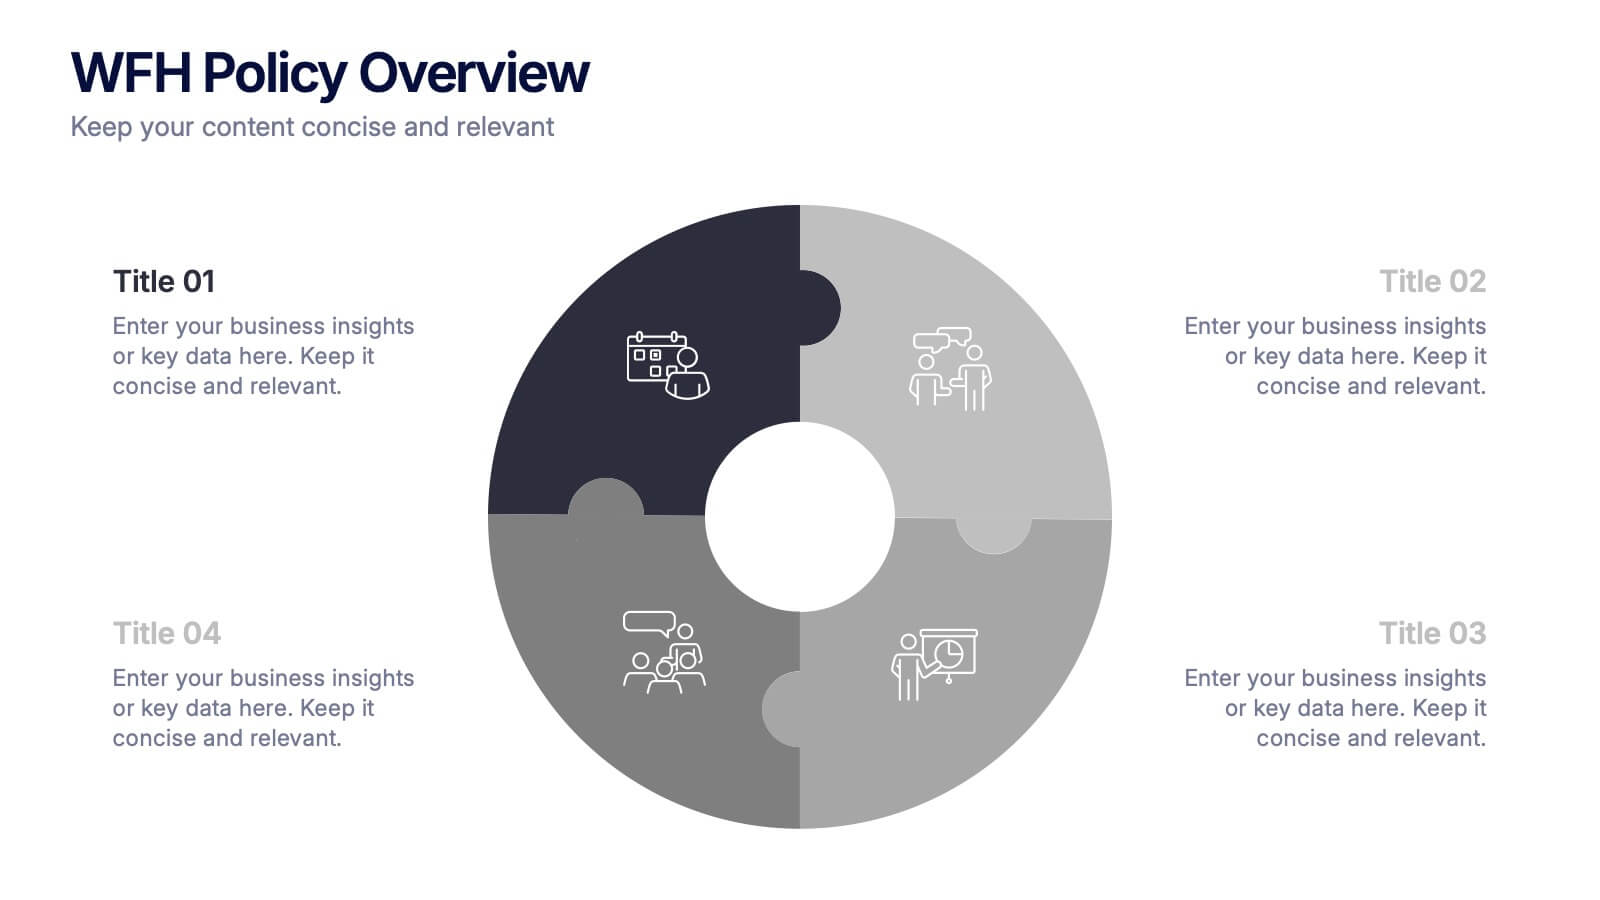
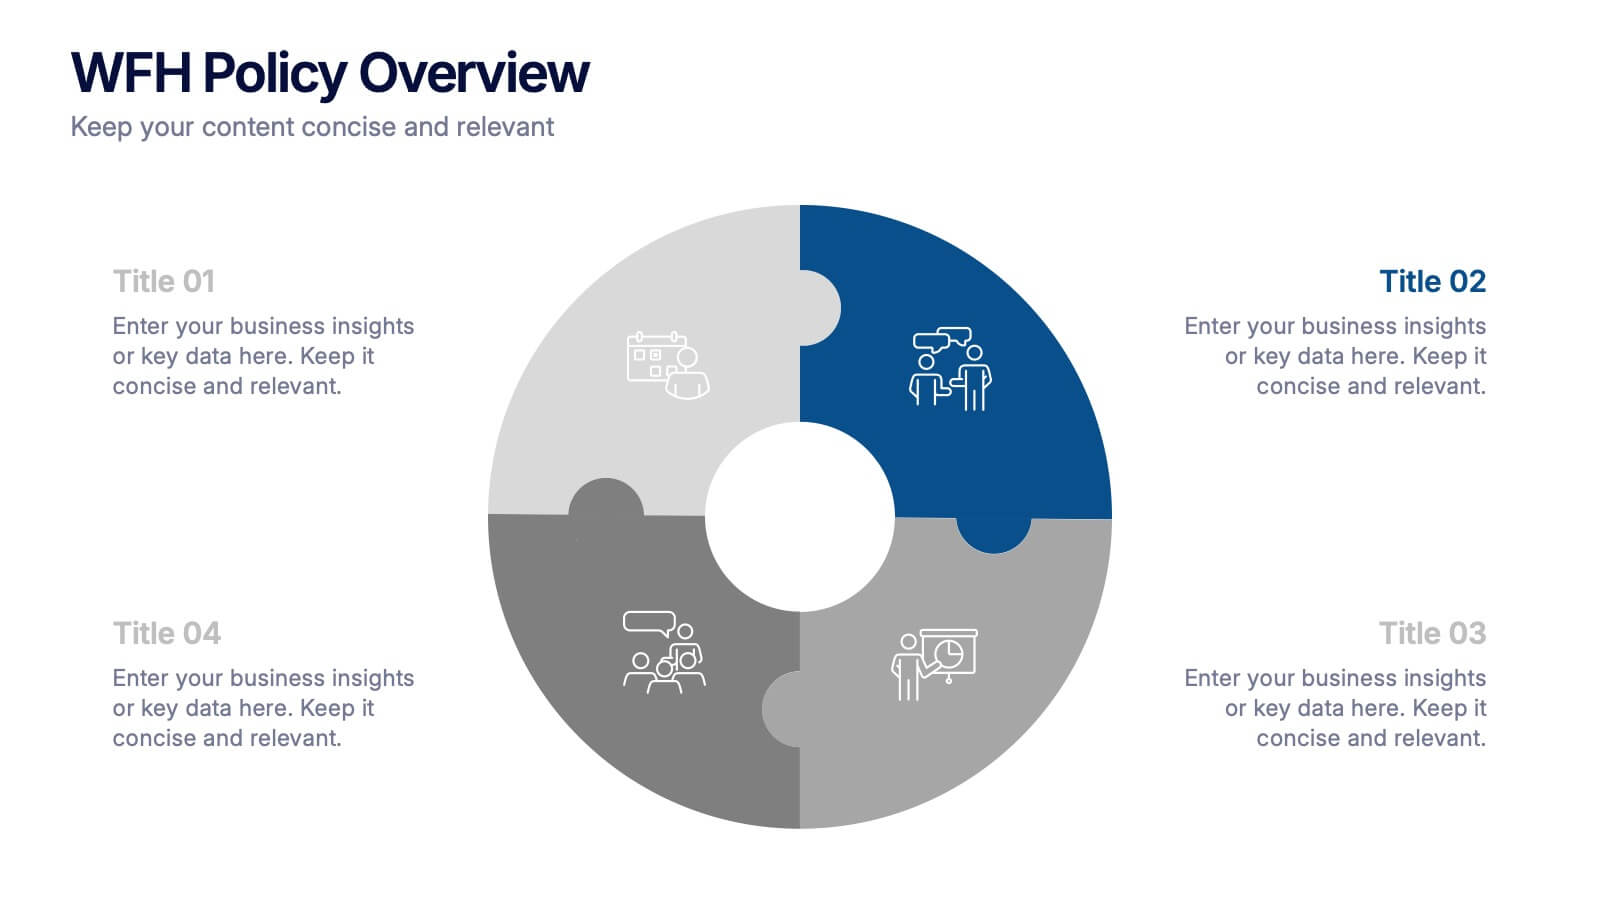
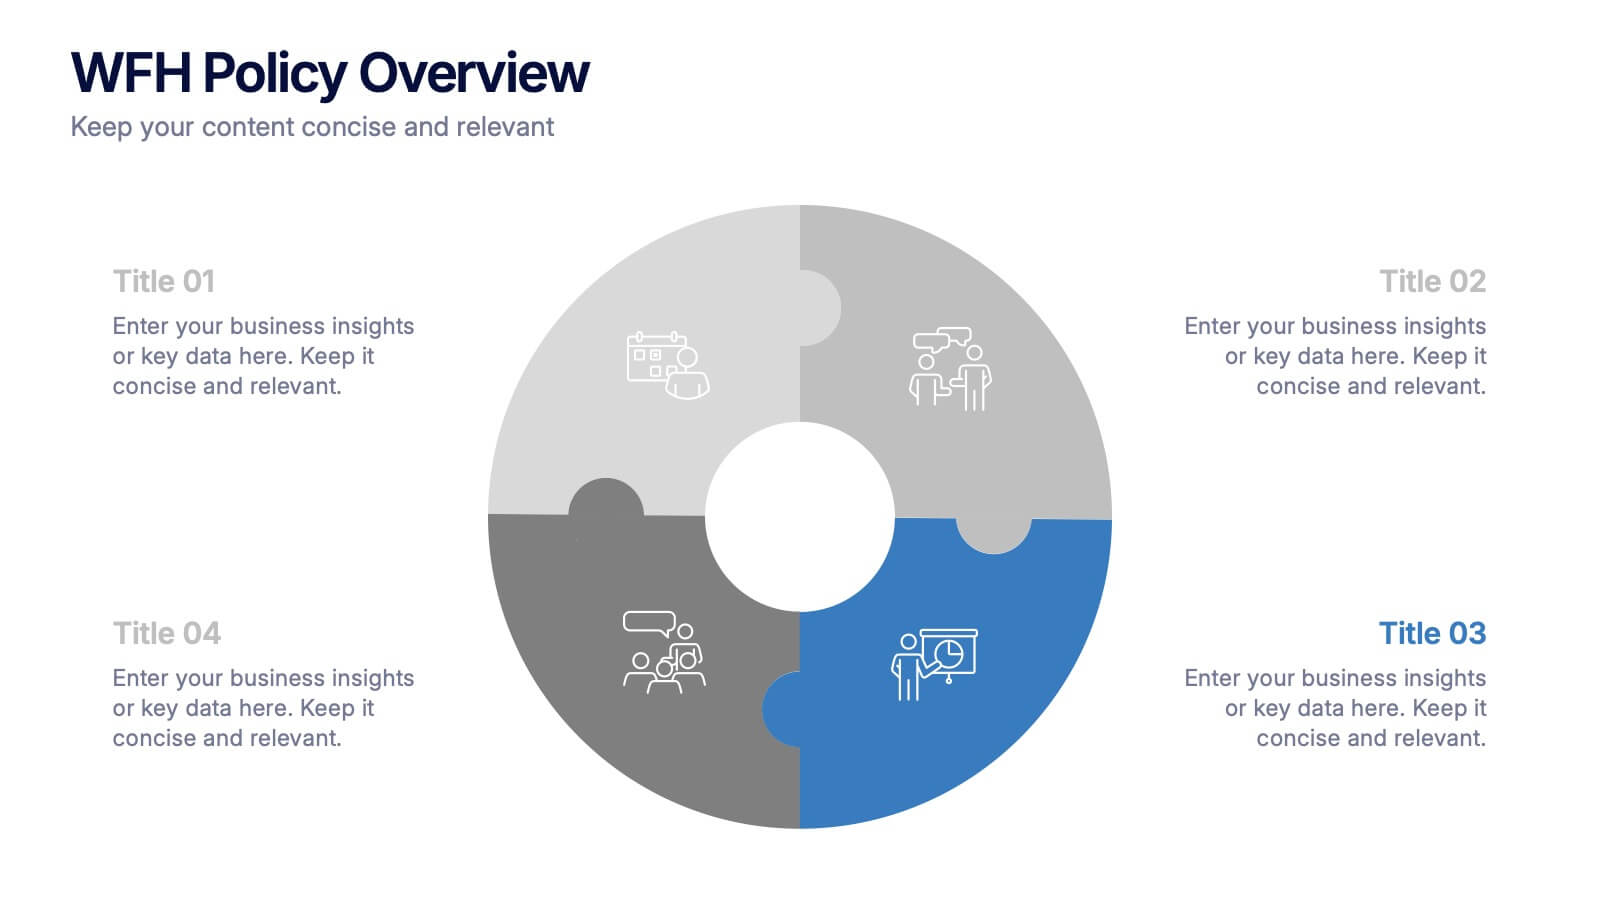
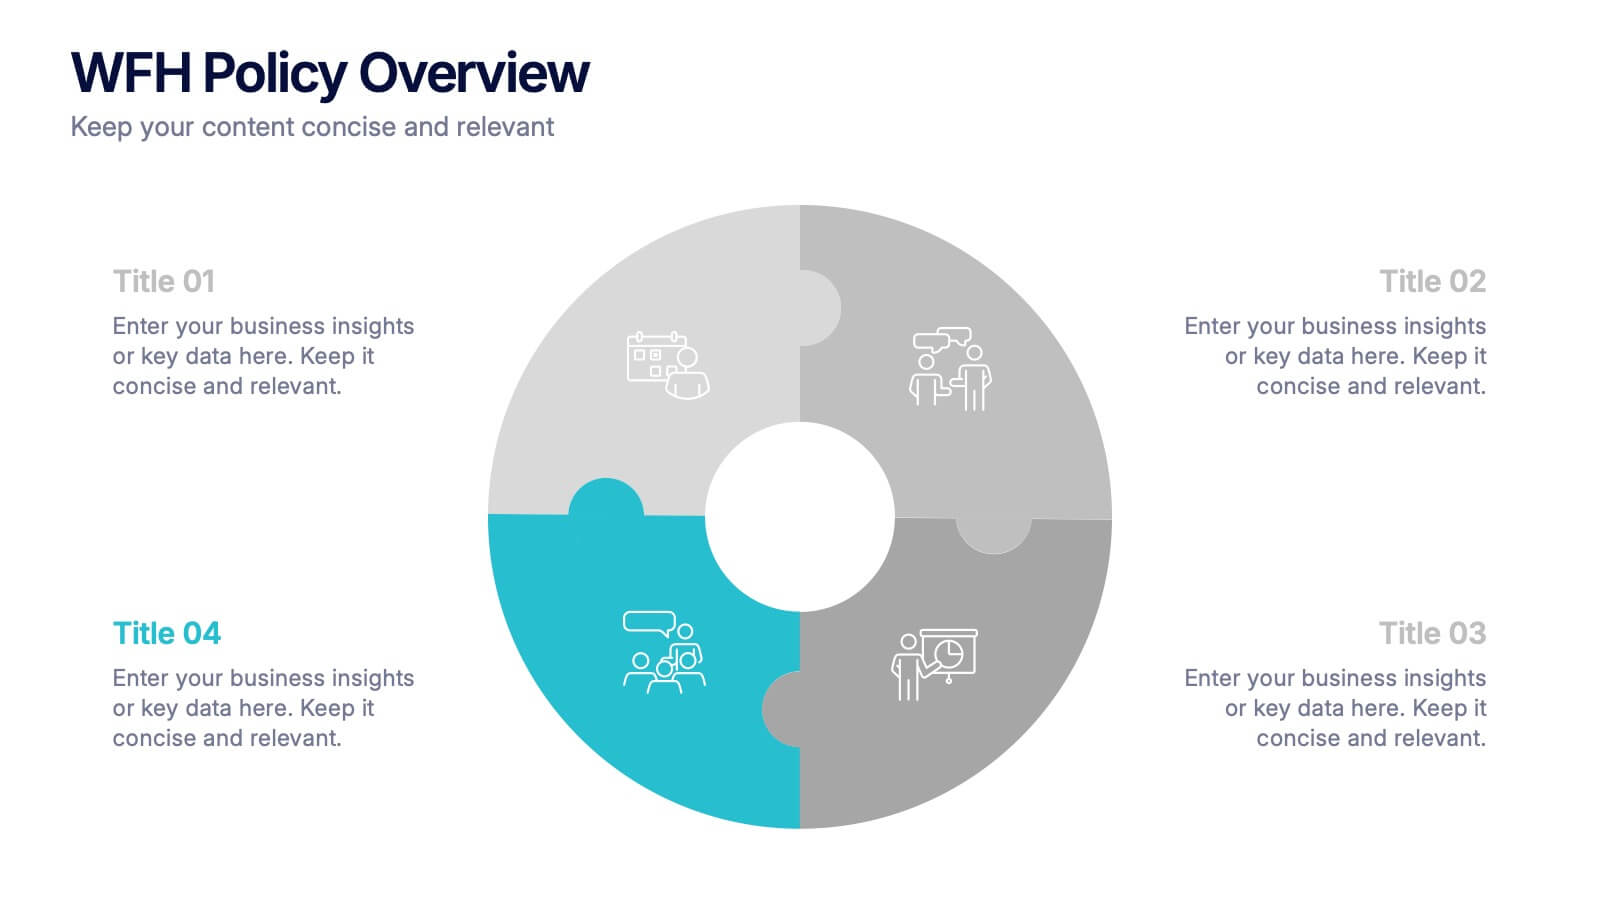
Bring clarity and confidence to your remote-work guidelines with a clean, puzzle-style layout that makes every policy easy to follow. This presentation explains key expectations, communication standards, and workflow essentials designed to support productive work-from-home environments. Fully customizable and compatible with PowerPoint, Keynote, and Google Slides.
- Eliminar de favoritos
Plantilla de PowerPoint
1 MB
Plantilla de Google Slides
Enlace externo
Plantilla de Keynote
1 MB
4 diapositivas
Modern Geometric Shapes
Present your ideas with clean, minimal, and visually striking 3D shapes. This layout uses a sequence of geometric figures—cube, cone, and sphere—to represent step-by-step flows or abstract concepts. Ideal for design, architecture, education, or tech topics. Fully editable in PowerPoint, Keynote, and Google Slides.
- Eliminar de favoritos
Plantilla de PowerPoint
8 MB
Plantilla de Google Slides
Enlace externo
Plantilla de Keynote
4 MB
4 diapositivas
Goal Breakdown and Success Metrics Presentation
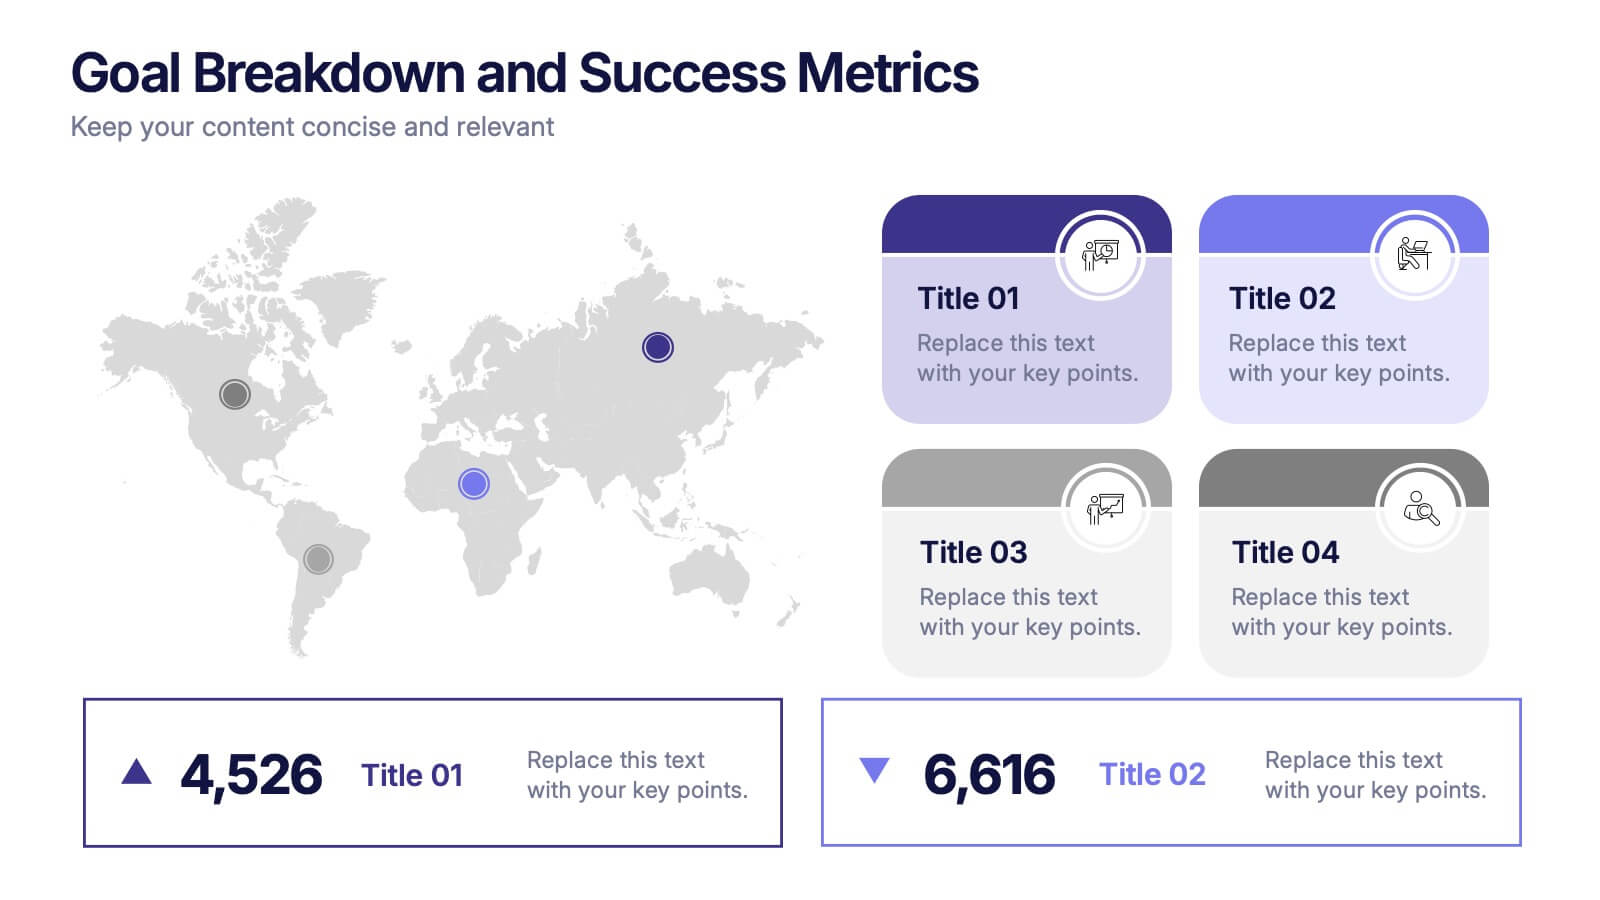
Visualize achievement metrics with the Goal Breakdown and Success Metrics Presentation. This dynamic template features global maps, KPIs, and segment analysis to track progress and highlight results. Ideal for executives, project leads, or analysts. Fully customizable in PowerPoint, Keynote, and Google Slides for polished and insightful business presentations.
- Eliminar de favoritos
Plantilla de PowerPoint
1 MB
Plantilla de Google Slides
Enlace externo
Plantilla de Keynote
1 MB
5 diapositivas
Nutrition & Health Infographics
Nutrition & Health are essential aspects of a person's well-being. Good nutrition habits provide the nutrients that the body needs to function optimally. These infographics are visual representations of information related to the relationship between diet, exercise, and overall health. They are designed to provide concise, easily digestible information that can help people make informed decisions about their diet and lifestyle choices. Nutrition and health infographics can serve as a valuable tool for individuals looking to improve their overall health and well-being through informed dietary choices.
- Eliminar de favoritos
Plantilla de PowerPoint
1 MB
Plantilla de Google Slides
Enlace externo
Plantilla de Keynote
2 MB
12 diapositivas
5 Step Process Diagram Presentation
Step up your presentation game with our sleek "5 Step Process Diagram Presentation" template! Ideal for depicting interconnected processes or workflows, this infographic uses a central hexagonal design to connect five key steps, ensuring clarity and ease of understanding. Whether for academic, business, or personal projects, this template’s intuitive layout and customizable color schemes make it a versatile choice for any presentation. Compatible with PowerPoint, Keynote, and Google Slides, it’s designed to enhance the way you visualize complex information.
- Eliminar de favoritos
Plantilla de PowerPoint
1 MB
Plantilla de Google Slides
Enlace externo
Plantilla de Keynote
1 MB
5 diapositivas
Customer Retention and Loyalty Marketing Presentation
Showcase your loyalty strategies in a visually compelling way with this modern shopping cart-themed slide. Ideal for outlining customer retention initiatives, this template highlights five key tactics or rewards using numbered icons and clean layout sections. Great for marketers, retail teams, and business consultants. Fully editable in PowerPoint, Keynote, and Google Slides.
- Eliminar de favoritos
Plantilla de PowerPoint
1 MB
Plantilla de Google Slides
Enlace externo
Plantilla de Keynote
1 MB
6 diapositivas
Conversion Funnel Stages Overview Presentation
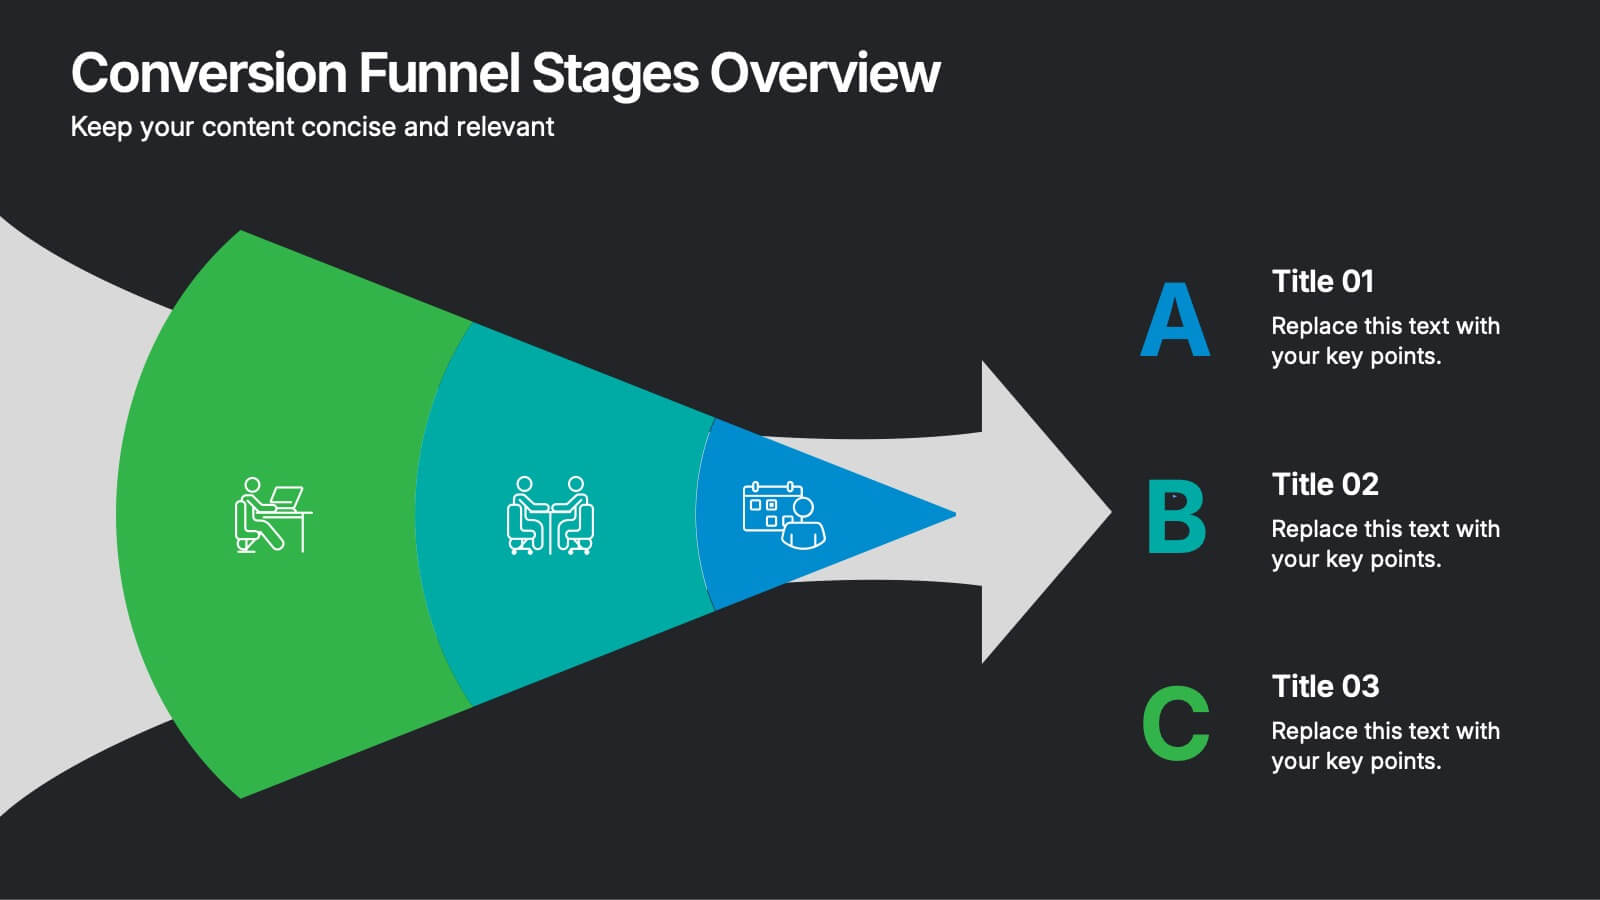
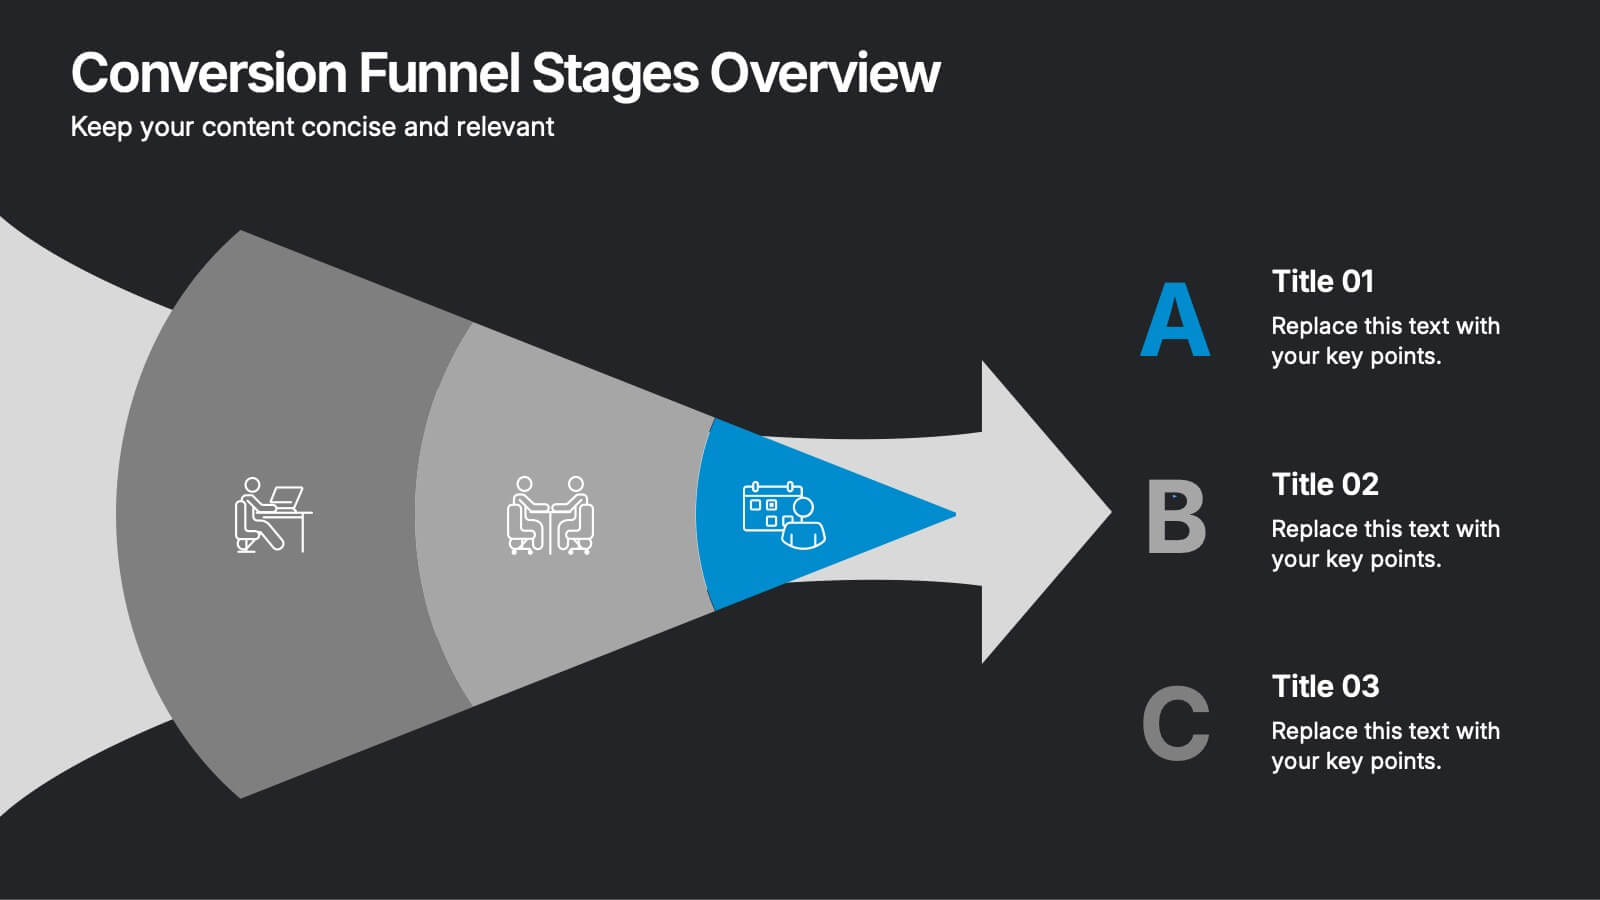
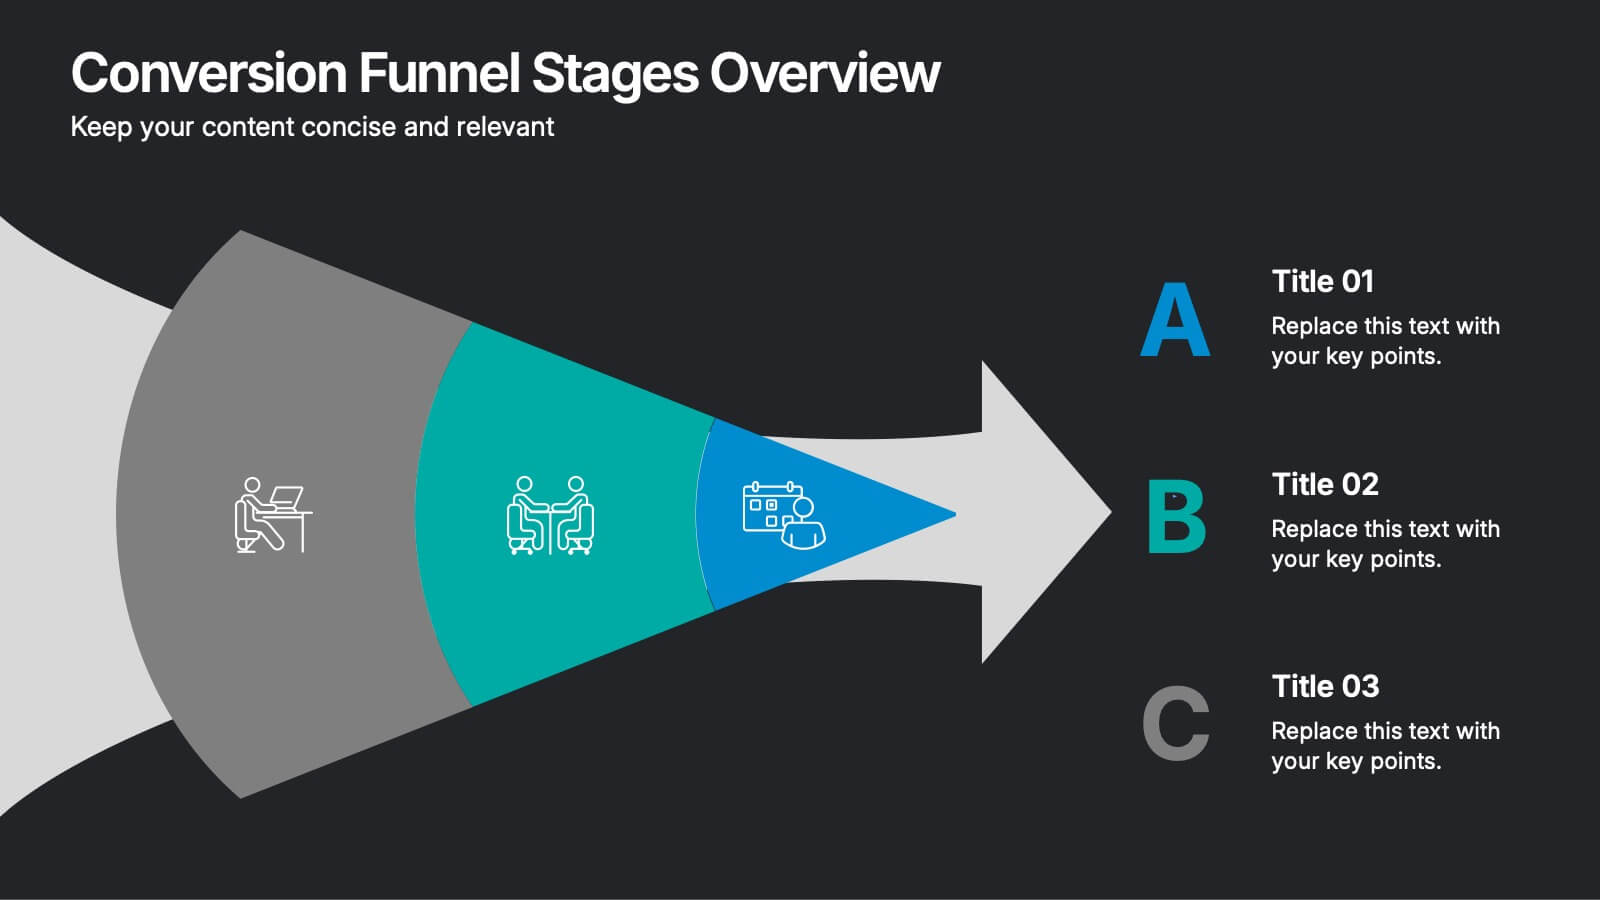
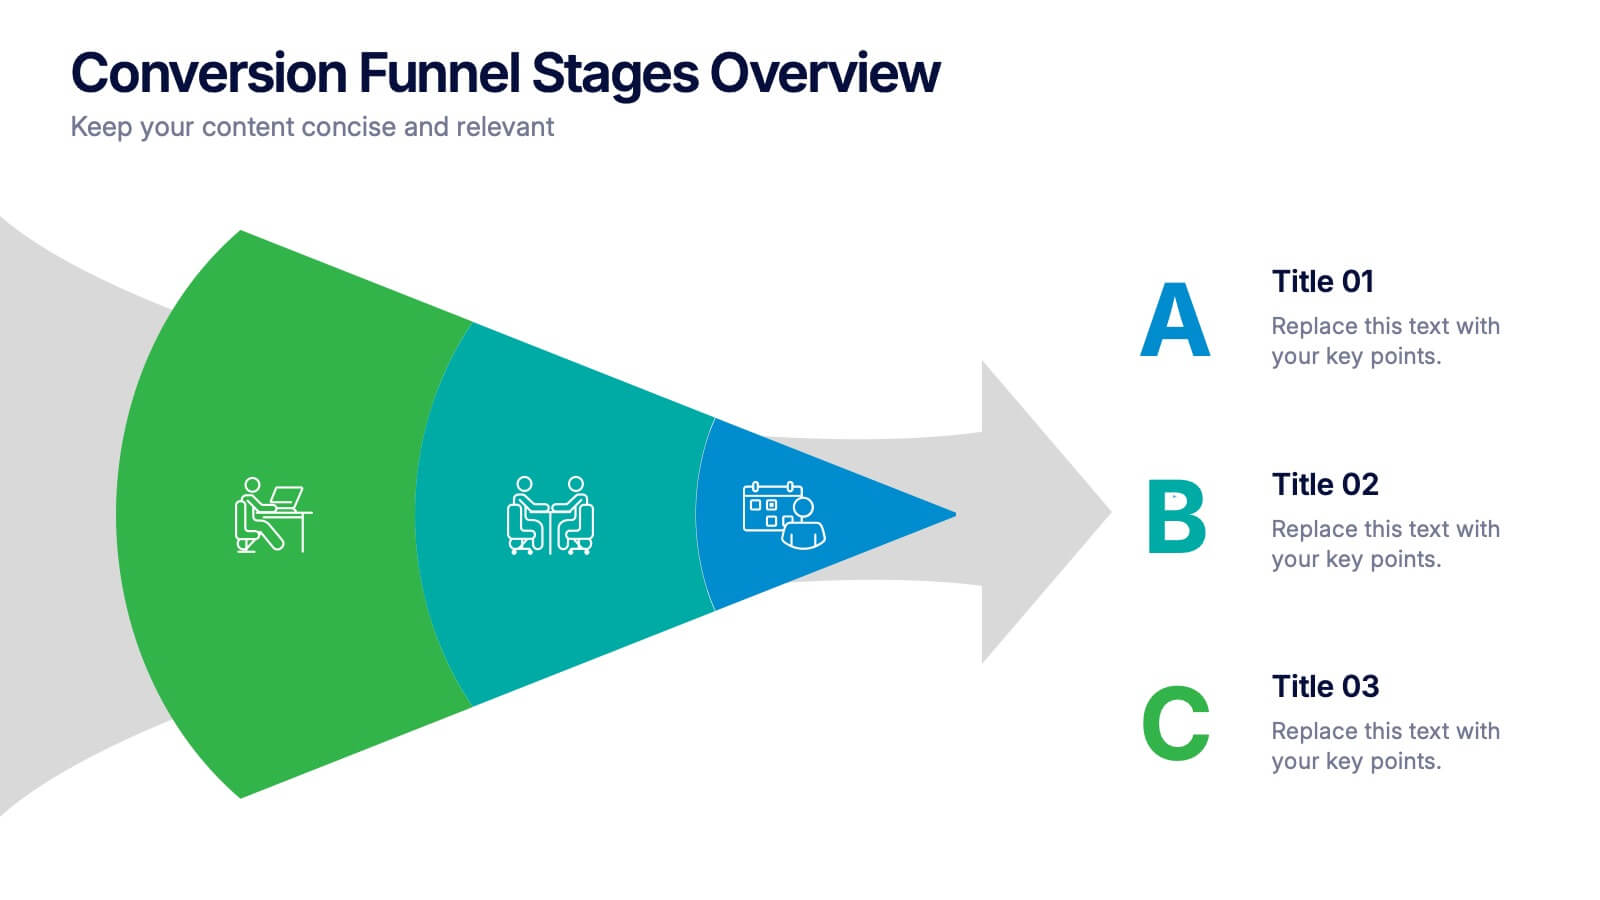
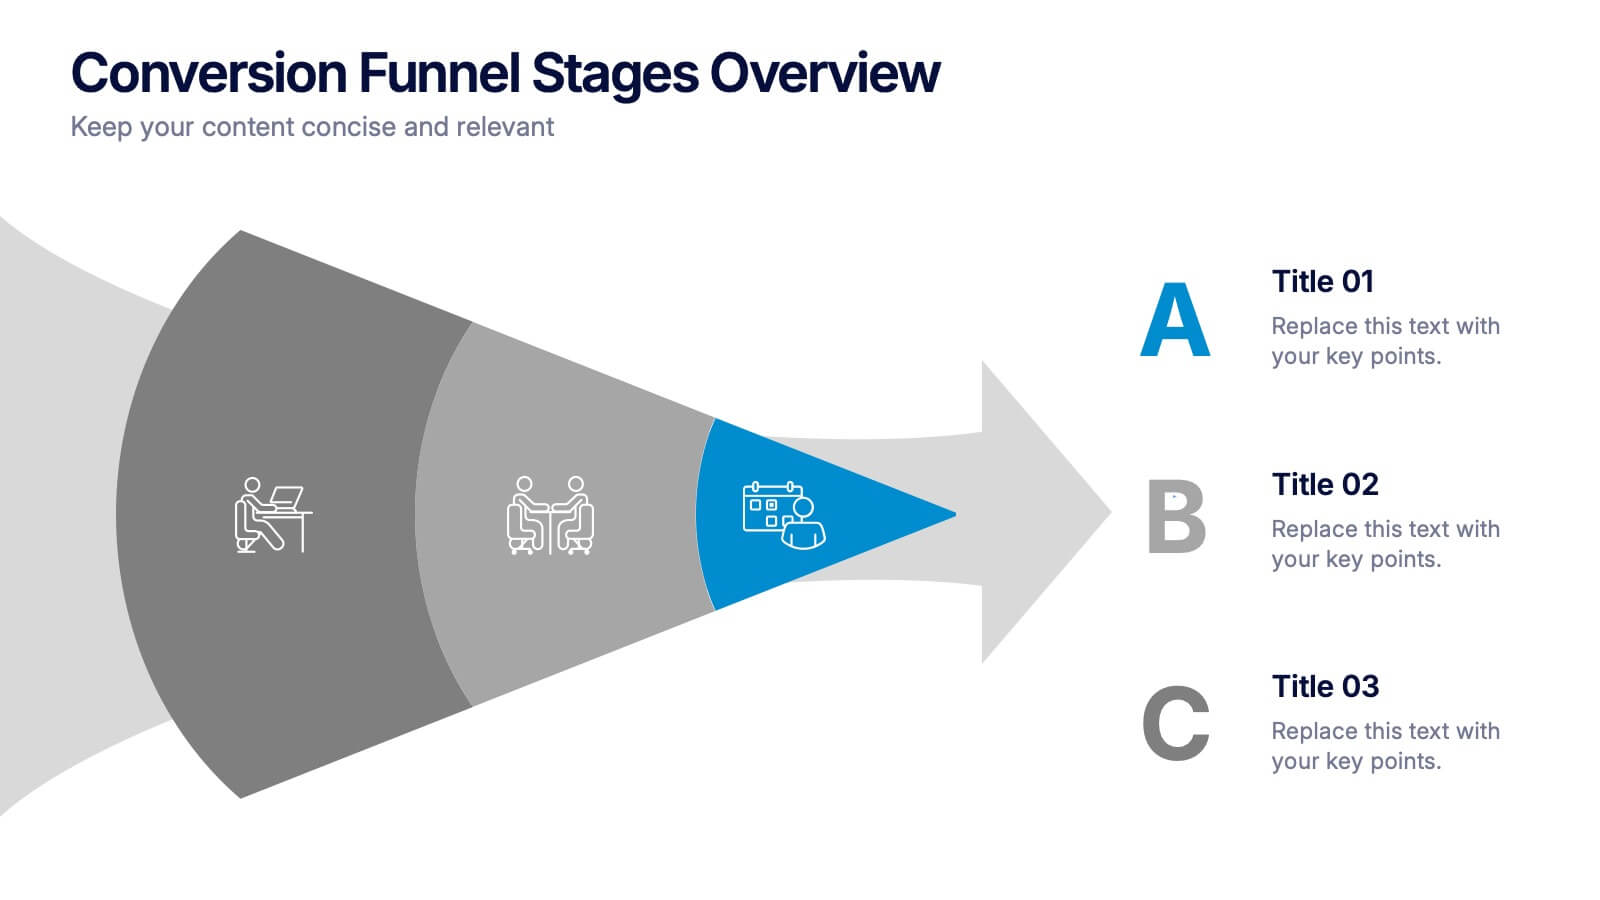
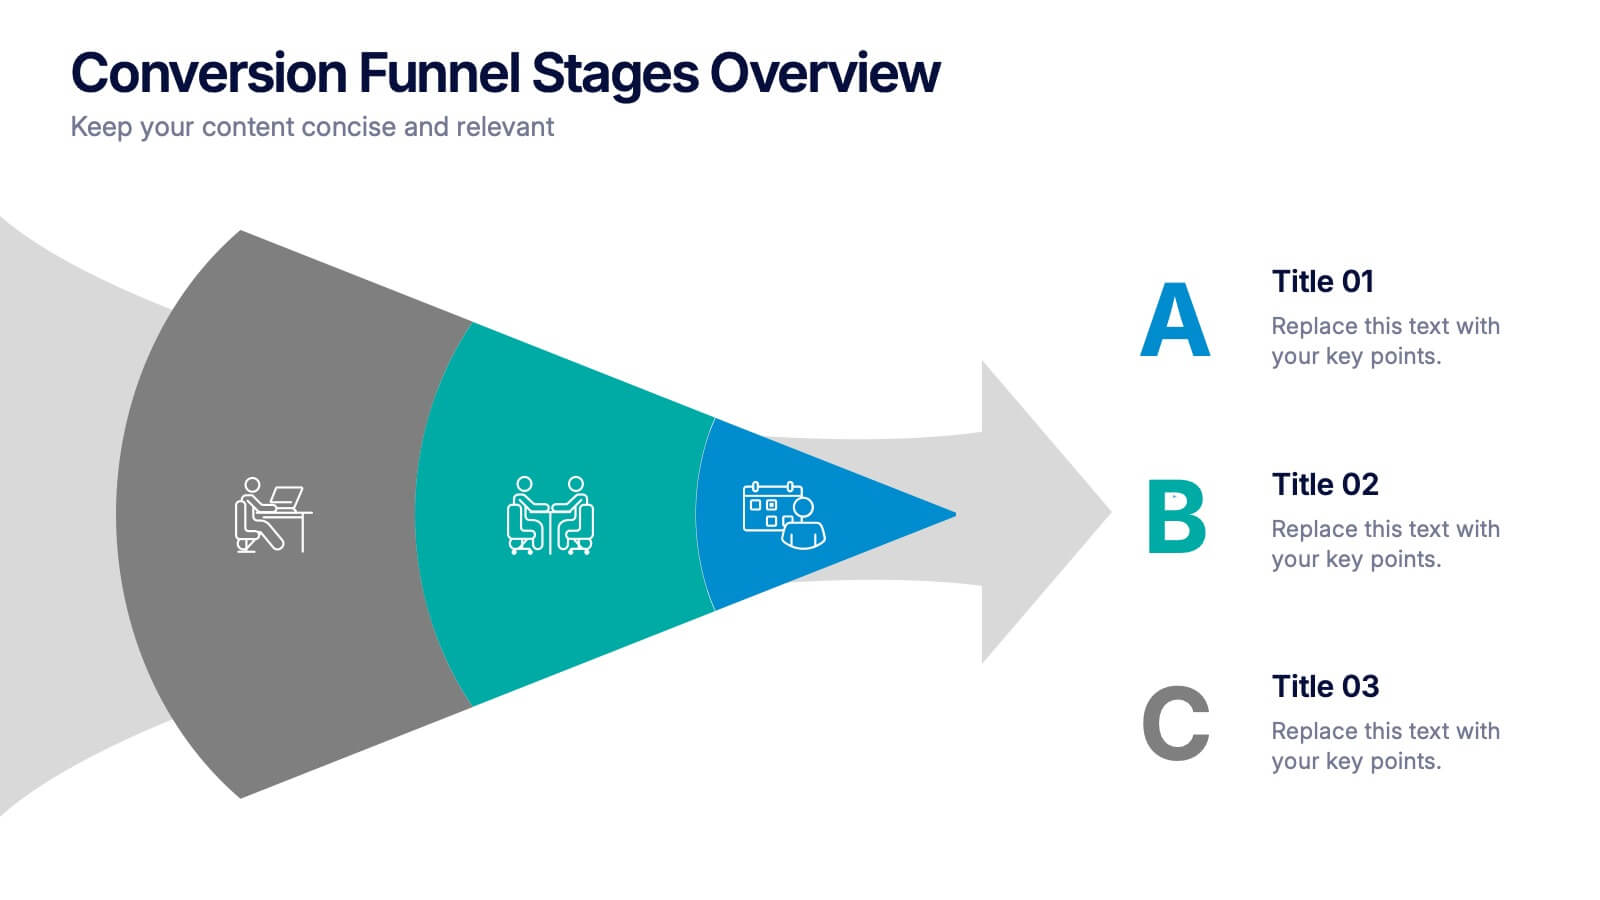
Visualize user journeys with clarity using the Conversion Funnel Stages Overview Presentation. This funnel diagram template breaks down key conversion phases—from awareness to decision—into distinct, color-coded stages. Ideal for marketing reports, sales strategies, or product demos. Fully editable in PowerPoint, Google Slides, and Canva.
- Eliminar de favoritos
Plantilla de PowerPoint
1 MB
Plantilla de Google Slides
Enlace externo
Plantilla de Keynote
1 MB
4 diapositivas
Financial Report Presentation
Enhance your financial presentations with our "Financial Report Presentation" template. Designed for clarity and visual impact, this infographic features a stylized financial bag icon segmented into color-coded sections, each representing a different financial metric such as revenue, expenses, profits, and investments. This creative visual structure allows for a clear and segmented display of your company's financial health, making complex data easily understandable. Ideal for financial analysts, corporate presentations, and investor meetings, this template ensures key financial insights are communicated effectively and efficiently. Compatible with PowerPoint, Keynote, and Google Slides, it's an essential tool for delivering detailed and precise financial reports.
- Eliminar de favoritos
Plantilla de PowerPoint
1 MB
Plantilla de Google Slides
Enlace externo
Plantilla de Keynote
1 MB
3 diapositivas
Logistics and Inventory Flow Strategy Presentation
Visualize your operational flow with the Logistics and Inventory Flow Strategy Presentation. Designed with 3D-style isometric elements, this slide helps illustrate key stages of shipping, warehousing, and delivery. Easily customize icons, colors, and titles to reflect your supply chain or inventory management strategy. Compatible with PowerPoint, Keynote, and Google Slides.
- Eliminar de favoritos
Plantilla de PowerPoint
1 MB
Plantilla de Google Slides
Enlace externo
Plantilla de Keynote
1 MB
5 diapositivas
Oil Industry Revenue Infographics
The oil industry, also known as the petroleum industry, is a global sector that involves the exploration, production, refining, transportation, and marketing of petroleum products. These vertical infographics present key statistics and insights about the revenue generated by the oil industry. This infographic provides an overview of the financial aspects of the oil industry, including revenue sources, market trends, and economic impact. The template showcases the revenue trends of the oil industry over a specific period. It utilizes line graphs, bar charts, or other visual elements to illustrate the growth or fluctuations in revenue over time.
- Eliminar de favoritos
Plantilla de PowerPoint
1 MB
Plantilla de Google Slides
Enlace externo
Plantilla de Keynote
1 MB
7 diapositivas
Dashboard Infographic Presentation Template
A Dashboard Infographic is a visual representation of important data or information that is organized in a way that is easy to understand. This template is perfect for getting your important information across in a way that's easy to comprehend. This template is designed to present your data in a concise and clear way and it can be used to track and monitor different metrics. This dashboard template has the ability to tell a story with a set of graphs and charts that can be customized in several different ways. You can use the graphs and charts and customize them according to your needs.
- Eliminar de favoritos
Plantilla de PowerPoint
Enlace externo
Plantilla de Google Slides
Enlace externo
Plantilla de Keynote
Enlace externo
7 diapositivas
Tables of Content Samples Infographic Presentation
A Table of Content is an essential tool that improves the accessibility and organization of a document or book, and enhances its overall professionalism. This table of contents template is an excellent way to organize your information. This template is fully editable, which allows you to easily change colors and fonts, and add or delete components from the design. The slides are designed to be easily updated with new information, allowing you to keep the presentation fresh and up-to-date. Each template has a high quality design that is compatible with powerpoint, Keynote and Google Slides.
- Eliminar de favoritos
Plantilla de PowerPoint
1 MB
Plantilla de Google Slides
Enlace externo
Plantilla de Keynote
2 MB
7 diapositivas
Business Process Checklist
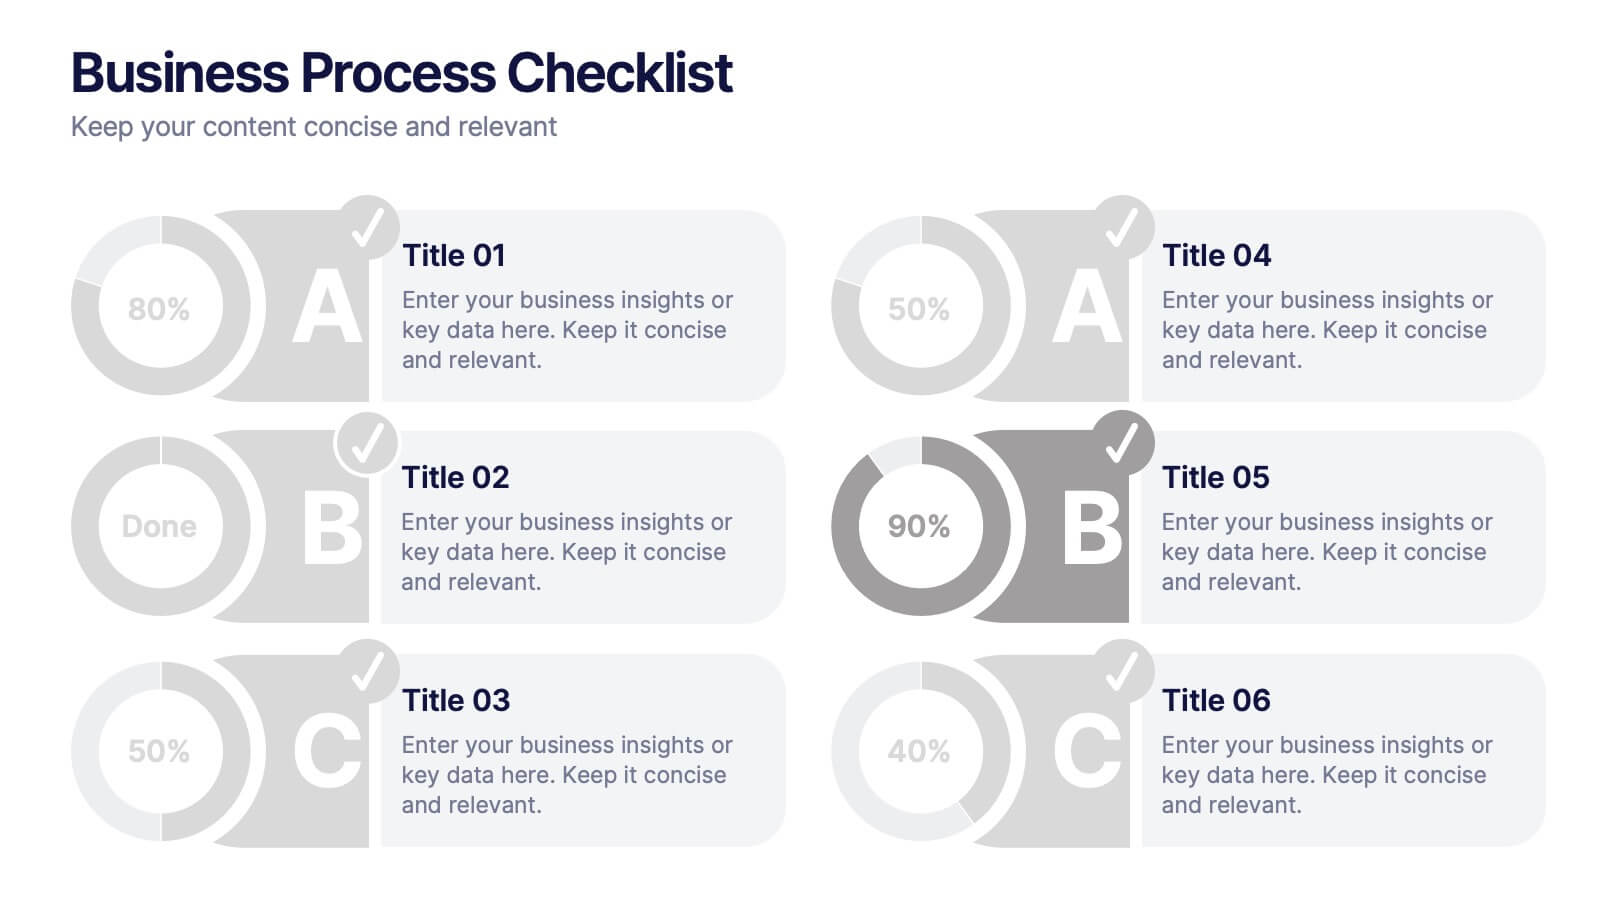
Simplify workflow tracking with this visual business process checklist slide. Featuring circular progress bars and bold letter labels (A–C), this template helps visualize task completion percentages for up to six steps. Perfect for audits, quality checks, or operational reviews. Fully customizable in PowerPoint, Keynote, and Google Slides.


