


Características


¿Tienes alguna pregunta?
Recomendar


5 diapositivas
Meeting Topics and Flow Agenda
Structure your meetings with ease using the Meeting Topics and Flow Agenda Presentation. This modern layout features a circular hub surrounded by five hexagons, each with icons and labeled steps from A to E. Ideal for visualizing agendas, discussion points, or workflow stages. Fully editable in PowerPoint, Keynote, and Google Slides.


10 diapositivas
Sustainability Management Metrics Framework
Showcase your environmental KPIs with the Sustainability Management Metrics Framework Presentation. This tree-inspired visual design is perfect for highlighting four key metrics across sustainability, compliance, or ESG reporting. Fully editable in PowerPoint, Keynote, or Google Slides, it’s ideal for eco-conscious business reviews, annual reports, or internal strategy updates.


6 diapositivas
Bubble Diagram for Idea Development Presentation
Visualize your creative process with this Bubble Diagram for Idea Development template. Ideal for brainstorming sessions, project planning, and innovation strategies, this slide uses color-coded lightbulbs and numbered bubbles to illustrate key ideas and their relationships. Perfect for entrepreneurs, teams, and educators, it simplifies complex concepts into a clear, engaging format. Fully editable and compatible with PowerPoint, Keynote, and Google Slides for seamless customization.


8 diapositivas
Professional Business Executive Summary Presentation
Make your insights stand tall with a bold, clean layout that feels like a data-driven story in motion. This executive summary slide is perfect for breaking down complex ideas into three clear steps, using sleek vertical bars to add visual rhythm. Compatible with PowerPoint, Keynote, and Google Slides for easy editing.


6 diapositivas
Corporate Profiles Layout Presentation
Bring your business story to life with a clean, modern layout that makes every detail feel polished and professional. This presentation is designed to showcase company highlights, key services, and essential profile information with clarity and impact. Fully editable and easy to customize in PowerPoint, Keynote, and Google Slides.


19 diapositivas
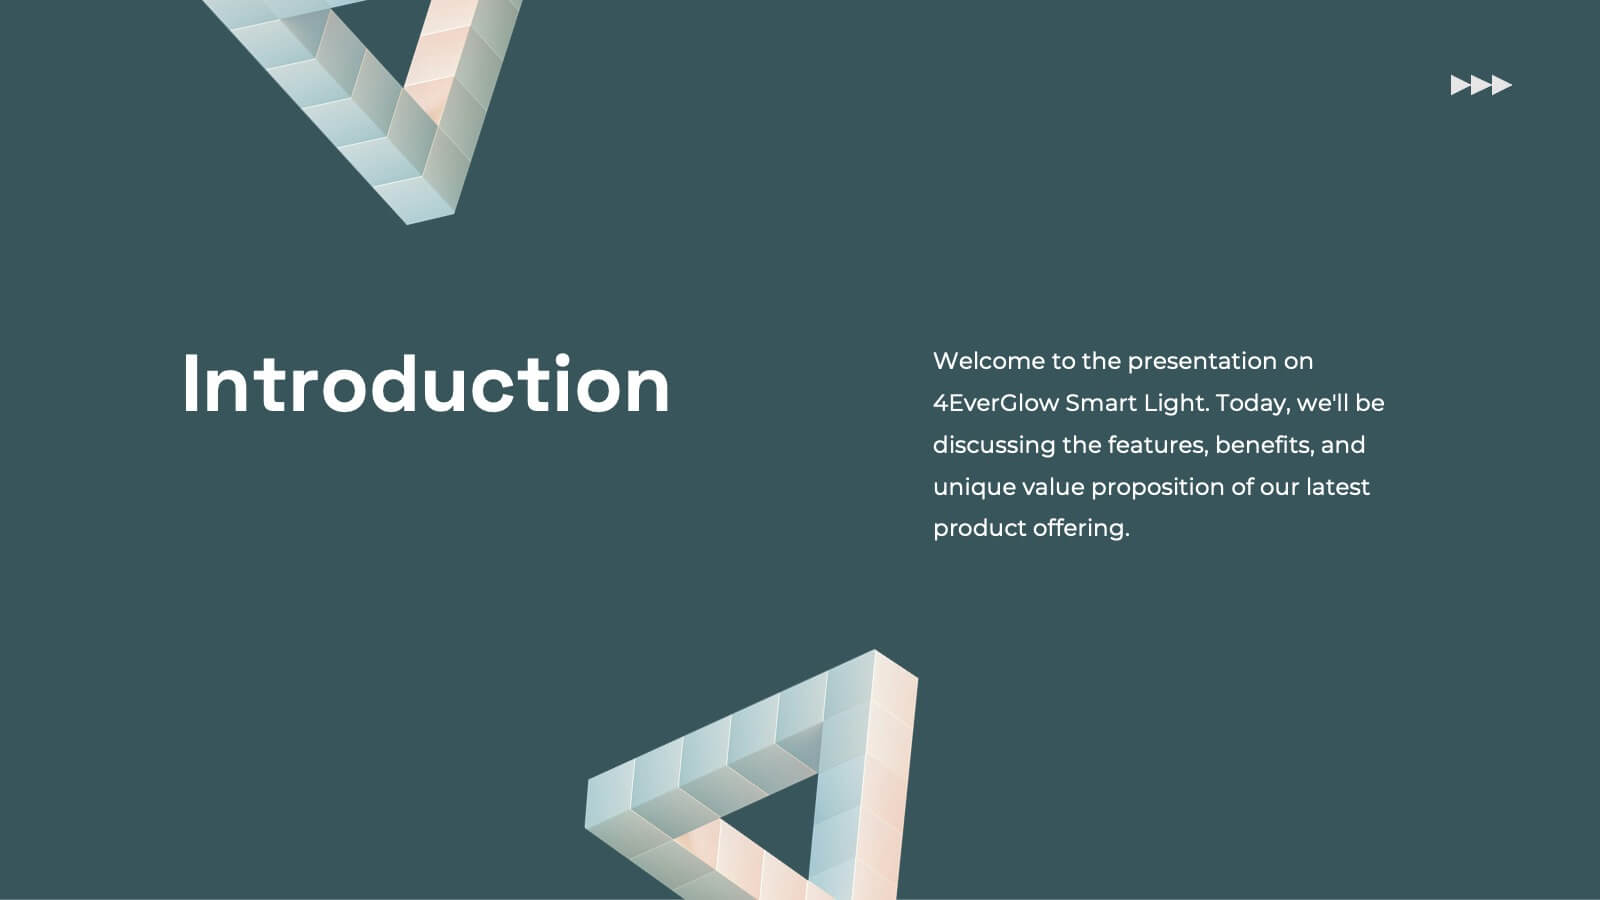
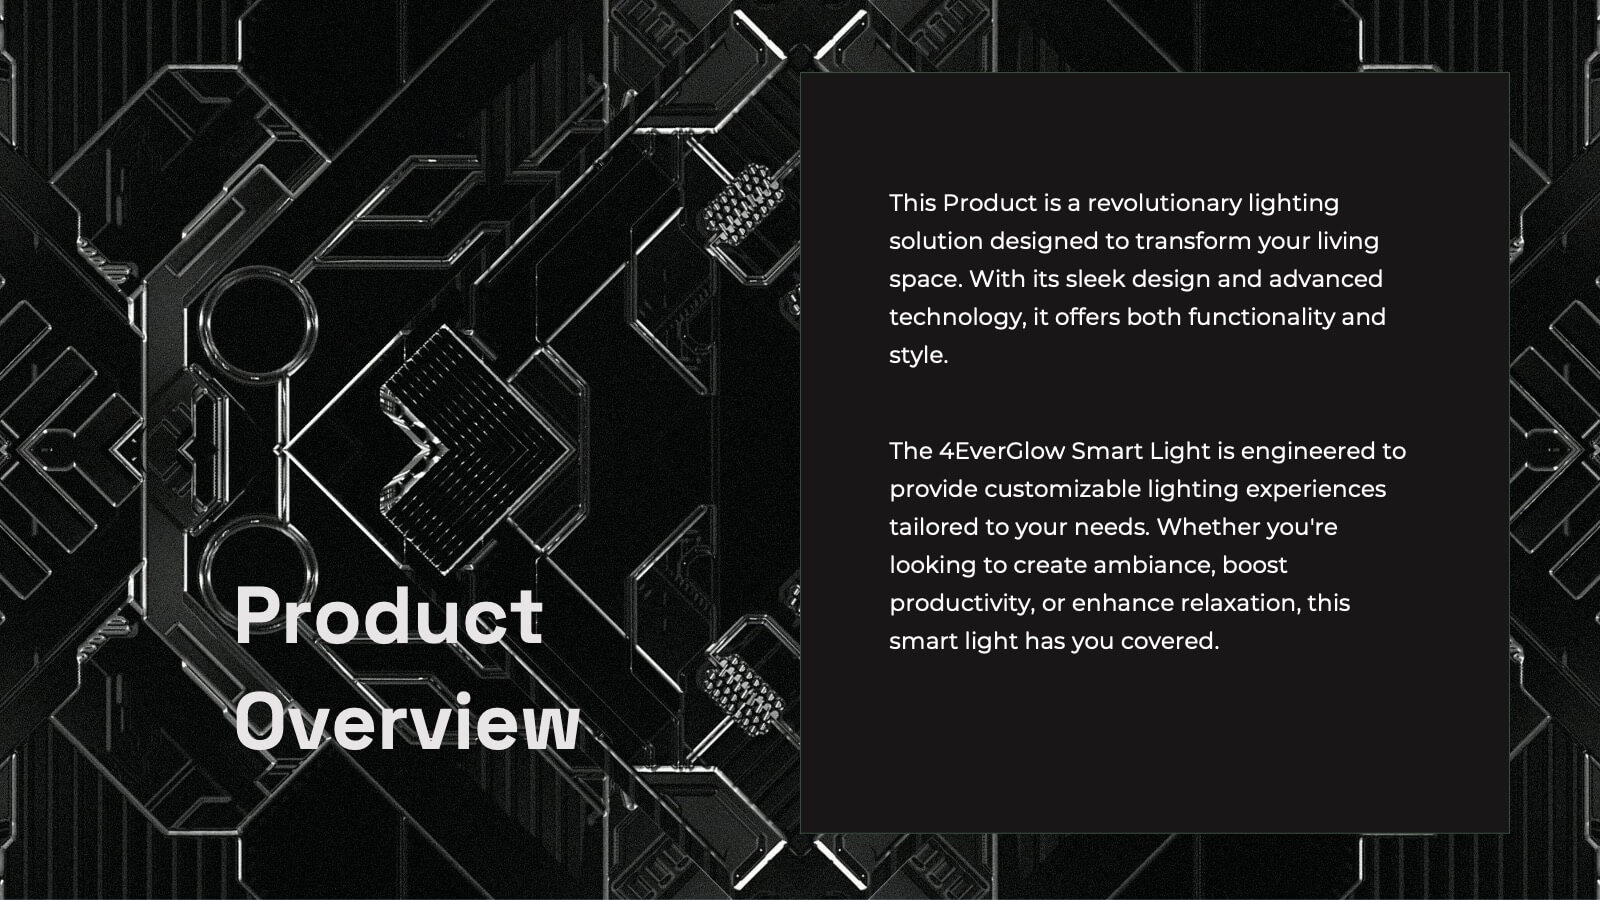
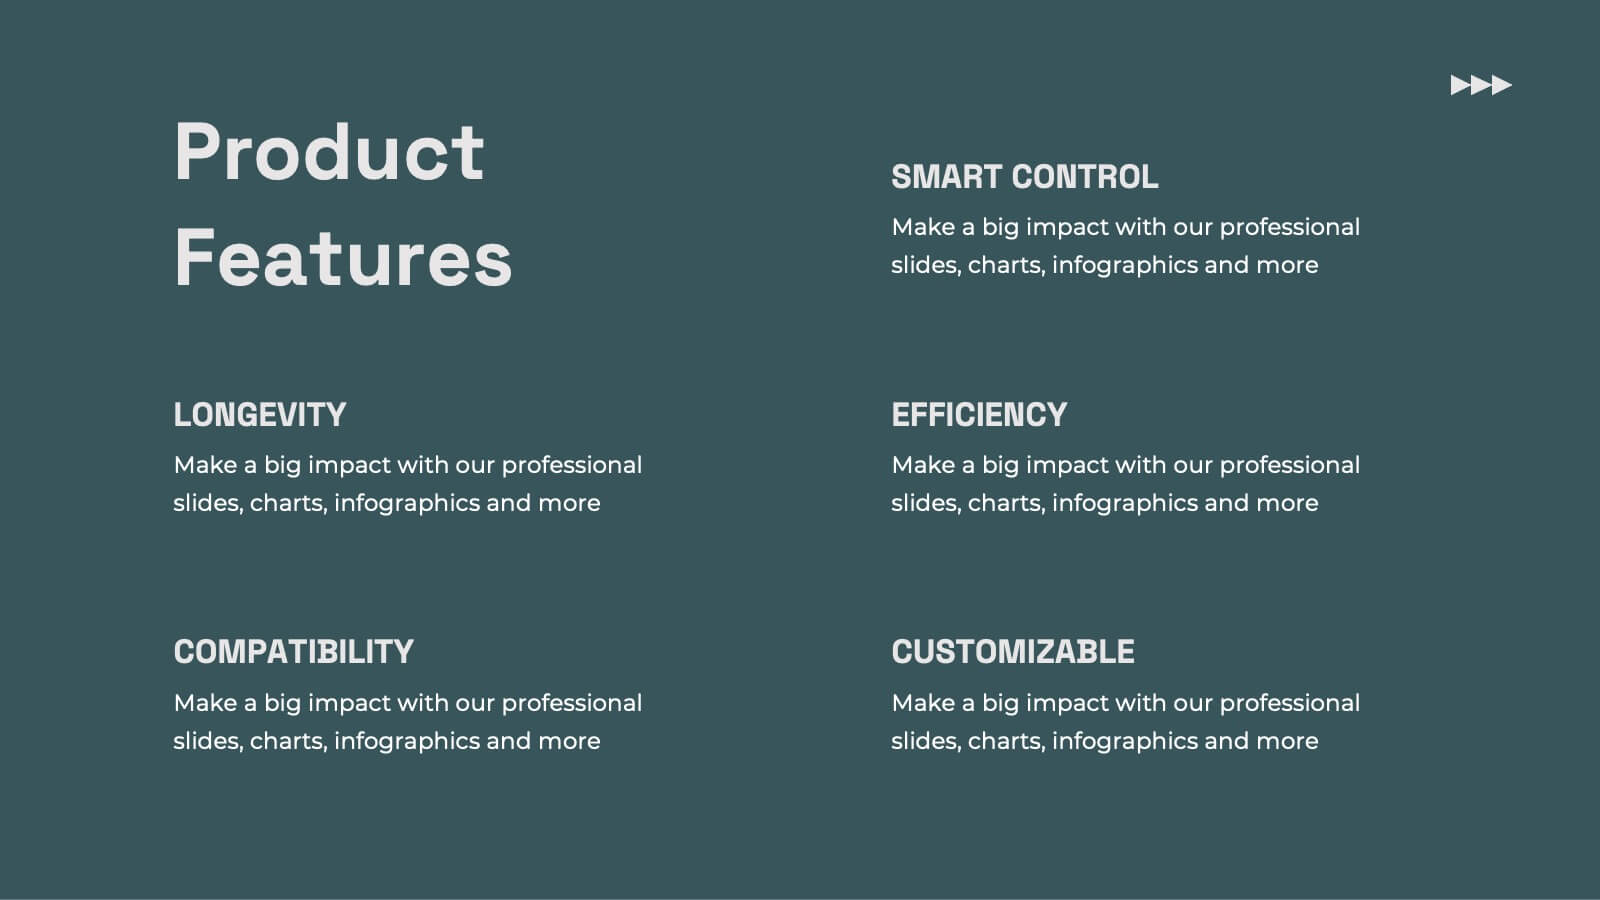
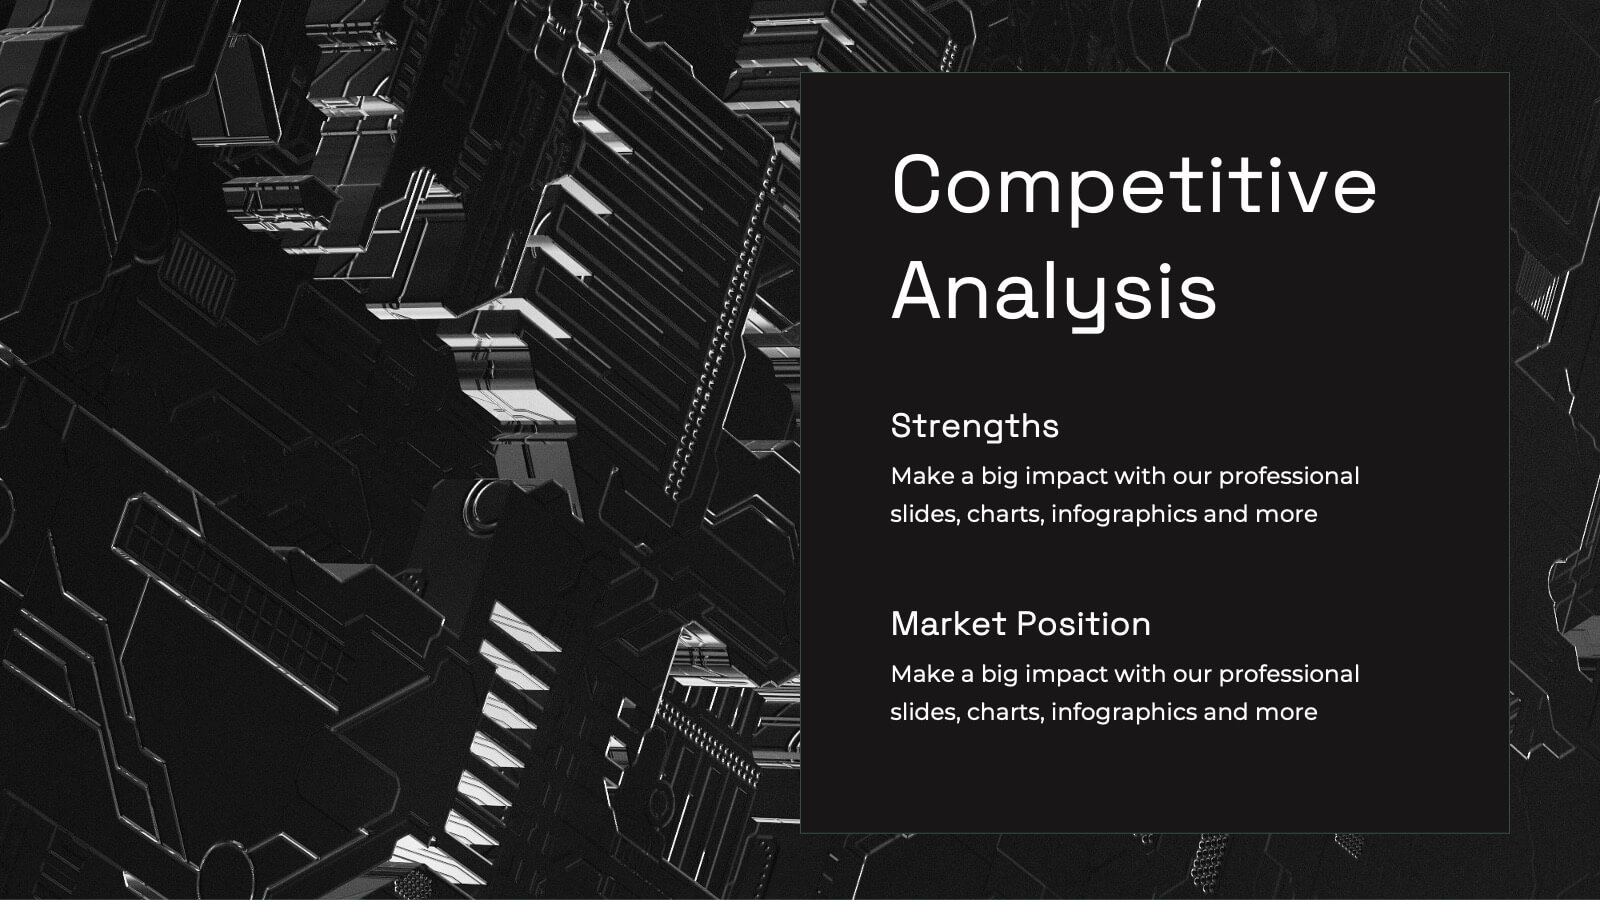
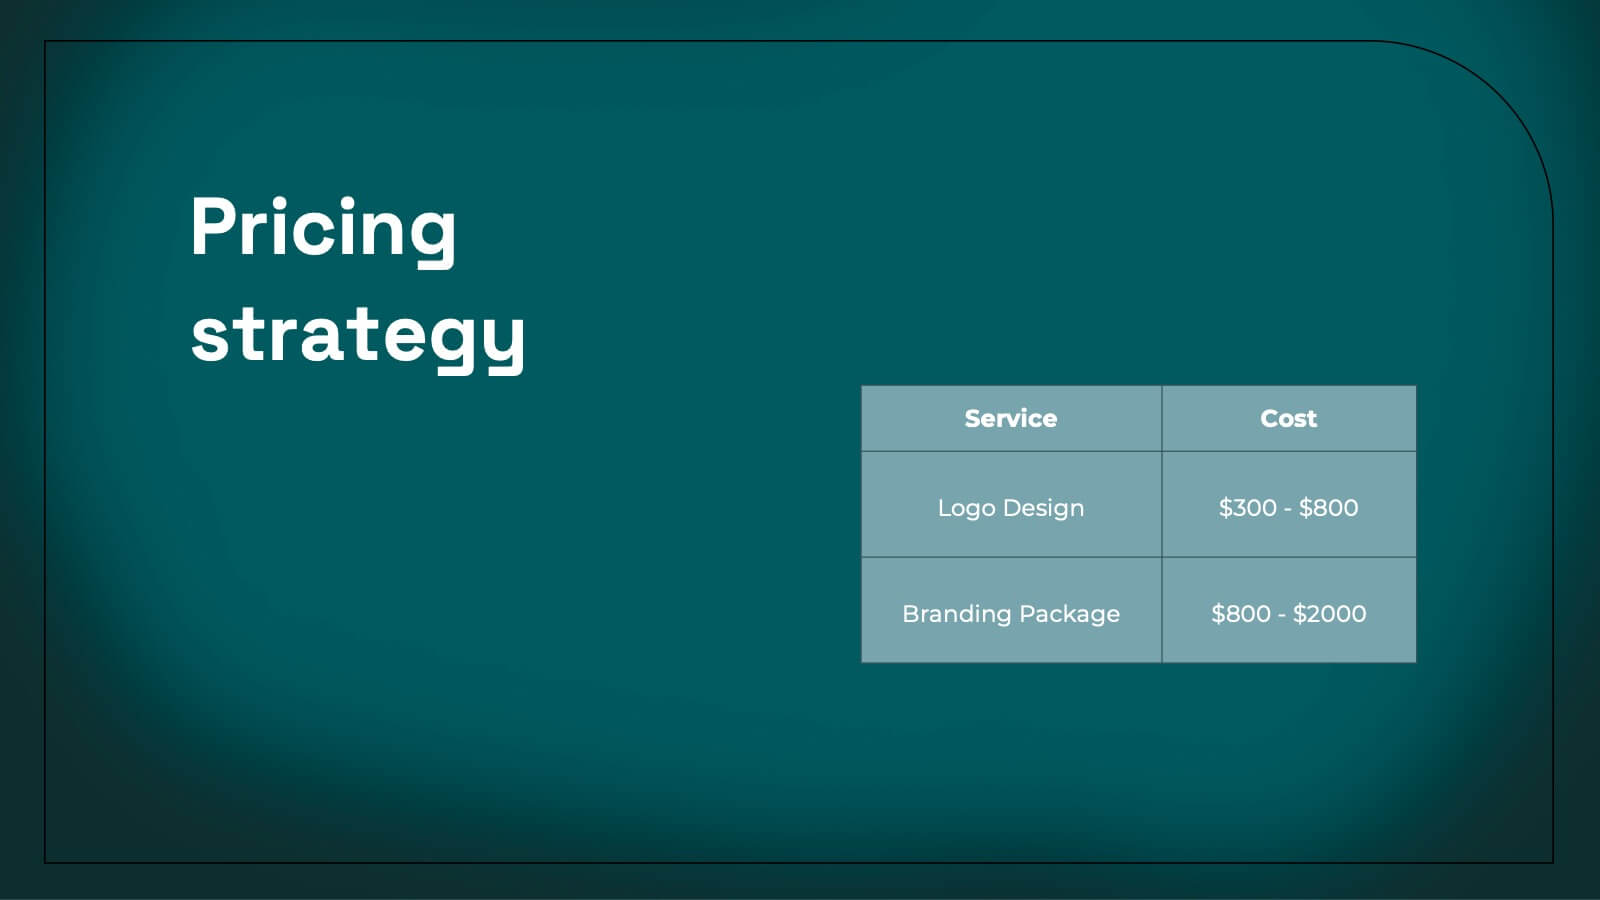
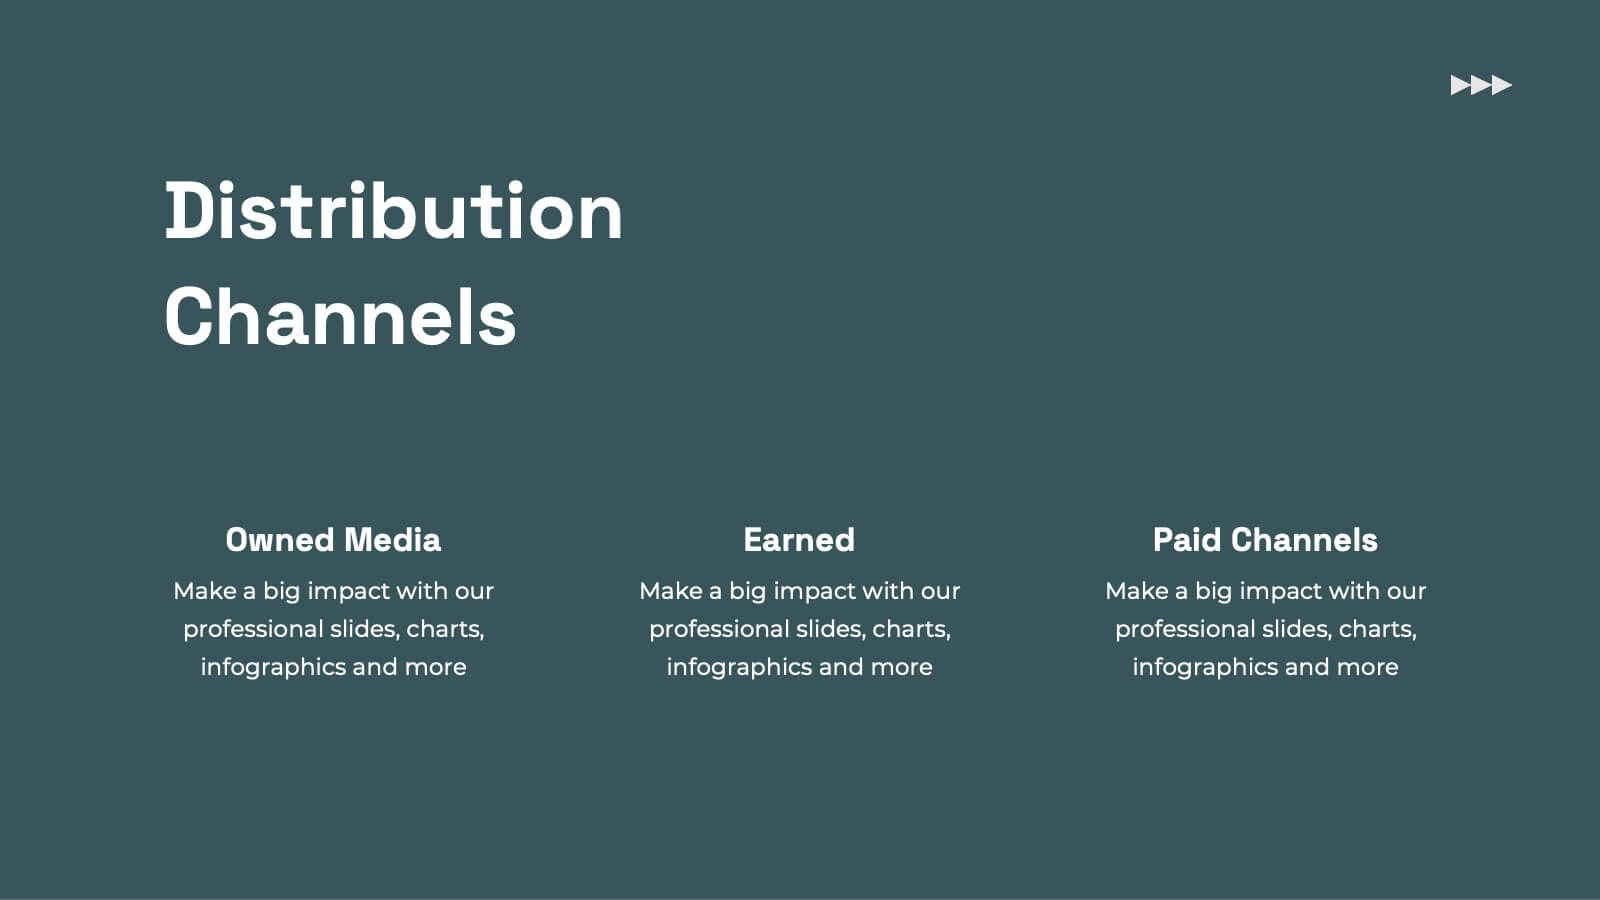
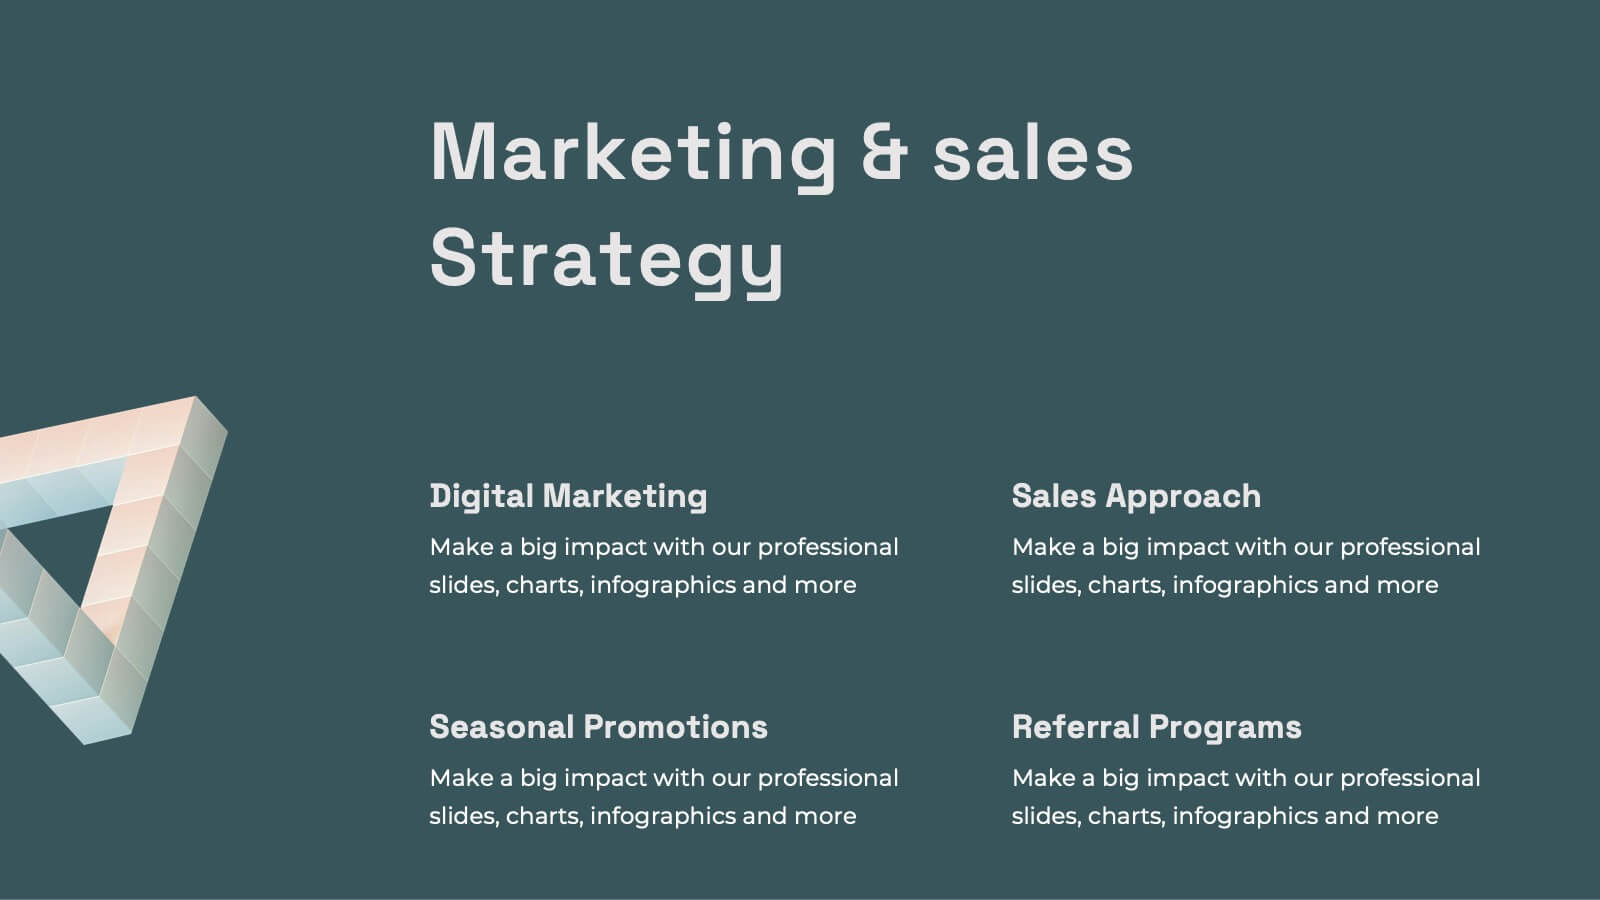
Kale Product Strategy Report Presentation
Unleash the power of your product with this bold and dynamic product strategy report template! Elevate your presentation with eye-catching designs that showcase product features, competitive analysis, and pricing strategies like never before. Captivate your audience from start to finish and leave a lasting impression. Fully compatible with PowerPoint, Keynote, and Google Slides!


4 diapositivas
Meeting Agenda Slide Presentation
Start your presentation with structure and clarity using this sleek, professional layout designed to outline key discussion points with style. Perfect for business meetings, workshops, or team updates, it keeps information clear and visually balanced. Fully compatible with PowerPoint, Keynote, and Google Slides for effortless editing and customization.


21 diapositivas
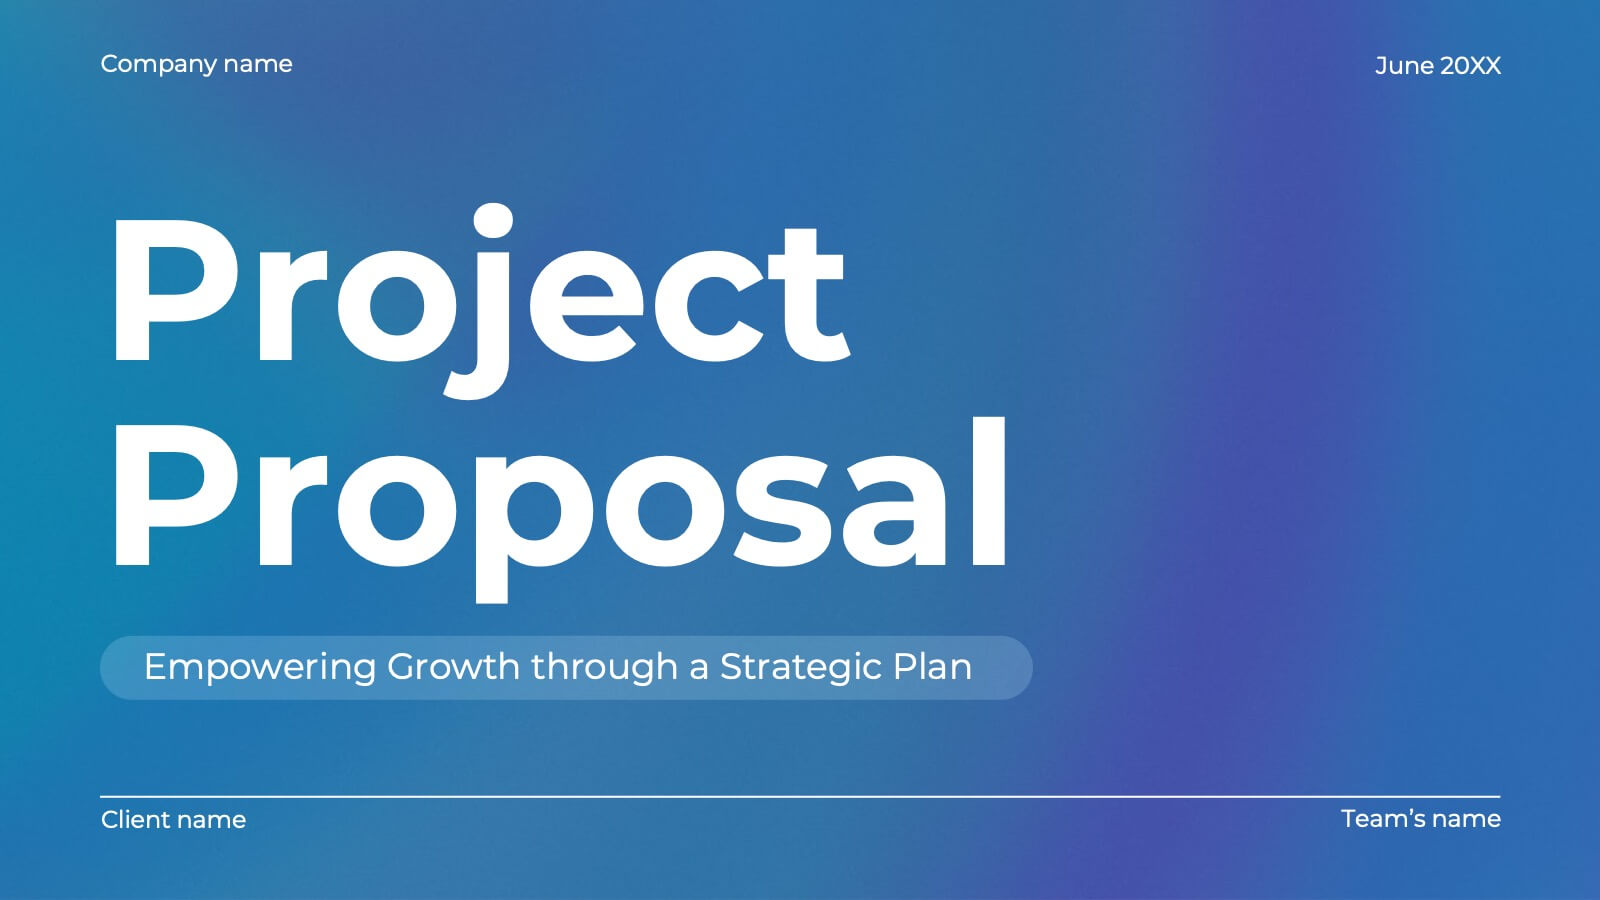
Ember Agile Project Plan Presentation
Ready to ace your next project proposal? This sleek presentation template is perfect for outlining objectives, timelines, and budgets. Designed for professionals aiming to impress stakeholders and secure approvals. Compatible with PowerPoint, Keynote, and Google Slides, it ensures a smooth and professional presentation every time. Ideal for project managers and business leaders.


6 diapositivas
Asia Map Population Infographic
Explore the demographic dynamics of Asia with our collection of infographic slides, designed to illustrate the population statistics across the continent. These templates are an essential tool for educators, demographers, and business analysts, providing detailed visualizations of population distribution, density, and growth trends. Each infographic combines the map of Asia with engaging graphical elements such as bar graphs, pie charts, and statistical callouts that emphasize key data points like total population, urban versus rural distribution, and demographic forecasts. The color-coding and spatial arrangements on the map effectively highlight variations and trends across different countries and regions, making complex data easy to understand and visually compelling. Fully customizable, these templates allow you to adjust the data presentation to suit specific needs or focuses, such as comparing population growth rates or highlighting demographic challenges. Whether used in presentations, reports, or educational materials, these slides offer a comprehensive and accessible way to communicate the demographic landscape of Asia.


8 diapositivas
Geographic Heat Map Analysis Presentation
Bring your data to life with a vibrant map that instantly reveals regional patterns and performance differences. Ideal for presenting location-based insights, sales metrics, or demographic trends, this presentation combines clarity with visual impact. Fully compatible with PowerPoint, Keynote, and Google Slides for easy editing and professional results.


2 diapositivas
Website UI Mockup Device Display Presentation
Showcase your website's interface with the Website UI Mockup Device Display slide. This professional and modern layout features a desktop screen to elegantly present your web design, user interface, or digital product. Perfect for designers, developers, and marketing presentations. Fully editable and compatible with PowerPoint, Keynote, and Google Slides.


21 diapositivas
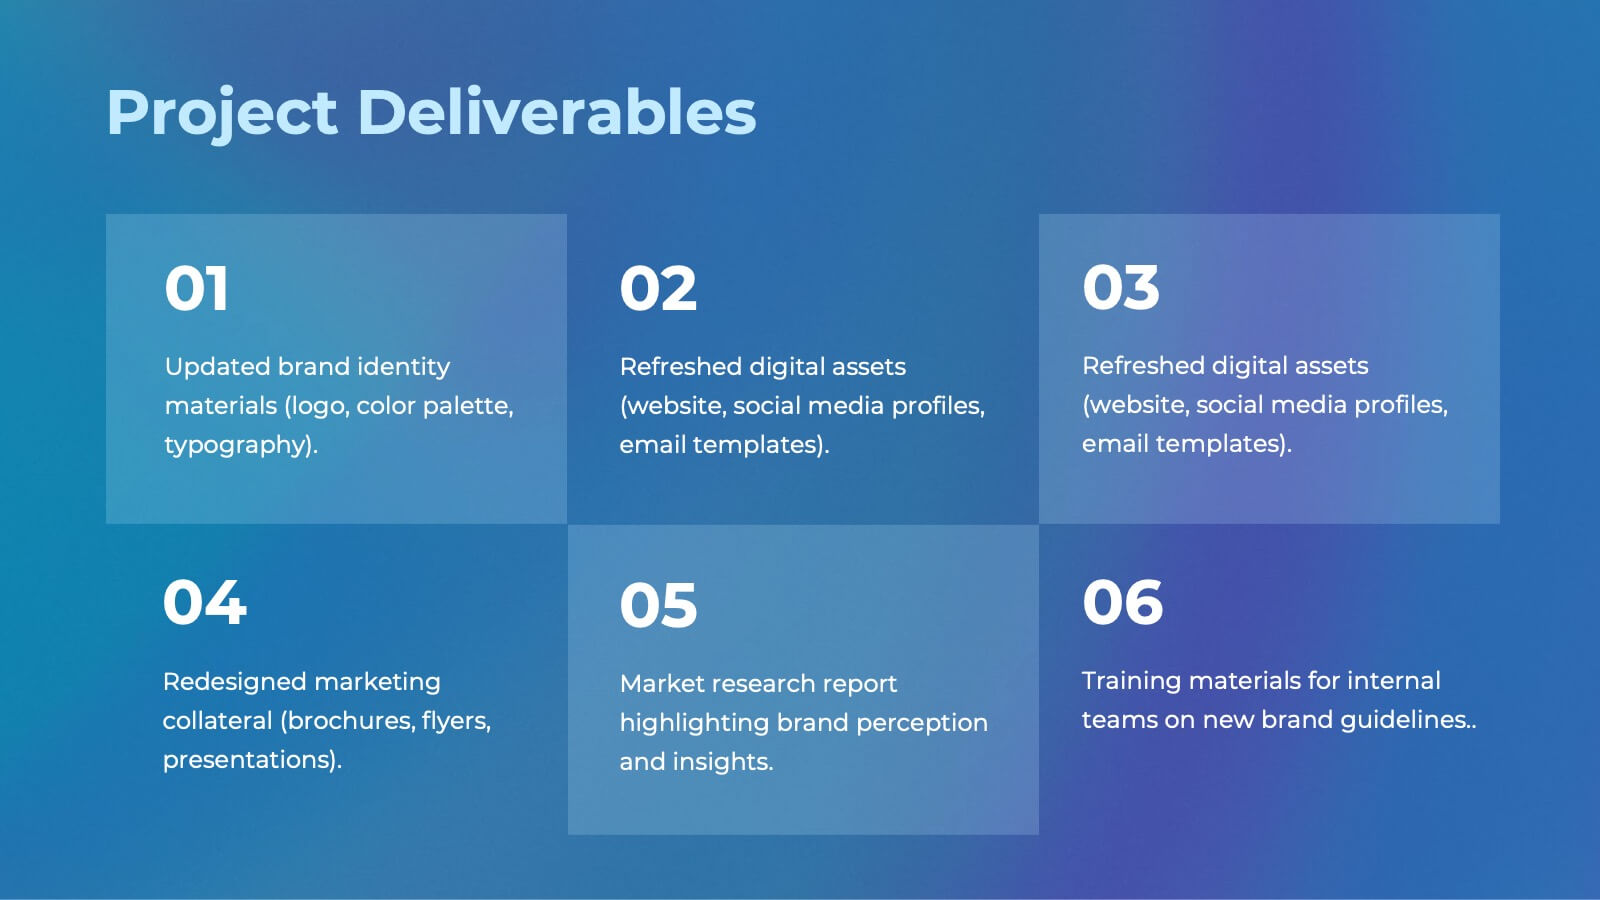
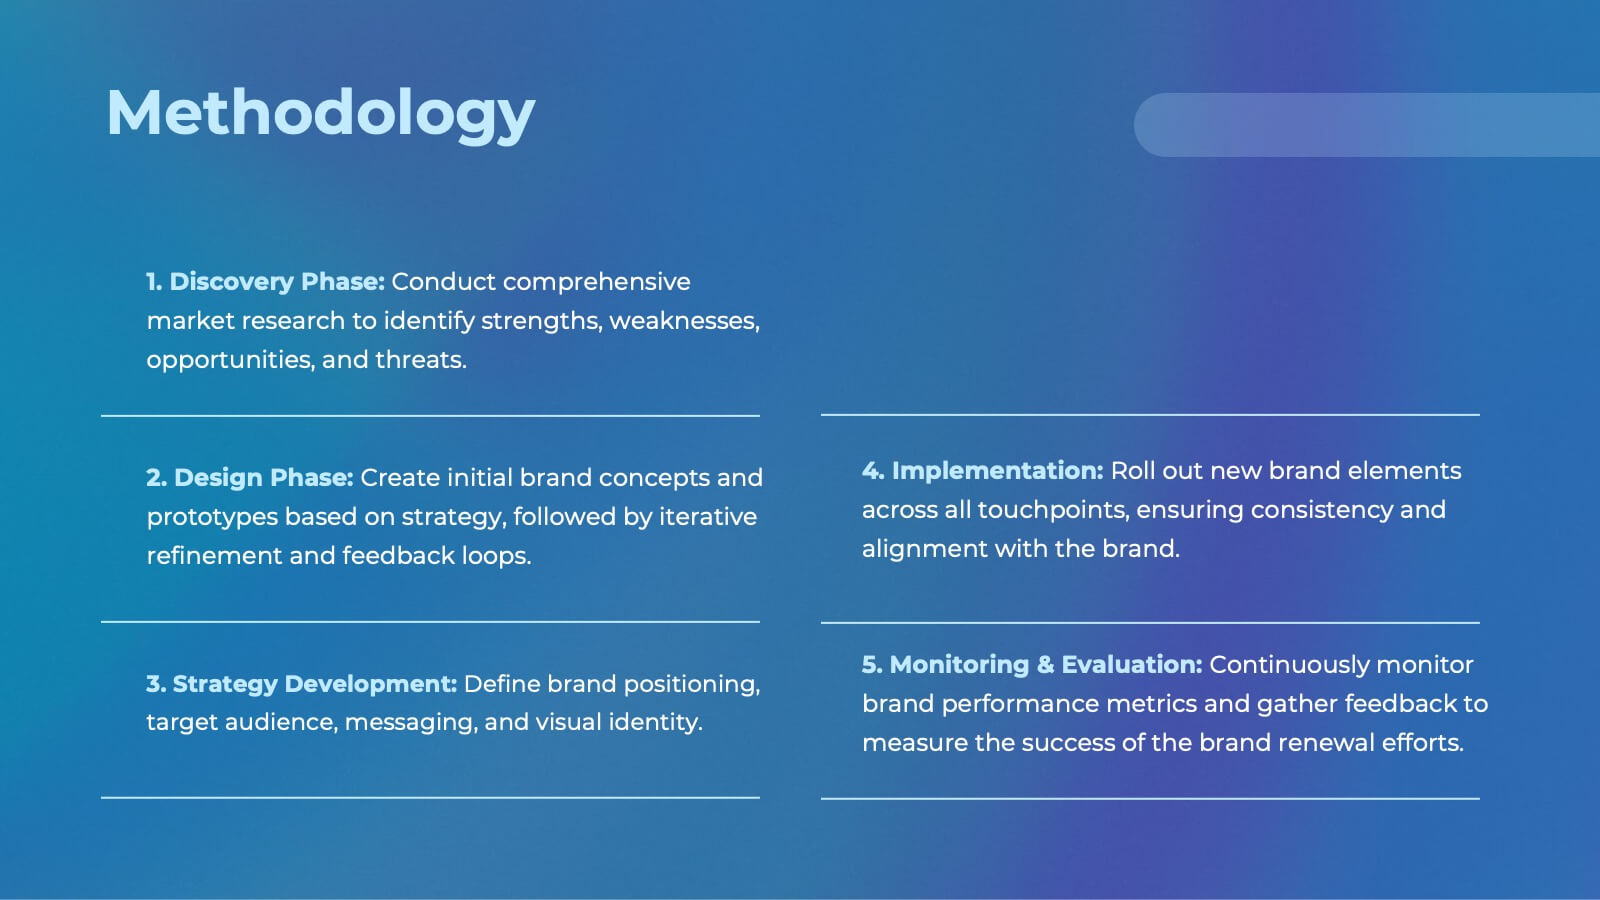
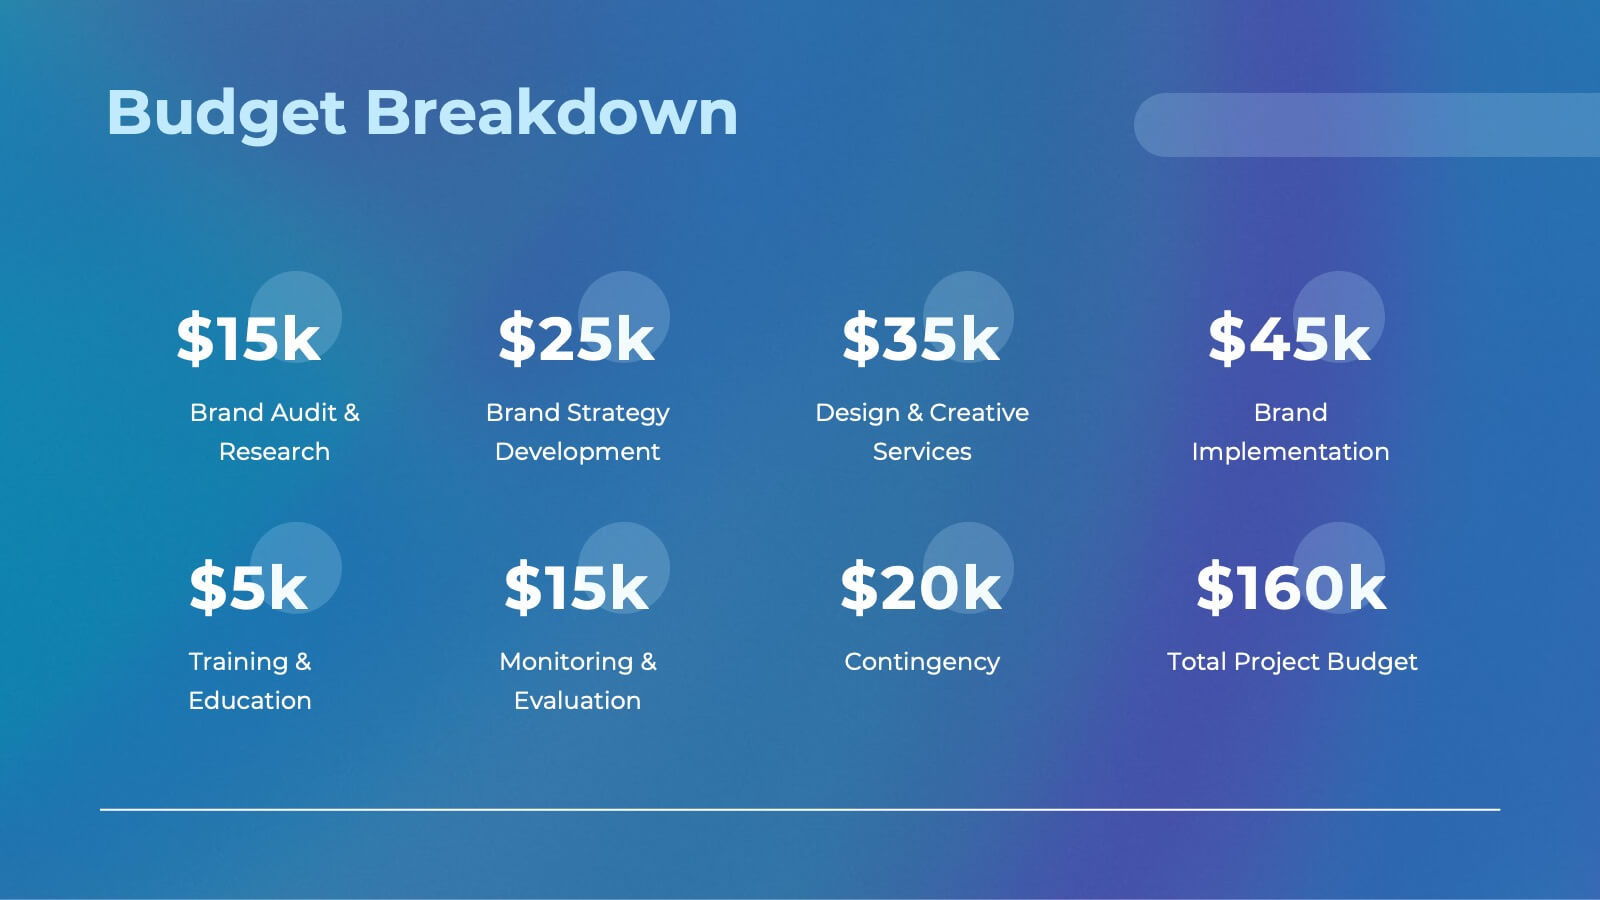
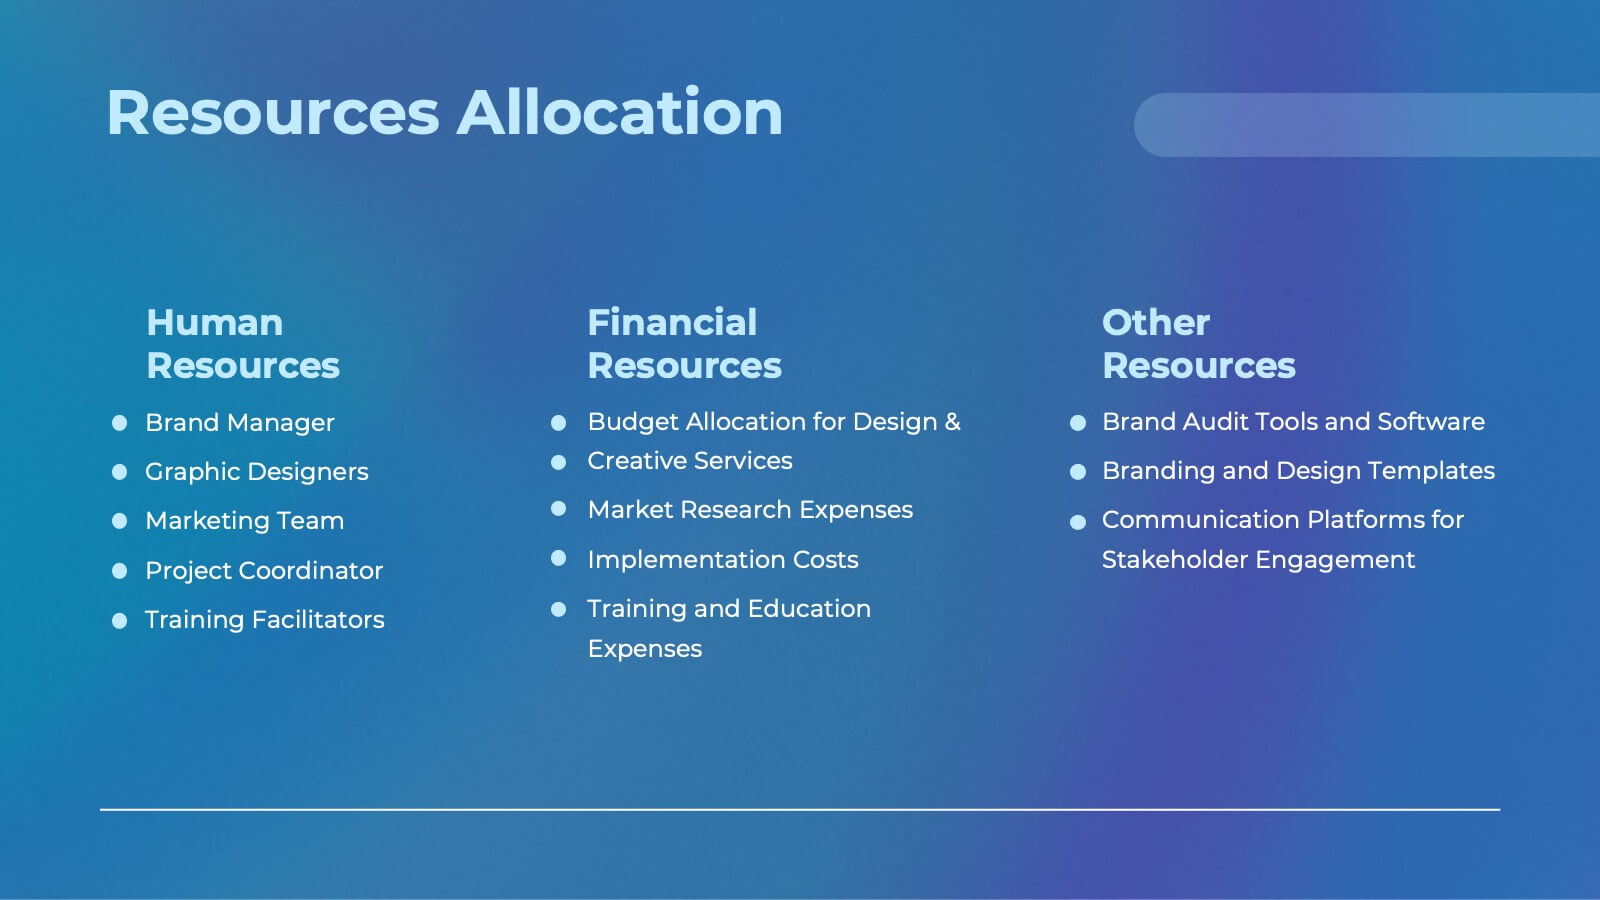
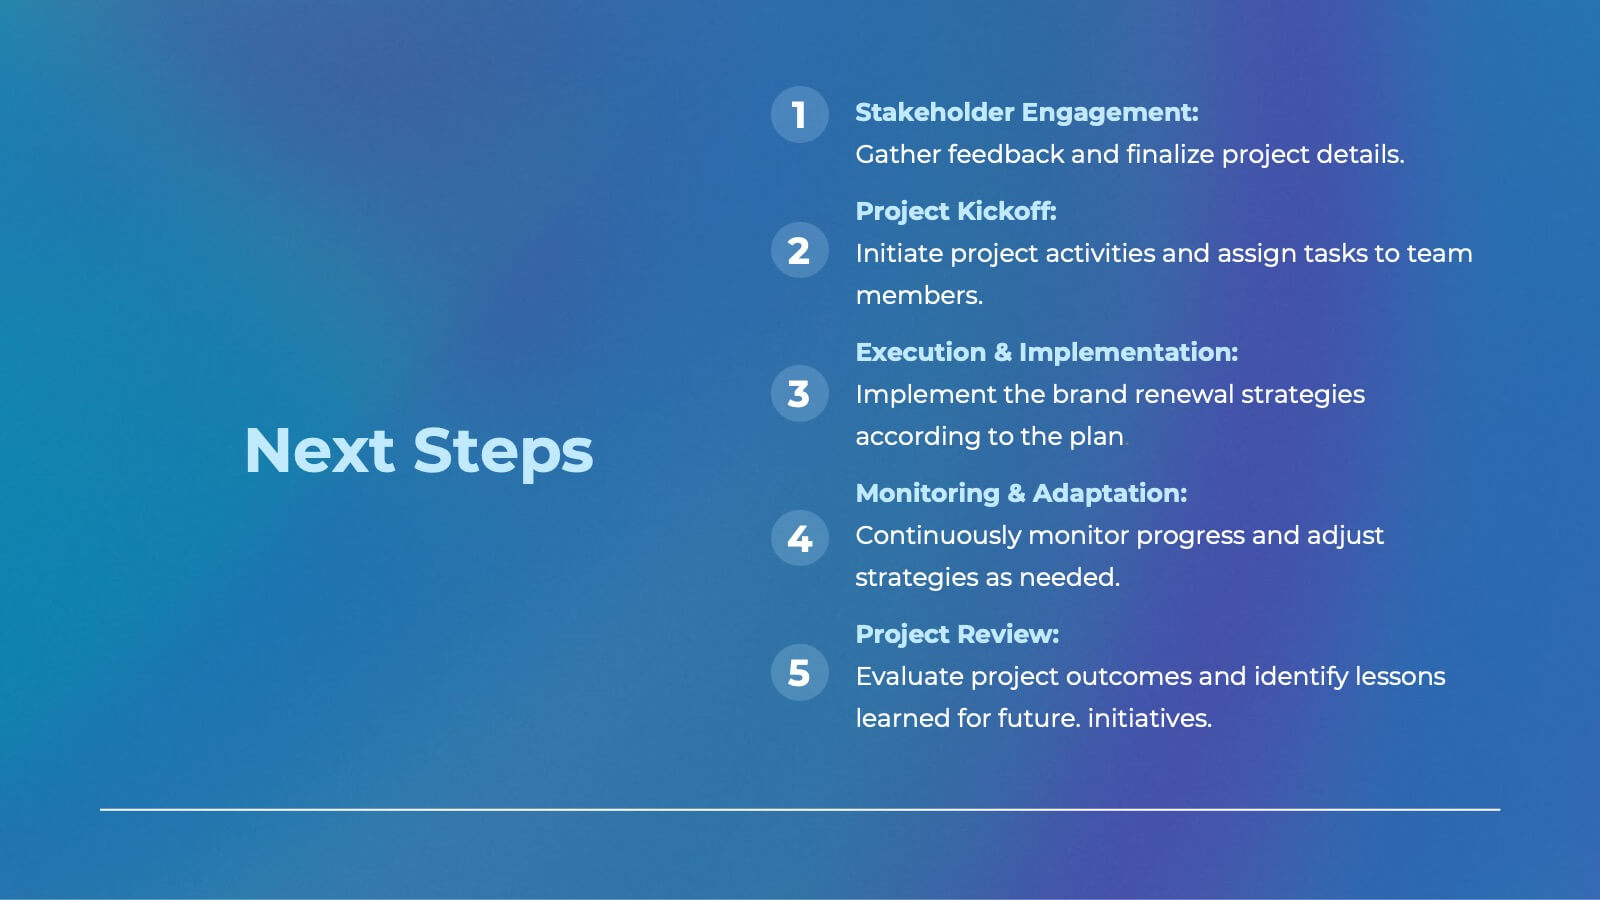
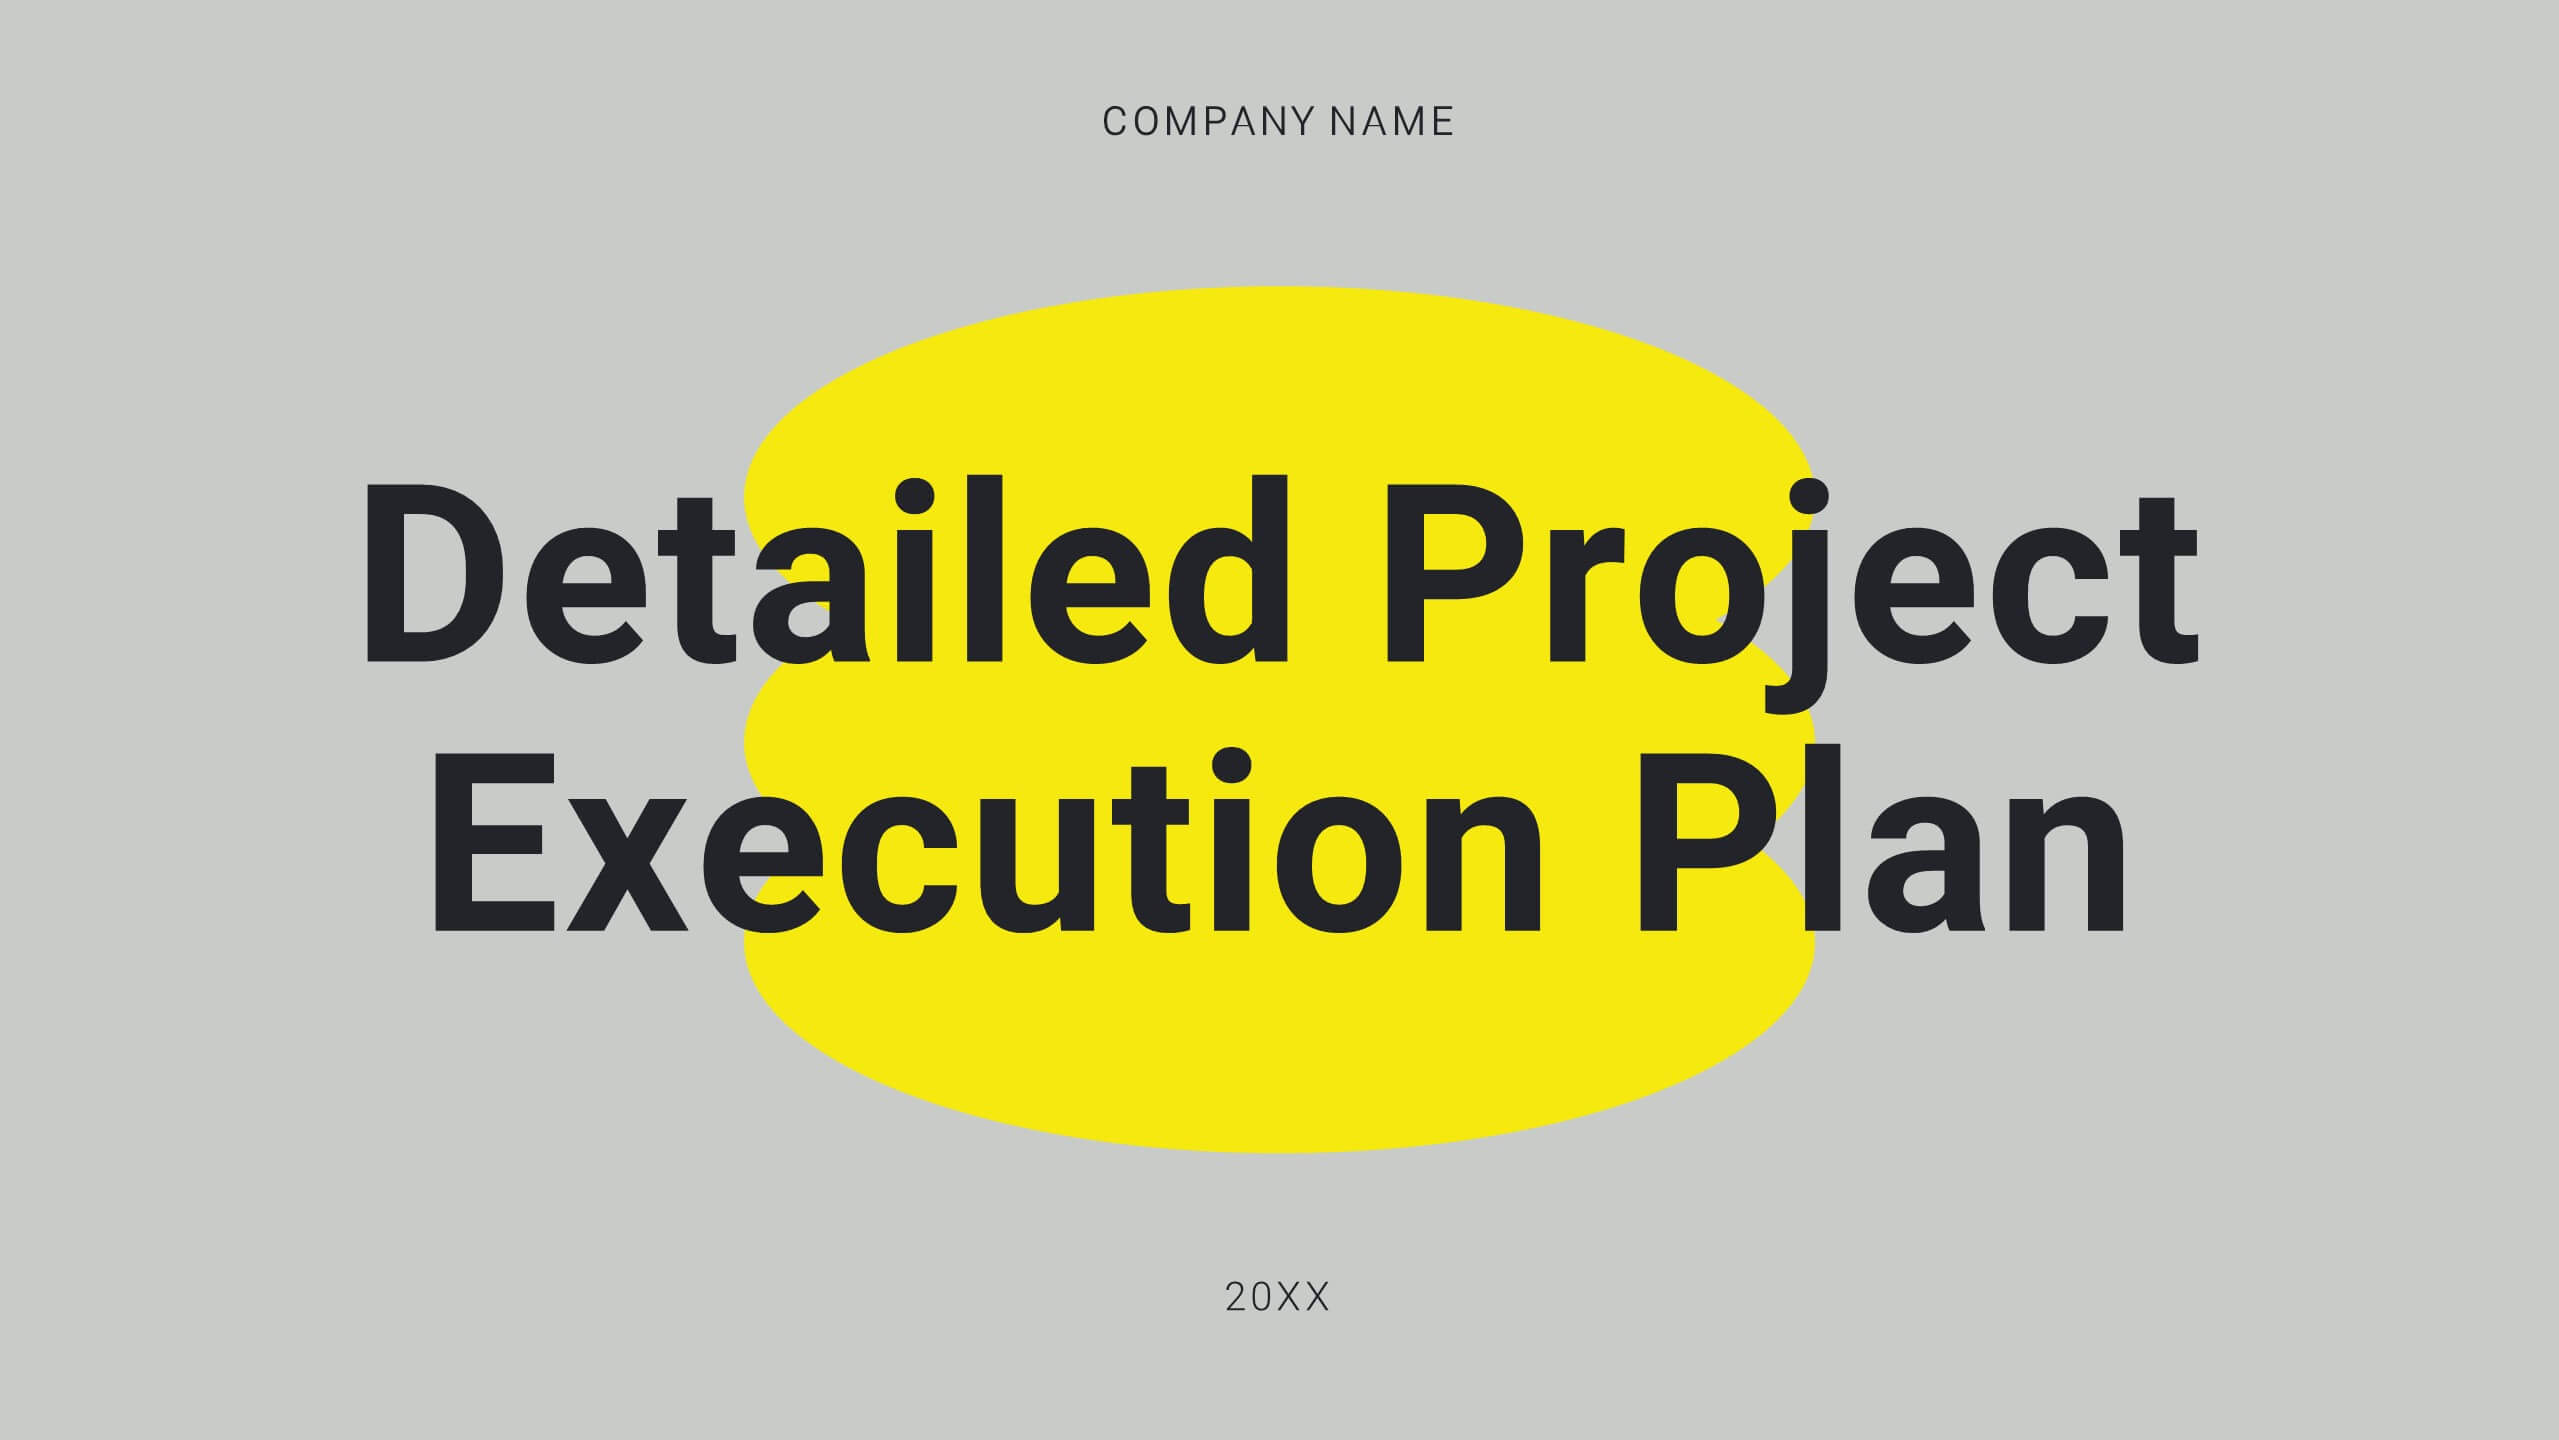
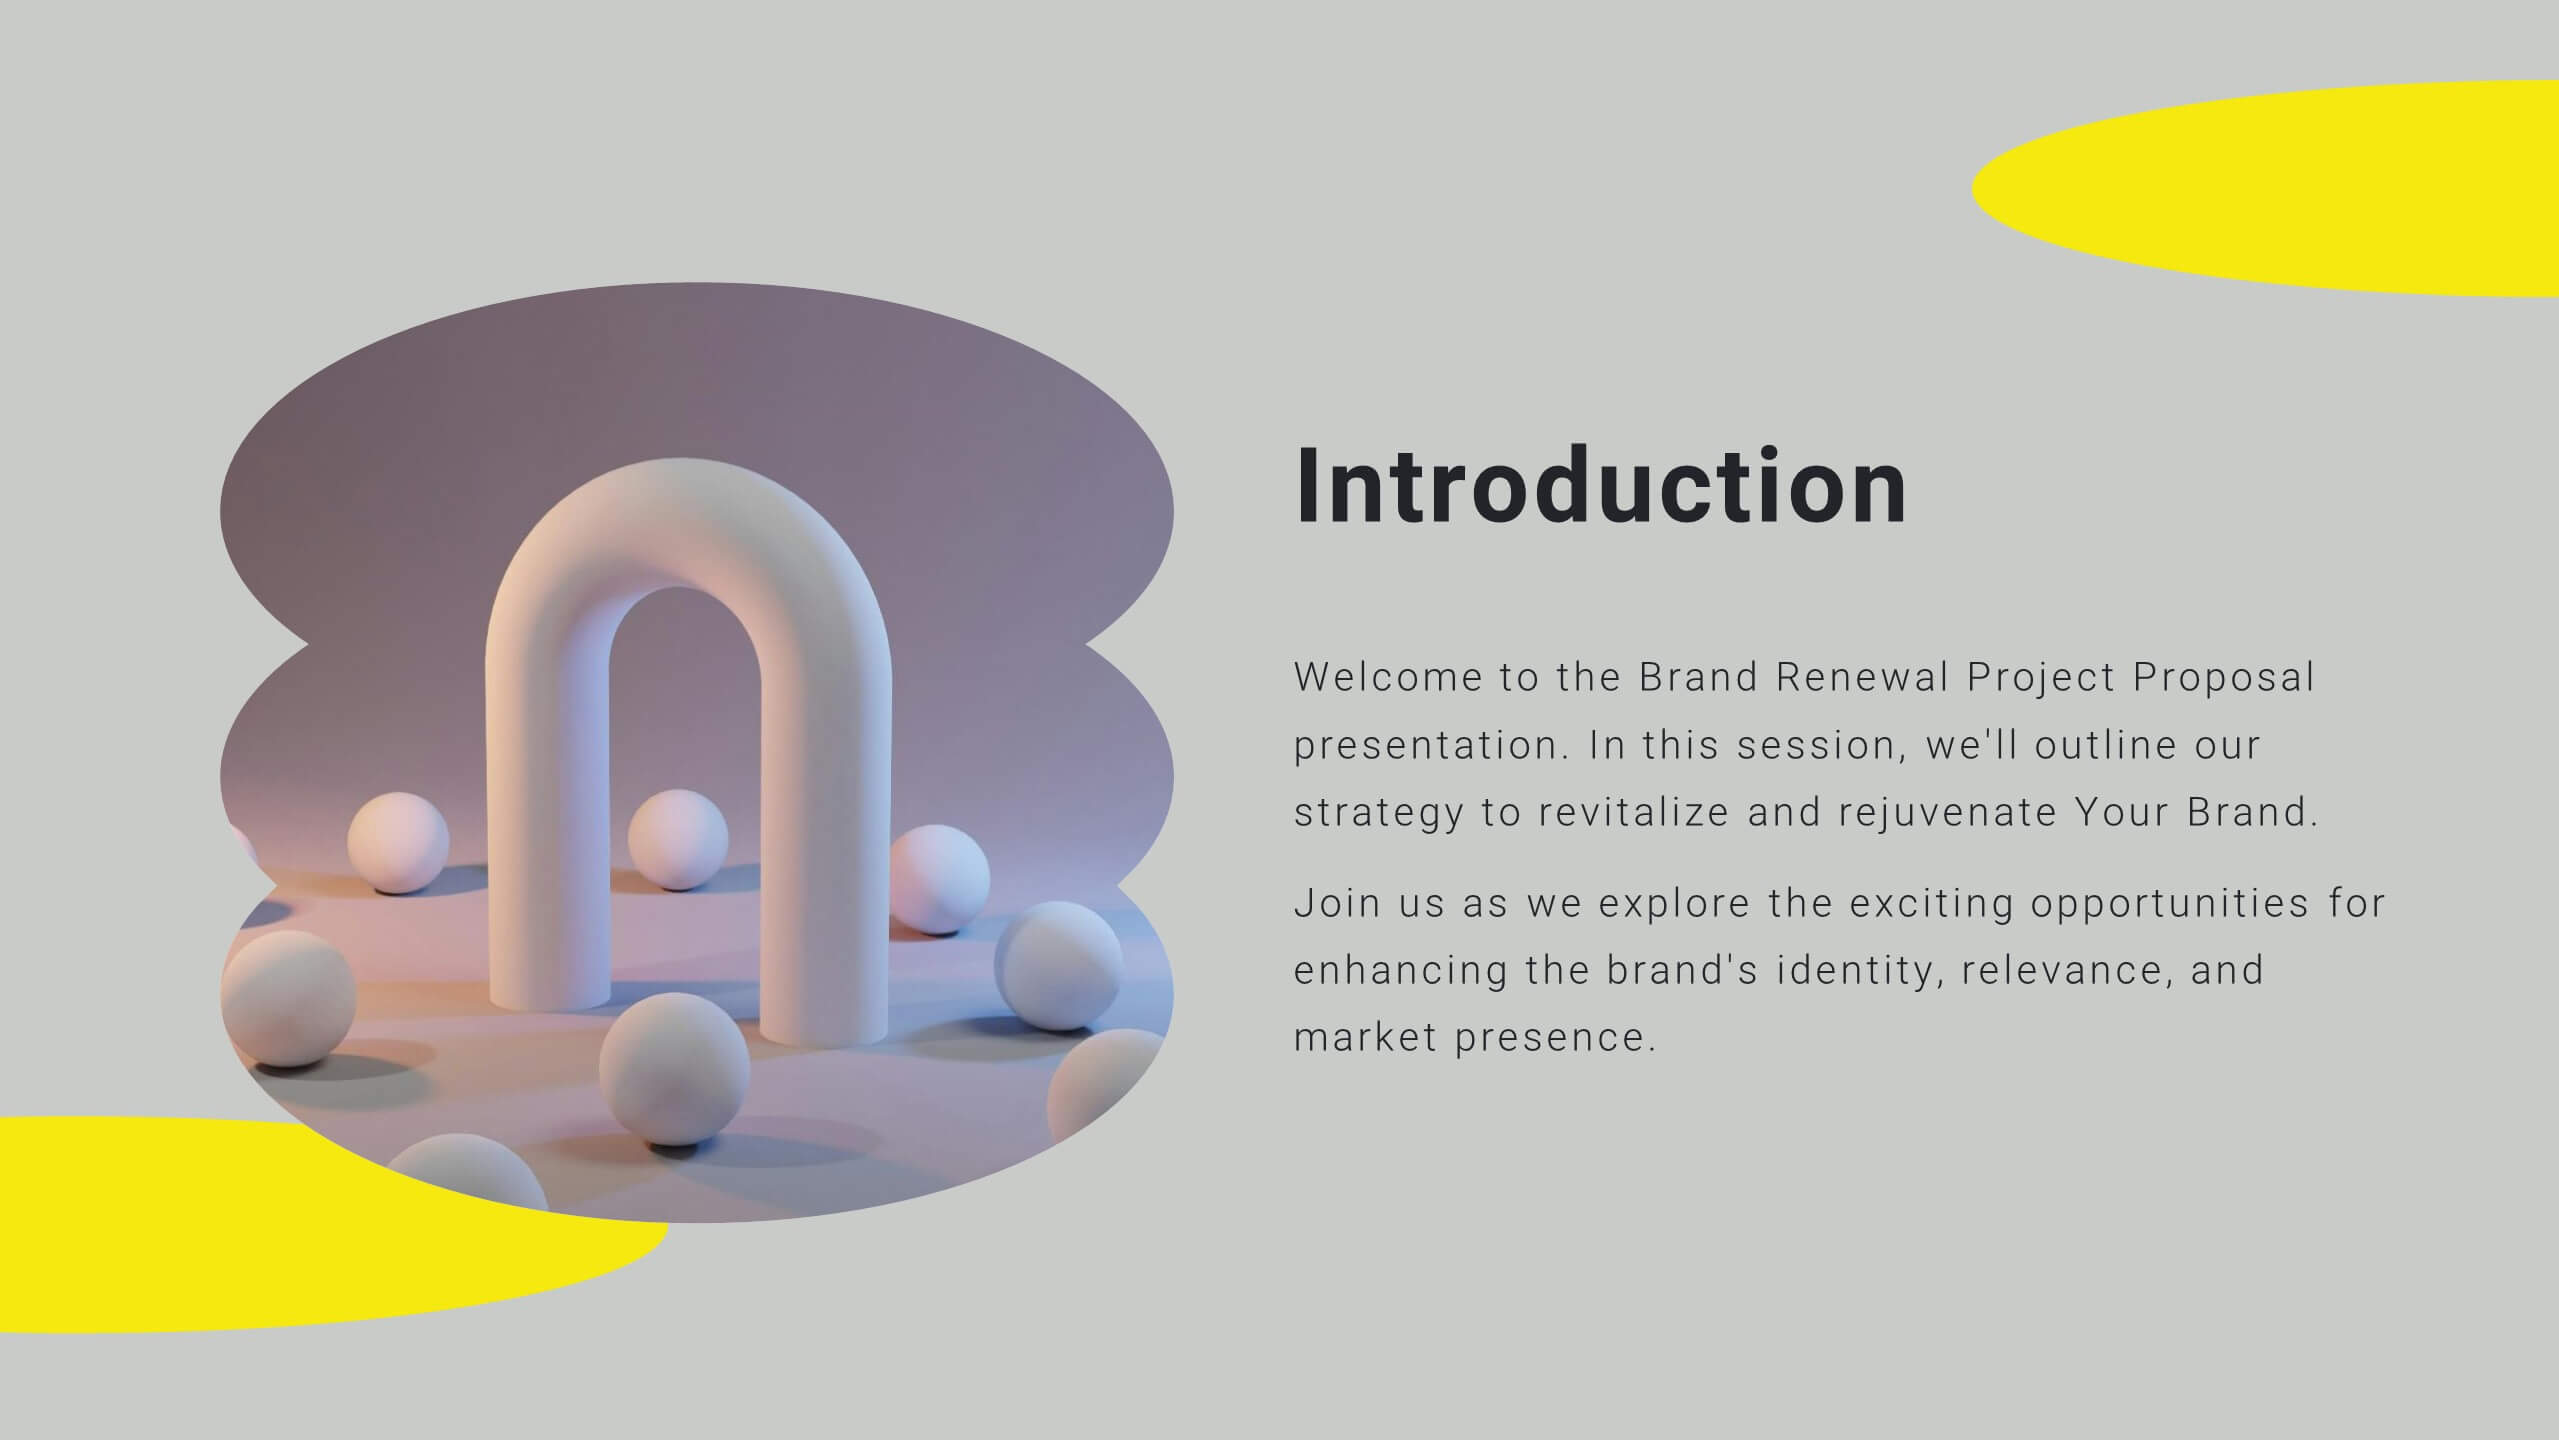
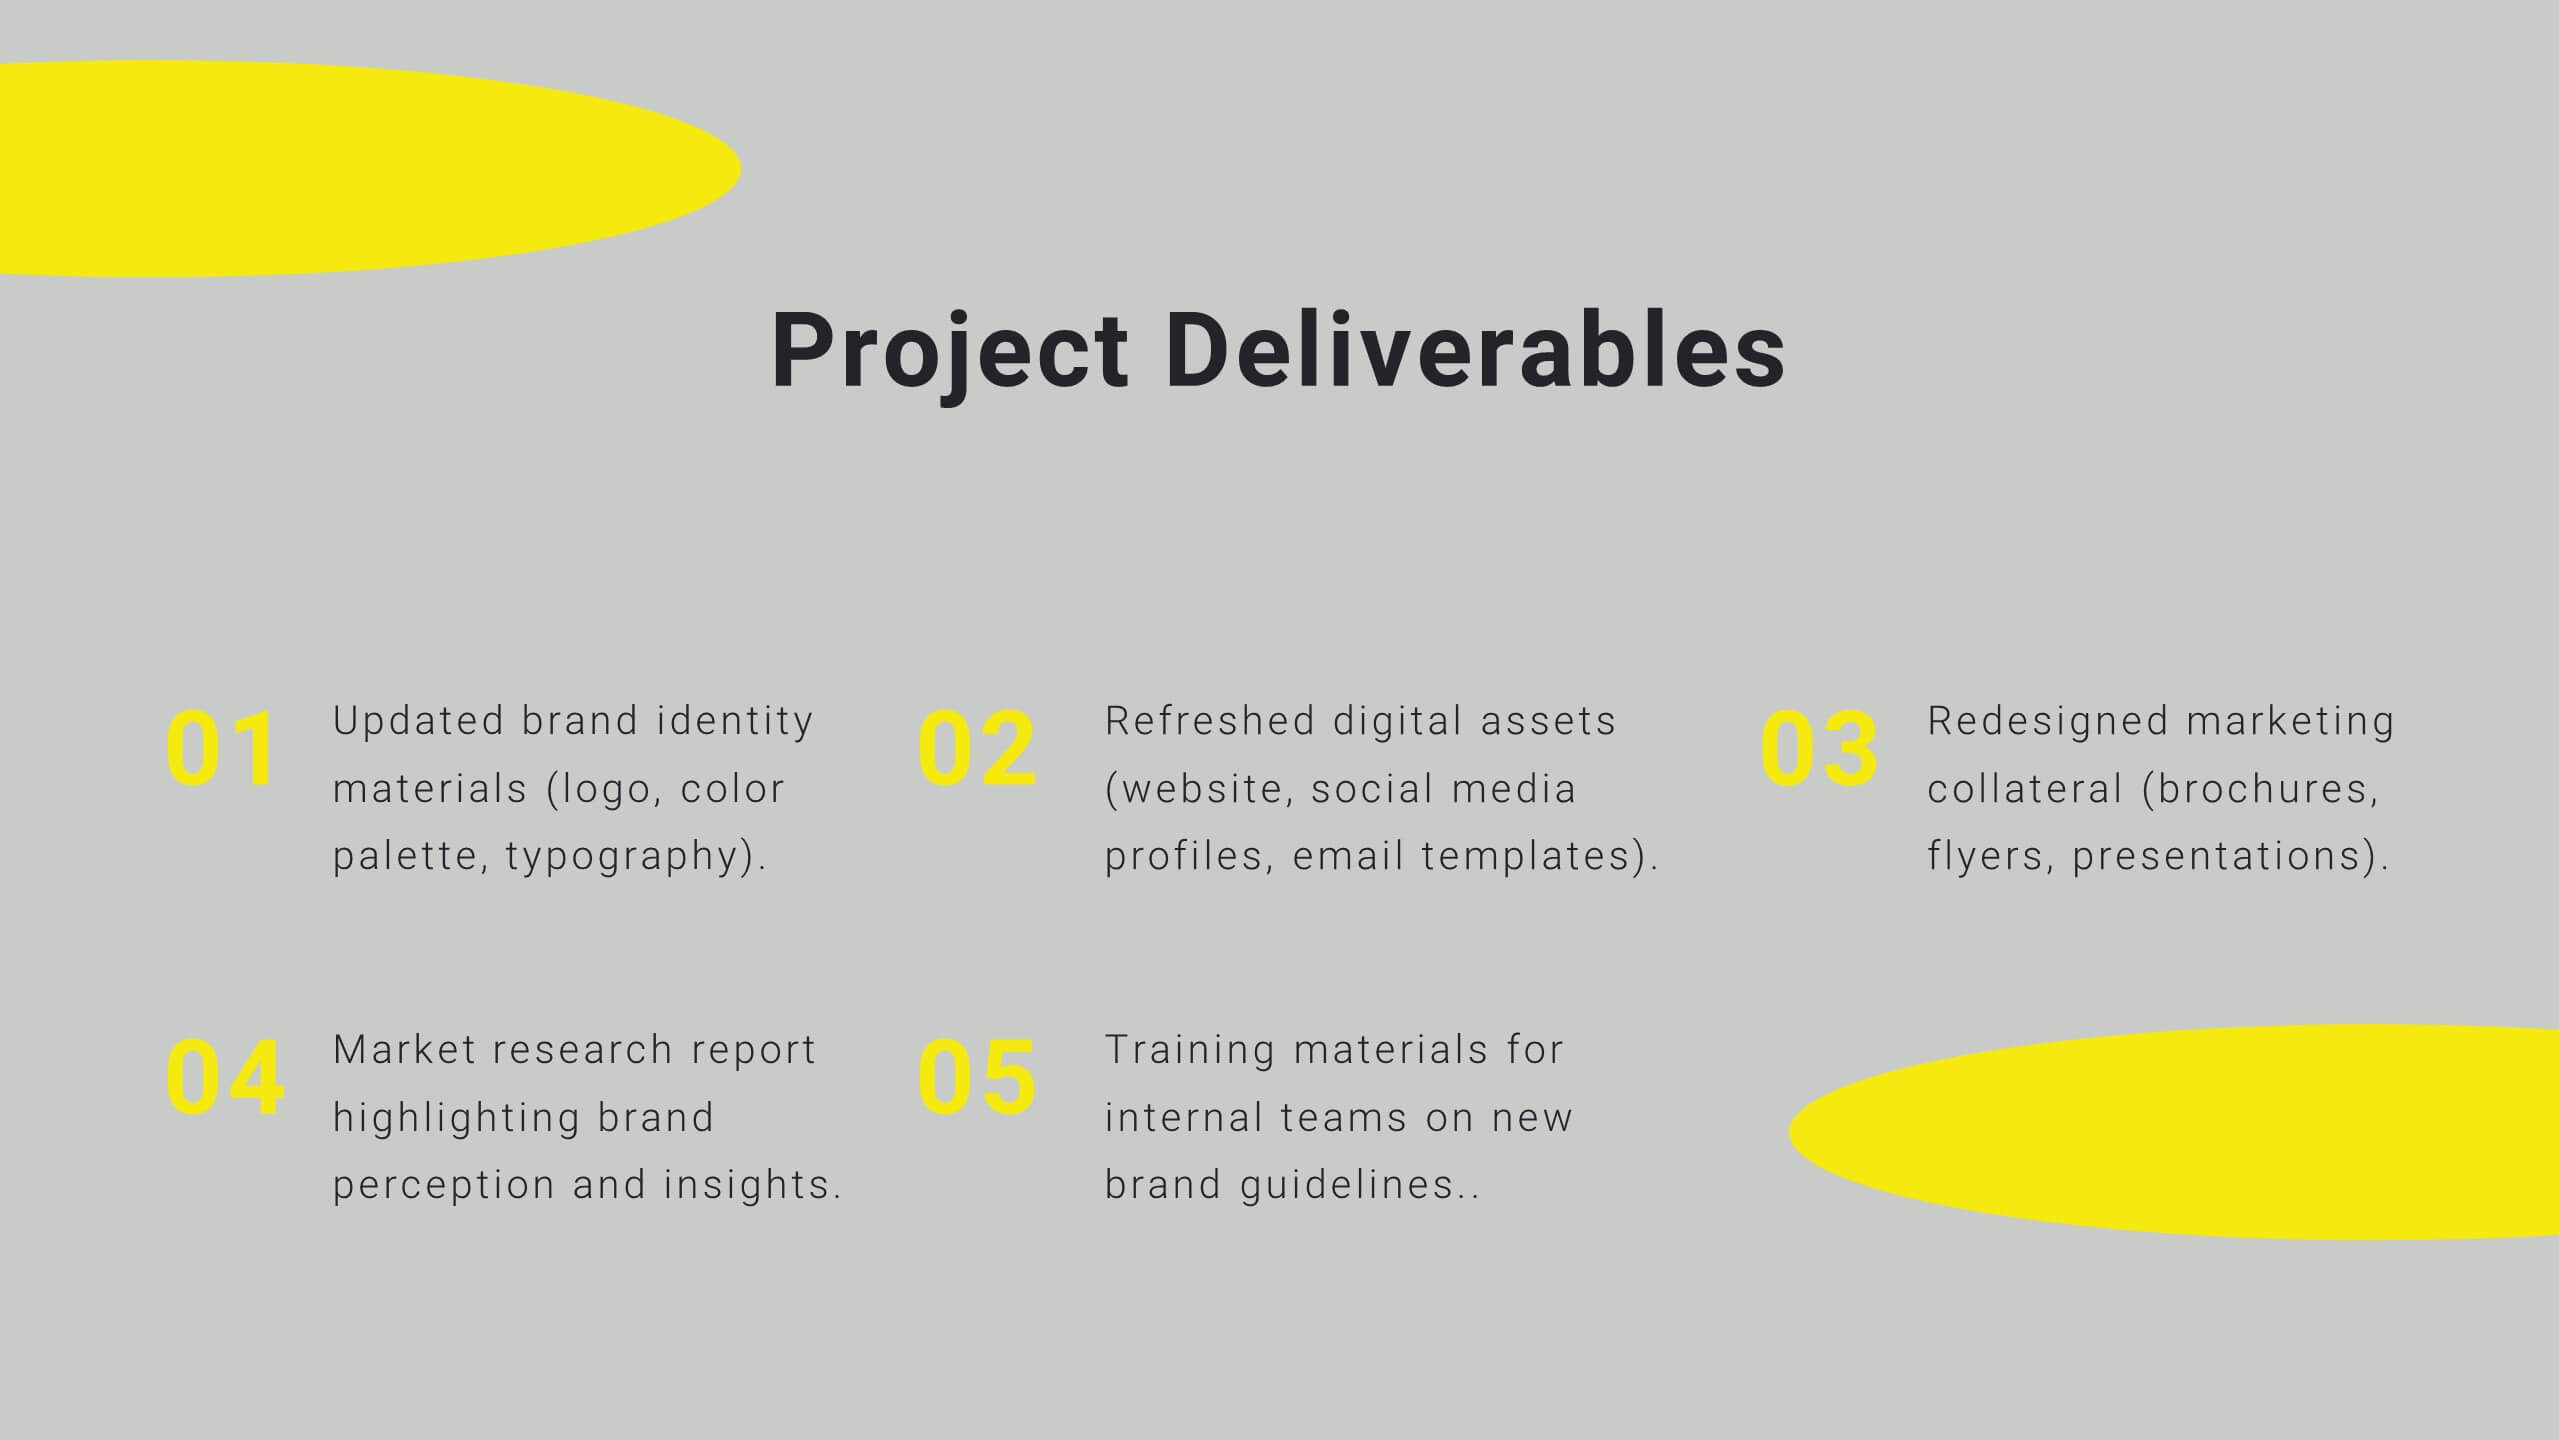
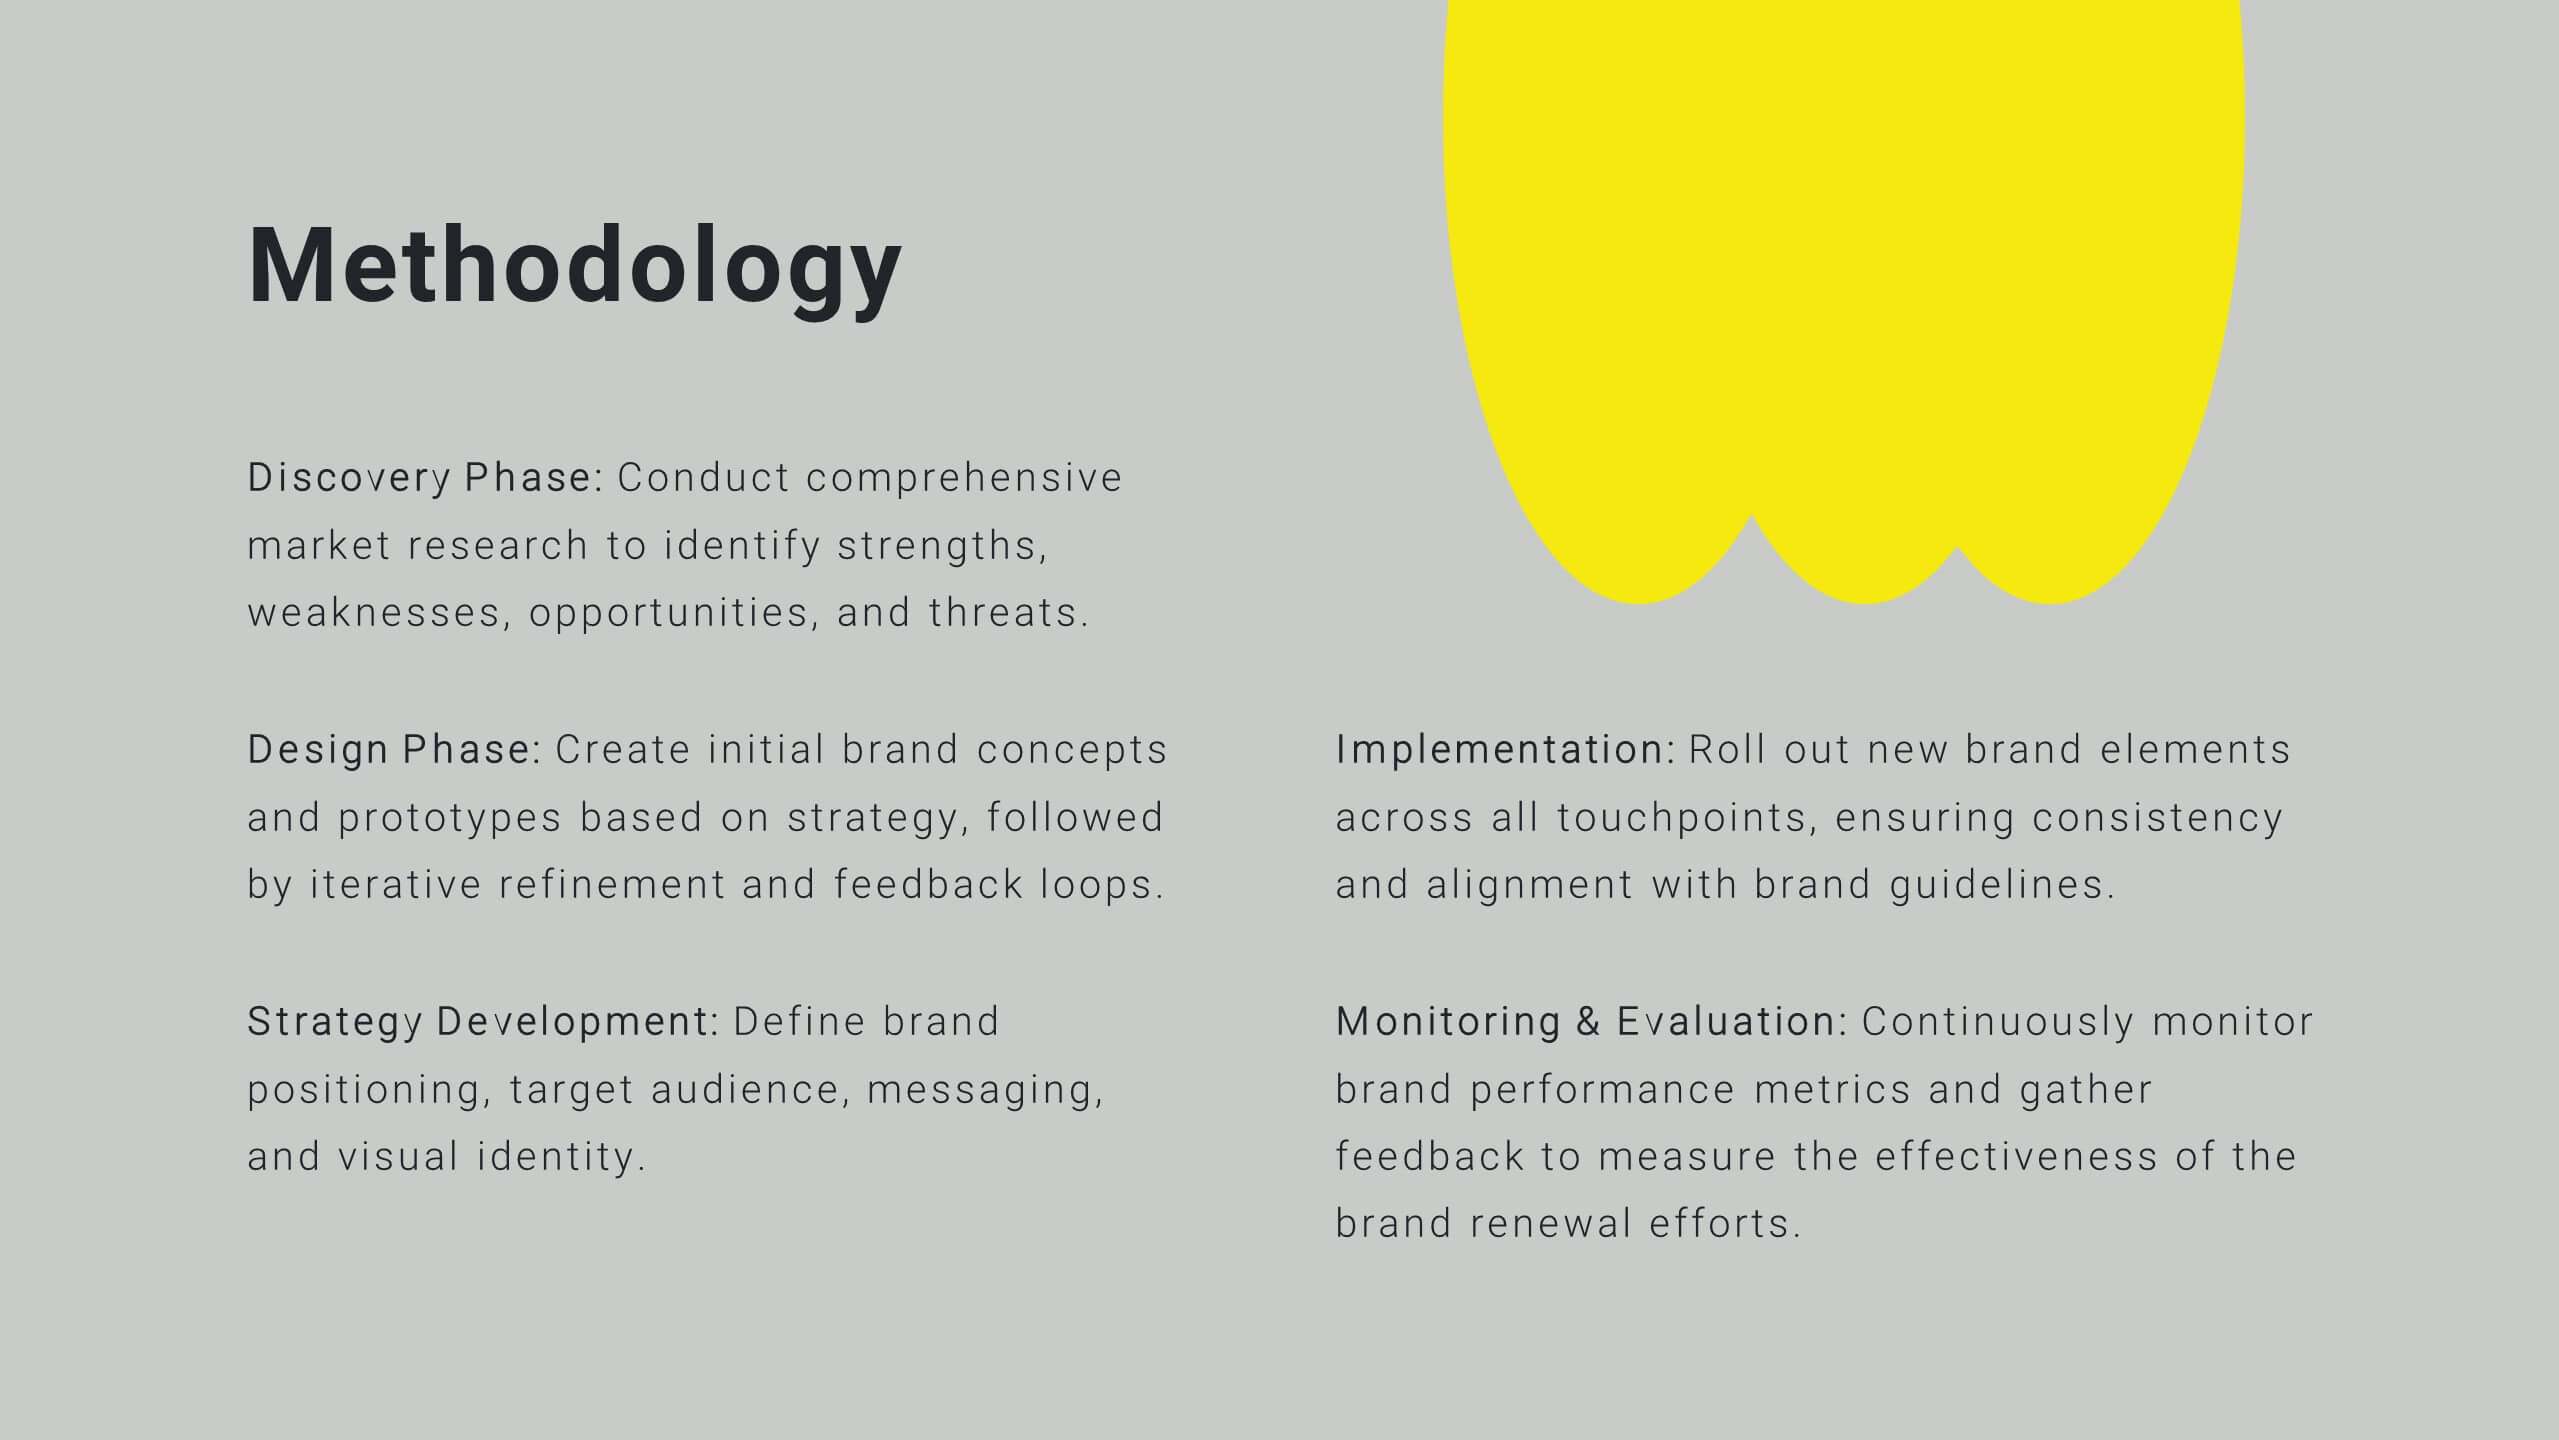
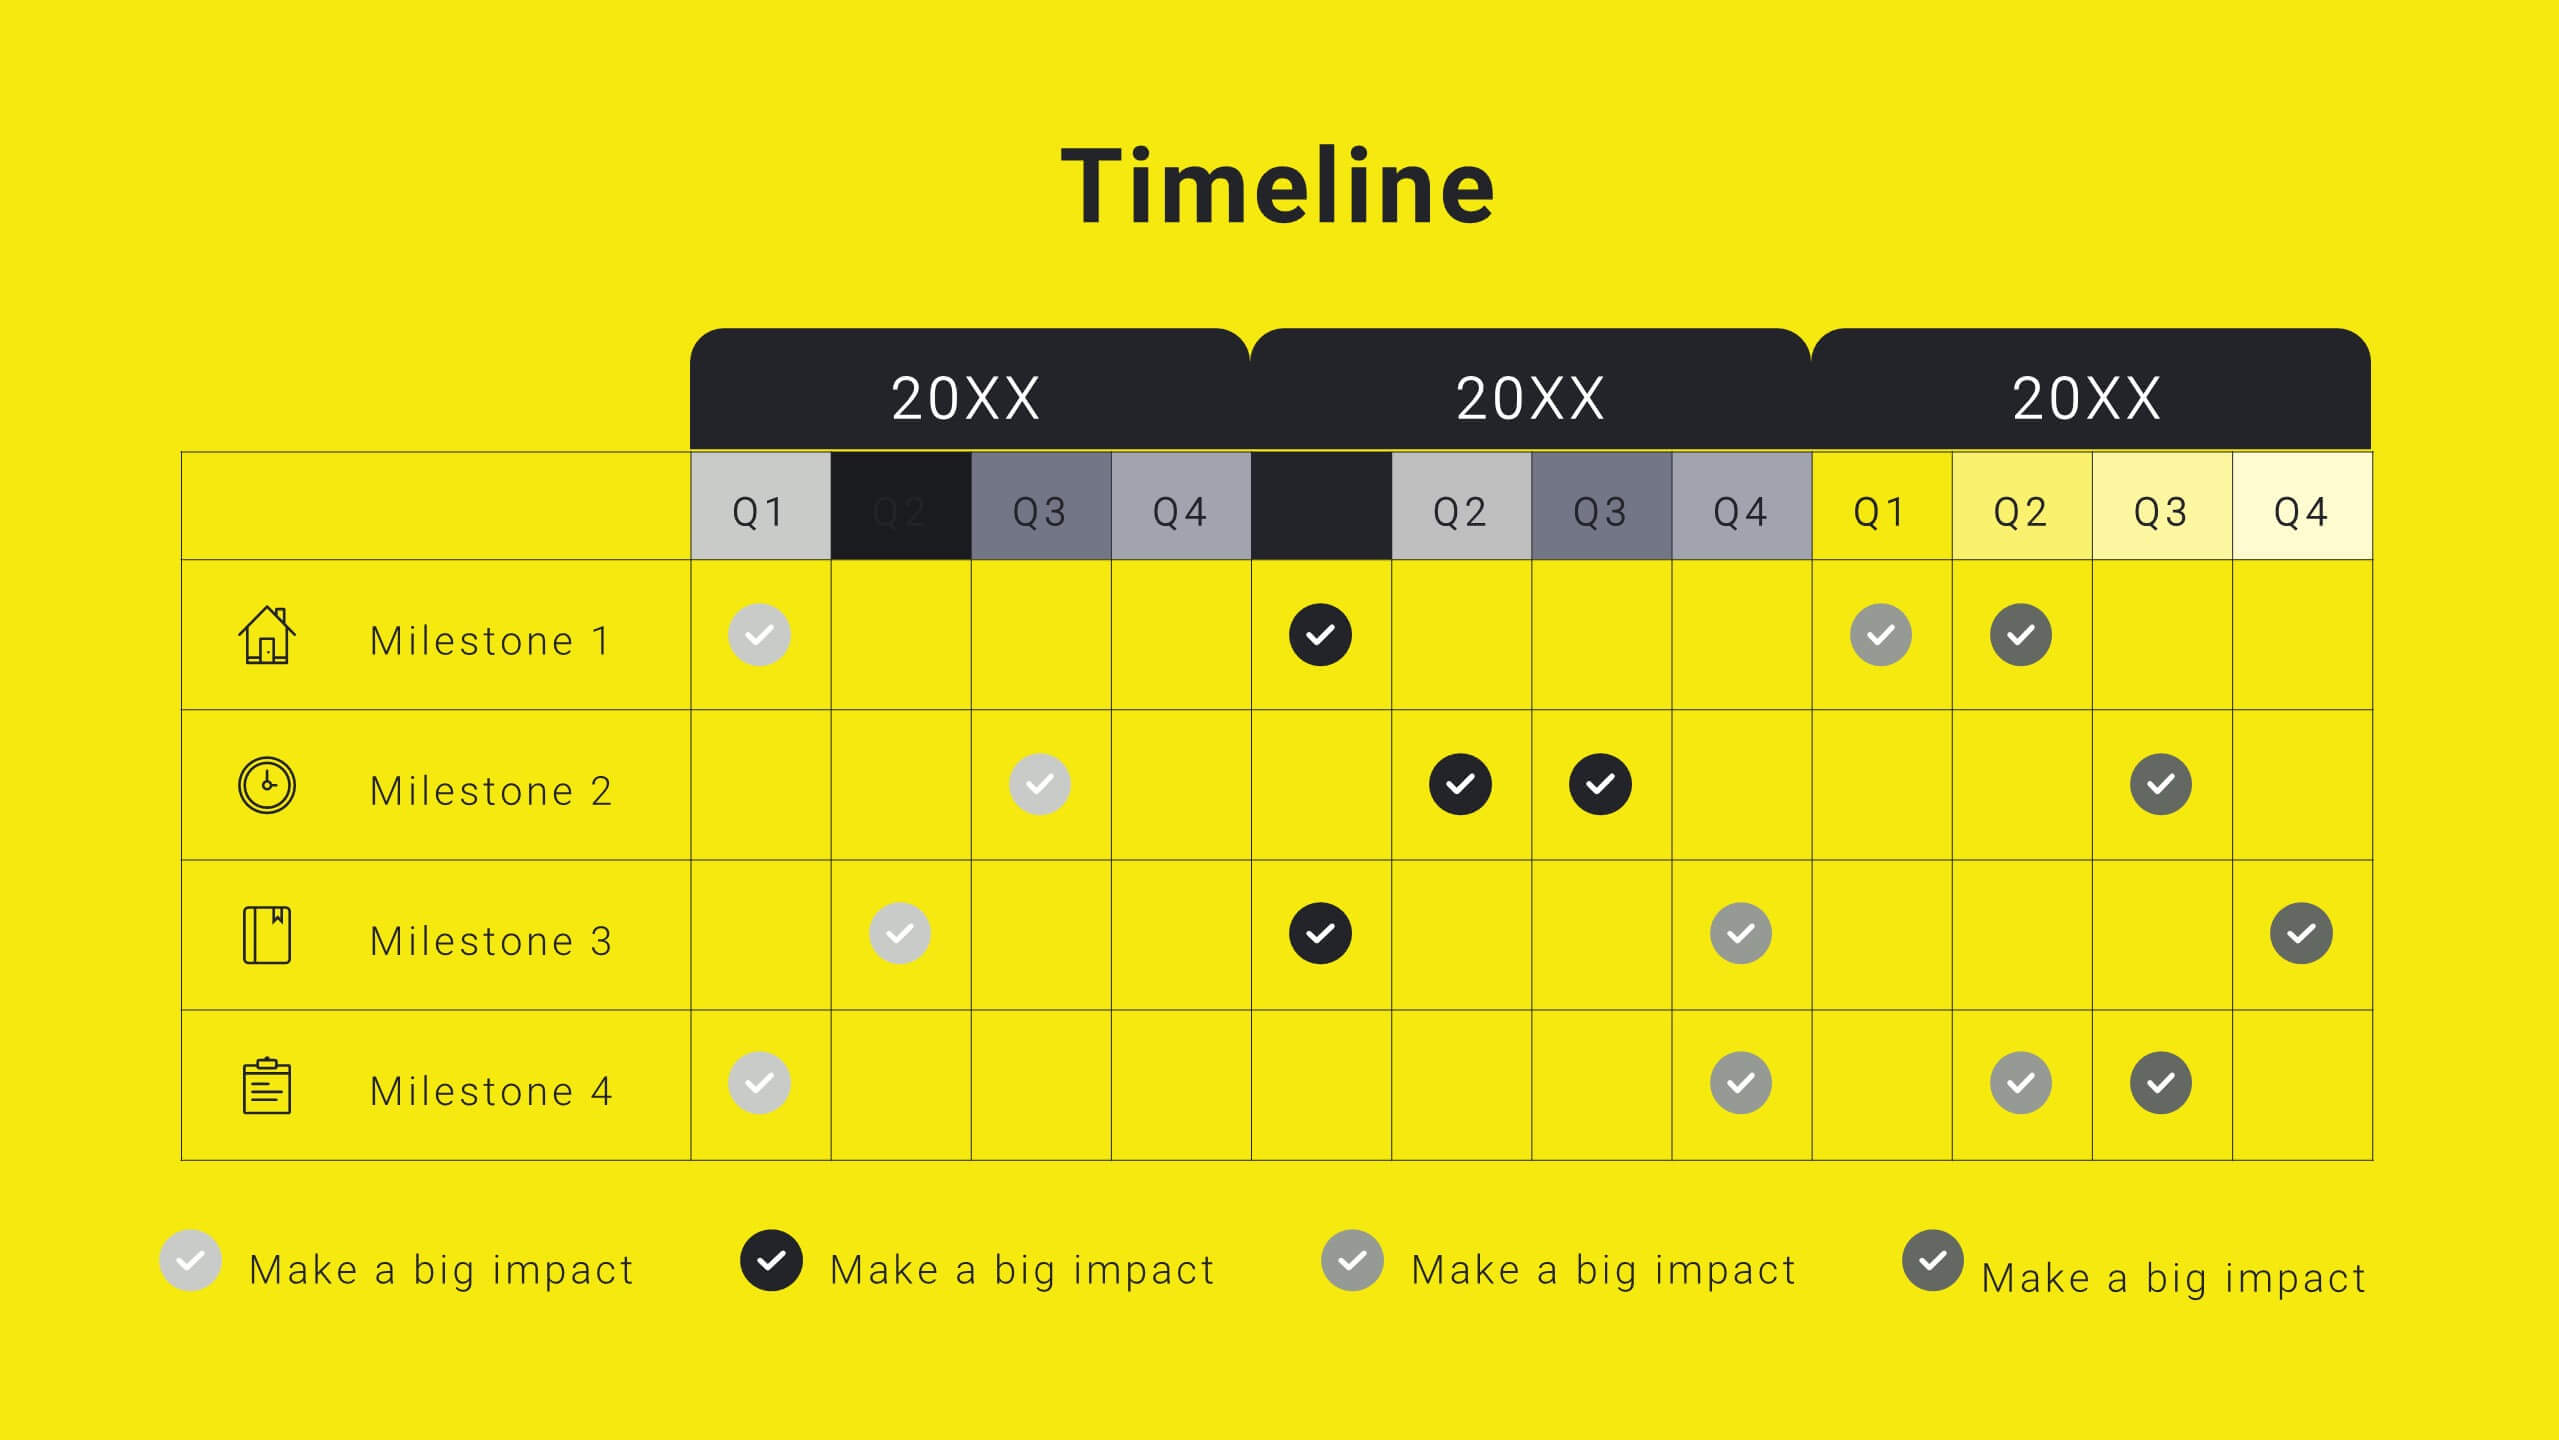
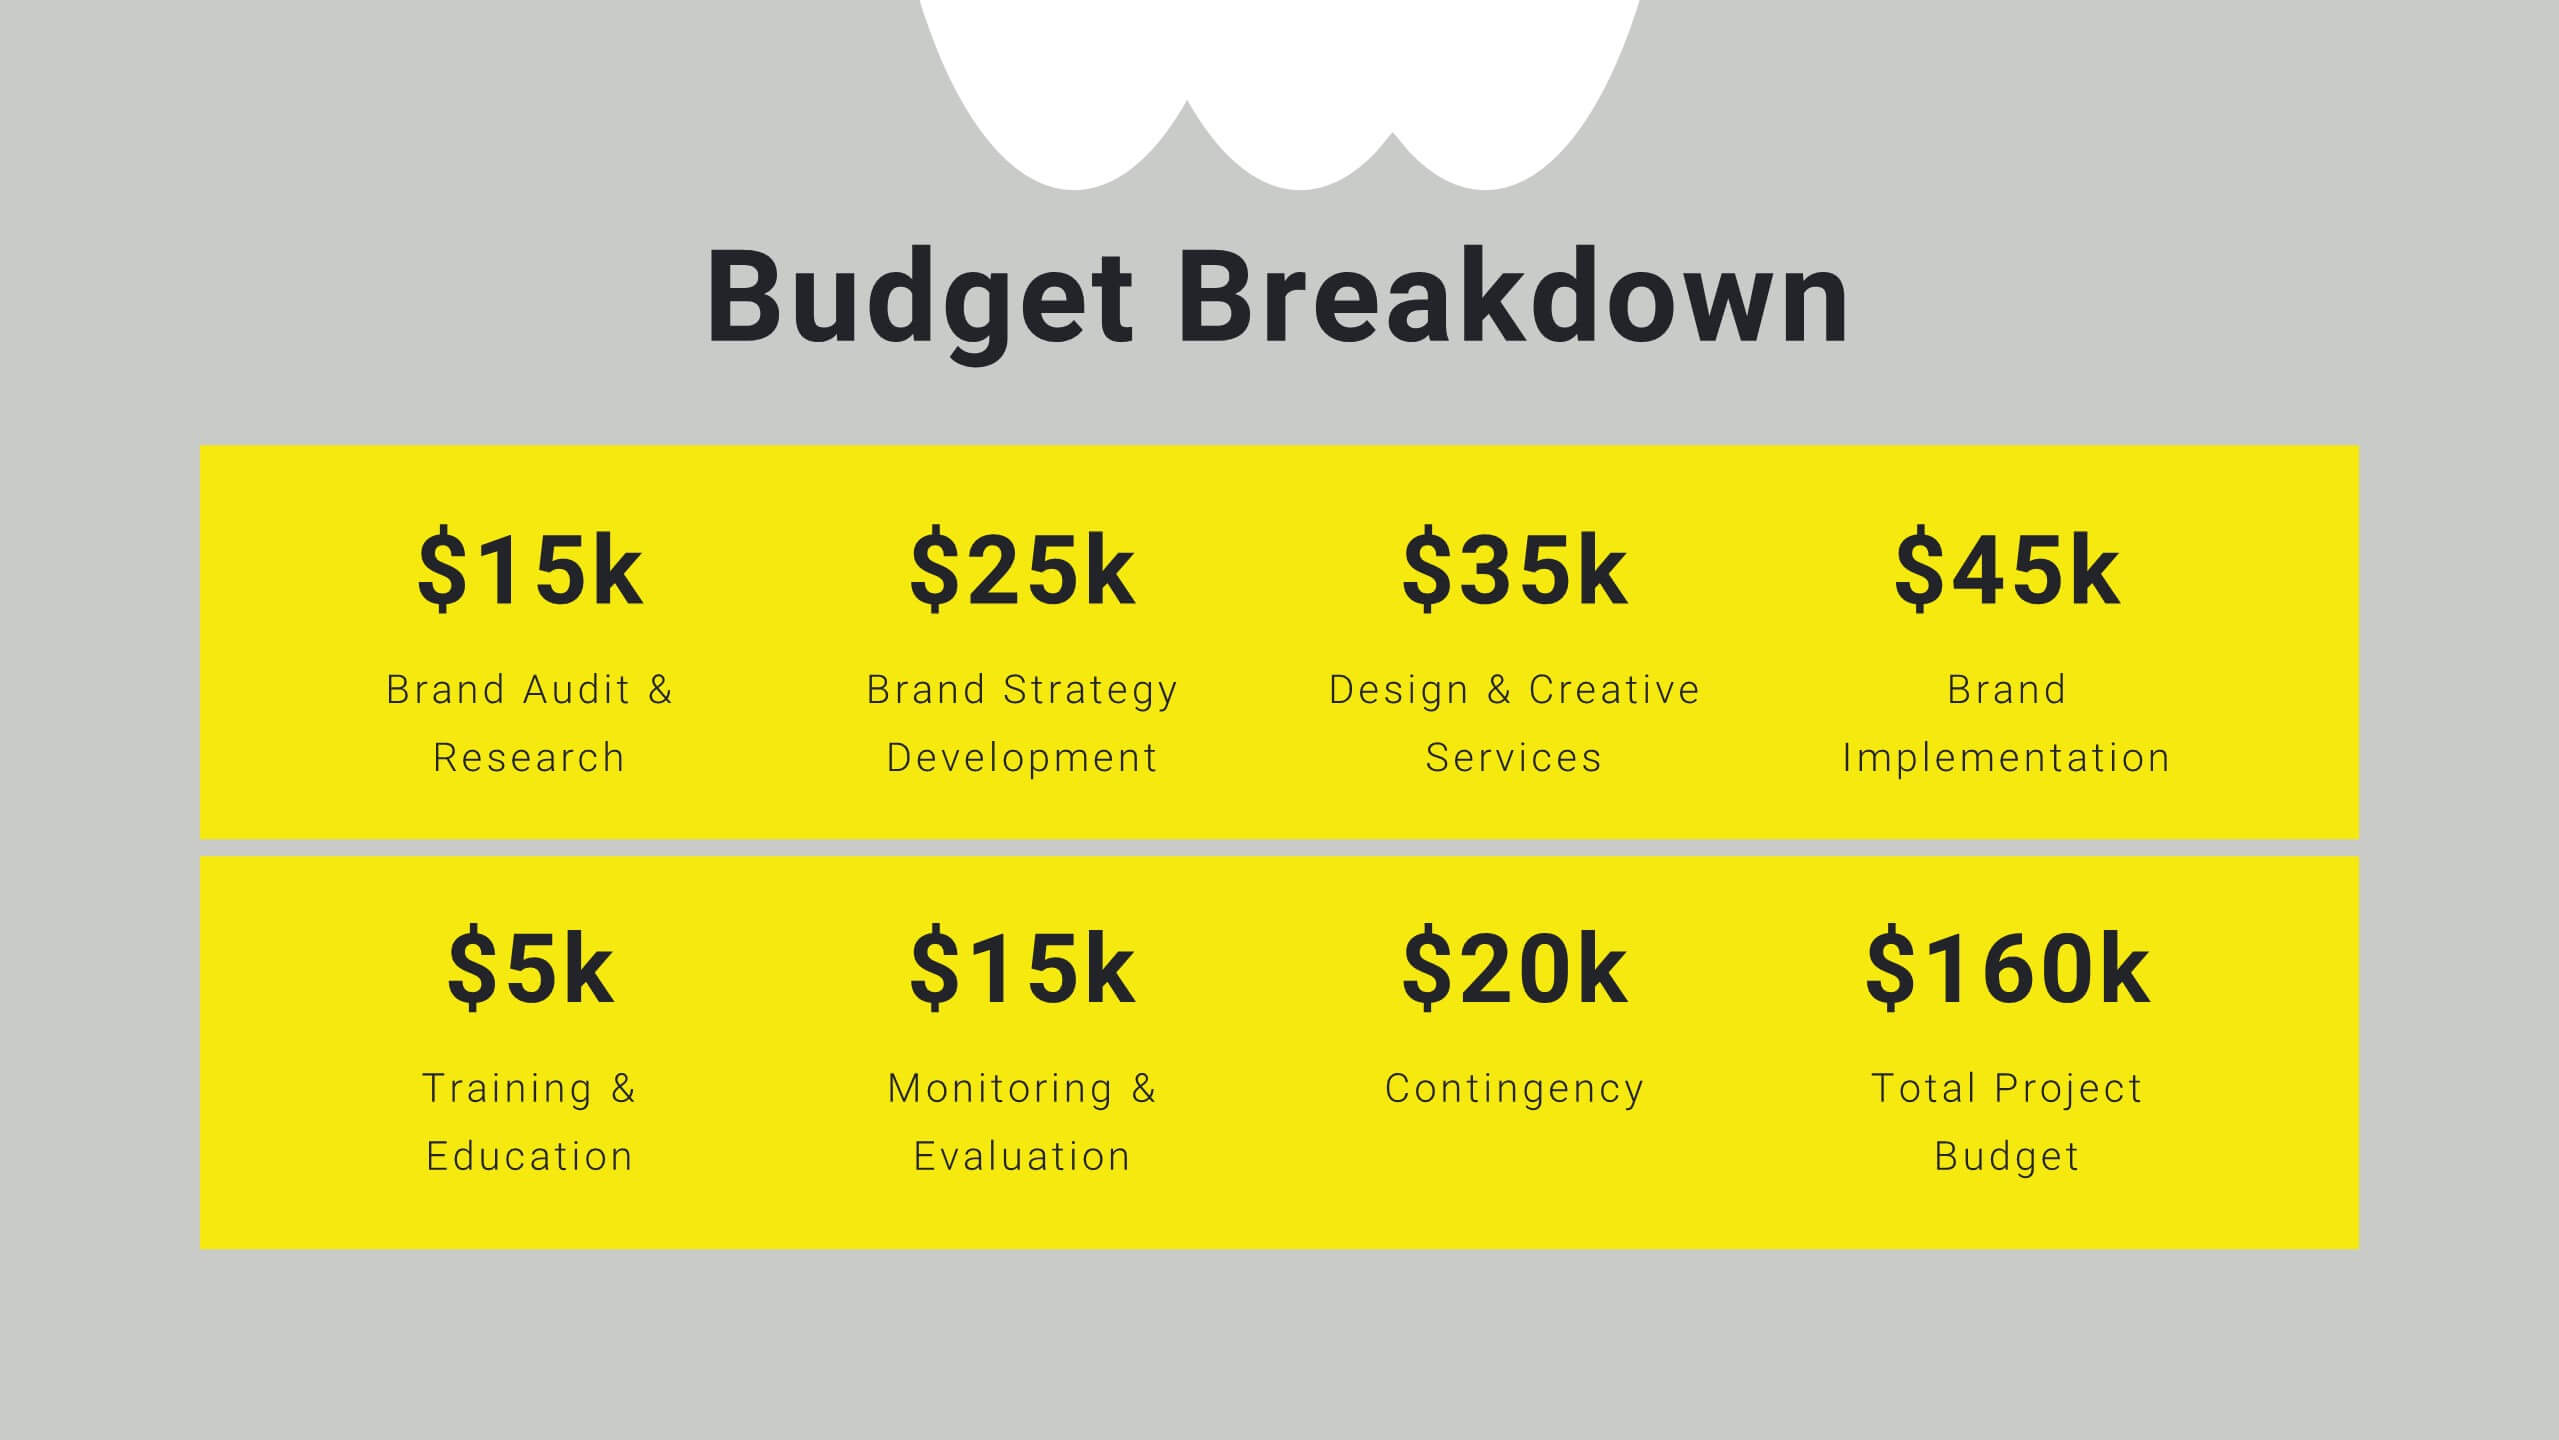
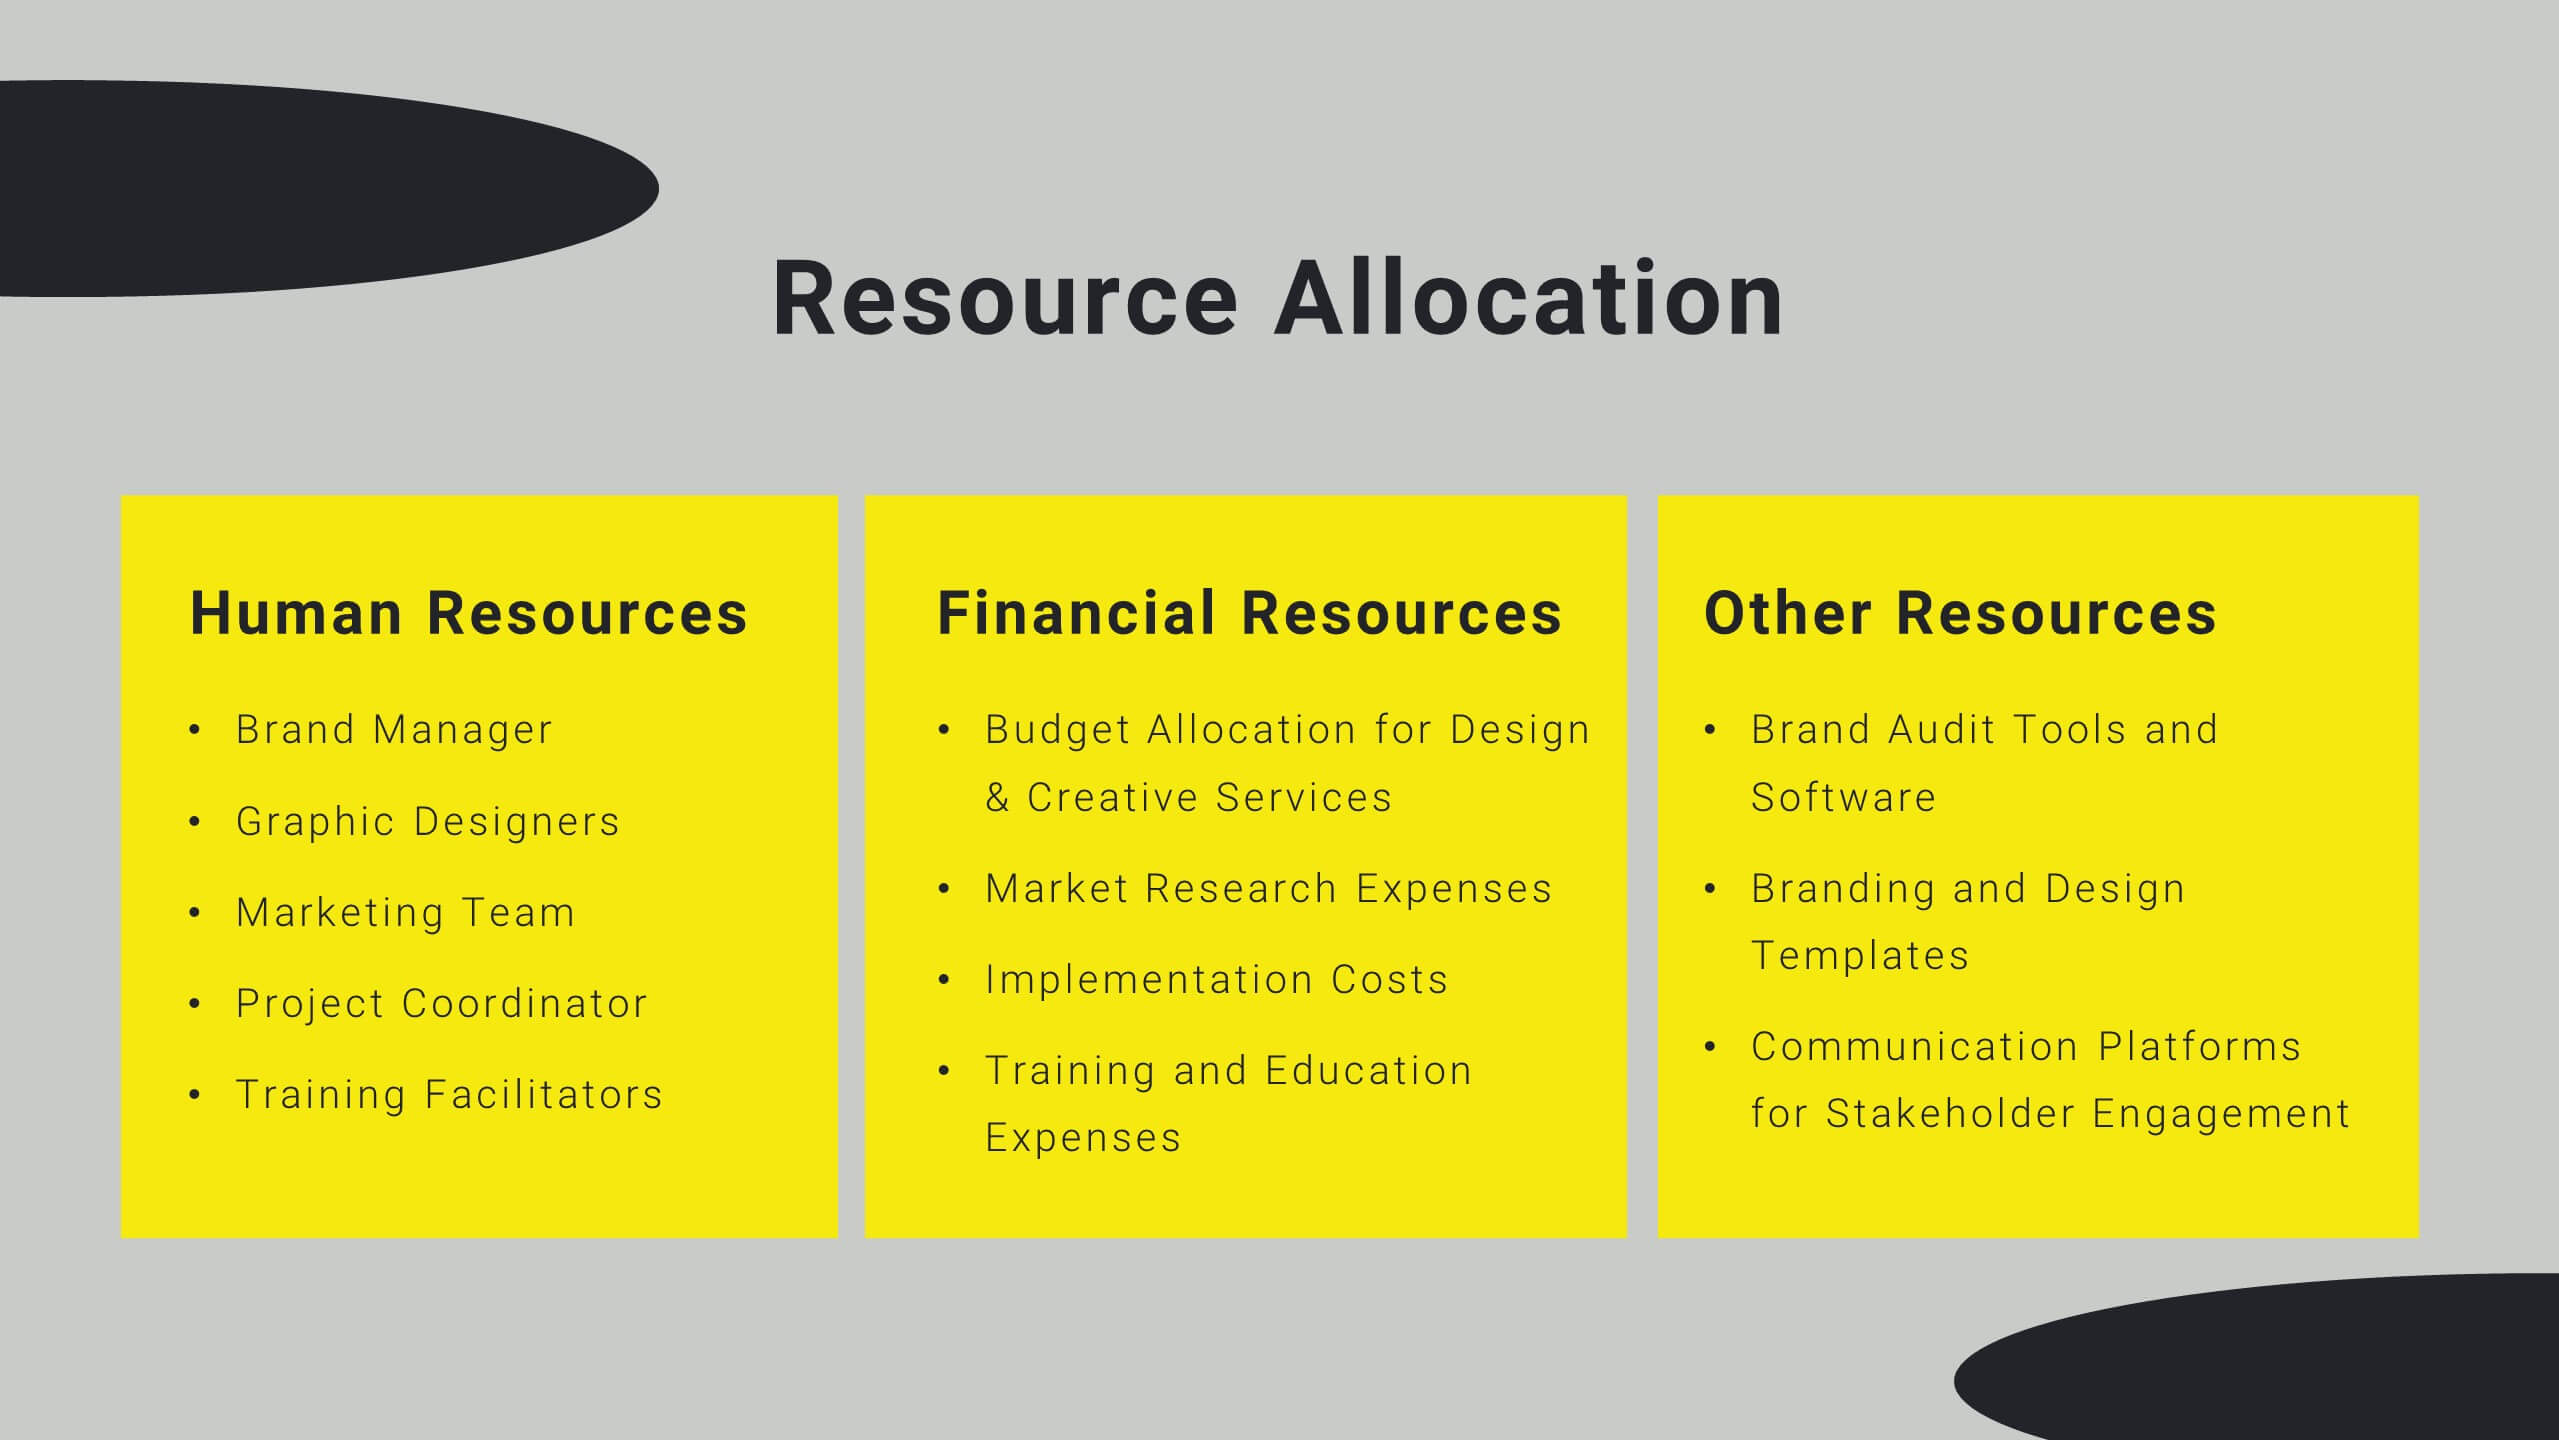
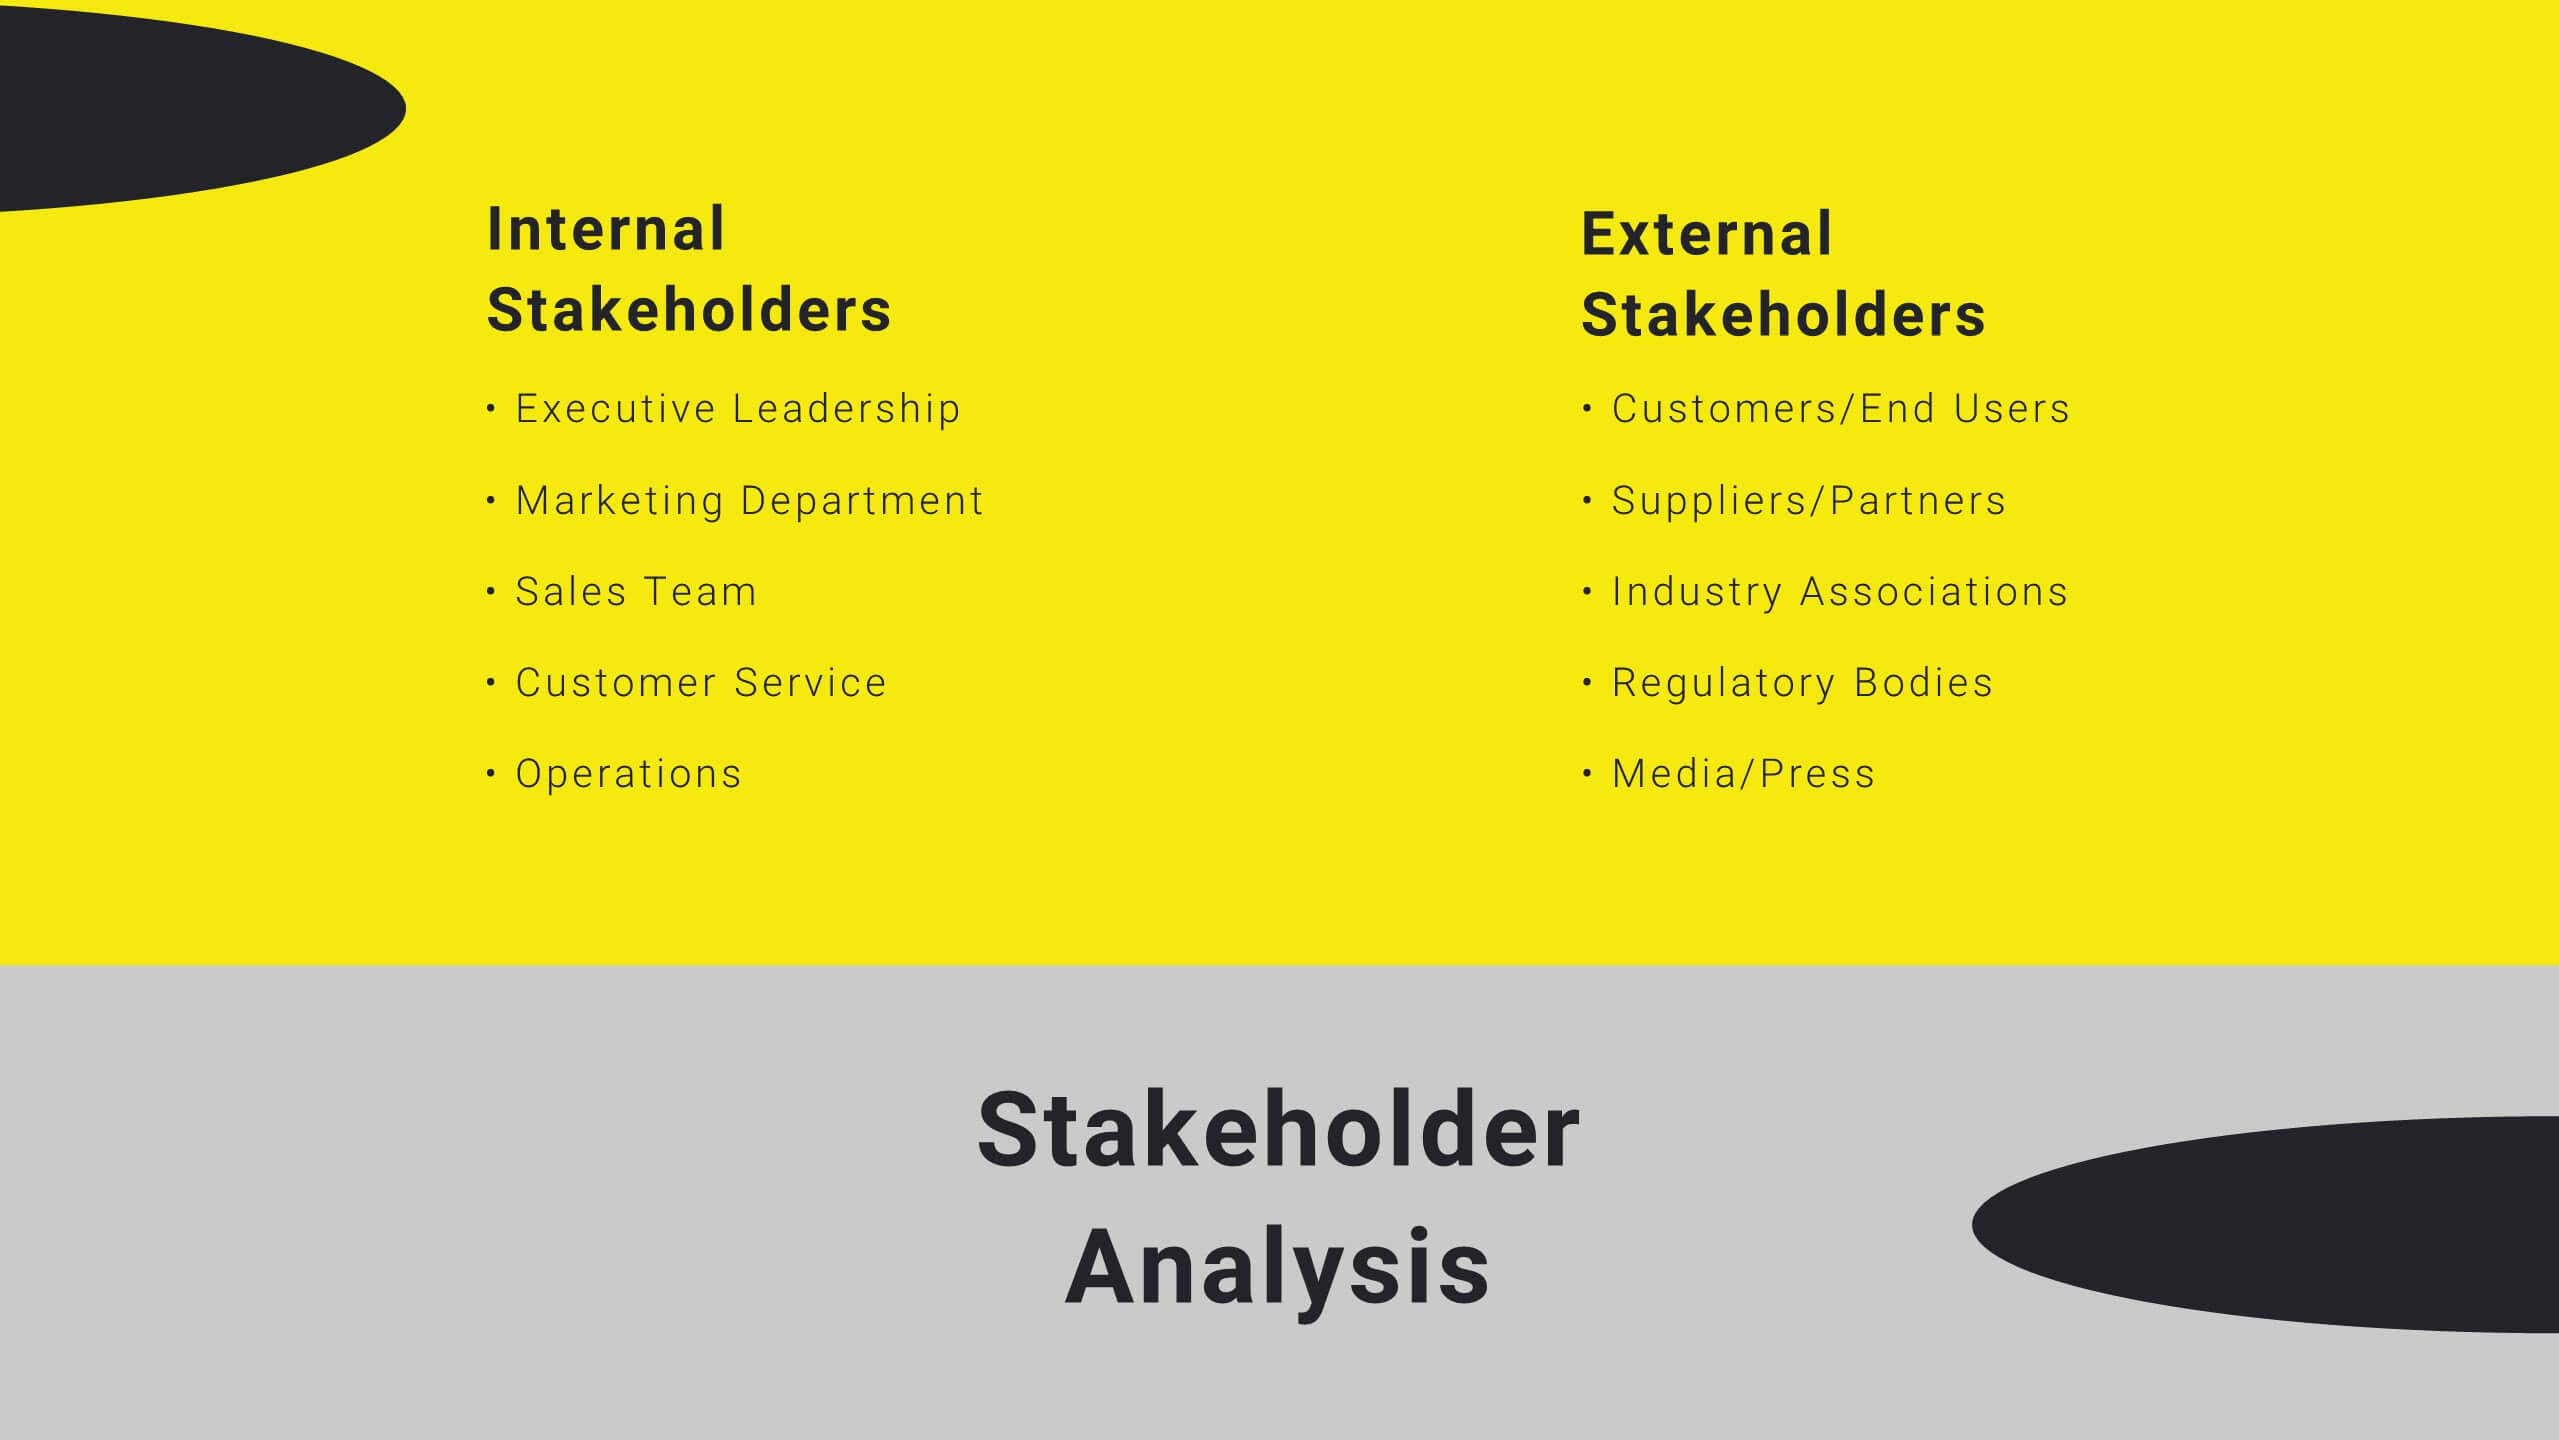
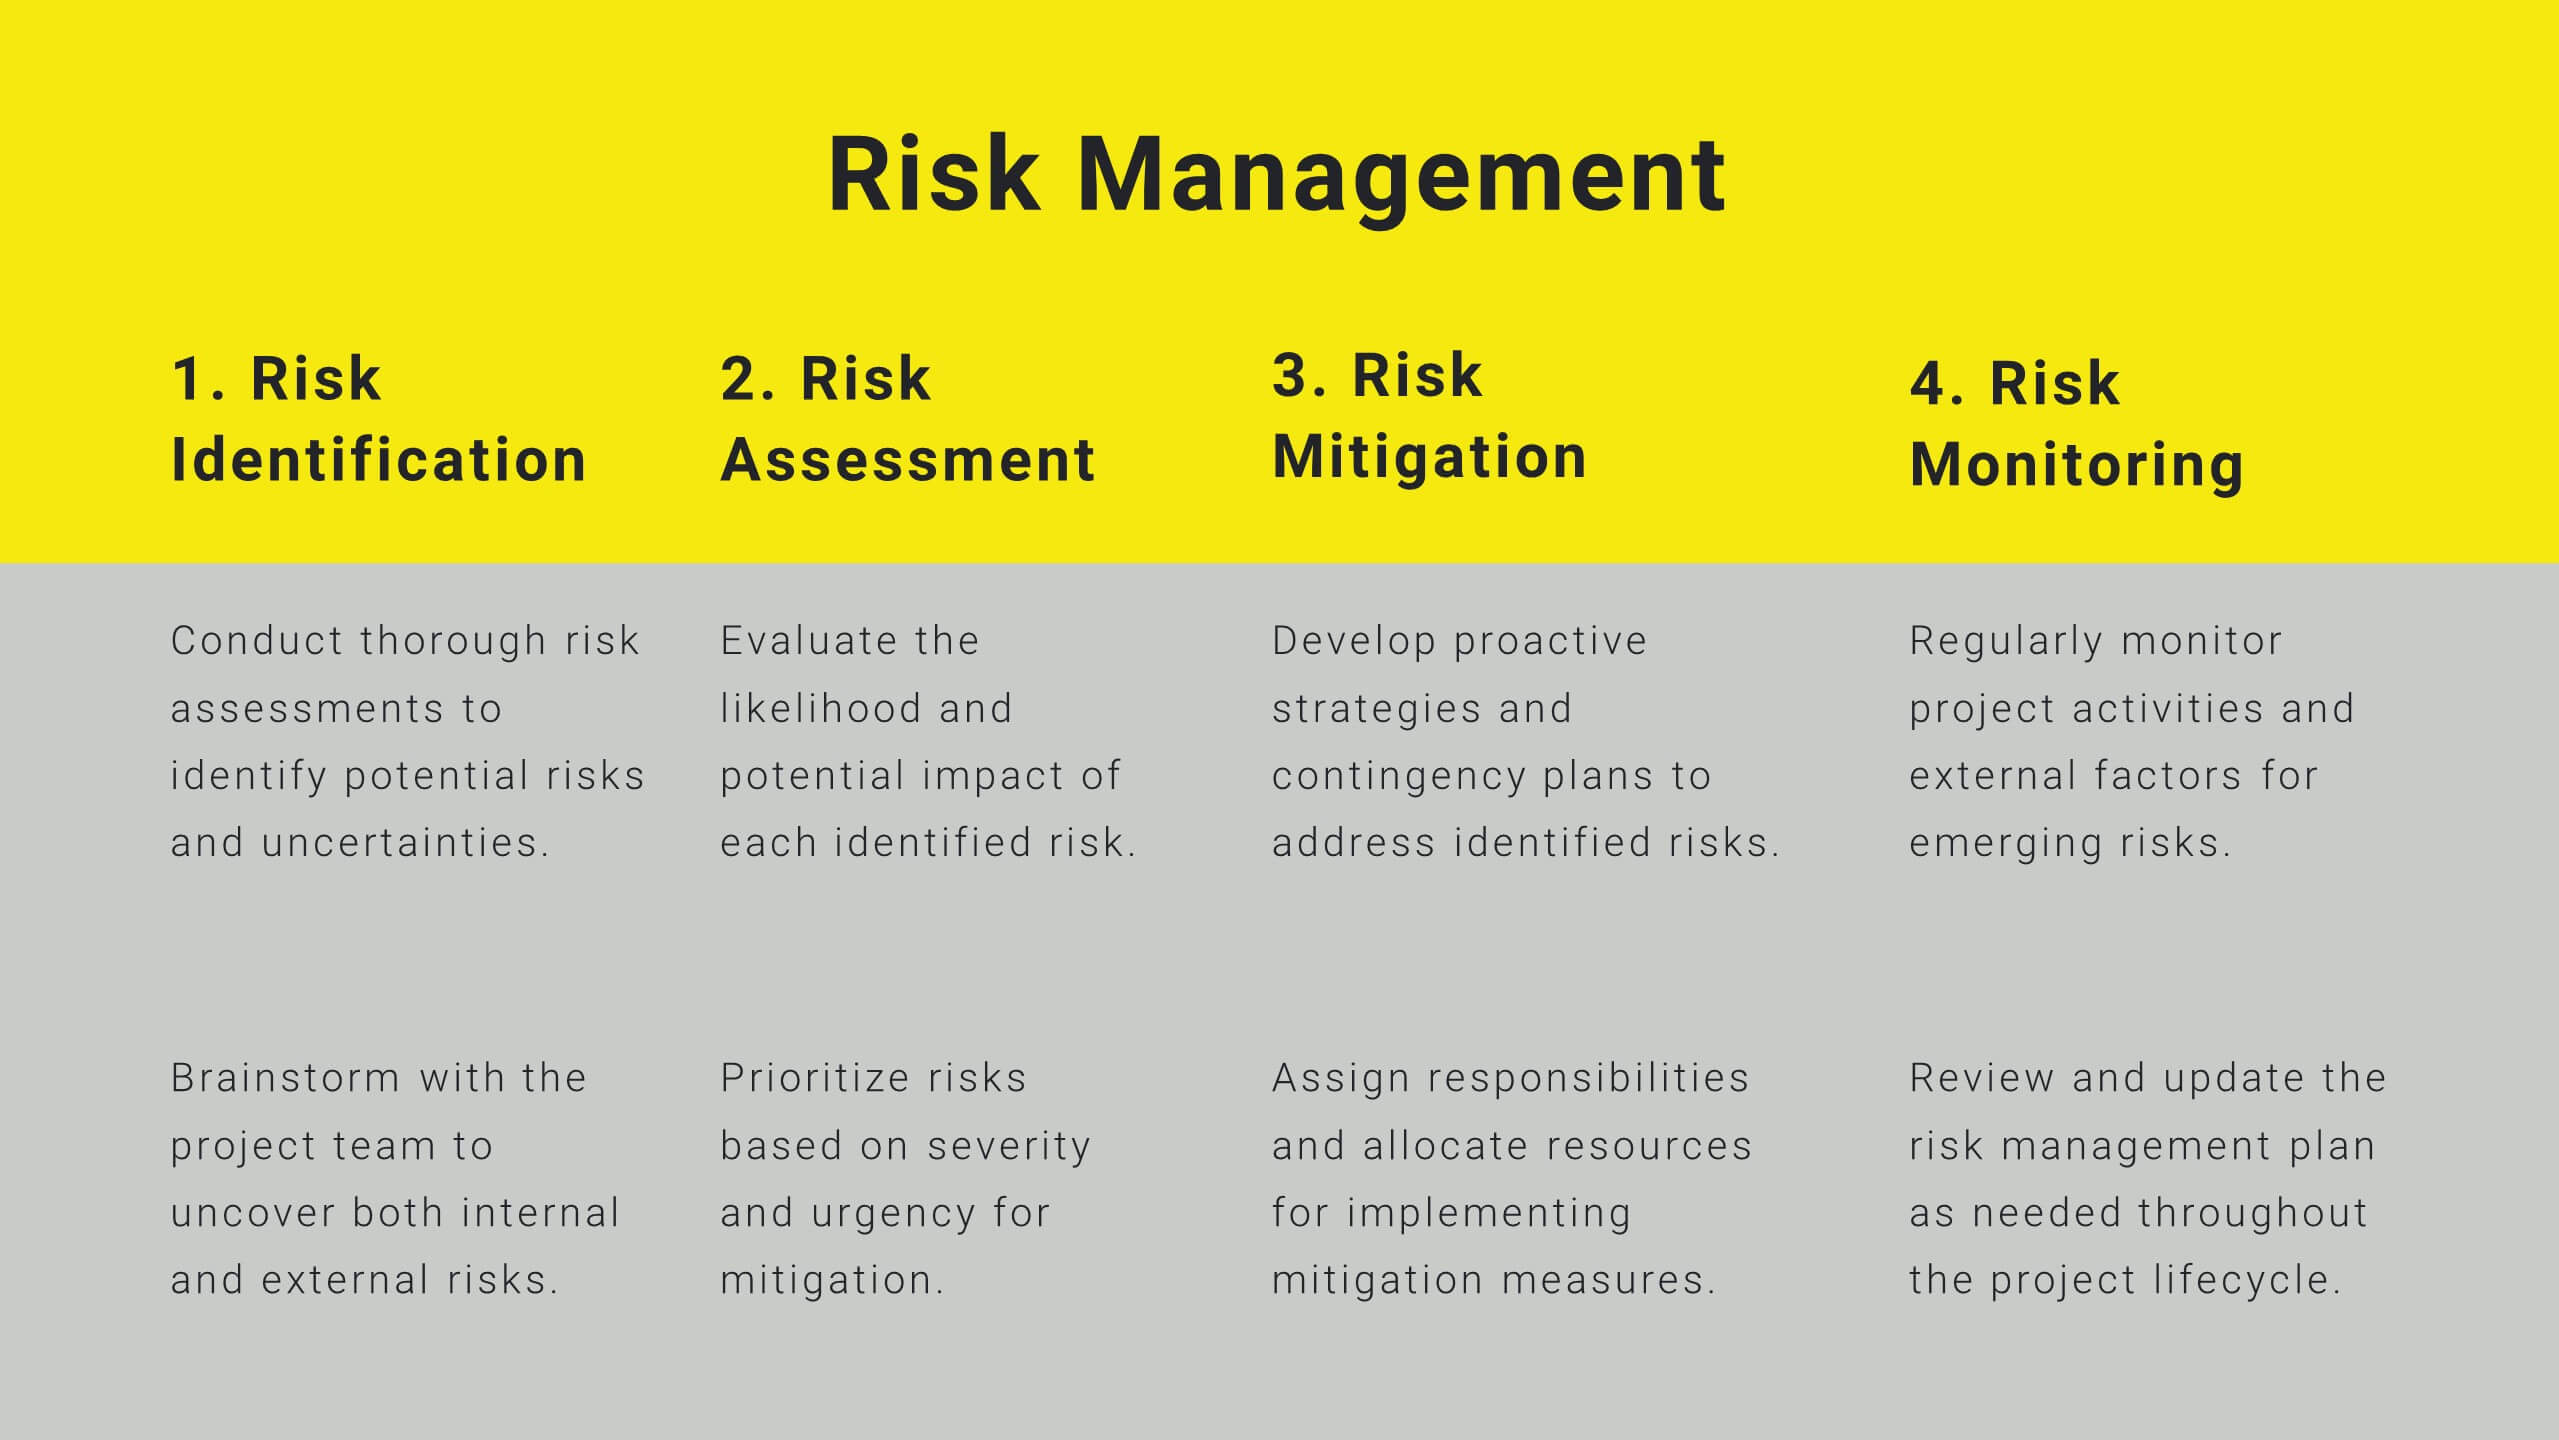
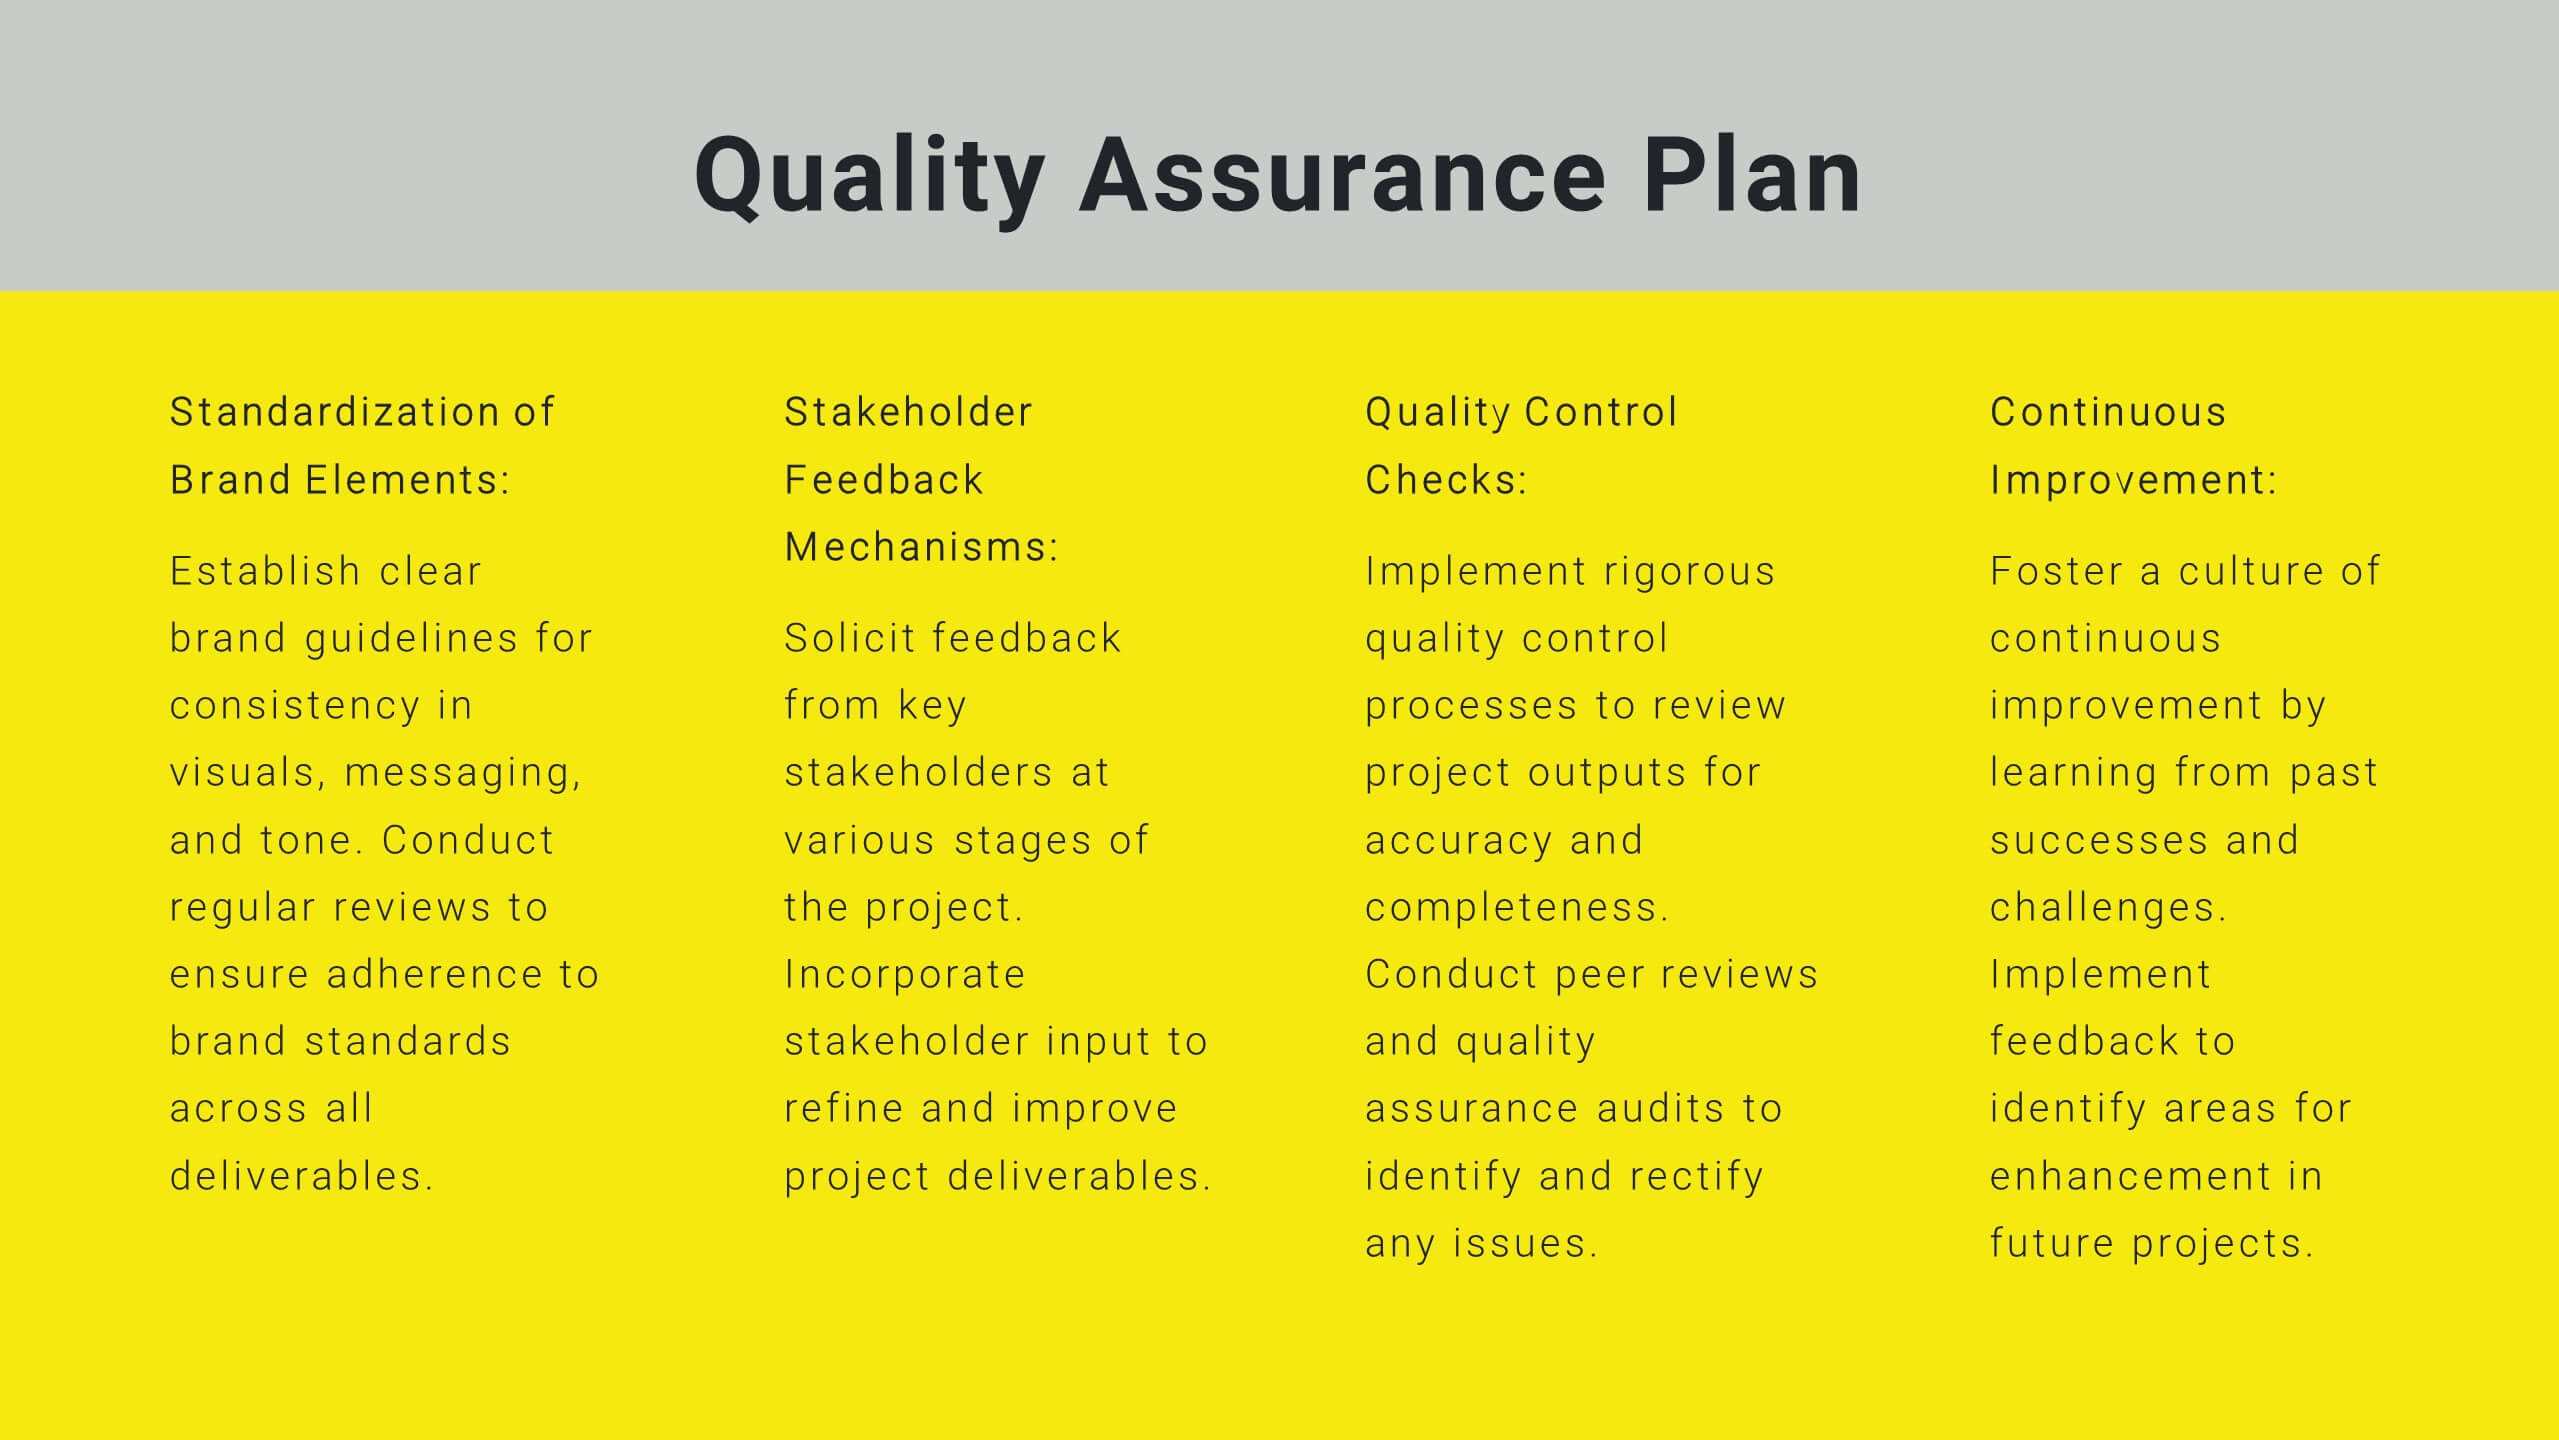
Sable Detailed Project Execution Plan Presentation
Master your project planning with this comprehensive execution plan template! Perfect for detailing project overviews, objectives, and timelines, it includes slides for budget breakdowns, resource allocation, and risk management. Ensure every detail is covered with structured content and clear visuals. Compatible with PowerPoint, Keynote, and Google Slides for seamless presentations on any platform.


5 diapositivas
Africa Country Borders Presentation
Bring geography to life with a clean, modern map design that highlights country boundaries and key regions across Africa. Perfect for showcasing regional data, market analysis, or project coverage, this layout ensures clarity and precision. Fully compatible with PowerPoint, Keynote, and Google Slides for easy customization and use.


5 diapositivas
Productivity and Time Optimization Presentation
Visualize time-saving strategies and workflow efficiency with this hourglass-themed productivity template. Ideal for illustrating phased progress, deadlines, or time distribution, this design breaks your message into four clear sections with engaging visuals. Fully editable in PowerPoint, Keynote, and Google Slides.


12 diapositivas
Leadership Development and Growth
Highlight leadership skills with this dynamic radar chart template, ideal for tracking individual or team competencies across six core areas. Use this layout to visualize progress in communication, strategy, vision, influence, adaptability, and accountability. Great for HR reviews, training evaluations, or performance dashboards. Fully editable in PowerPoint, Keynote, and Google Slides.


6 diapositivas
Sustainabilitiy Management Goals and Metrics Presentation
Make your sustainability story shine with a clean, modern presentation that highlights environmental goals, measurable results, and ongoing progress. Perfect for communicating corporate impact and performance data with clarity and purpose. Fully customizable and compatible with PowerPoint, Keynote, and Google Slides for a professional and visually engaging delivery.


7 diapositivas
Flow Chart Diagram Presentation
Flow charts are important because they provide a visual representation of a process or system, which helps to simplify complex information and make it easier to understand. Our Infographic flow charts are easy to use because they combine visual elements such as icons, and colors with concise text, making complex information more digestible and memorable. These highly adaptable flow charts are ideal due to their complete customizability, allowing for universal utilization to cater to the unique requirements of any individual. Do not waste any more precious time and get started right away.