


Características


¿Tienes alguna pregunta?
Recomendar


5 diapositivas
How Alcohol Affects The Body Infographics
The effects of alcohol can vary depending on factors such as the amount consumed, frequency of consumption, individual tolerance, and overall health. These infographic templates can be used as informative resources that illustrate the impact of alcohol on the human body. This template is designed to help educate and raise awareness about the physiological and health effects of alcohol consumption. Compatible with Powerpoint, Keynote, and Google Slides. With its visually appealing design, organized sections, and clear information, this template will help create awareness and promote responsible alcohol consumption practices.


7 diapositivas
RACI Matrix Infographic Presentation Template
A RACI Matrix Infographic is a visual representation of the RACI model, which is used to clarify roles and responsibilities in an organization. The RACI model stands for Responsible, Accountable, Consulted, and Informed, and is a framework for defining the relationships between individuals and tasks in a project. This infographic displays a visual representation of the RACI matrix, showing the roles and responsibilities of each topic in a clear and organized manner. This Infographic can serve as a useful tool for managers and teams, as it can help to ensure clear communication and organization.


2 diapositivas
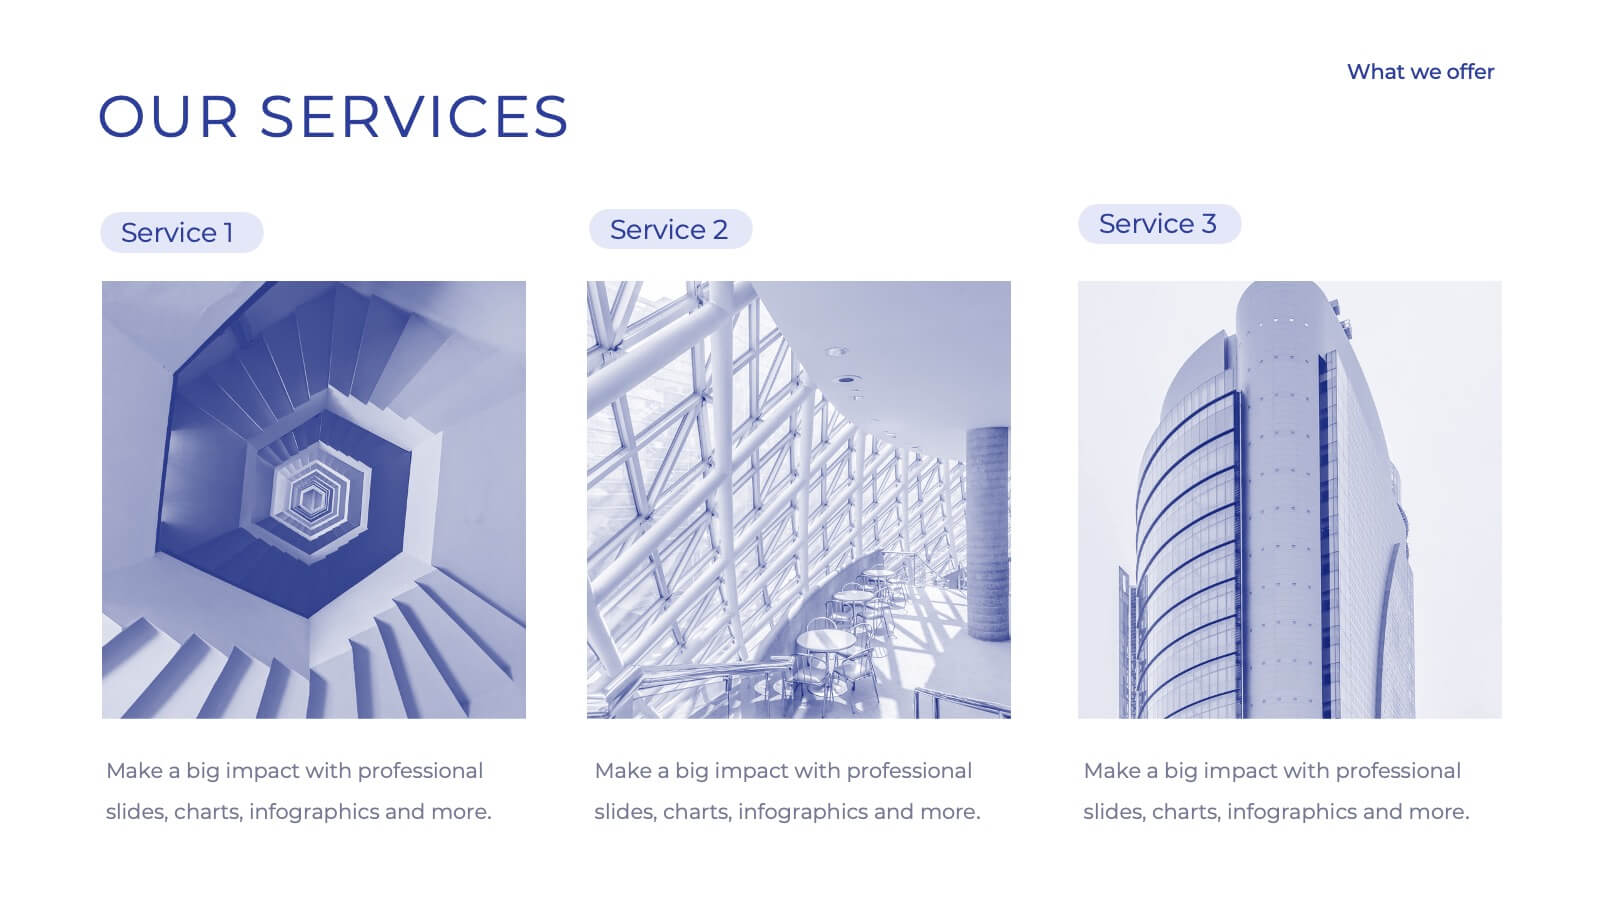
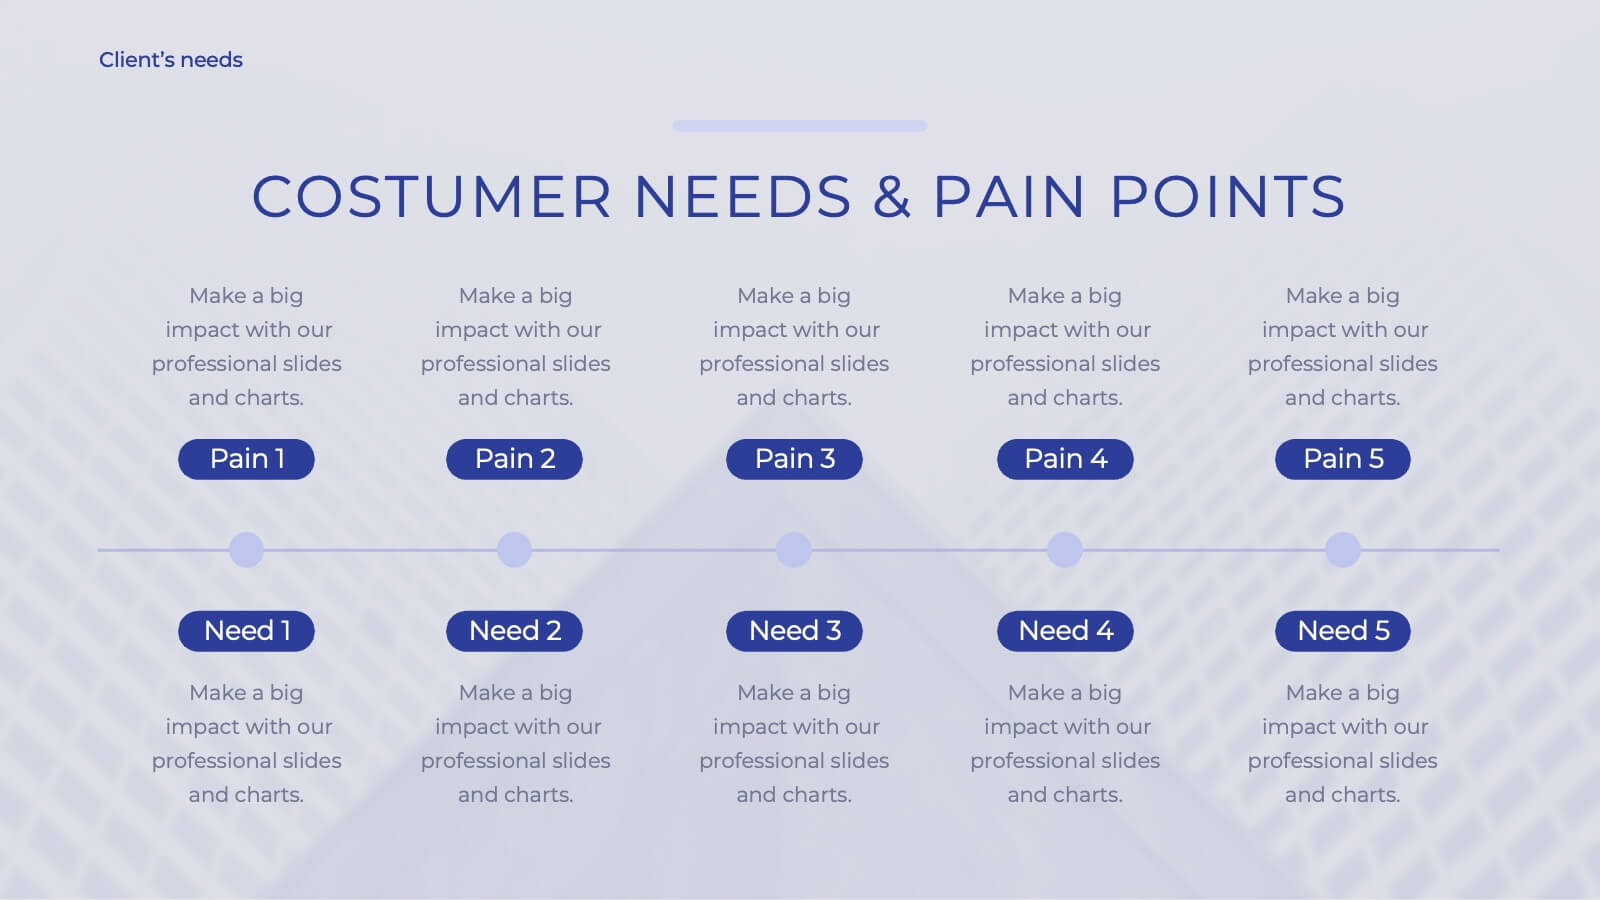
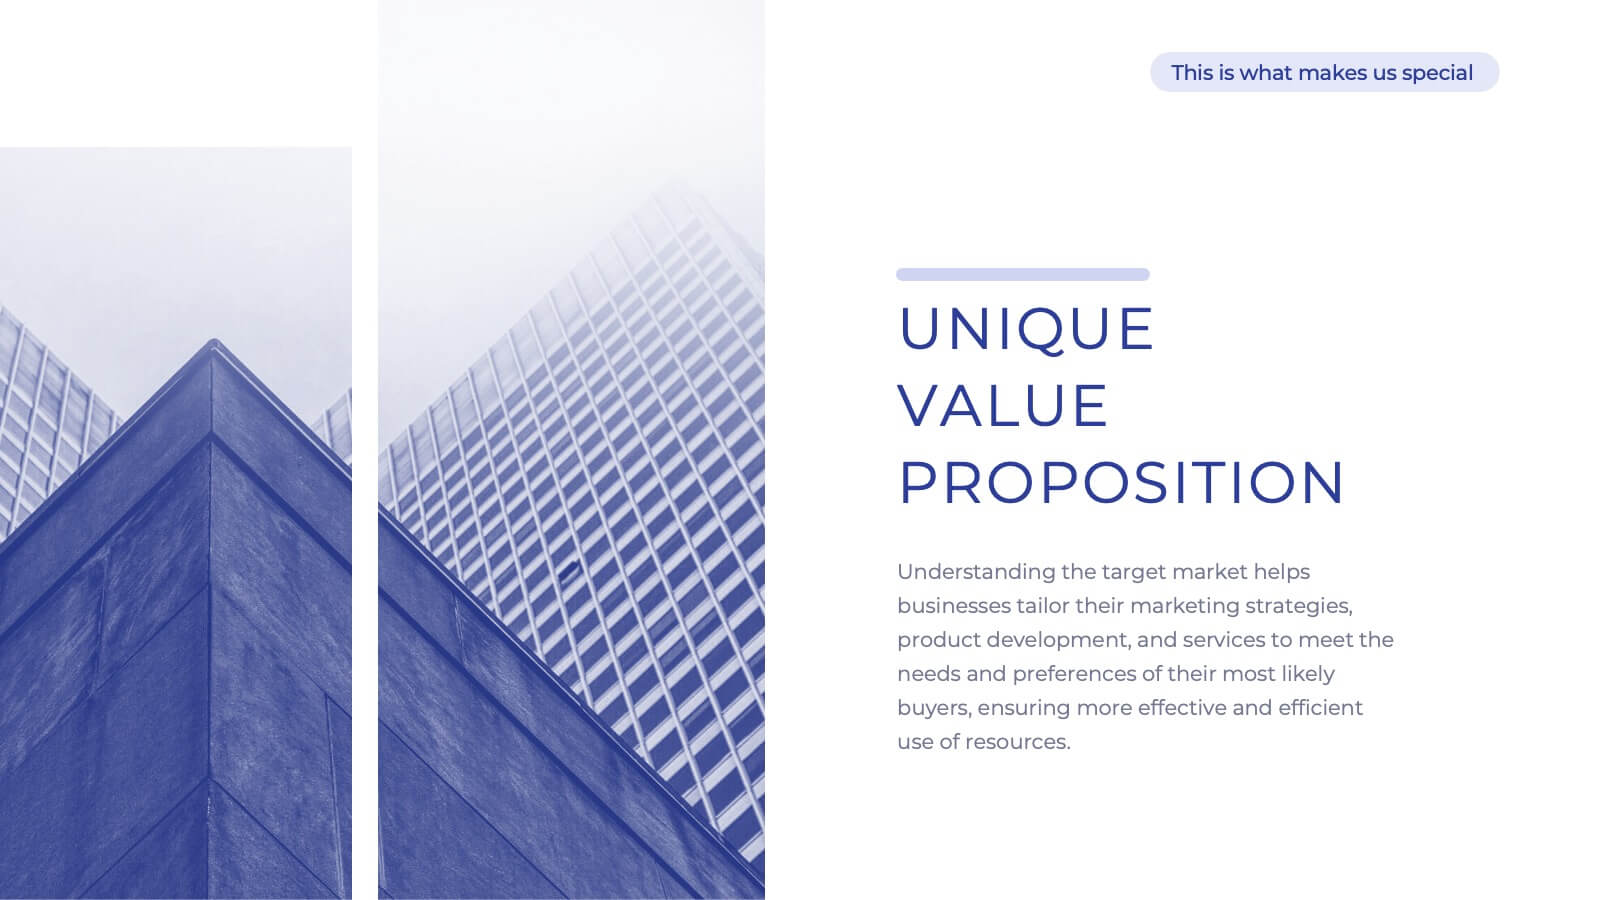
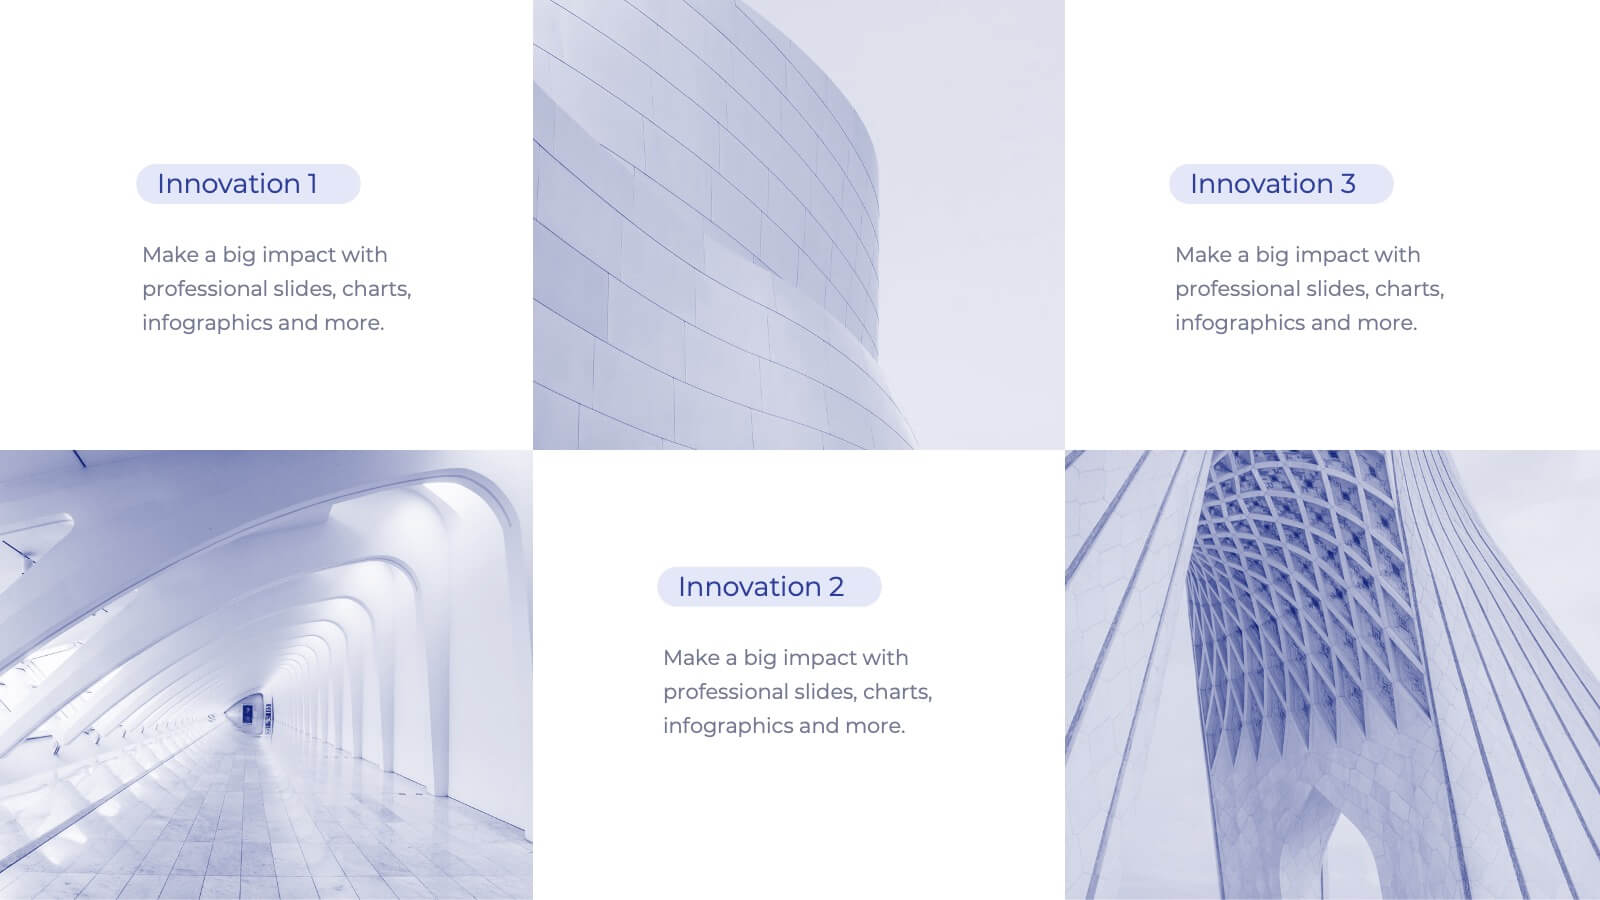
Client-Oriented Project Proposal Deck Presentation
Deliver polished, persuasive proposals with the Client-Oriented Project Proposal Deck Presentation. Designed to balance visual appeal and clarity, this layout is perfect for consultants, agencies, or freelancers presenting solutions to clients. Includes space for project overviews, photos, and key value points. Fully editable in PowerPoint, Keynote, and Google Slides.


5 diapositivas
Technology Trends Infographics
Navigate the forefront of innovation with our technology trends infographics. This template, designed in a spectrum of futuristic blue, vibrant pink, and a cascade of colors, embodies the essence of cutting-edge developments. Its creative vertical style is a nod to the rapid, trajectory of tech advancements, ideal for entrepreneurs, and analysts. It comes equipped with sleek graphics, icons, and image placeholders, all structured to distill complex trends. Whether you're illustrating tech landscapes or forecasting the digital future, this template is a quintessential asset for artistically communicating the pulse of technology's ever-evolving realm.


7 diapositivas
Blue Ocean Diagram Presentation
The Blue Ocean Strategy goal is to create a market space that is untapped, and in doing so, break away from the competition, create new demand, and increase profits. This template is designed for use in Powerpoint, Keynote, and Google Slides, and is perfect for anyone looking to create an informative and engaging presentation on this topic. This template is a useful tool for professionals and students. It provides informative illustration and information about the Blue Ocean Strategy to help you visually present your research, build a strategy or deliver a presentation on blue ocean strategies.


20 diapositivas
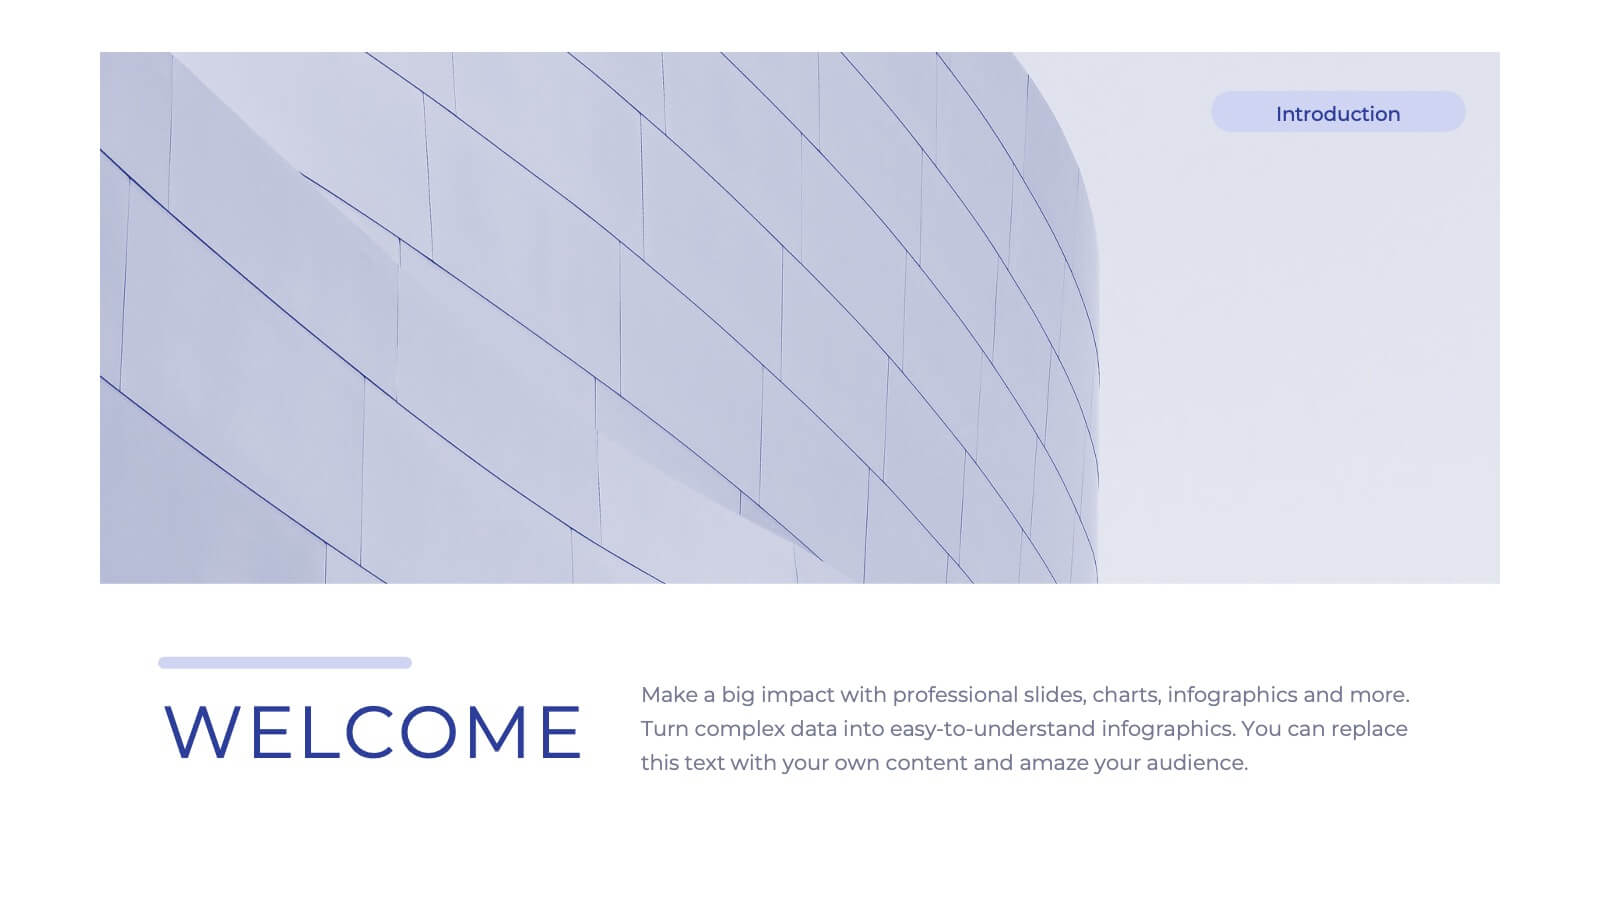
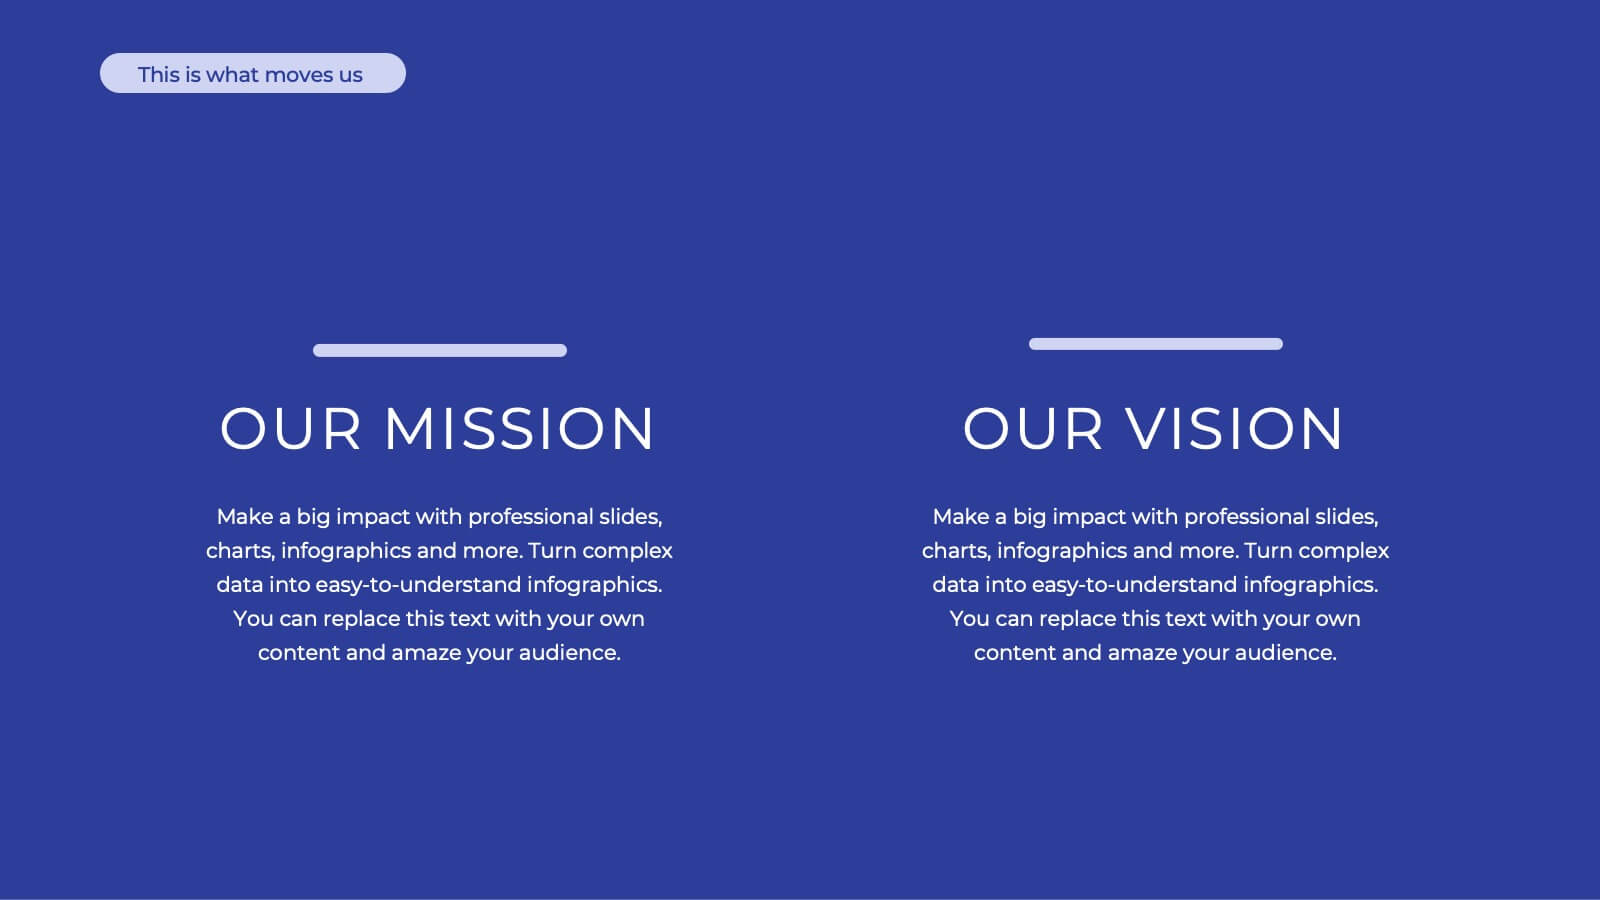
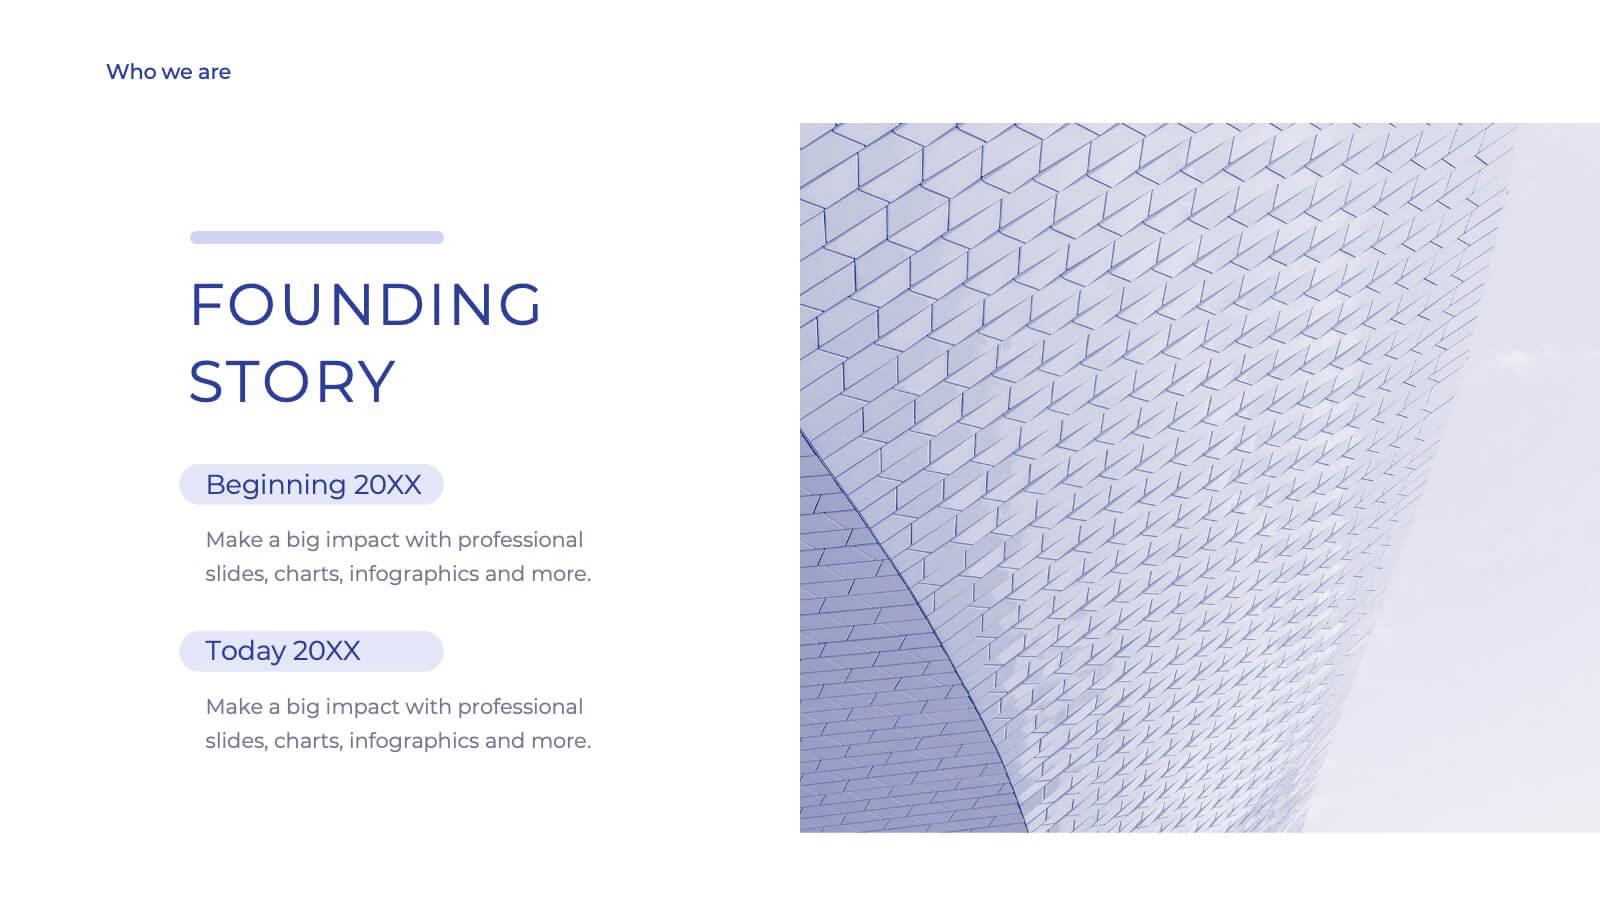
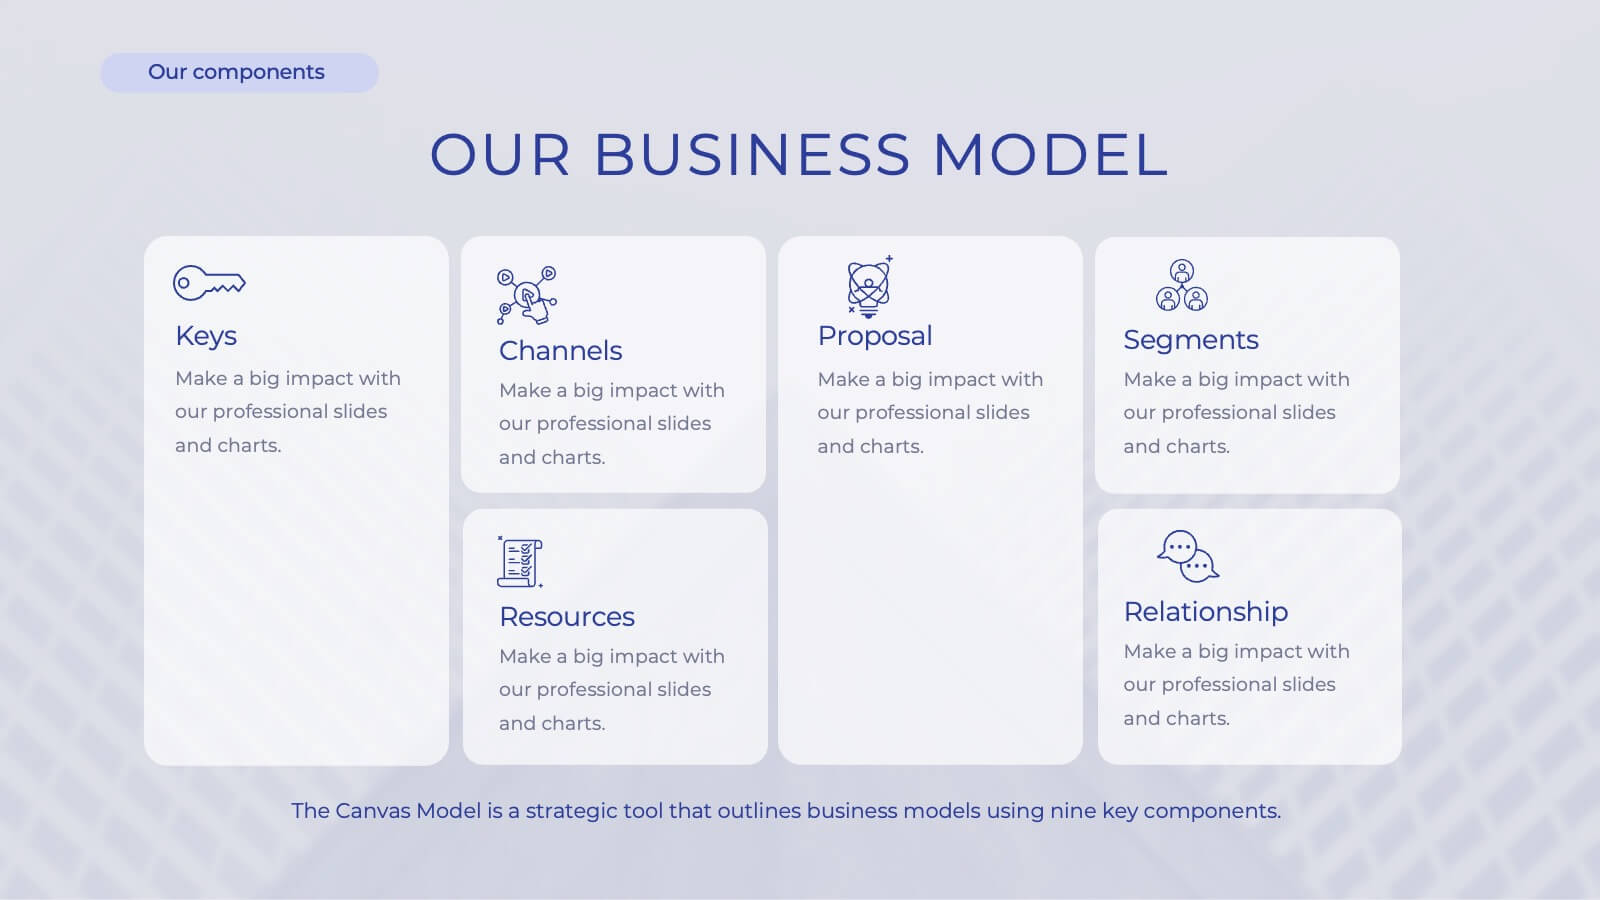
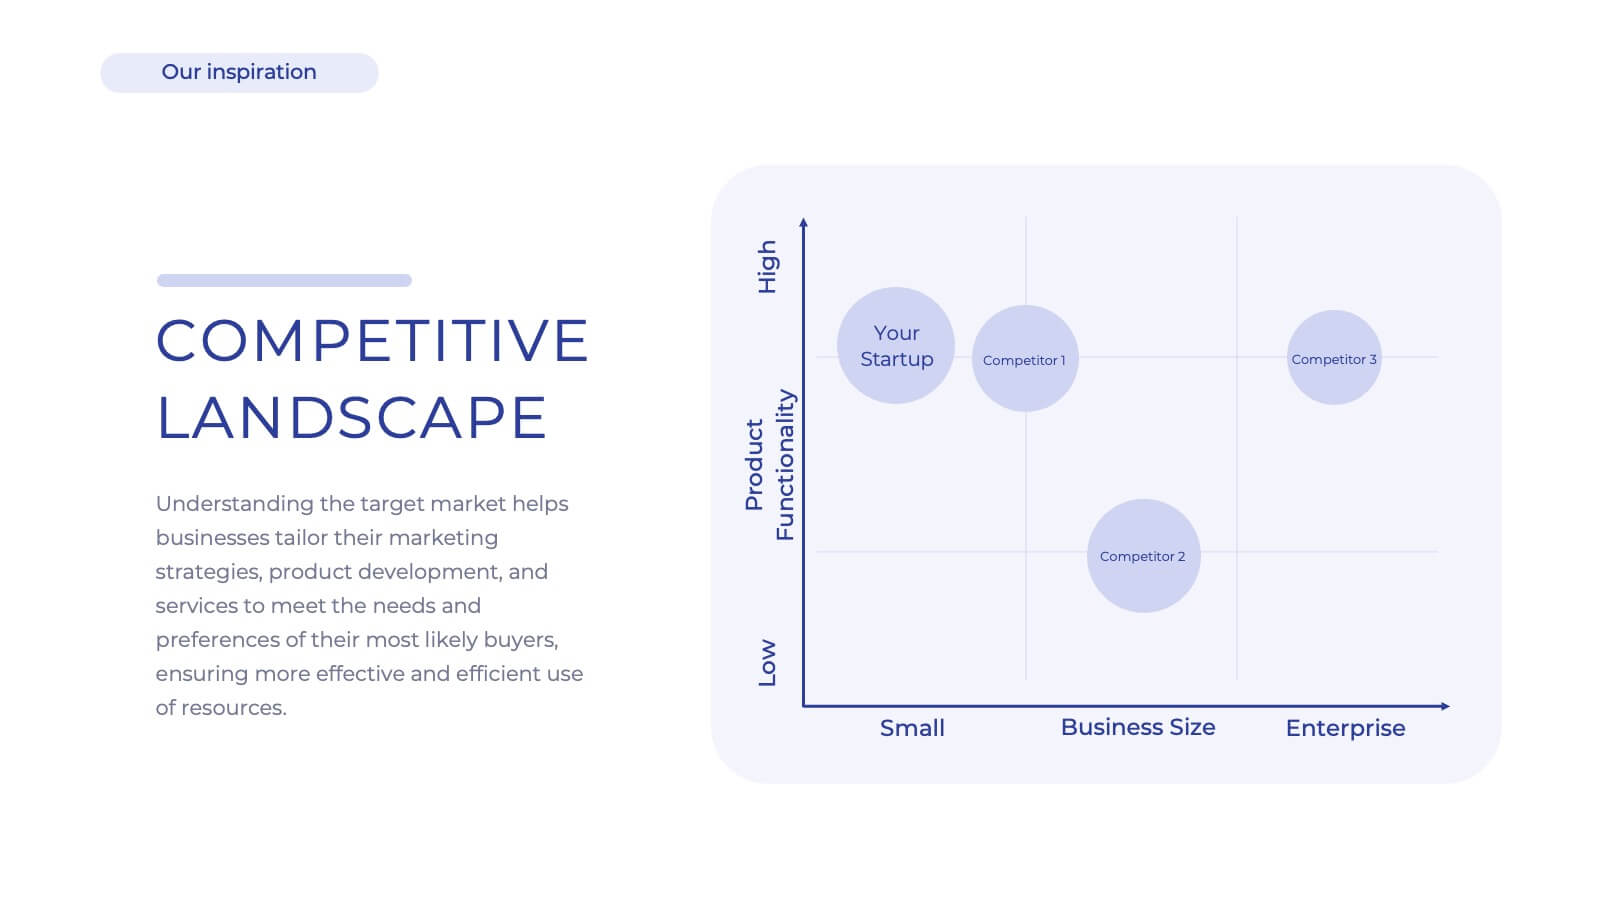
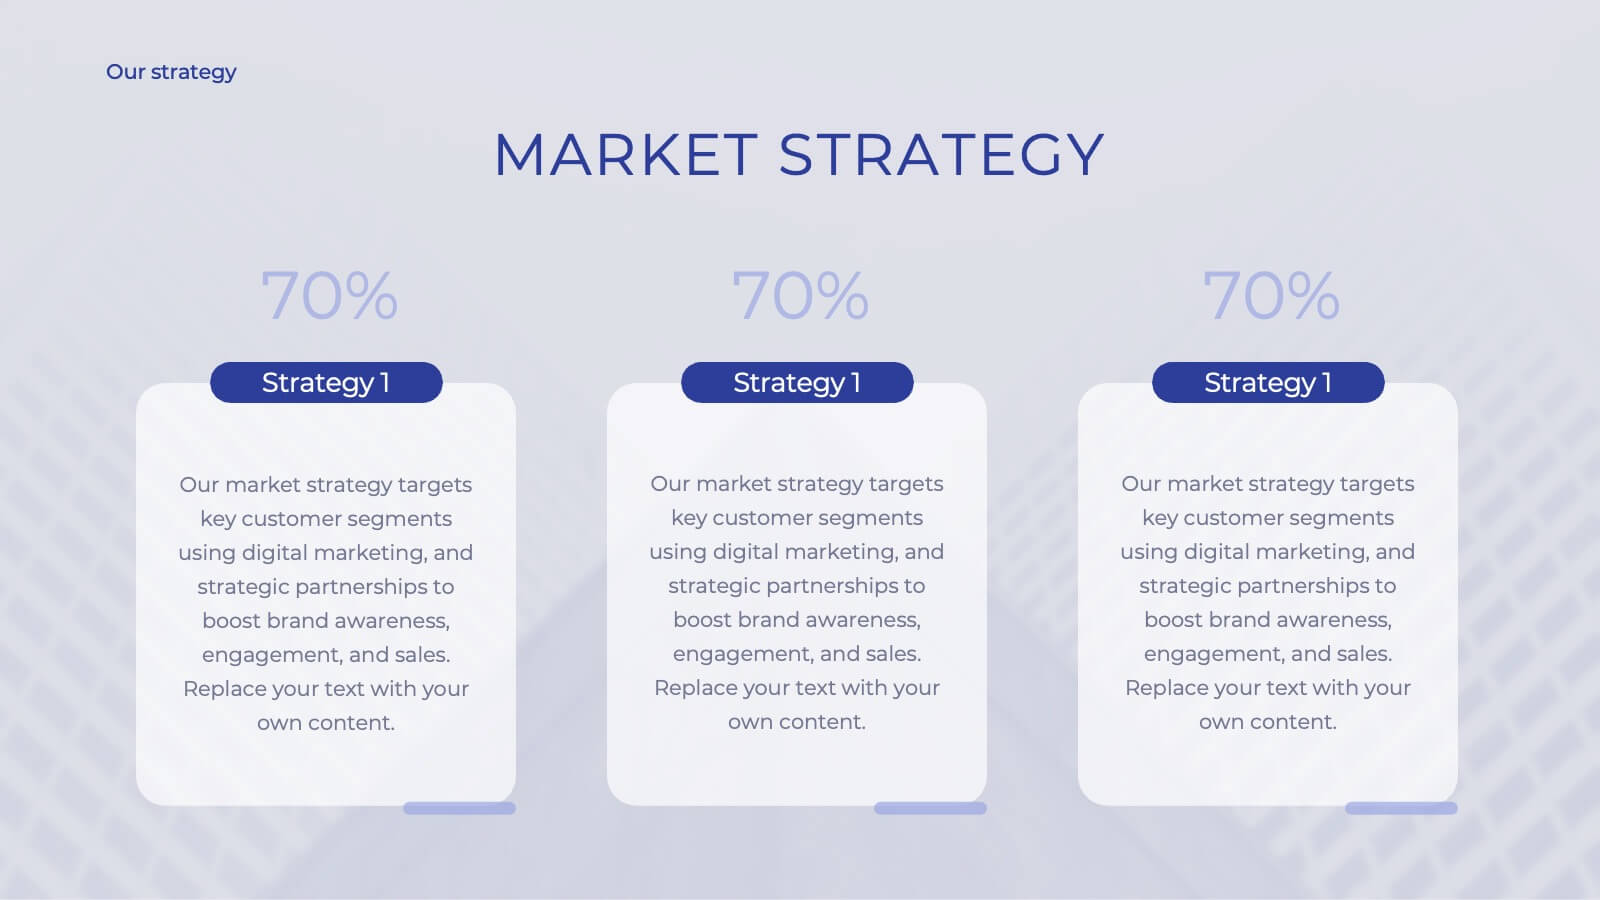
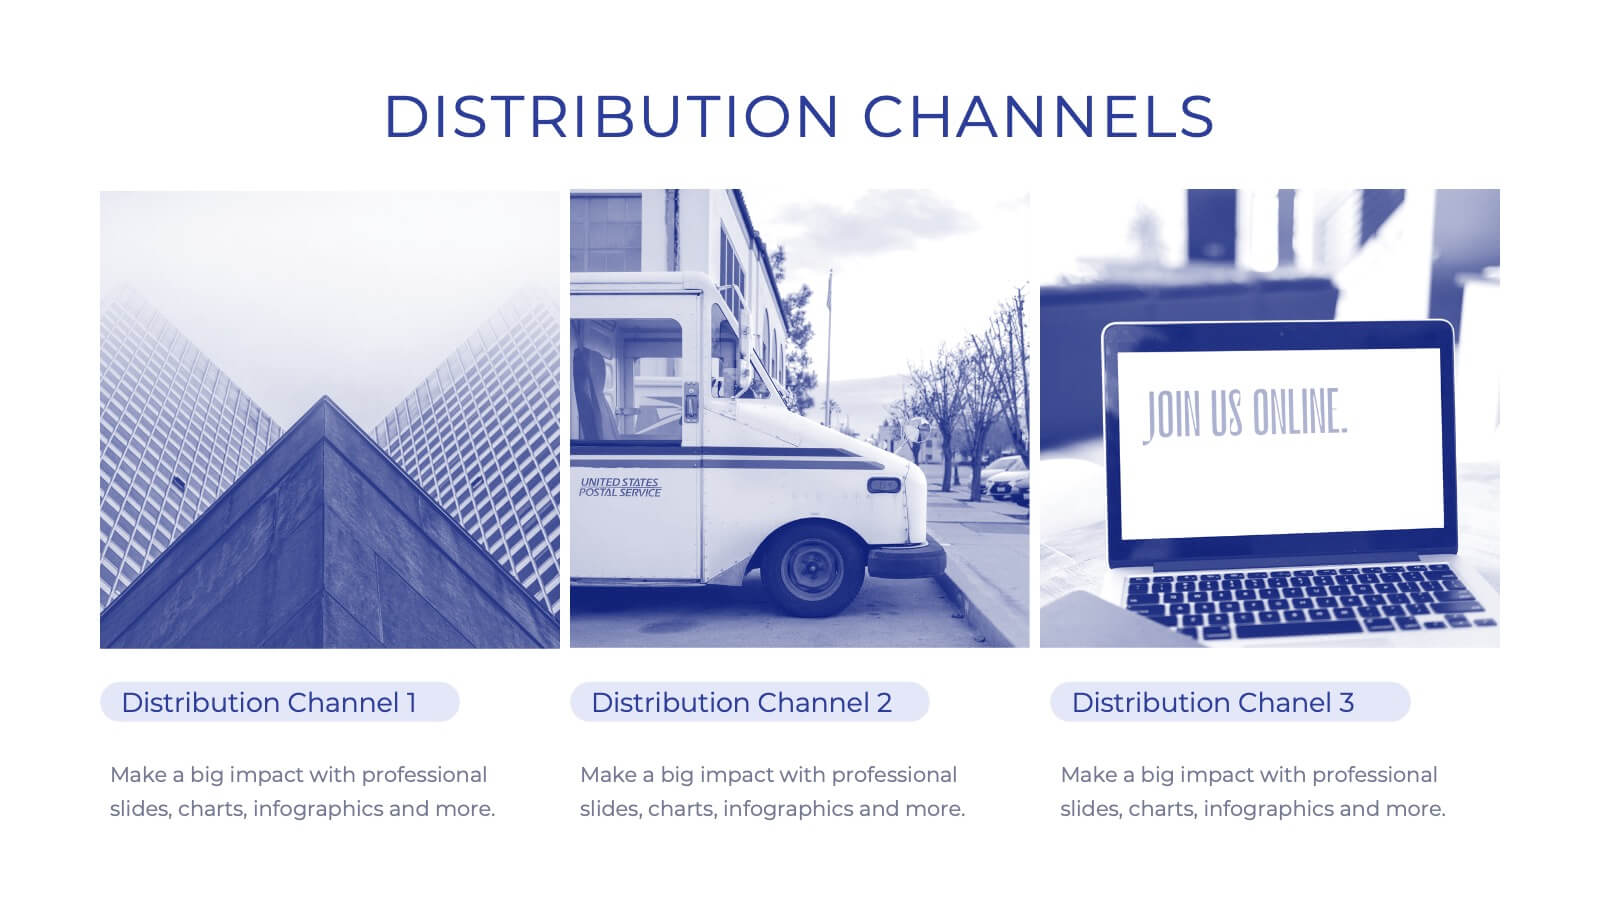
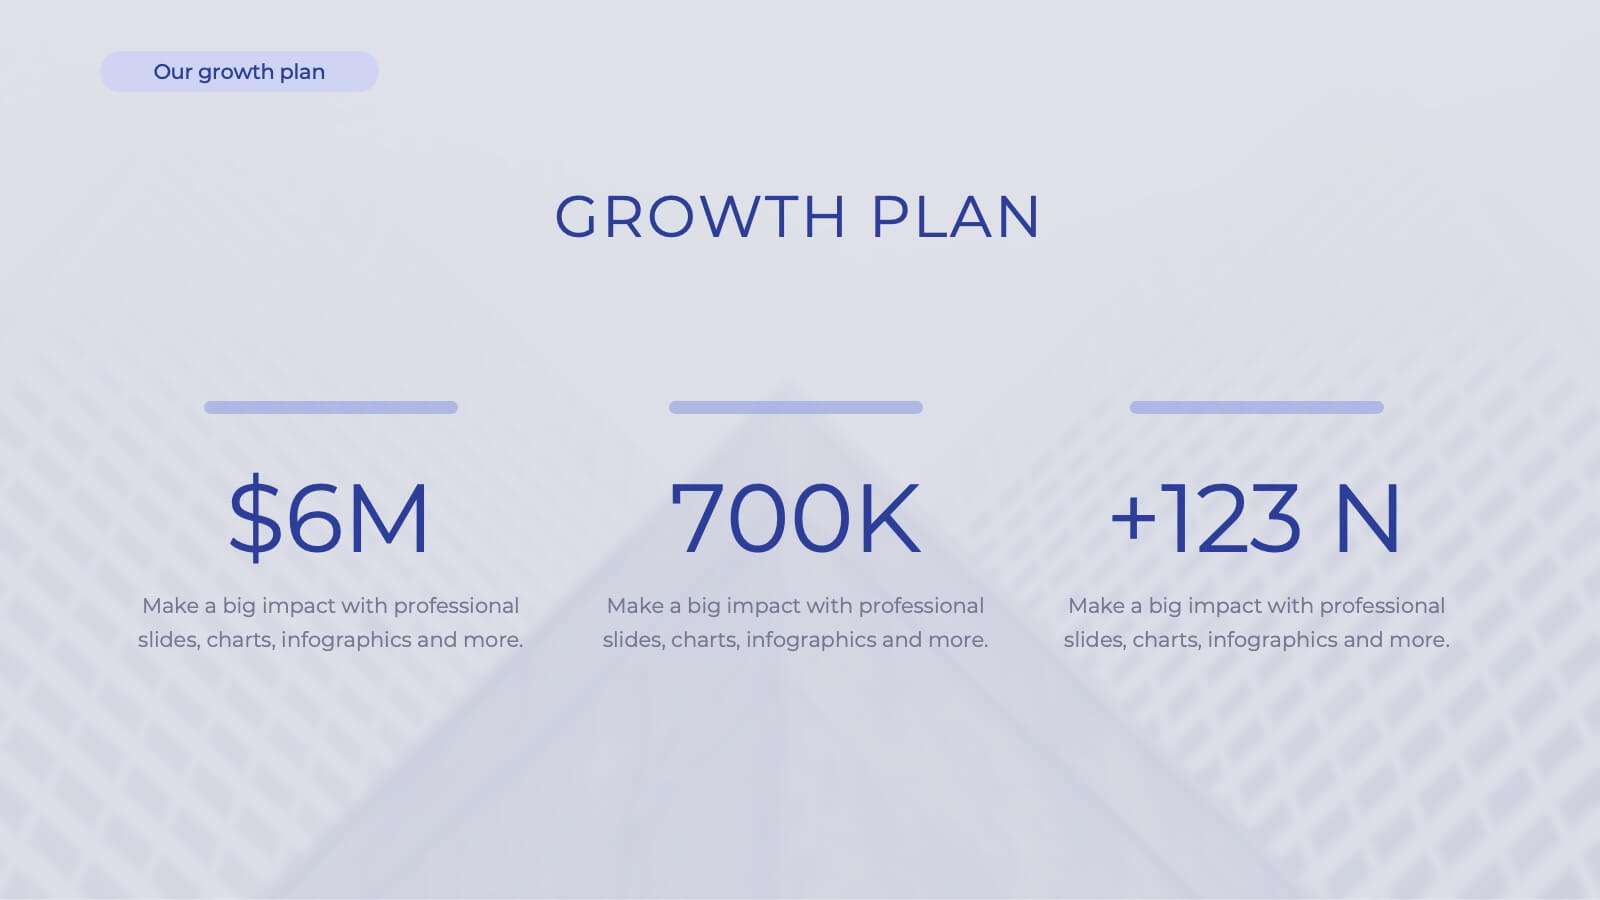
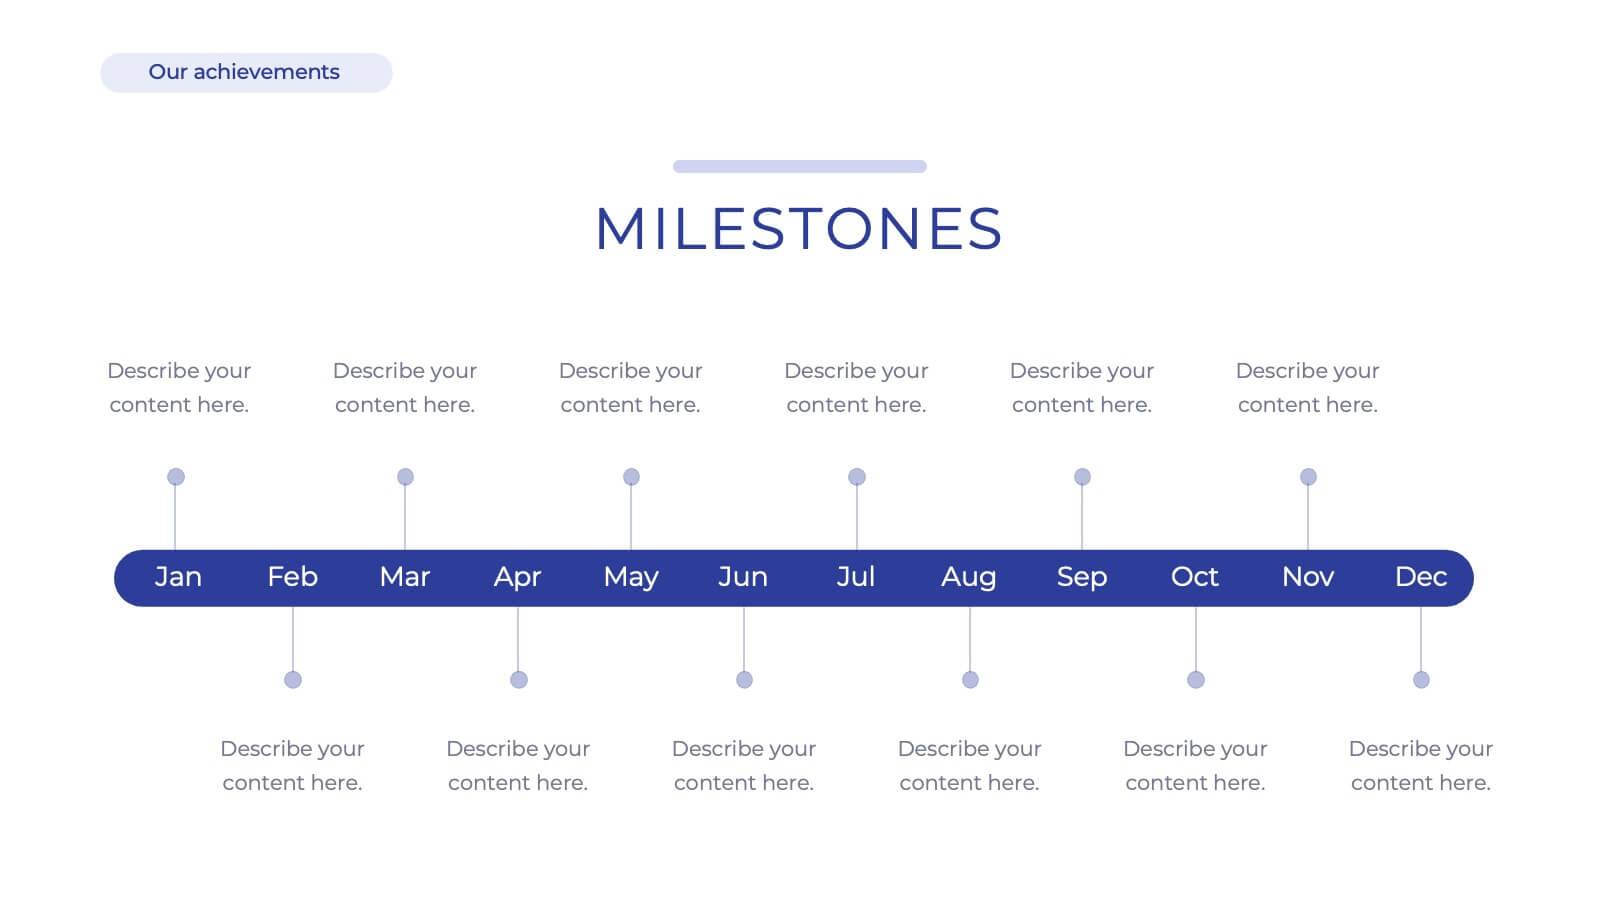
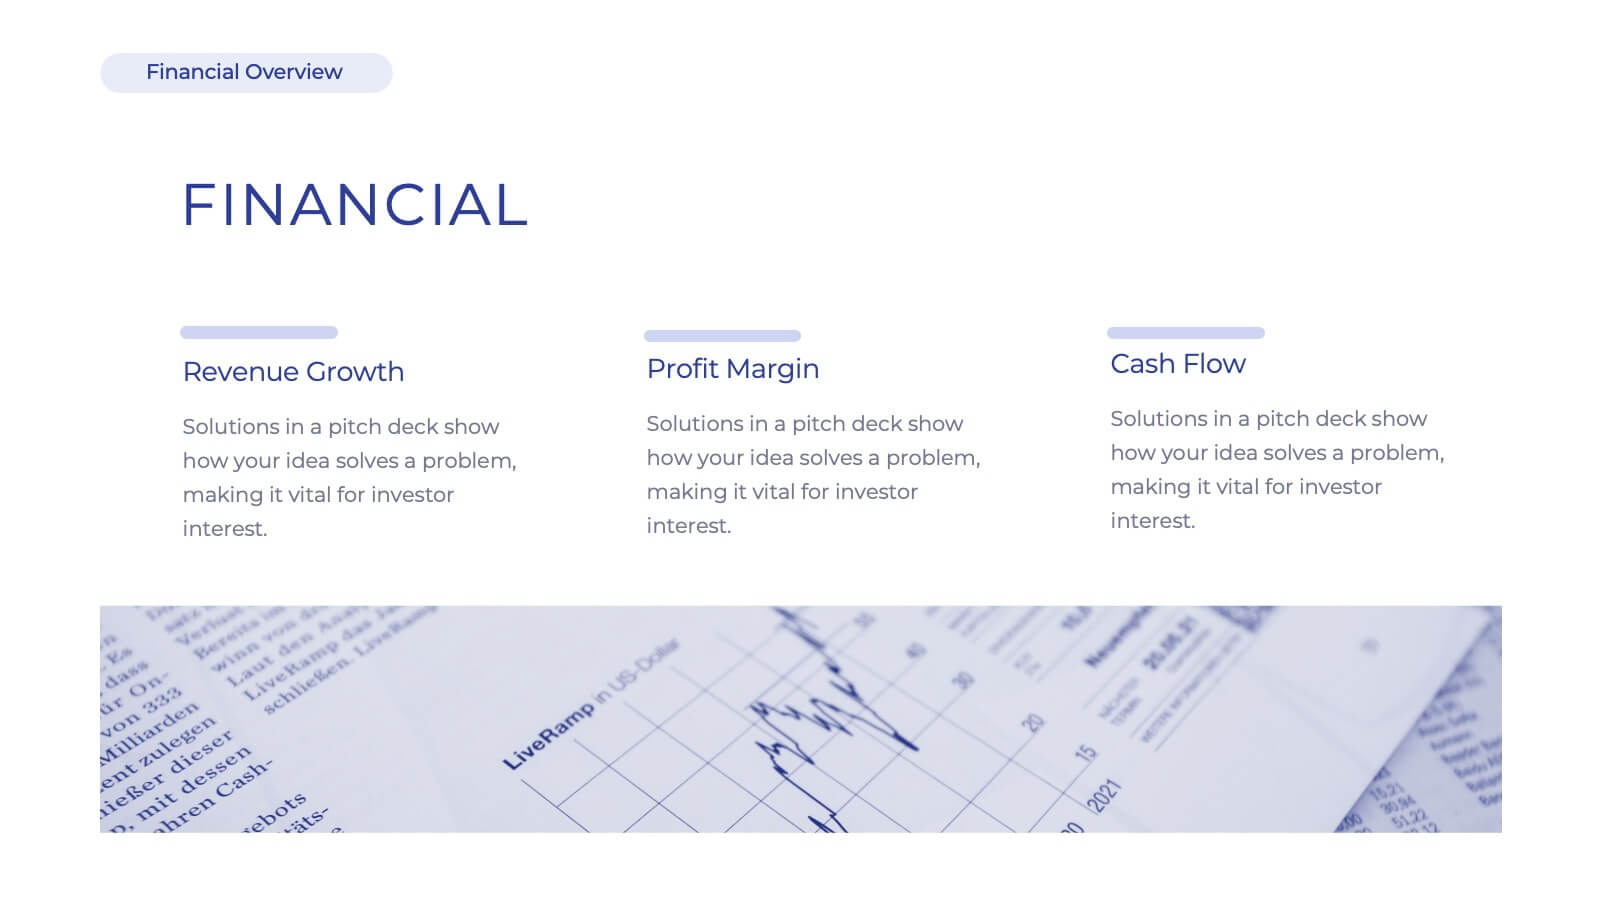
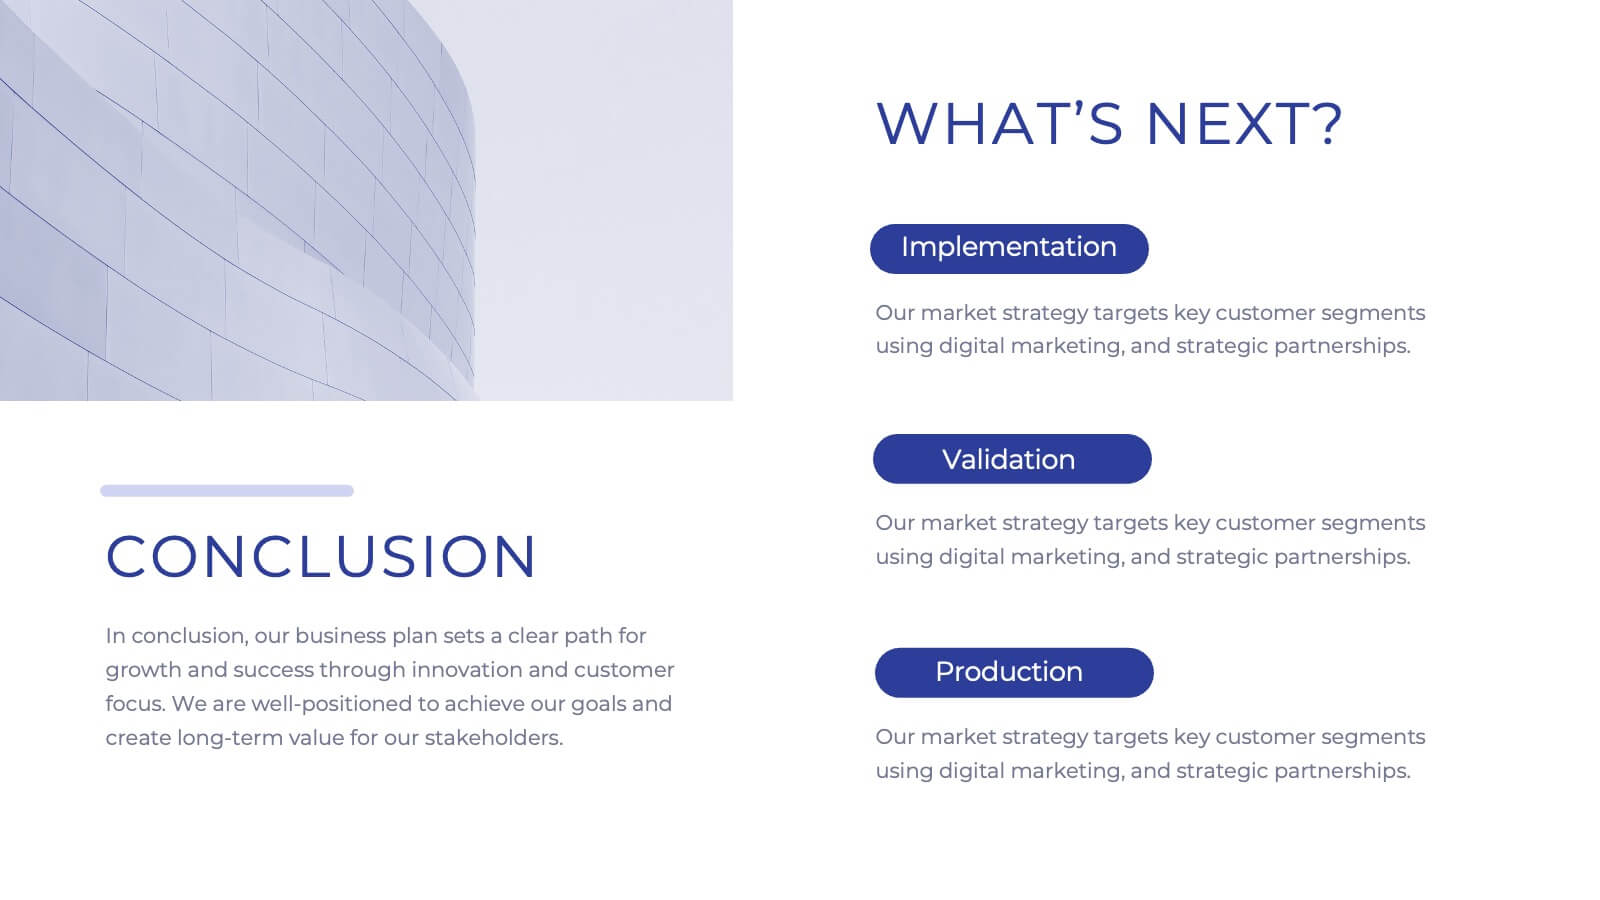
Iconic Startup Business Plan Presentation
Introducing our comprehensive corporate business plan template! Perfect for showcasing your company’s mission, vision, and services. Highlight your market strategy, competitive landscape, and growth plan in a professional design. Ideal for executives and entrepreneurs. Compatible with PowerPoint, Keynote, and Google Slides.


5 diapositivas
Stakeholder Expectations and Influence Matrix Presentation
Visualize your stakeholder dynamics with the Stakeholder Expectations and Influence Matrix Presentation. This slide uses a four-quadrant model—Monitor, Keep Informed, Keep Satisfied, Manage Closely—to map influence versus interest. Perfect for strategic planning, stakeholder communication, and project alignment. Editable in PowerPoint, Keynote, and Google Slides.


7 diapositivas
7 Elements of McKinsey Framework Presentation
Turn complex organizational elements into a simple, story-driven visual with a clean layout that highlights how each component connects back to core values. This presentation helps you explain relationships, improve alignment, and support strategic decision-making with clarity and ease. Fully editable and compatible with PowerPoint, Keynote, and Google Slides.


6 diapositivas
Personal SWOT Development Presentation
Highlight personal growth with this clean and structured Personal SWOT Development layout. Ideal for coaching, career planning, or self-assessment, it clearly separates strengths, weaknesses, opportunities, and threats. Easy to customize in PowerPoint, Keynote, or Google Slides—perfect for visualizing goals and building strategic self-awareness in a professional format.


6 diapositivas
Year-End Company Report Overview Presentation
Summarize your annual results with this modern year-end report slide. Designed to showcase KPIs, growth stats, and financial outcomes, it features clean icons and a clear six-section layout. Ideal for performance reviews or stakeholder updates. Fully editable and compatible with PowerPoint, Keynote, and Google Slides for quick customization.


7 diapositivas
Technology Consulting Infographic
Technology consulting, also known as IT consulting or tech consulting, involves providing expert advice and guidance to organizations regarding their technology strategy, utilization, and optimization. This infographic template provides a compelling way to illustrate complex concepts, strategies, and data related to technology consulting. Fully customizable and compatible with Powerpoint, Keynote, and Google Slides. The sleek, modern design reflects the cutting-edge nature of technology and consulting services. This infographic is your go-to tool for creating presentations that showcase your technology consulting expertise.


6 diapositivas
Tourism and Hospitality Industry Trends Presentation
Visually map out emerging trends with this engaging circular infographic layout. This slide features six labeled segments connected to a central tourism icon, ideal for highlighting key industry insights, traveler behavior shifts, or hospitality service updates. Sleek and professional, it's perfect for travel agencies, hotel chains, or tourism reports. Fully customizable in PowerPoint, Keynote, and Google Slides.


5 diapositivas
Real Estate Investing Infographics
Real estate investing refers to the purchase, ownership, management, rental, or sale of real estate properties with the objective of generating income and/or capital appreciation. These infographic templates can be used to provide key information and insights about real estate investing. These are designed to educate individuals about the basics of real estate investing, its benefits, and important considerations to help them make informed investment decisions. These infographics are great for anyone seeking to understand the basics of real estate. Compatible with Powerpoint, Keynote, and Google Slides.


7 diapositivas
Demographic Infographic Presentation Template
Are you looking for a fun way to engage your audience? This PowerPoint presentation is a great tool for educating individuals on demographic status. This data visualization template is perfect for presentations and marketing materials, allowing you to quickly communicate key demographic details with the help of charts and tables. Use this template to create a visual presentation that highlights the demographic characteristics of your target audience. This template features a colorful design, which provides plenty of space for you to include key facts, figures and conclusions.


7 diapositivas
Behavior Psychology Infographic Presentation
A Psychology Infographic is a visual representation of information related to the field of psychology. This template includes charts, diagrams, and other visual elements that help illustrate concepts, theories, and research findings in psychology. Use this infographic to cover a wide range of topics, such as personality traits, cognitive processes, mental disorders, and social behavior. The purpose of this psychology template is to help people better understand the complex concepts related to psychology. Compatible with Powerpoint, Keynote, and Google Slides this template is fully editable.


6 diapositivas
Problem Statement Infographic
Unleash the potential of your strategic presentations with our Infographic Templates, specifically designed to clarify and emphasize core challenges within any project or discussion. This collection features a versatile array of templates, from minimalistic single-point layouts to more detailed multi-section designs. Each template is crafted to help you articulate critical issues effectively, ensuring your audience grasps the essence of the discussion quickly. Customization is a breeze with options to adjust colors, fonts, and text, allowing you to align each slide with your corporate identity seamlessly. Ideal for use in PowerPoint, Google Slides, and Keynote, these templates are perfect for consultants, project managers, and business strategists looking to present problem statements in a clear, impactful manner. Equip yourself with these tools to drive understanding and foster problem-solving discussions in any professional setting.


5 diapositivas
Cloud Security and Data Storage Presentation
Visually explain your cloud architecture and data protection strategy with this sleek horizontal diagram. Each layered icon represents different aspects of storage, access, and security control—perfect for IT audits, cloud infrastructure briefs, and risk management reports. Fully editable in PowerPoint, Keynote, and Google Slides.