


Características


¿Tienes alguna pregunta?
Recomendar


5 diapositivas
Diabetes Treatments & Symptoms Infographics
Diabetes is a chronic medical condition that affects how the body processes glucose in the blood. There are three main types of diabetes: type 1 diabetes, type 2 diabetes, and gestational diabetes. These infographic templates are comprehensive and visually appealing tools designed to educate and create awareness about diabetes symptoms and treatment options. With its attractive design, concise information, and visually appealing graphics, this template will help individuals understand the importance of diabetes management and make informed decisions regarding their health. This template is completely customizable and compatible with Powerpoint, Keynote, and Google Slides.


4 diapositivas
Key Business Insights Executive Summary
Present your insights like a pro with this dynamic, timeline-inspired slide that makes key data points easy to follow. Designed to highlight four major takeaways or milestones, this visual format is ideal for summarizing business progress, strategy updates, or operational highlights. Fully editable in PowerPoint, Keynote, and Google Slides.


5 diapositivas
USA Economic Map Infographic
Navigate the complexities of the American economy with our USA economic map infographic. Crafted in shades of blue and diverse colors, this creative, vertical infographic is a boon for economists, researchers, and educators. It's designed to dissect financial data across states, highlighting economic indicators vividly. From GDP growth, employment rates to industry-specific insights, make economic trends accessible. This template, beneficial for anyone addressing economic audiences, features intuitive graphics, state icons, and designated areas for relevant imagery, ensuring each economic facet is visually compelling and information-rich.


26 diapositivas
Quantum Computing Presentation
Step into the future of technology with this fascinating presentation on quantum computing. Covering key concepts like quantum bits, superposition, entanglement, and real-world applications, this template helps simplify complex ideas for any audience. Fully customizable and compatible with PowerPoint, Keynote, and Google Slides for a seamless and insightful presentation experience.


7 diapositivas
Company Vision Infographic
Discover a suite of Slide Templates designed to articulate strategic goals and company ethos. These templates vary in design, from minimalistic and professional layouts to vibrant and dynamic presentations. Each template integrates elements that allow for a clear depiction of objectives, facilitating effective communication across your organization. These templates are perfect for executives and team leaders looking to present long-term strategies and unify their team's vision. They come equipped with customizable features to align with your company’s branding, ensuring a coherent and impactful presentation. Ideal for corporate presentations, stakeholder meetings, and internal communications, these templates provide a sophisticated tool to express and reinforce your strategic direction.


21 diapositivas
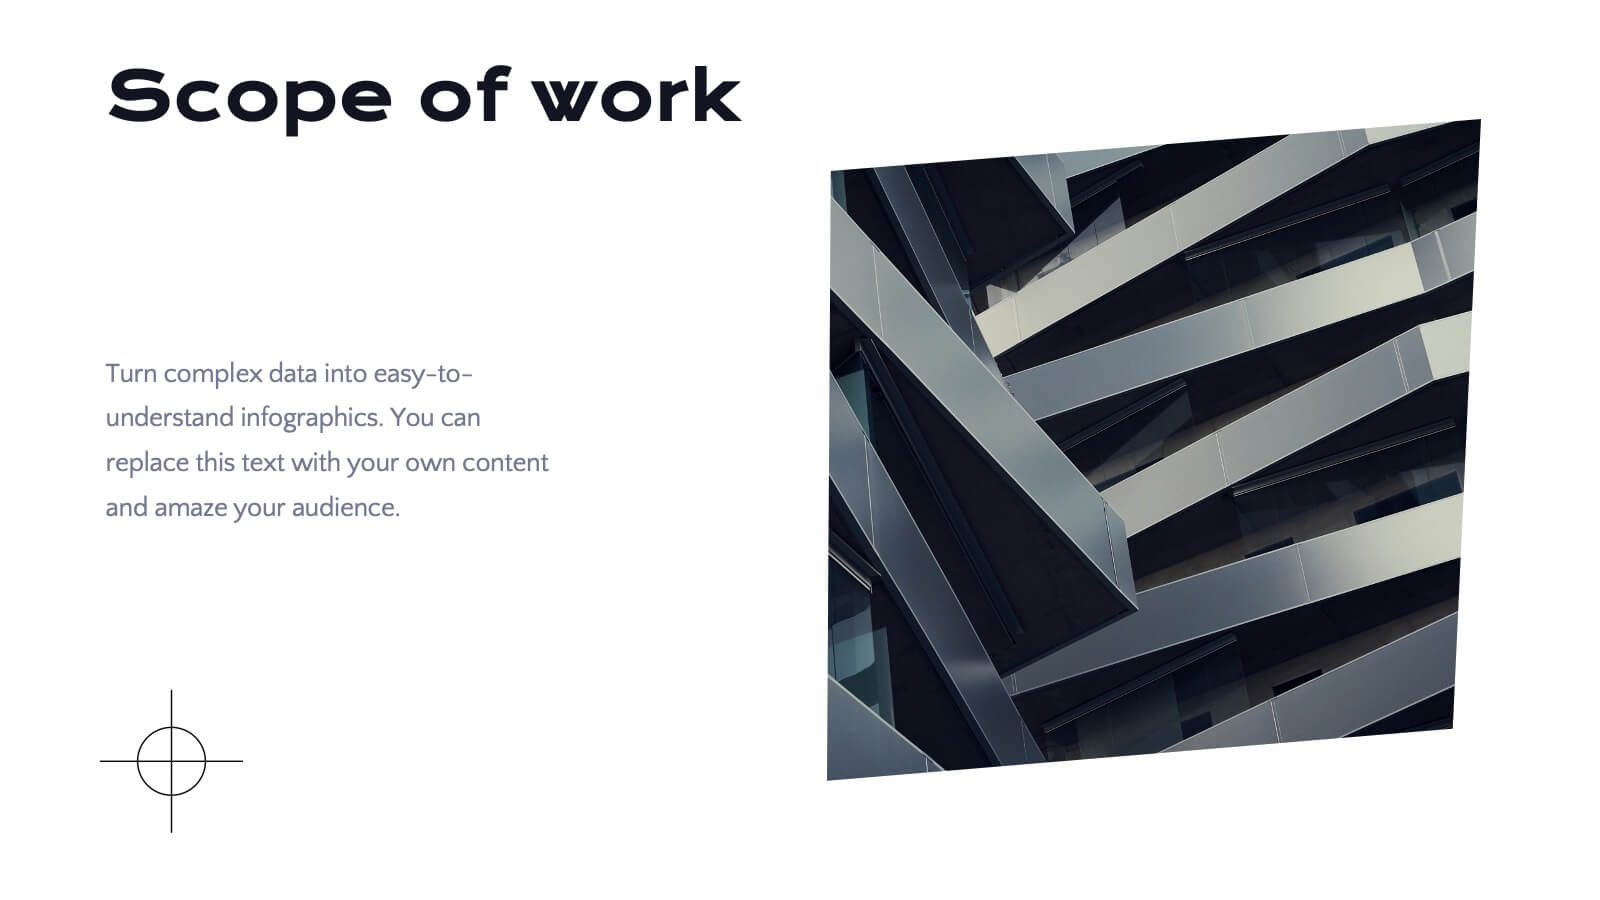
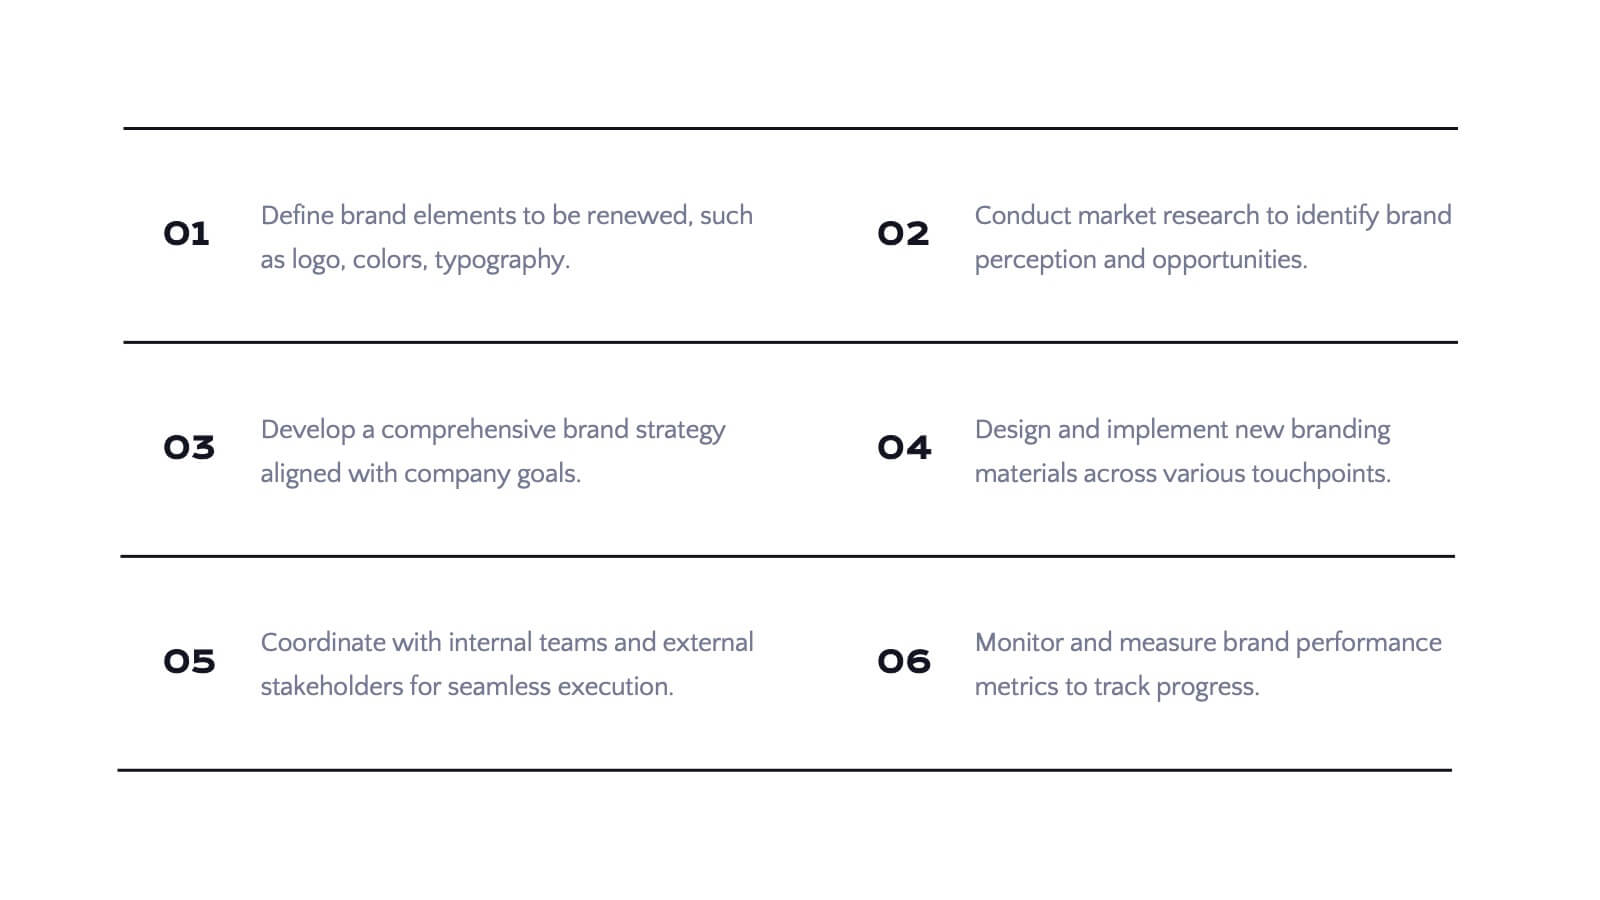
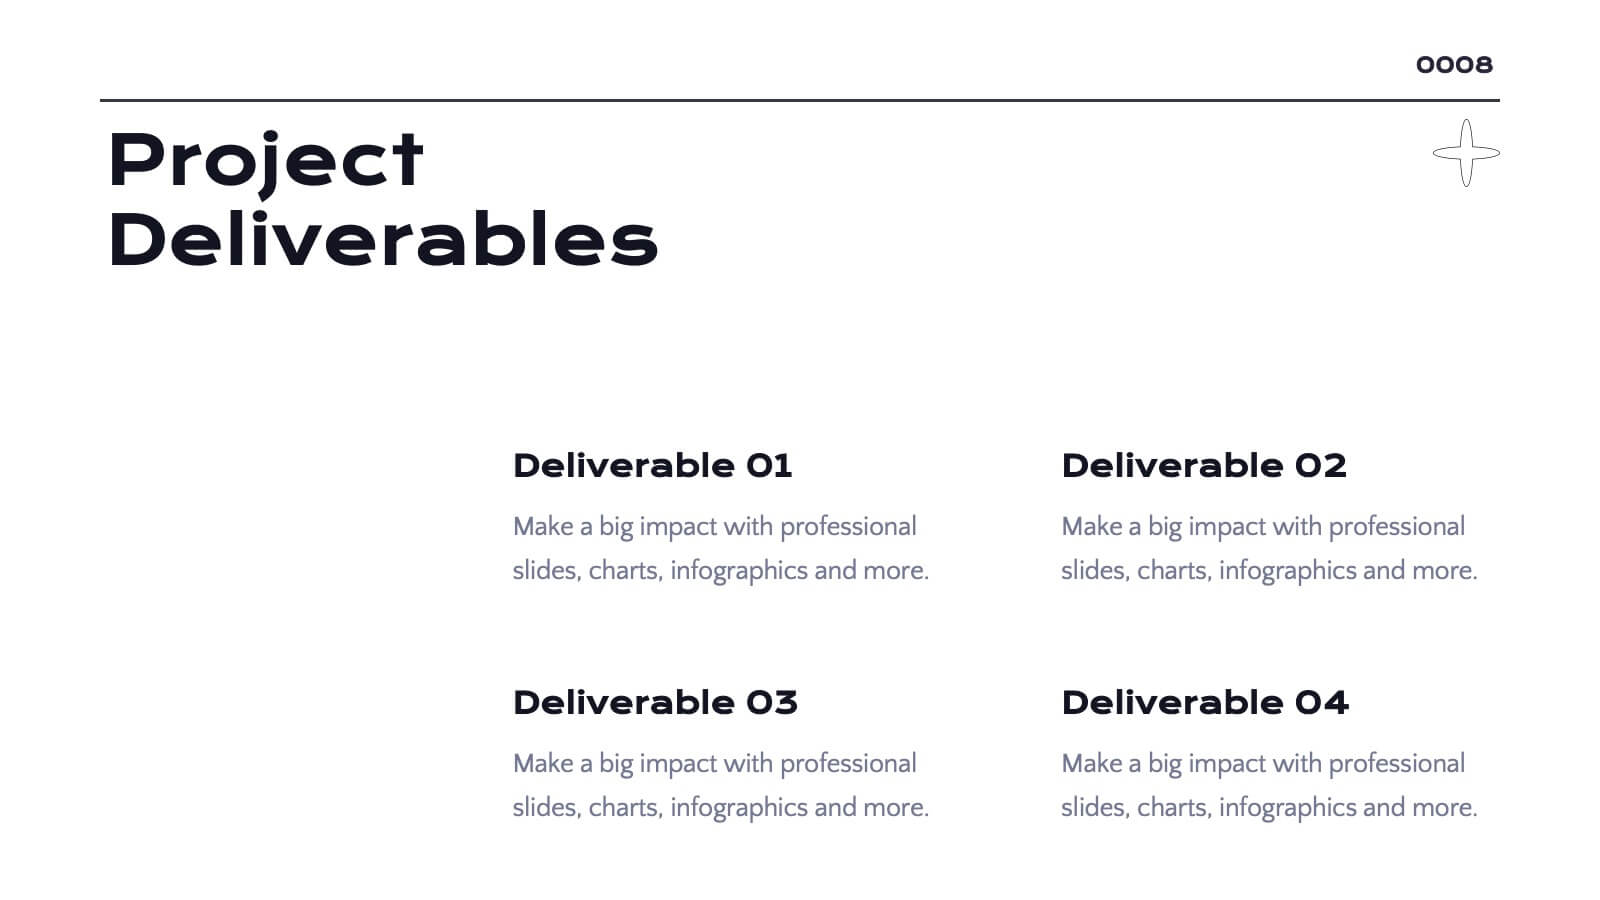
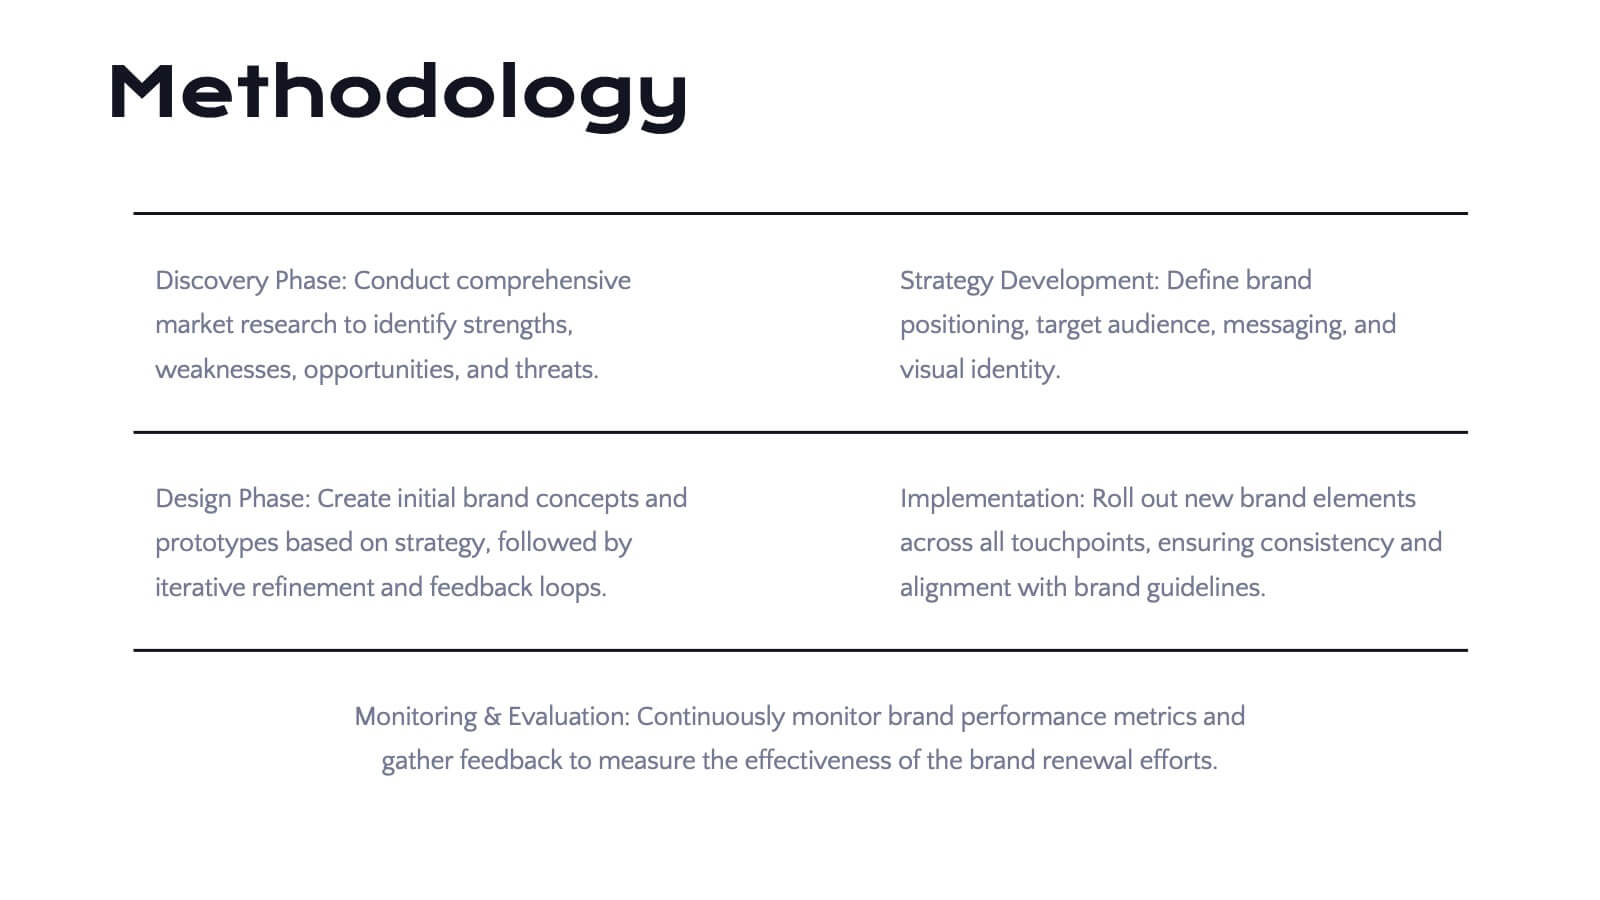
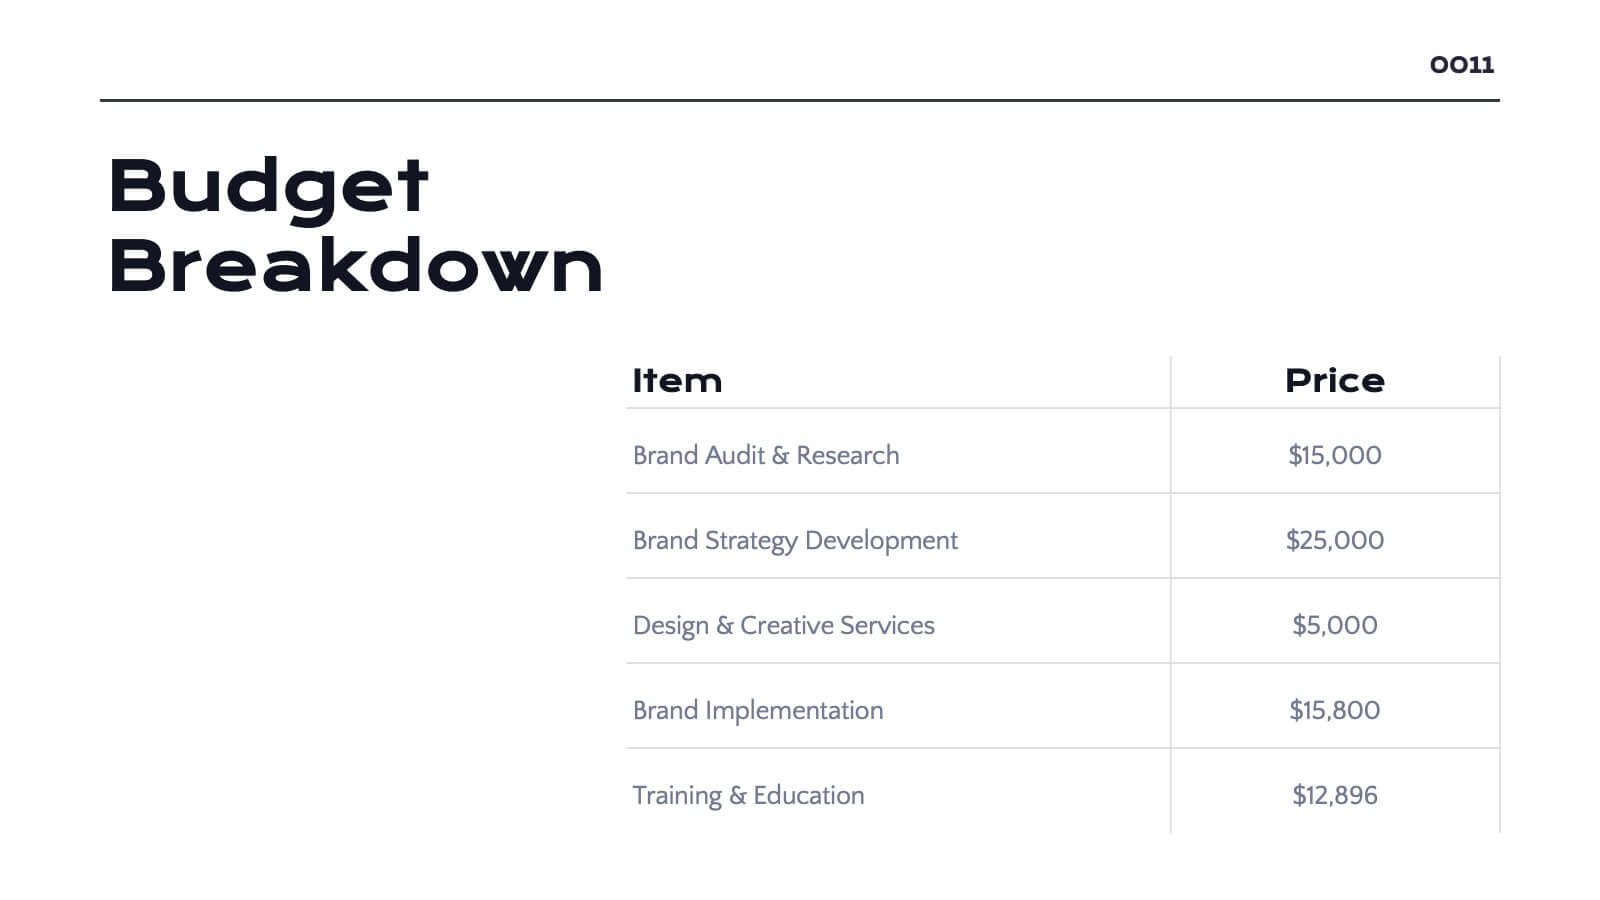
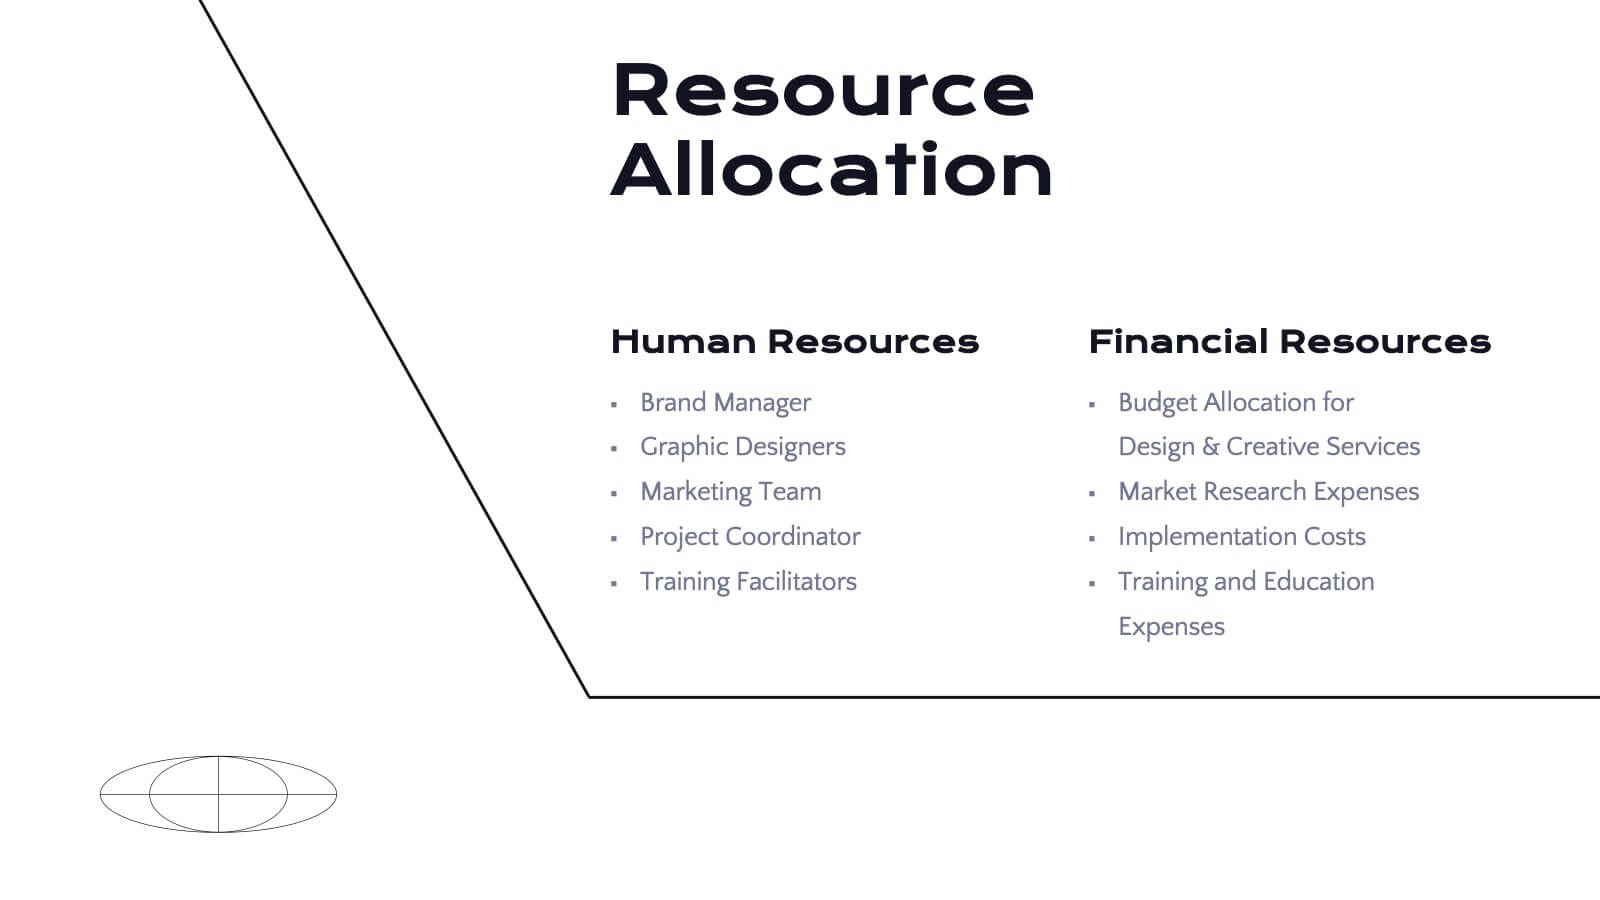
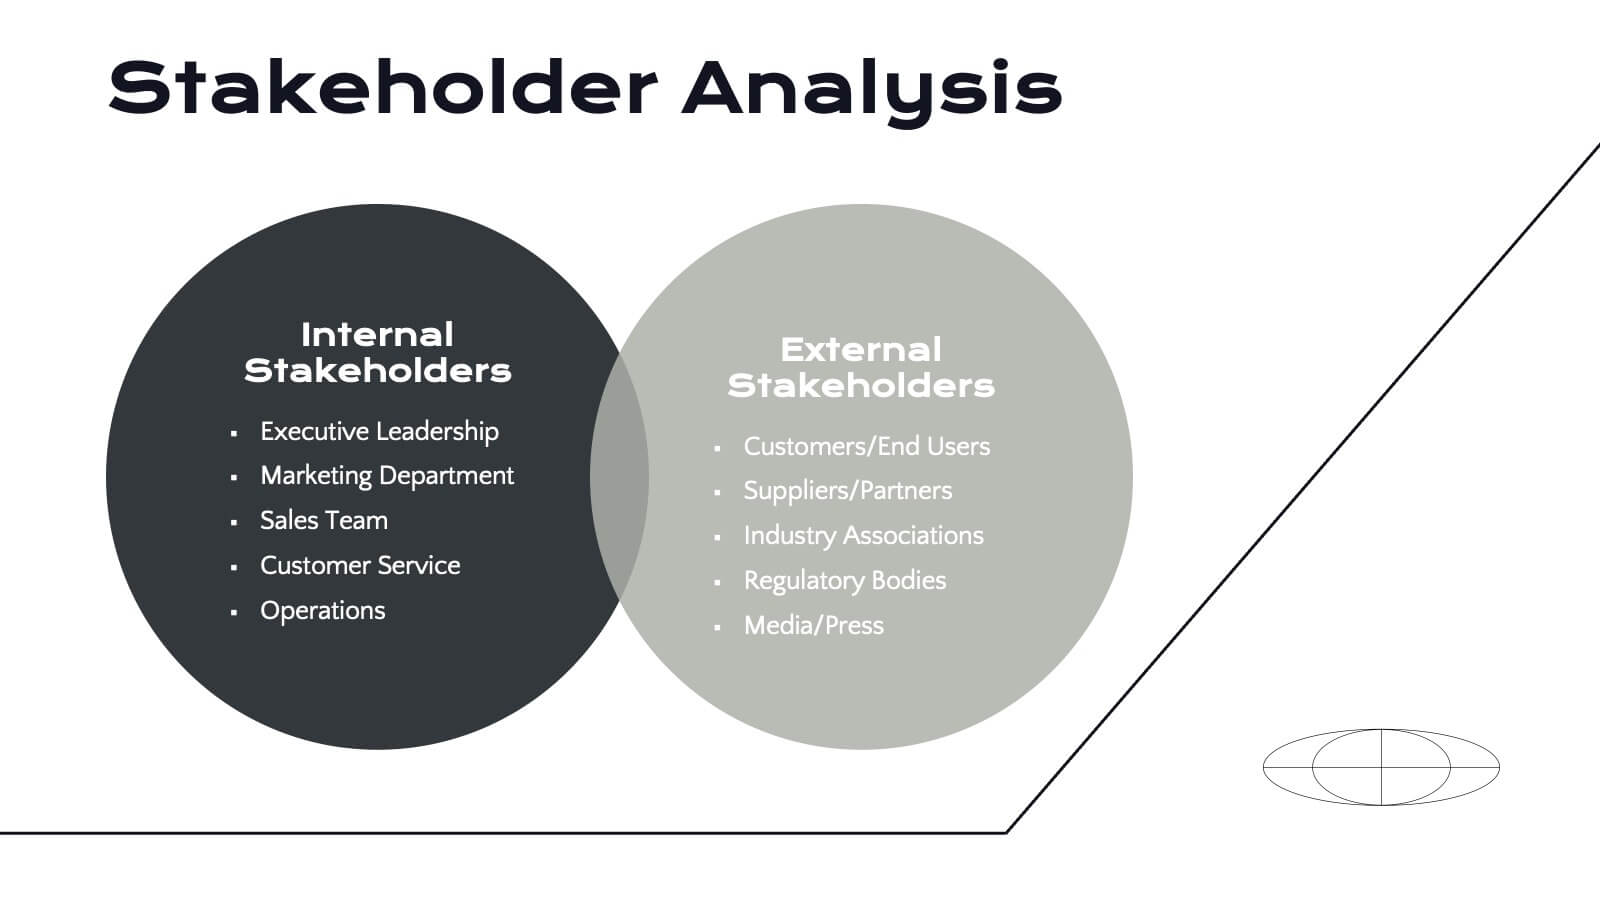
Radiance Detailed Project Execution Plan Presentation
Elevate your project execution presentations with this sleek template, covering everything from objectives to timelines and budget breakdowns. It's perfect for aligning your team and stakeholders. Compatible with PowerPoint, Keynote, and Google Slides, it ensures professionalism and clarity in showcasing your project plans.


6 diapositivas
How to Master Time Management Presentation
Make every minute count with this sleek and dynamic template built to visualize productivity, efficiency, and planning. Perfect for showcasing workflows, priorities, or time allocation, it helps communicate structure with clarity and style. Fully customizable and compatible with PowerPoint, Keynote, and Google Slides for effortless editing and presentation.


21 diapositivas
Runewood Marketing Proposal Template Presentation
The Marketing Proposal Presentation Template provides 21 slides covering core aspects like market presence, growth strategies, and financial highlights. Perfect for agencies and businesses to showcase their marketing strategies effectively. Fully customizable and compatible with PowerPoint, Keynote, and Google Slides.


7 diapositivas
Environmental Planning Infographic Presentation
Environmental infographics are an essential tool in raising awareness about the state of the environment and the impact of human activities on the planet. This template presents a broad range of data text on the environment for you to input. Use this eye-catching infographic design to educate and raise awareness about the environment. This template is ideal to give an overview of the topic, its importance and the main issues. Stay on track using facts and figures, good visuals and data visualizations. This presentation is easy to use and can be edited in Powerpoint, Keynote or Google Slides.


6 diapositivas
Leadership Vision and Strategy Presentation
Present your organization’s goals with this leadership vision and strategy template, designed with a hierarchy graphic to represent team structure and growth. Perfect for strategic planning, leadership meetings, and corporate presentations. Fully editable in Canva, PowerPoint, or Google Slides, making it easy to customize colors, text, and layout to fit your brand.


4 diapositivas
Property Listing and Comparison Presentation
A sleek, modern way to spotlight property details comes to life in this clean presentation design, making comparisons feel effortless and engaging. It clearly organizes features, differences, and key selling points so audiences can make informed decisions fast. Fully editable and easy to use, this presentation works seamlessly in PowerPoint, Keynote, and Google Slides.


21 diapositivas
Luminary Annual Report Presentation
Create stunning annual reports with this sleek template! Highlight key achievements, financial summaries, and performance metrics. Perfect for showcasing operational updates, strategic initiatives, and market trends. Designed for business professionals and analysts. Compatible with PowerPoint, Keynote, and Google Slides.


6 diapositivas
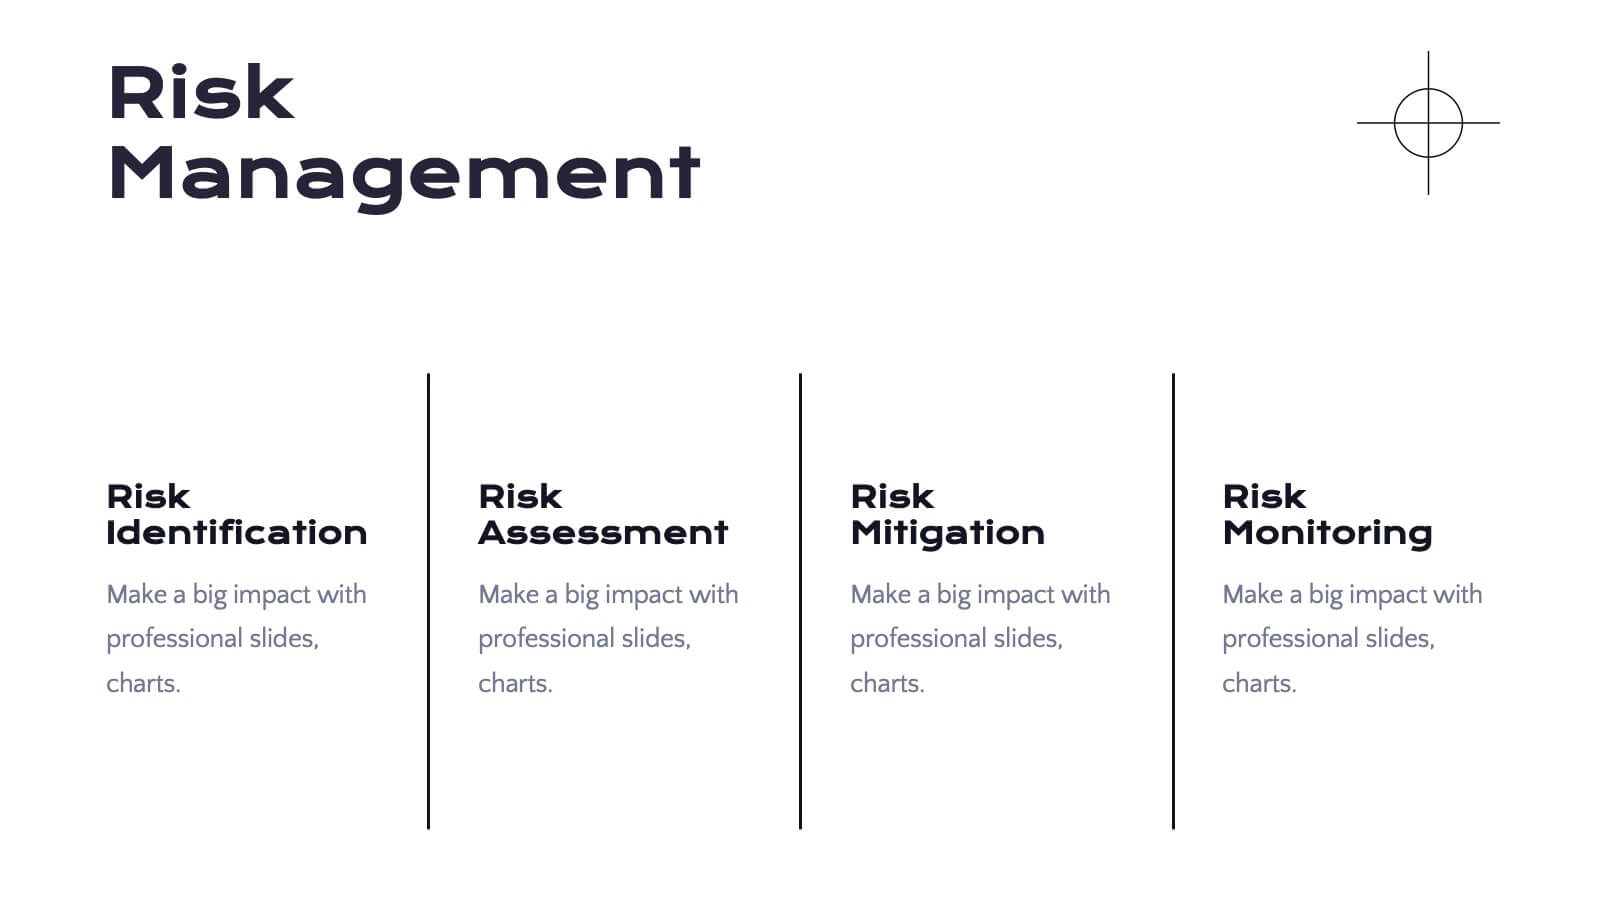
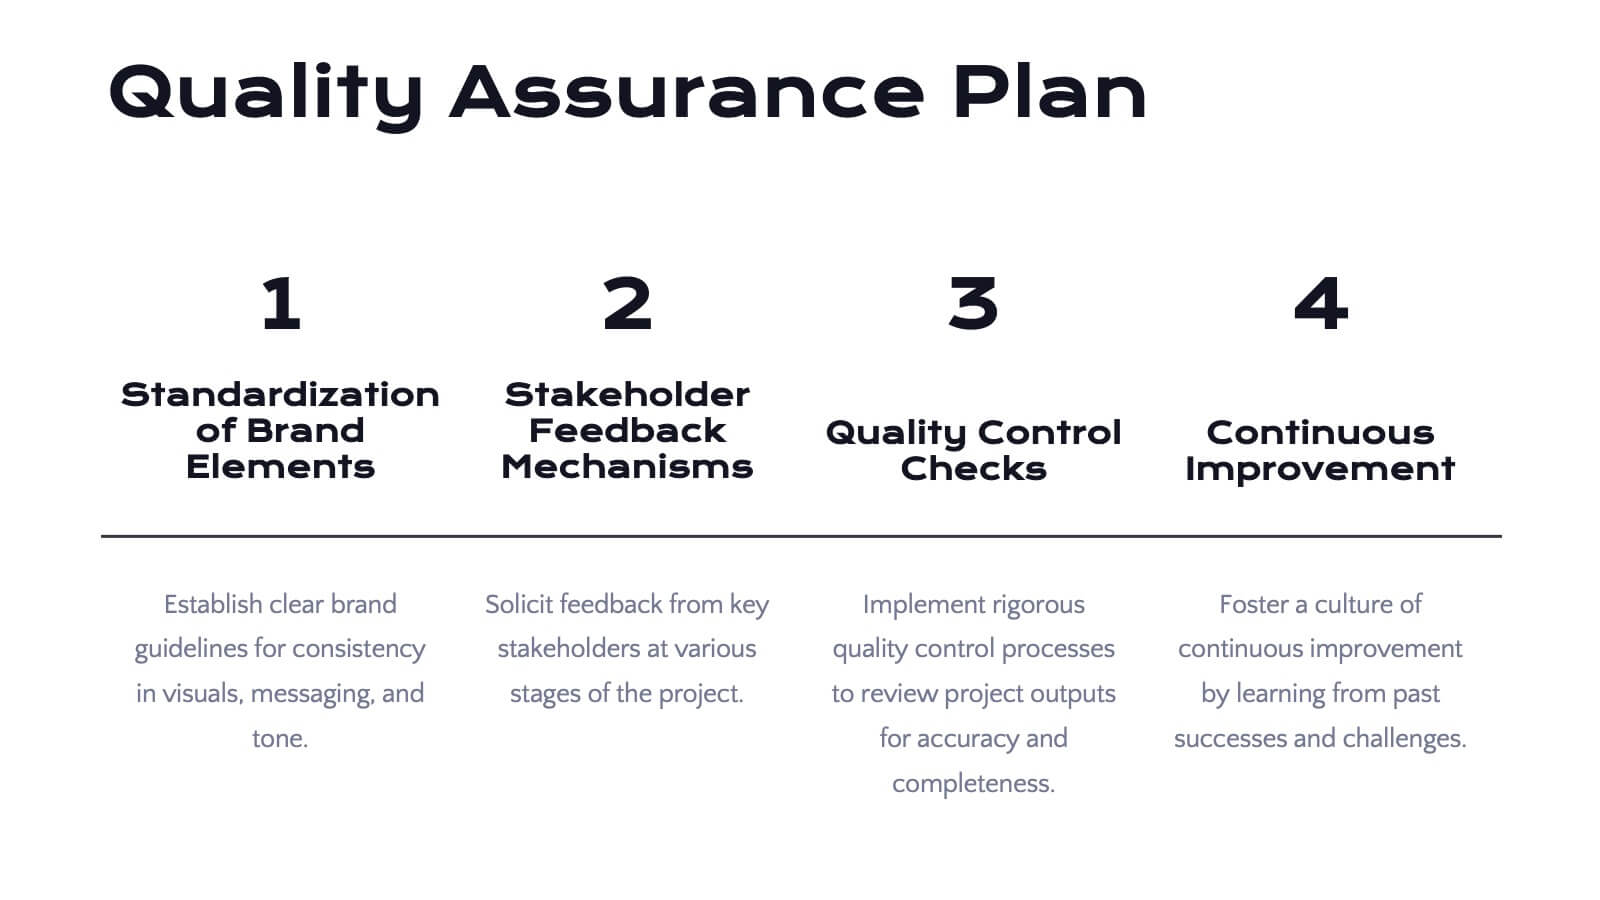
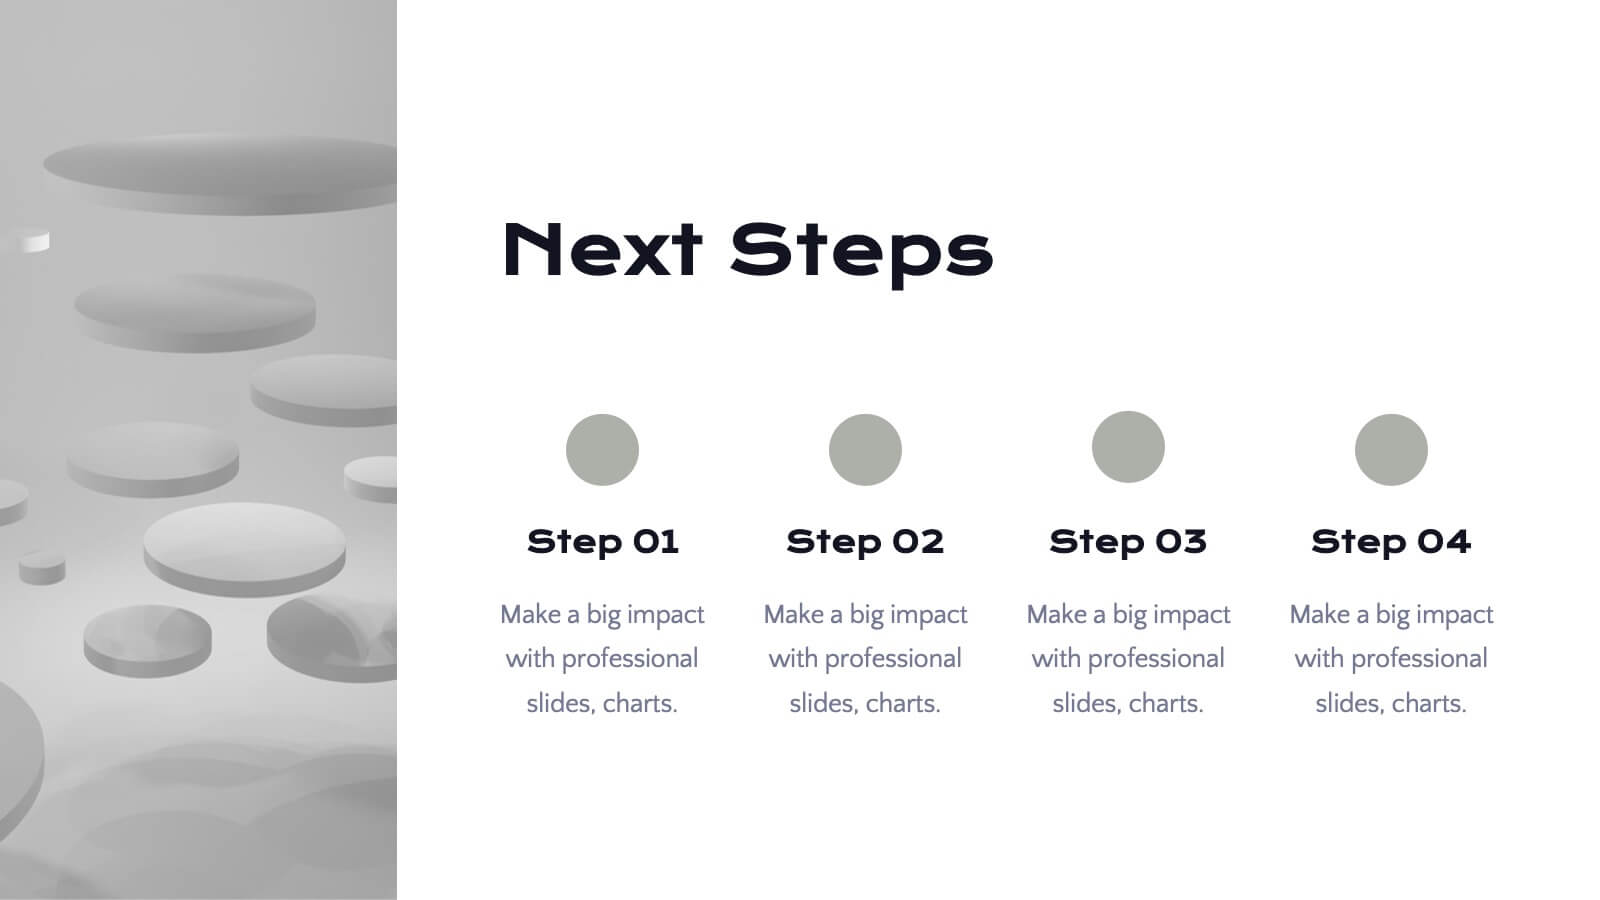
Pattern-Based Layouts Using Geometry
Present your process, timeline, or flow with clarity using the Pattern-Based Layouts Using Geometry Presentation. This clean, step-by-step format uses bold numbered icons and curved geometric blocks to guide viewers through five key stages. Ideal for sequential content, strategies, or workflows. Easily customizable in PowerPoint, Keynote, and Google Slides.


7 diapositivas
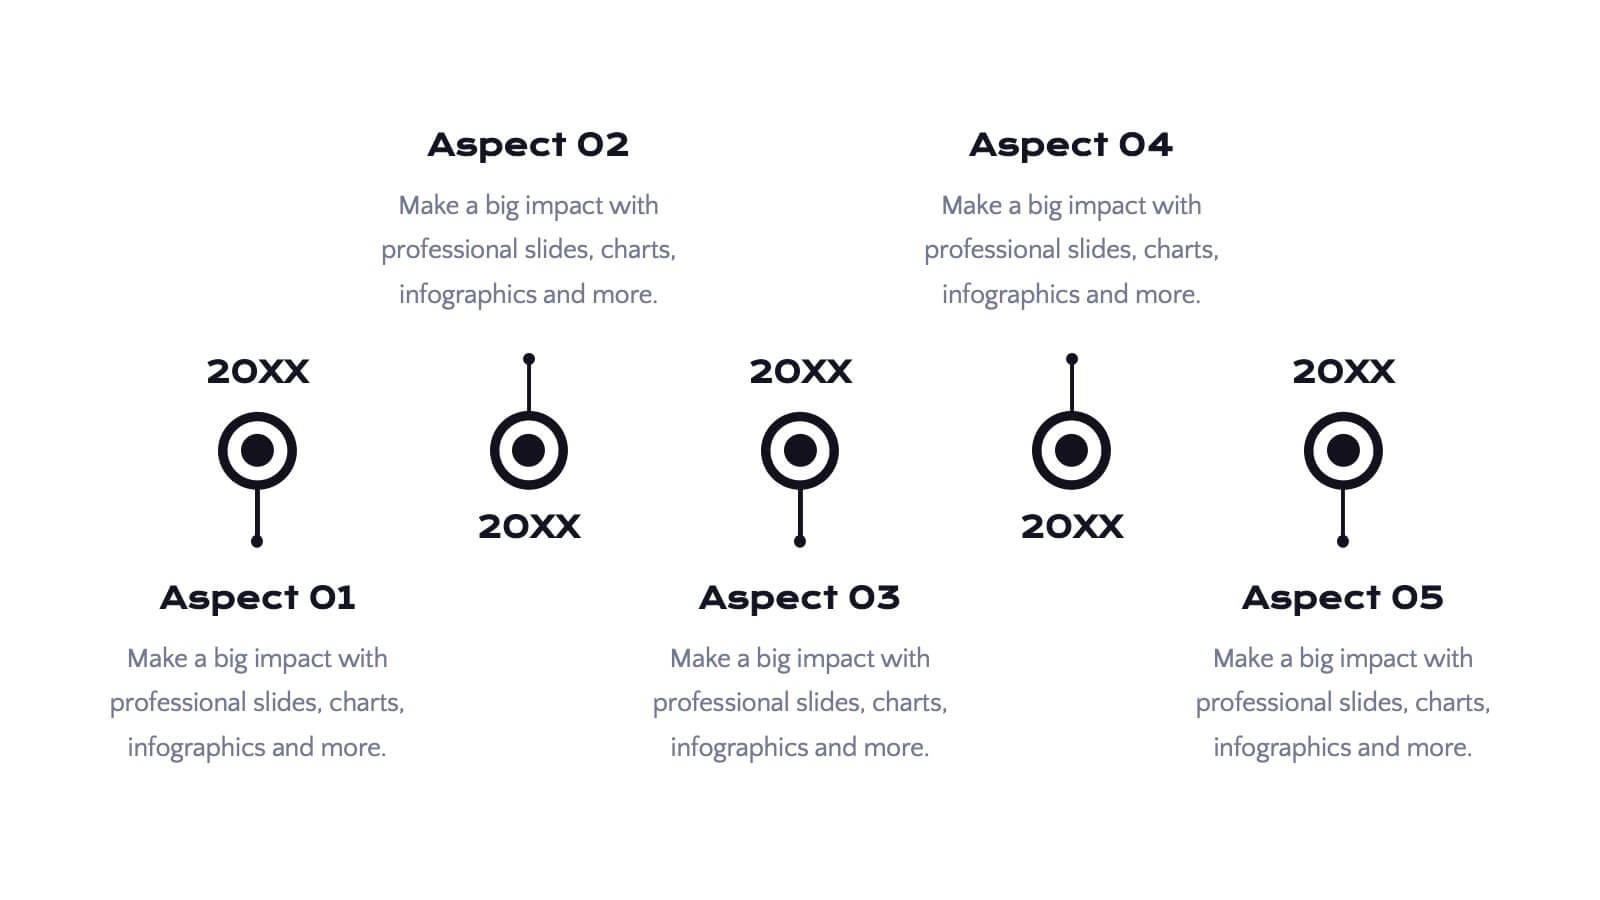
Creative Timeline Infographic Presentation Template
A Timeline is an essential tool to illustrate the chronology of events; it also provides a method for organizing and summarizing material. With the timelines provided in this template you will be able to visualize the passage of time, so that you can better understand how influences from the past still impact your life today. This template is designed to assist you with crafting your timeline so that it can be easily understood. The color-coding makes it easy to see daily progress. Use the timelines in this template to create useful visualization, and convey the growth of your business or brand.


20 diapositivas
Aeneas Sales Proposal Presentation
Seal your next deal with this professional sales proposal template. It covers key sections like objectives, pricing strategy, and target market, offering a comprehensive layout for your pitch. Ideal for impressing clients, it's compatible with PowerPoint, Keynote, and Google Slides for smooth, impactful presentations.


6 diapositivas
Geometric Patterns Infographics
Step into the fascinating realm of geometric patterns! This infographic invites you to explore the captivating world of shapes and symmetries. From the mesmerizing allure of intricate designs to the mathematical precision behind each pattern, we'll reveal the secrets that make geometric patterns a timeless art form. Delve into the core principles of geometric patterns. Gain insights into the geometry behind these intricate designs, from basic shapes like circles and squares to more complex constructions. Uncover the history and cultural significance of these patterns, from ancient civilizations to contemporary art and design. With this captivating infographic, compatible with PowerPoint, Keynote, and Google Slides, sharing your enthusiasm for geometric patterns has never been easier. Empower yourself with the knowledge to appreciate and create these mesmerizing designs. Dive into the world of geometric patterns and embark on a journey of artistic exploration and appreciation.


5 diapositivas
History of Vaccine Infographics
The History of Vaccines is a fascinating journey that spans centuries and has significantly impacted human health and disease prevention. With these infographic templates, you can effectively communicate the importance of vaccines, highlight their role in disease prevention, and debunk common misconceptions. It serves as an educational tool to promote understanding and appreciation for the significant advancements in vaccine development that have saved countless lives throughout history. Use these to provide a comprehensive overview of the history of vaccine and help individuals understand the importance and impact of vaccines.