


Características


¿Tienes alguna pregunta?
Recomendar


4 diapositivas
Employee Performance Feedback Presentation
Enhance your performance review process with the Employee Performance Feedback infographic. This structured and visually engaging template presents key evaluation criteria, employee achievements, and areas for improvement in a clear format. Fully customizable and compatible with PowerPoint, Keynote, and Google Slides.


7 diapositivas
Relationship Polices Infographic
Navigate the intricacies of interpersonal dynamics with our relationship policies infographic. Adorned in the purity of white, complemented by shades of understanding blue and harmonious green, this template elucidates the principles and boundaries that shape healthy relationships. Detailed with relevant infographics, symbolic icons, and illustrative image placeholders, it provides a visual roadmap to successful connections and interactions. Impeccably designed for Powerpoint, Keynote, or Google Slides. An essential tool for HR professionals, relationship counselors, team leaders, or any organization emphasizing healthy interpersonal dynamics. Foster connections; let each slide guide the way to relationship excellence.


5 diapositivas
Cybersecurity Threat Analysis Presentation
Stay one step ahead with this bold, eye-catching slide design that makes complex cyber risk insights clear and easy to present. This layout helps you break down key threats, vulnerabilities, and security actions in a clean visual structure. Fully compatible with PowerPoint, Keynote, and Google Slides.


4 diapositivas
Boardroom Strategy Meeting Overview Presentation
Align leadership goals and present strategic priorities with the Boardroom Strategy Meeting Overview presentation. Featuring a clean visual of executive collaboration, this template helps organize key discussion points, initiatives, and responsibilities in a structured layout. Ideal for quarterly planning, leadership updates, and strategic alignment sessions. Fully editable in PowerPoint, Keynote, and Google Slides.


5 diapositivas
Regional Sales Heatmap Presentation
Showcase performance by region with this Regional Sales Heatmap Presentation. This template highlights U.S. state-by-state sales data using gradient color coding and a clear legend system. Easily customizable for quarterly reports, territory analysis, or sales strategy reviews. Compatible with PowerPoint, Keynote, and Google Slides.


21 diapositivas
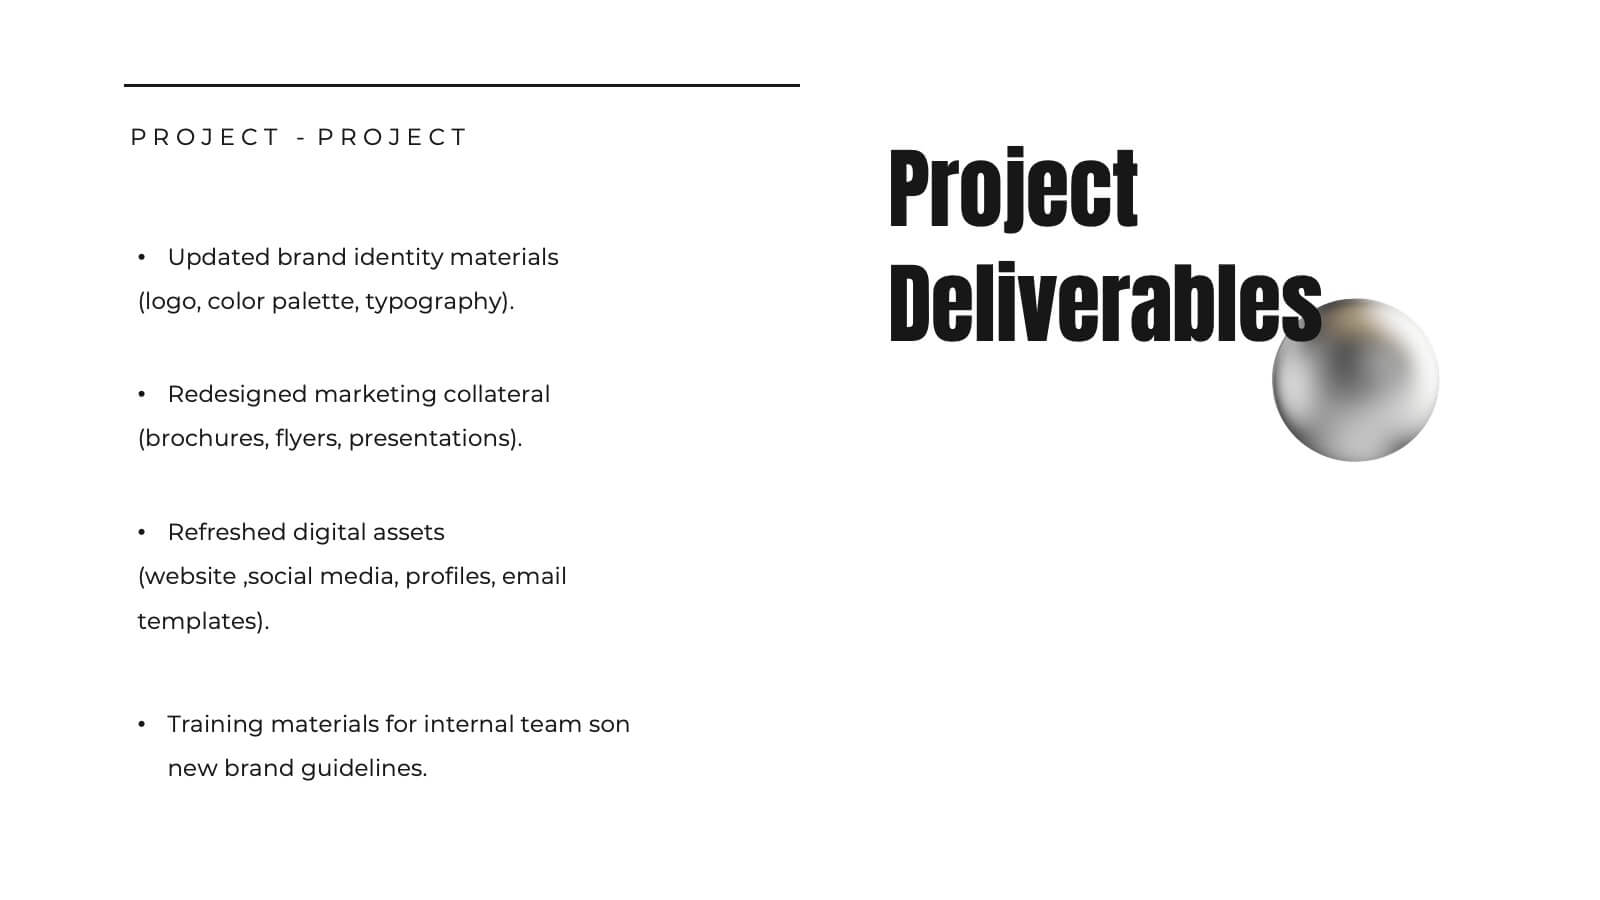
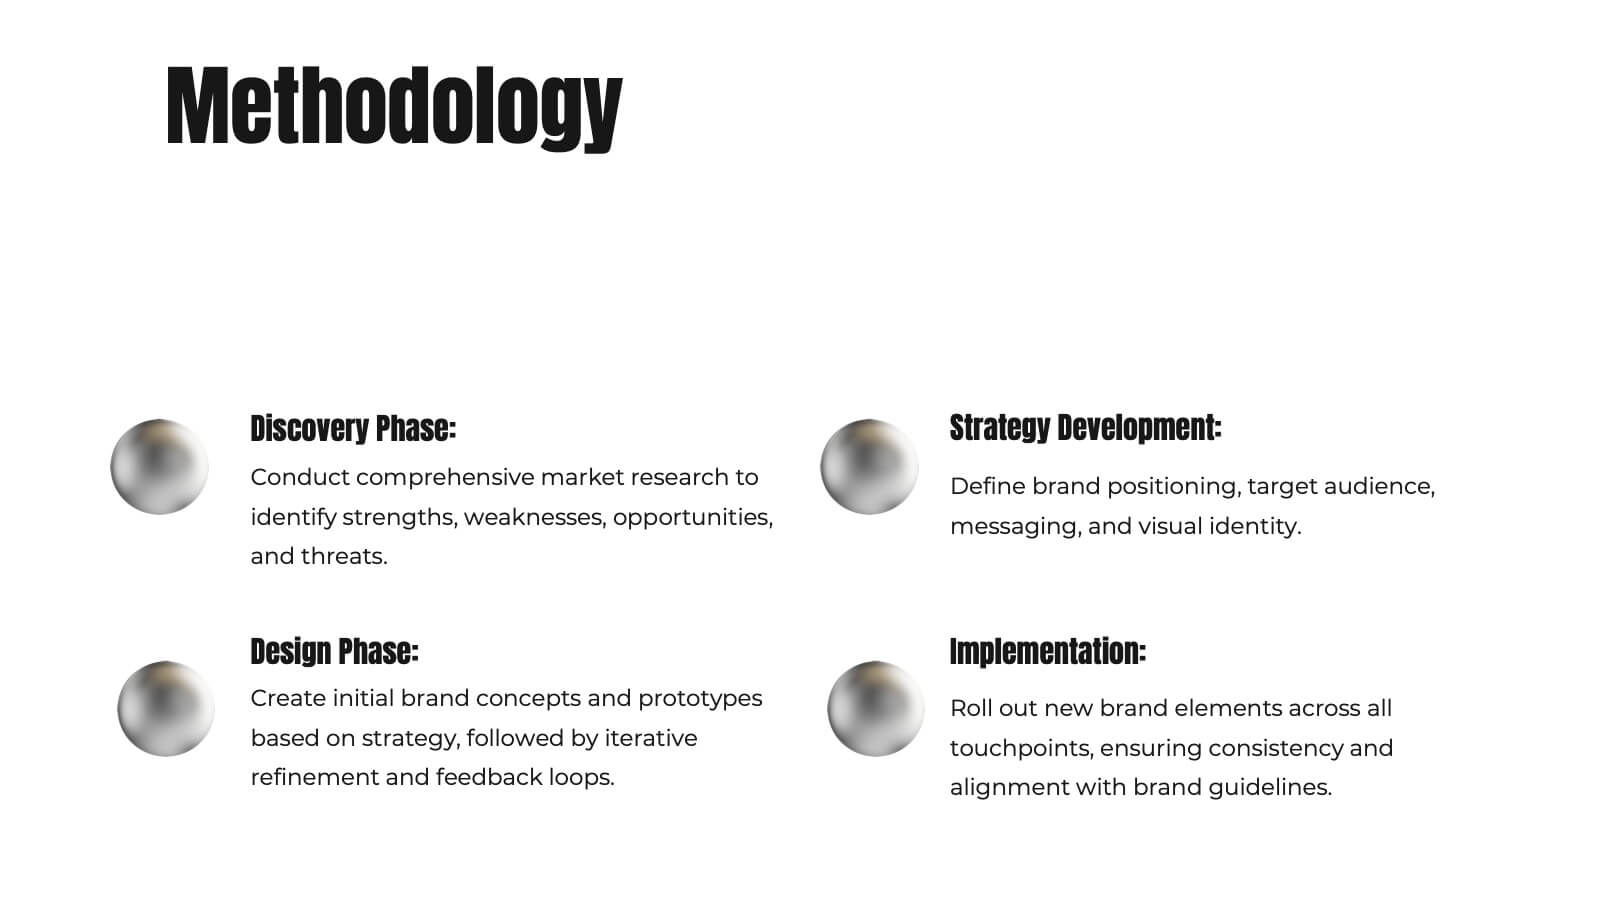
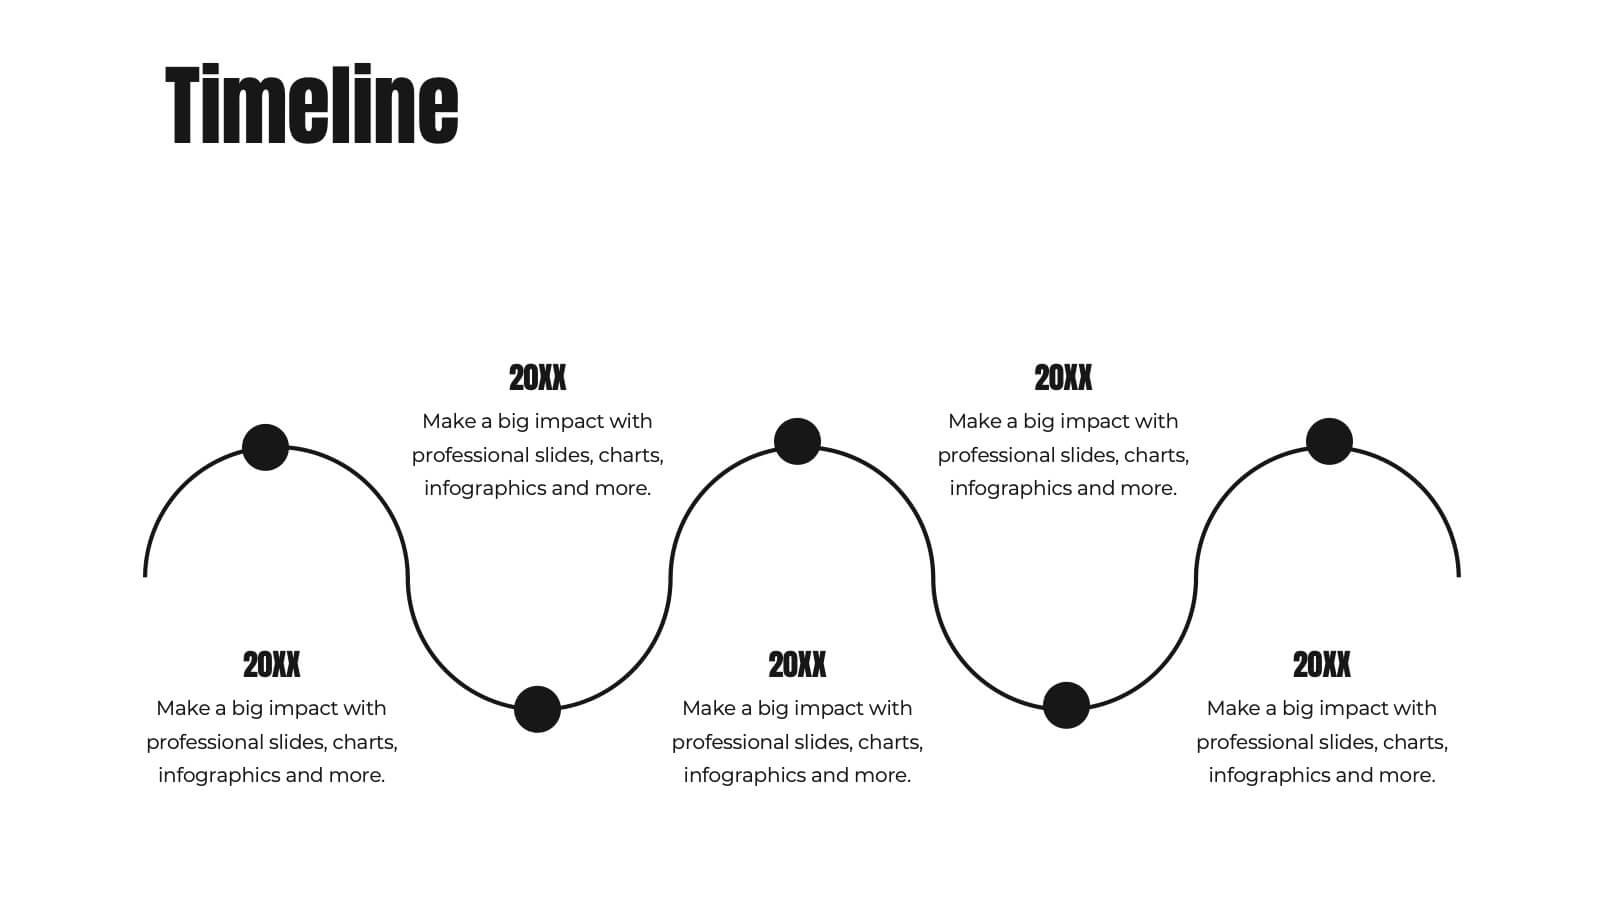
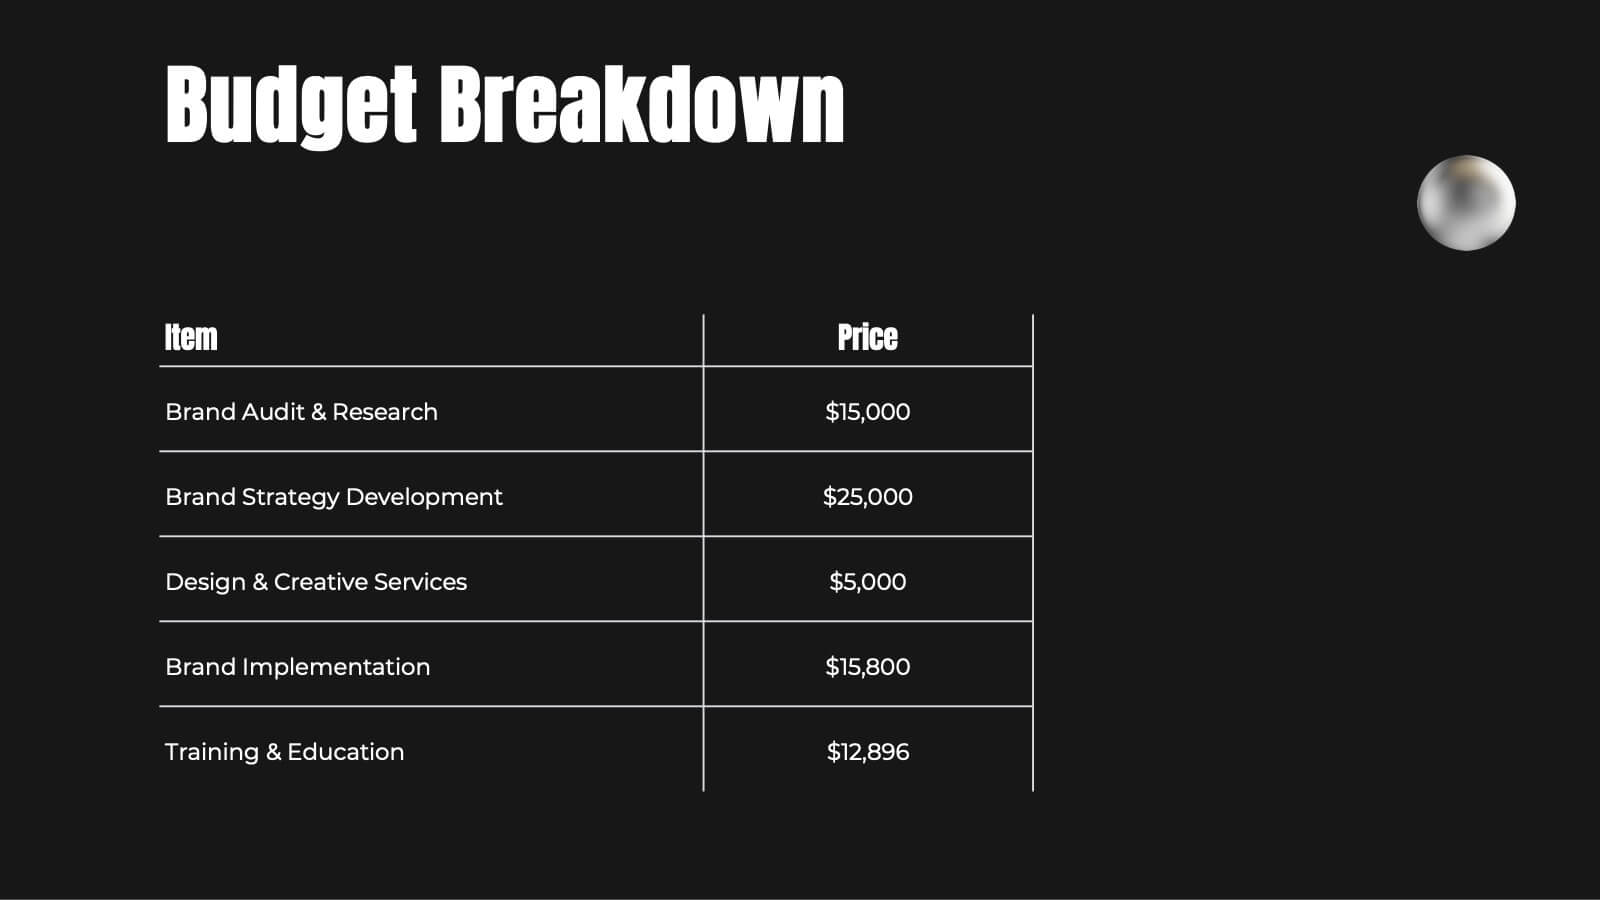
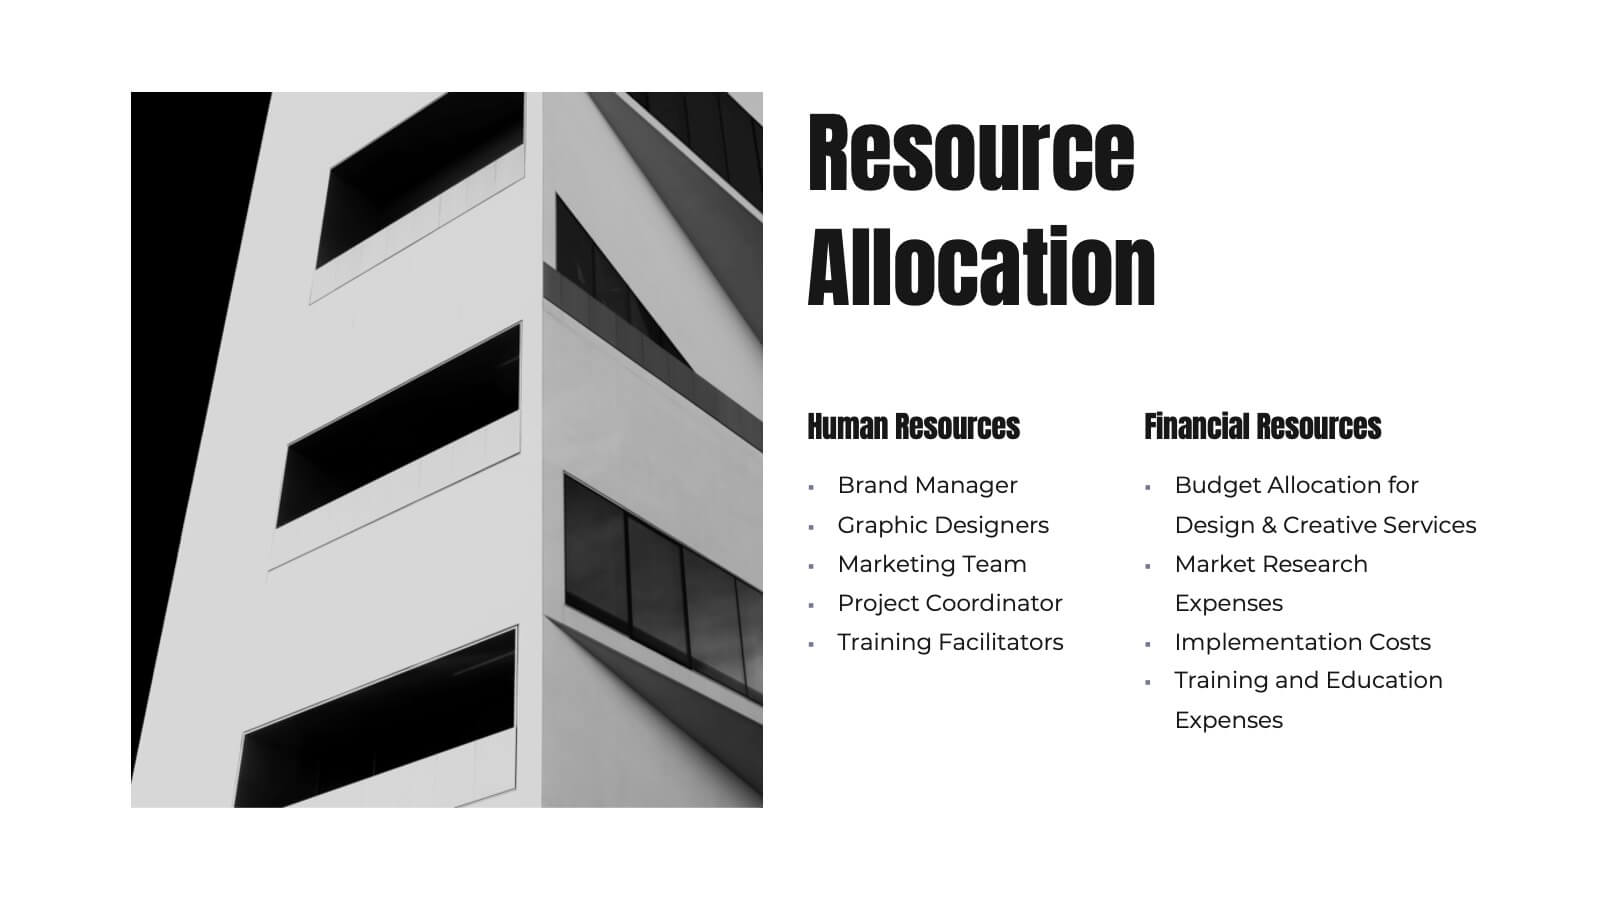
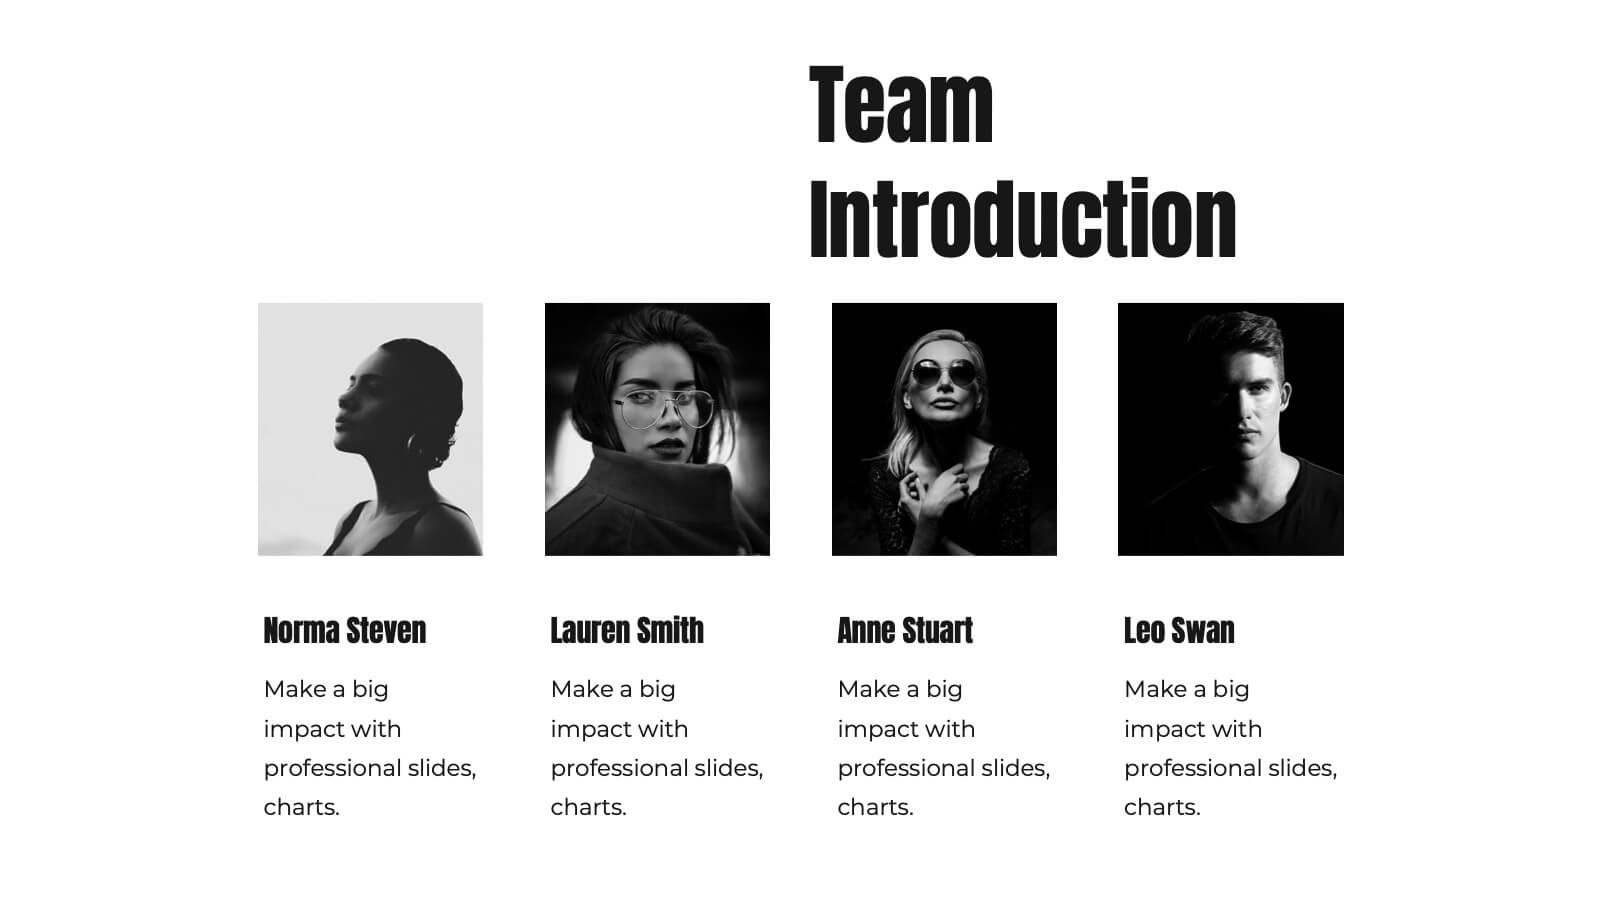
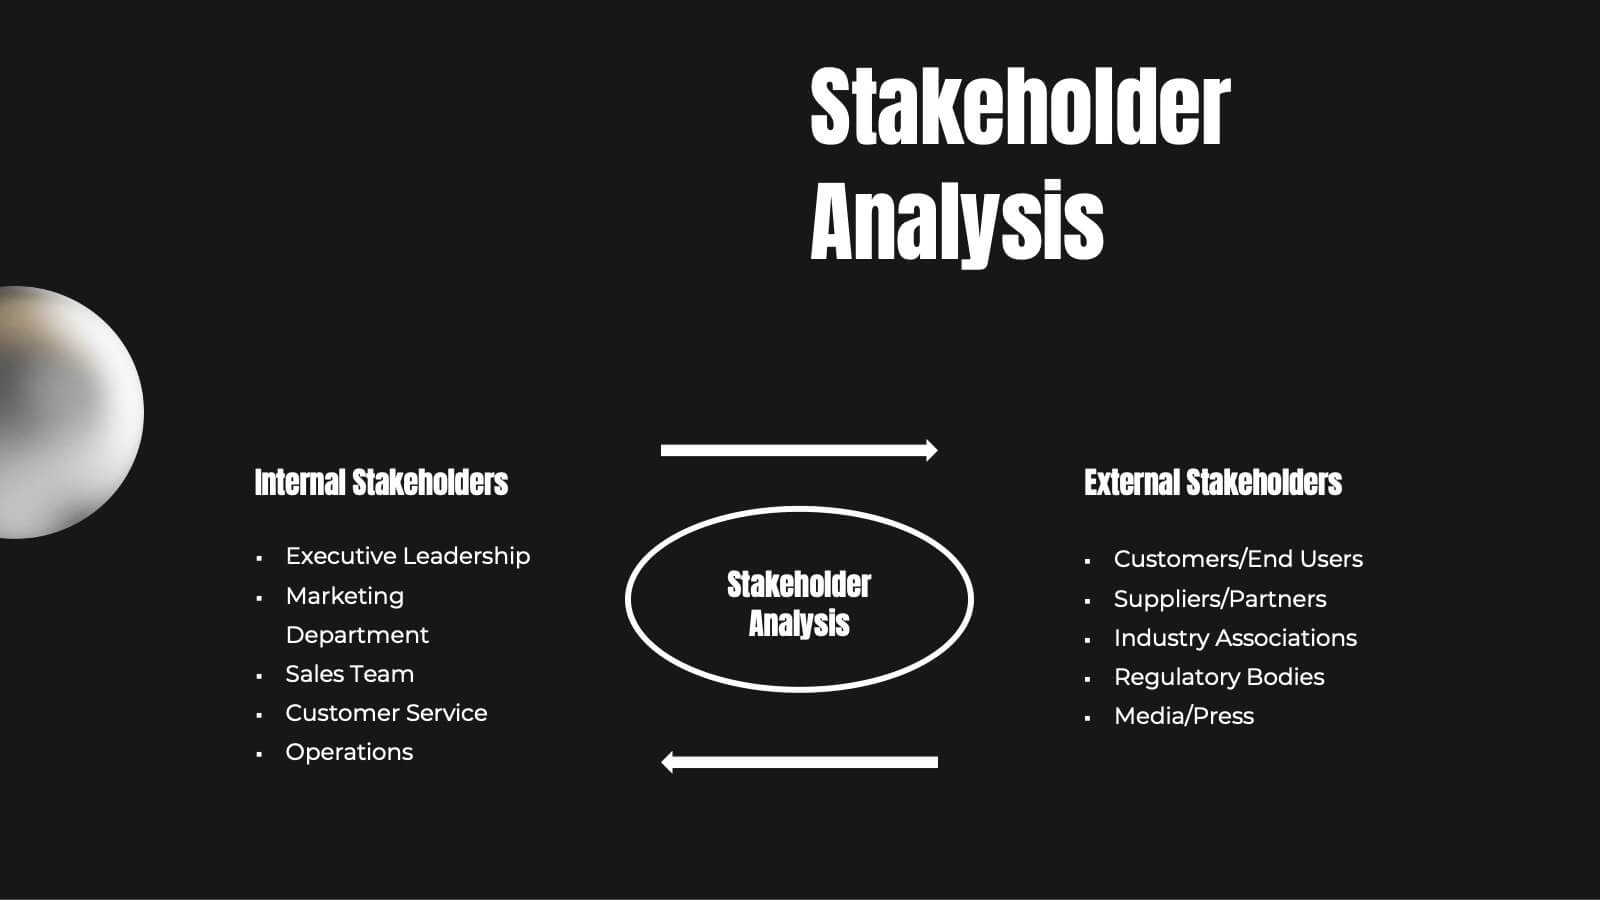
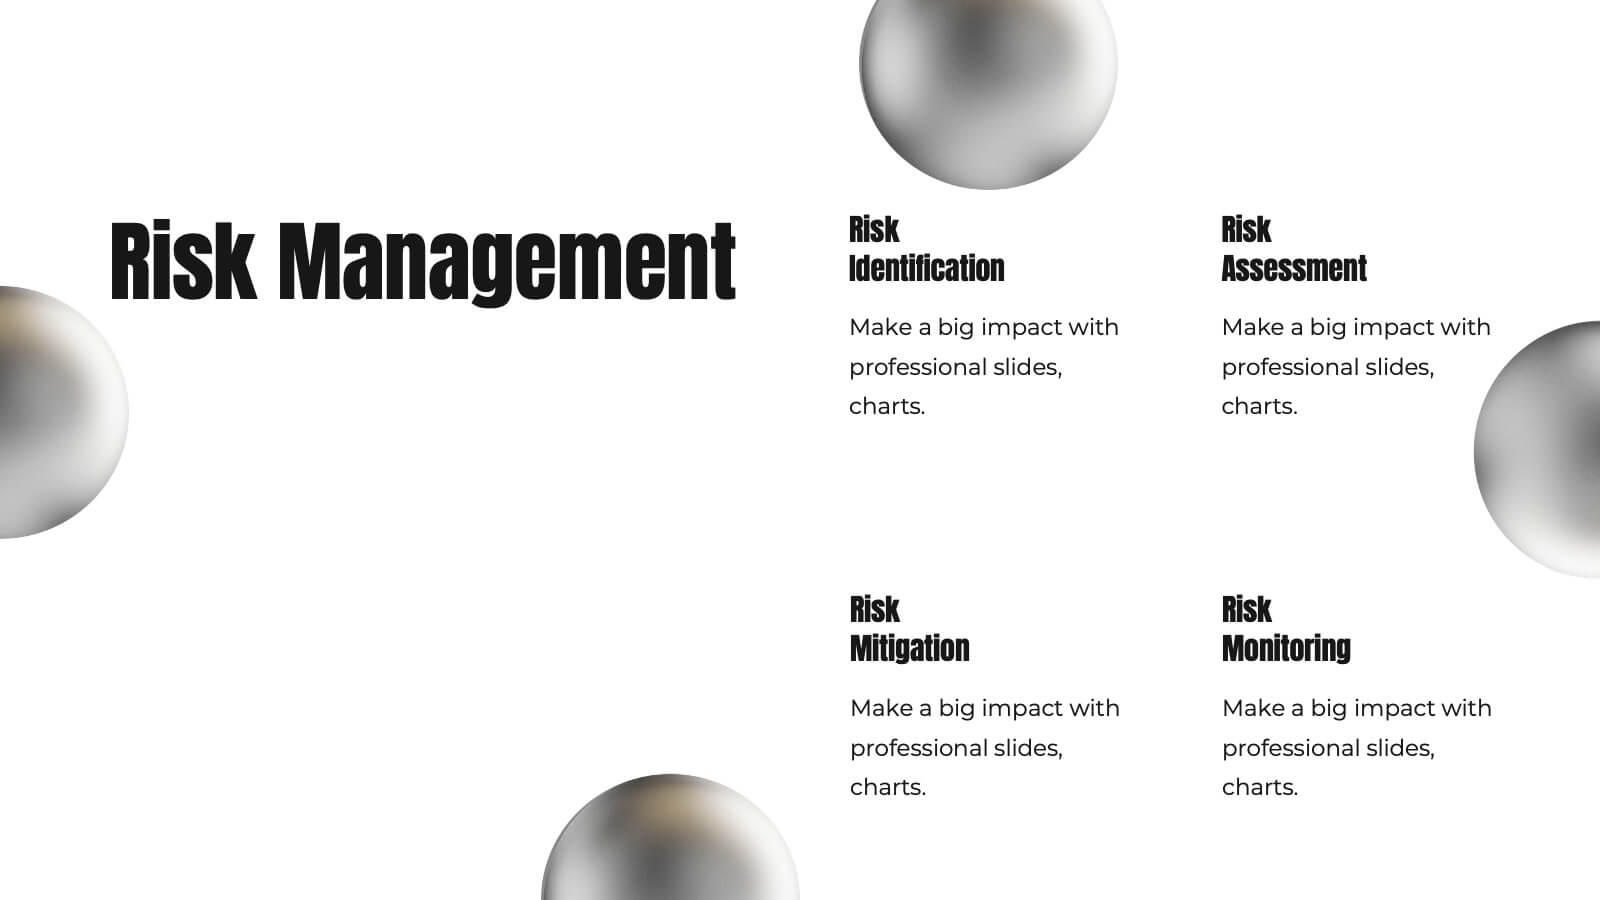
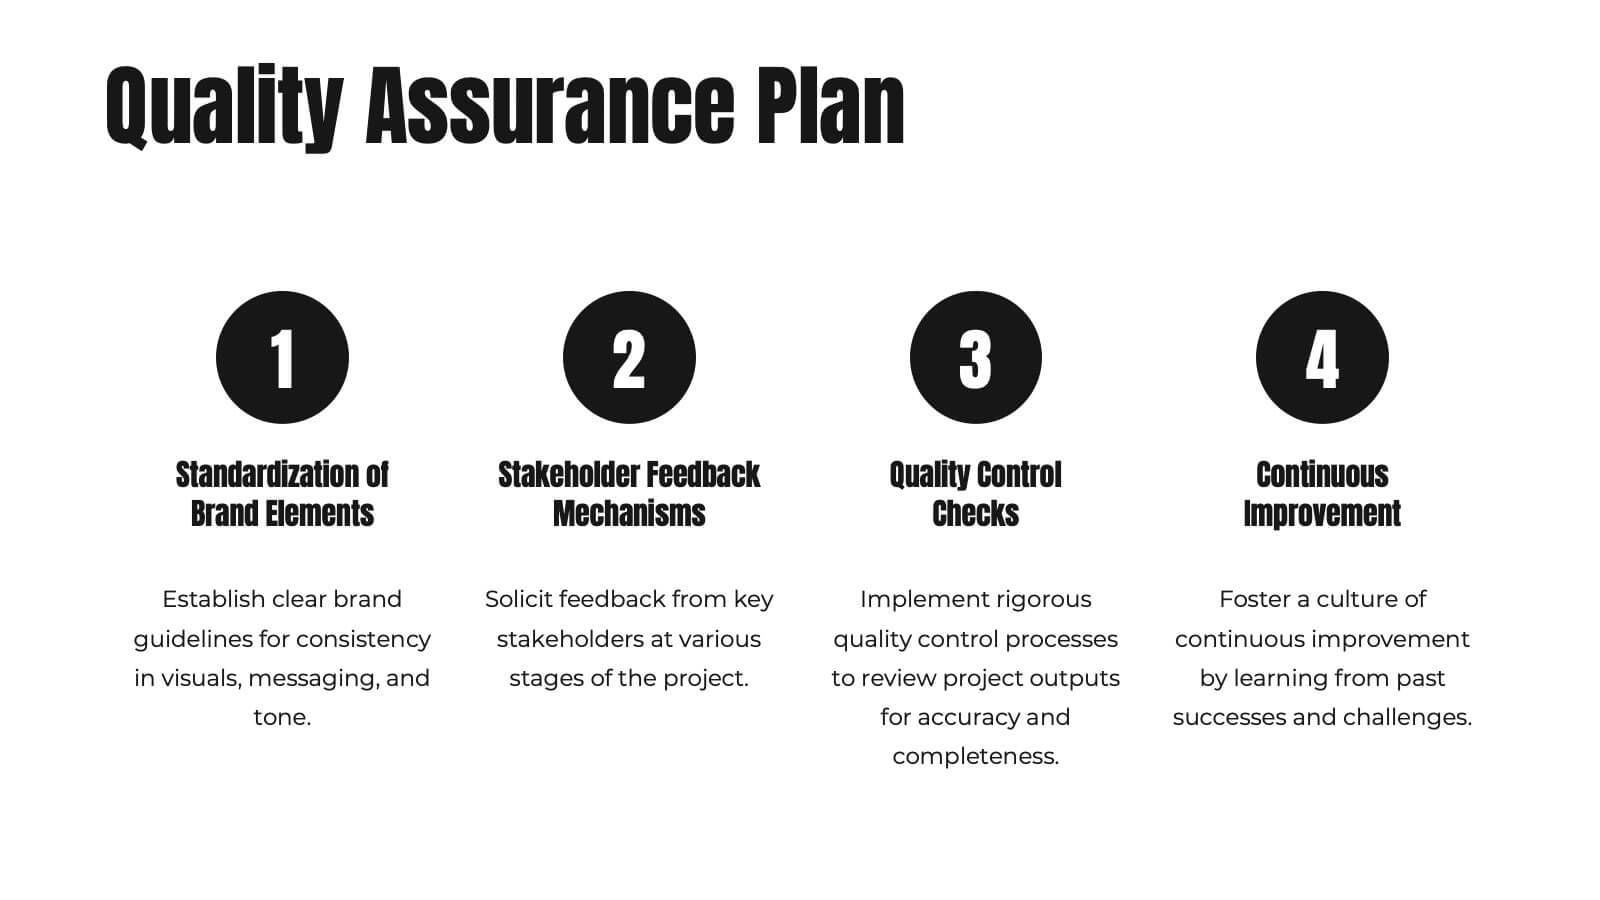
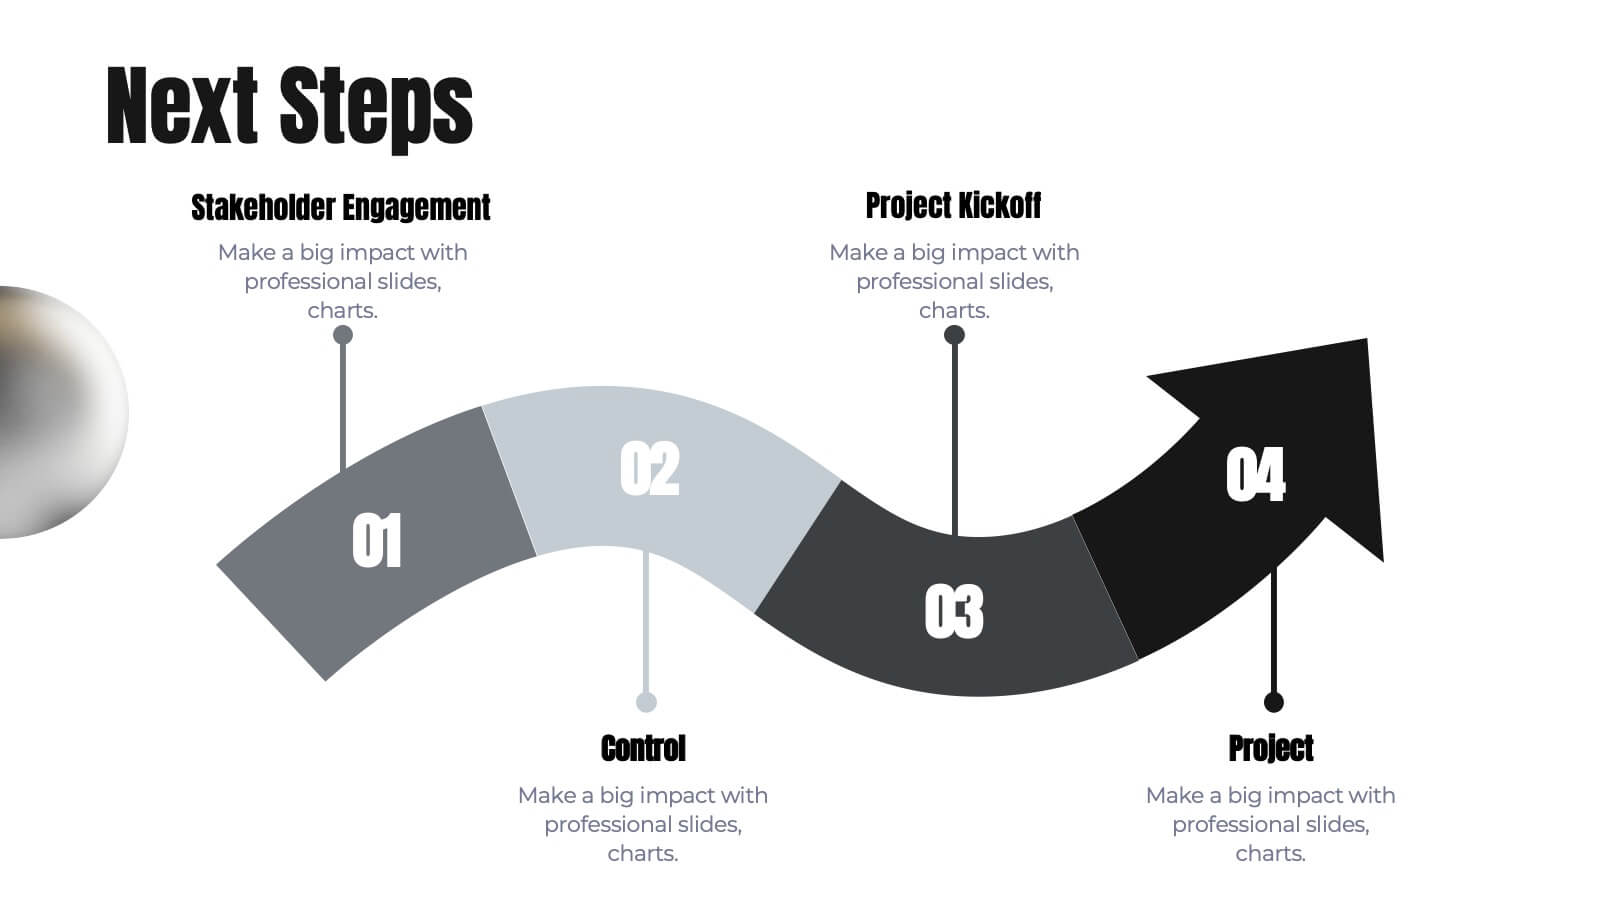
Janus Project Timeline Presentation
Craft a seamless project plan with this sleek and professional presentation template! Designed to guide you through every step, from project overview and scope of work to risk management and resource allocation, this template covers all the essentials. It's perfect for keeping your team on track with clear deliverables, timelines, and evaluation criteria. Compatible with PowerPoint, Keynote, and Google Slides for effortless presentations.


5 diapositivas
Industry Competition Assessment with Porter’s Forces Presentation
Present your competitive landscape with this Porter’s Five Forces slide. Designed for strategic analysis, it visually maps key industry forces—New Entrants, Supplier Power, Buyer Power, Substitutes, and Competitive Rivalry—around a central business icon. Fully customizable and ideal for PowerPoint, Keynote, or Google Slides to elevate professional presentations.


5 diapositivas
Annual Achievements and Highlights Presentation
Celebrate your progress with the Annual Achievements and Highlights Presentation. This timeline-style layout guides viewers along a visual path of milestones year by year. Each pin represents a key accomplishment, backed by icons and editable text for context. Perfect for end-of-year reviews or company retrospectives. Compatible with PowerPoint, Google Slides, and Canva.


5 diapositivas
Smart Agriculture and Sustainability Trends
Highlight the future of farming with the Smart Agriculture and Sustainability Trends Presentation. This slide features a sleek visual progression of plant growth stages, symbolizing innovation, eco-conscious development, and data-driven agricultural trends. Ideal for sustainability reports, agritech proposals, and environmental briefings. Fully editable and compatible with PowerPoint, Keynote, and Google Slides.


6 diapositivas
System Maintenance and Support Presentation
Streamline your technical processes with the System Maintenance and Support Presentation. This slide features a clean alphabetical list layout (A–E) paired with icons and concise text areas—ideal for illustrating maintenance protocols, support categories, or troubleshooting stages. The right-side wrench graphic adds a visual metaphor for IT upkeep. Fully editable in PowerPoint, Keynote, and Google Slides.


8 diapositivas
Dynamic Pricing Strategies Presentation
Navigate market complexities with our 'Dynamic Pricing Strategies' presentation template, perfect for outlining variable pricing models that respond to market demands. This versatile tool is ideal for businesses looking to adapt and thrive, with designs compatible with PowerPoint, Keynote, and Google Slides.


6 diapositivas
Workload Distribution and Calendar Plan Presentation
Stay on top of weekly responsibilities with the Workload Distribution and Calendar Plan Presentation. This visual planning template helps teams clearly assign tasks across days of the week, making it easy to organize schedules and boost productivity. Fully editable in PowerPoint, Keynote, and Google Slides.


23 diapositivas
Skycrest Business Idea Pitch Deck Presentation
Present your innovative business idea with this bold pitch deck, featuring sections for problem statement, solution, business model, and financial projections. Ideal for capturing investor attention, this template supports PowerPoint, Keynote, and Google Slides, making it perfect for impactful presentations across multiple platforms.


6 diapositivas
Data Table Format Presentation
Bring clarity to your data with a clean, modern layout that helps your audience compare details at a glance. This presentation is perfect for pricing, feature breakdowns, or structured business insights, keeping information organized and easy to read. Fully compatible with PowerPoint, Keynote, and Google Slides.


5 diapositivas
Project Risk Management Framework Presentation
Visualize challenges before they arise with this dynamic framework designed to map, assess, and mitigate project risks efficiently. Its circular layout highlights every critical stage, helping you communicate strategies clearly and professionally. Fully editable and compatible with PowerPoint, Keynote, and Google Slides for effortless customization and presentation flexibility.


23 diapositivas
Staccato Business Plan Presentation
Present your business plan with this elegant and structured template, designed for clarity and professionalism. This presentation layout provides all the essential elements for showcasing your strategy, goals, and objectives, ideal for entrepreneurs, startups, and established businesses alike. Featuring dedicated sections for company overview, panel discussions, workshop sessions, and closing remarks, the slides are organized for seamless storytelling. Highlight your team, workshop takeaways, and key resources with polished visuals and easy-to-follow layouts. The Q&A and networking break slides allow you to engage your audience effectively while maintaining a professional tone. Fully compatible with PowerPoint, Google Slides, and Keynote, this template is fully editable, allowing you to customize colors, text, and images to reflect your brand. Deliver your business ideas confidently with a presentation template that ensures a strong, lasting impression.


5 diapositivas
Essential Education Infographics
Education is a key driver of individual and societal progress, and investing in education is essential for building a better future for all. This vertical infographic template is designed for educators, trainers, and other professionals who want to create informative and visually appealing educational materials. The theme of the template is centered around education, with bright and colorful illustrations of books, pencils, and other educational tools. Compatible with PowerPoint, Keynote, and Google Slides. Each slide is fully editable, allowing you to easily change the colors, fonts, and content to suit your needs.