


Características


¿Tienes alguna pregunta?
Recomendar


12 diapositivas
Geometric Shapes Design Slide Presentation
Make your content stand out with a bold, modern layout built from clean geometric forms that guide the viewer’s eye effortlessly. This presentation helps you organize ideas, highlight key points, and create a polished visual flow without distractions. Fully editable and compatible with PowerPoint, Keynote, and Google Slides.


5 diapositivas
Cost Analysis and Budgeting
Visualize financial shifts with clarity using the Cost Analysis and Budgeting Presentation. This slide template uses a dual-stack design to contrast cost reductions against budget increases, supported by percentage change labels and layered visual elements. Ideal for finance teams, operations reviews, or executive summaries, this layout highlights five customizable categories per stack. Compatible with PowerPoint, Keynote, and Google Slides, it's fully editable to match your company branding and color palette.


7 diapositivas
McKinsey 7S Model Infographic Presentation Template
The McKinsey 7S model is a management framework developed by the consulting firm McKinsey & Company. The model consists of seven interdependent factors that are important for an organization's success: strategy, structure, systems, shared values, skills, staff, and style. The template can be used to visualize the 7S model hierarchy and the importance of each component to your business. This inventive presentation is designed to take an economic approach, If you’re interested in taking this strategic step to evaluating your processes and measuring performance, this presentation is for you.


7 diapositivas
IT Architecture Infographics Presentation Template
Our IT Architecture Infographic template is designed to help you create a quick, easy and simple-to-understand presentation that explains your IT Architecture. This template will provide you with material to set out your ideas and give an overview of what’s important so that you can rapidly make progress in this area. This is a perfect choice to impress your clients, teachers, students, or employees. This presentation creates an extravagant feeling that will invite investors and clients to become invested in your project. This template is well-organized and perfect for your next presentation!


6 diapositivas
Stock Market Investment Infographics
Explore the world of Stock Market Investment with our customizable infographic template. This template is fully compatible with popular presentation software like PowerPoint, Keynote, and Google Slides, allowing you to easily customize it to illustrate and communicate various aspects of stock market investing. The Stock Market Investment infographic template offers a visually engaging platform to outline the key principles, strategies, and considerations for successful investing in stocks. Whether you're an investor, financial advisor, educator, or simply interested in building wealth through the stock market, this template provides a user-friendly canvas to create informative presentations and educational materials. Enhance your knowledge of Stock Market Investment with this SEO-optimized infographic template, thoughtfully designed for clarity and ease of use. Customize it to showcase investment strategies, risk management techniques, market analysis, and the importance of diversification, ensuring that your audience gains valuable insights into this dynamic field. Start crafting your personalized infographic today to embark on your stock market investment journey with confidence.


5 diapositivas
Animal Health and Veterinary Care Presentation
Promote optimal animal health and veterinary practices with our comprehensive presentation template. Designed to facilitate discussions on veterinary care, this template is perfect for educational seminars, veterinary training, or healthcare meetings, ensuring all aspects of animal welfare are covered effectively.


26 diapositivas
Entrepreneurship 101 Professional Presentation
This template offers a modern, professional framework for presentations about Entrepreneurship 101. It combines a clean, contemporary design with a palette of cool blues and muted reds, setting a tone that's both creative and serious—just right for the innovative spirit of entrepreneurship. Within its slides, you'll find all the tools needed to outline the essentials of starting a new business, from identifying opportunities to understanding market trends. Perfect for aspiring entrepreneurs, business school classes, or startup workshops, the template includes varied slide types: team introductions, big ideas, comparative analyses, and growth charts. The slides also feature infographics for brainstorming sessions, process flows for business operations, and timeline representations for strategic planning. Designed for adaptability, the template works seamlessly with PowerPoint, Keynote, and Google Slides, ensuring your entrepreneurial vision can be shared with clarity and impact.


4 diapositivas
Stakeholder Analysis Mapping Strategy Presentation
Turn complex stakeholder relationships into clear, actionable insights with this dynamic and modern quadrant design. Ideal for visualizing influence, communication strategies, and engagement priorities, it helps teams build stronger collaboration frameworks. Fully editable and compatible with PowerPoint, Keynote, and Google Slides for effortless professional use.


6 diapositivas
Business Case Studies Analysis Presentation
Turn insights into impact with this clean and professional layout designed to showcase real-world business challenges and results. Perfect for summarizing objectives, methods, and key outcomes, it helps you tell a clear and compelling story. Fully compatible with PowerPoint, Keynote, and Google Slides for easy customization and presentation.


7 diapositivas
Stakeholder Impact Analysis Infographic Presentation
Stakeholder analysis is a tool used to identify and assess the interests, needs, and concerns of different stakeholders related to a particular project or initiative. This template can provide a comprehensive overview of the stakeholders involved in a project including their interests and level of influence. Use this template to include information on the relationships between stakeholders, as well as the potential risks and opportunities associated with their involvement. It is designed in PowerPoint, Keynote, and Google Slides so you can use the one that works best for your team and edit.


6 diapositivas
Best Pricing Tables Infographics
Maximize your product or service presentation with our Best Pricing Tables infographic template. This template is fully compatible with popular presentation software like PowerPoint, Keynote, and Google Slides, allowing you to easily customize it to showcase your pricing structures effectively. The Best Pricing Tables infographic template offers a visually appealing platform to display different pricing tiers, features, and benefits. Whether you're a business owner, marketer, or sales professional, this template provides a user-friendly canvas to create pricing tables that captivate your audience. Optimize your pricing strategy with this SEO-optimized Best Pricing Tables infographic template, thoughtfully designed for clarity and ease of use. Customize it to highlight competitive advantages, discounts, and special offers, helping you convert potential customers into loyal clients. Start crafting your personalized pricing tables today to boost your sales and revenue!


7 diapositivas
Master Six Sigma Infographic Presentation
Six Sigma is a methodology used by organizations to improve their business processes and eliminate defects. Use this template to explore the key concepts of Six Sigma and how it can be applied in different industries. This templates include helpful illustrations, charts and tips which allow you to present information in a clear and concise way that makes it easy for your audience to understand and take notes. This template has been made using modern fonts, appealing color combinations and simple layouts. The clean and simple design is compatible with Powerpoint, Keynote and Google Slides.


8 diapositivas
Vision-Oriented Goal Roadmap Presentation
Achieve alignment with the Vision-Oriented Goal Roadmap Presentation. Featuring a clear bullseye target and directional arrows, this layout highlights priority goals and action steps. Perfect for strategic planning, leadership briefings, or team objectives. Easily editable in PowerPoint, Keynote, and Google Slides to match your brand and vision.


7 diapositivas
Decision Process Infographic Presentation
A Structured Decision Process is crucial for individuals and organizations to make informed and effective decisions. This is a flexible template that allows you to create your presentation using PowerPoint, Google Slides or Keynote. It includes decision illustrations so that you have everything you need to explain the decision and to present the pros and cons of each option. With a stylish design and eye-catching elements you can use this infographic for presentations of any kind. For promoting a new product or service, making recommendations or simply to explain your next steps and decisions.
20 diapositivas
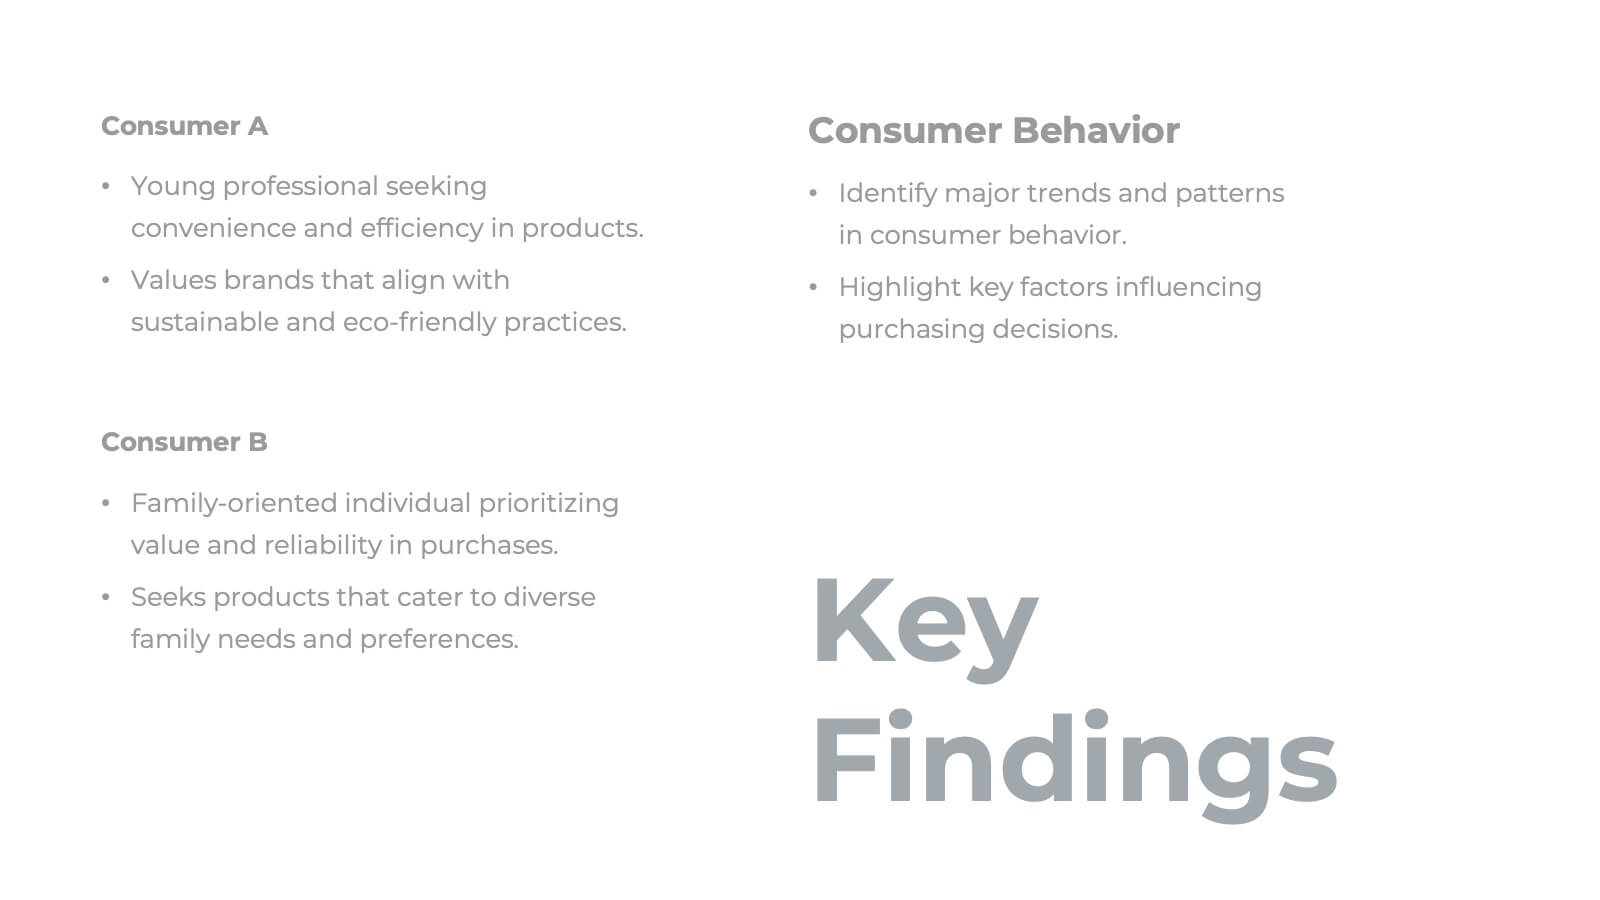
Malachite Research Proposal Presentation
Present your research findings with clarity and professionalism using this structured research presentation template! Covering all essential elements, from research objectives and methodology to key findings and implications, this template ensures your work is communicated effectively. It's perfect for academic, corporate, or scientific presentations. Compatible with PowerPoint, Keynote, and Google Slides, it's versatile and ready for your next project.


5 diapositivas
Messaging Strategy and Flow Presentation
Communicate with clarity using this streamlined messaging strategy and flow presentation template. Designed to visualize the stages of message planning—from audience segmentation to final delivery—this layout helps teams align communication goals and channels. Ideal for marketing, PR, or internal comms presentations. Fully compatible with PowerPoint, Keynote, and Google Slides.


5 diapositivas
Dynamic Pricing Strategies
Make pricing strategy look smart and data-driven with this bold, modern infographic template. Designed to explain how pricing evolves with demand, value, and profit margins, this slide visually guides viewers through key steps in your dynamic pricing model. Fully editable and compatible with PowerPoint, Keynote, and Google Slides for seamless use.