


Características


¿Tienes alguna pregunta?
Recomendar


4 diapositivas
Global Business Distribution Layout Presentation
Visualize your company’s international footprint with this Global Business Distribution Layout. Perfect for showcasing market reach, branch networks, or regional performance. Features a clean world map design with customizable highlight zones. Fully editable in PowerPoint, Keynote, and Google Slides—ideal for corporate overviews, investor decks, and business expansion presentations.


26 diapositivas
Melo Presentation Template
Are you looking for a presentation to make your product stand out? Melo is a beautifully elegant presentation with modern elements and light neutral color palette. Perfect for furniture brands, or any one looking for a modern presentation. These slides include world maps, company slides, mockups and charts perfect for businesses, this template has everything you'll need. It's simple yet chic design makes it stand out and at the same time keep your audience engaged. This is the perfect choice for businesses, brands or anyone who needs to make a great looking template on their next presentation


4 diapositivas
Science Lab Results and Data Analysis Presentation
Visualize lab data with clarity using this science-themed infographic. Featuring test tubes in a rack, it’s ideal for presenting experimental results, sample comparisons, or analysis summaries. Each tube aligns with icons and key points for easy interpretation. Fully customizable in PowerPoint, Keynote, and Google Slides to match your findings.


7 diapositivas
Personal Roadmap Infographic
A personal roadmap infographic is a visual representation of an individual's goals, plans, achievements, and milestones over a specific period. Embark on a transformative journey through your life with our personal roadmap infographic template. This is a grand adventure, and this visually engaging template is your map to navigate it with purpose and direction. This template is a graphical and often chronological display that helps an individual outline and track their personal development, progress, and objectives. This infographic is fully customizable and compatible with Powerpoint, Keynote, and Google Slides.


8 diapositivas
Breast Cancer Research and Support Presentation
Dive into the pivotal world of healthcare with the Breast Cancer Research and Support template. This presentation emphasizes the critical aspects of breast cancer research and community support, providing a deep exploration of both scientific advancements and compassionate outreach. Suitable for PowerPoint, Keynote, and Google Slides, it effectively highlights statistical data, support resources, and key information with easy-to-understand graphics and dedicated spaces for comprehensive details, ideal for educational sessions and health advocacy meetings.


6 diapositivas
Credit Card Comparison and Benefits Presentation
Clearly compare features, perks, and advantages of different credit card options using this visually dynamic infographic slide. With side-by-side sections, icons, and clean labeling, this layout makes it easy to present pros and cons, reward tiers, or service details. Ideal for financial services, banking presentations, or consumer education. Compatible with PowerPoint, Keynote, and Google Slides for seamless customization.


7 diapositivas
Decision Tree Diagram Infographics
A Decision Tree Diagram is a visual representation of a decision-making process that uses a tree-like structure to map out various possible outcomes and their associated probabilities. This template can be used in fields such as business, economics, and data science to model complex decision-making scenarios. This infographic starts with a single node, representing the initial decision that needs to be taken. From this node, paths extend to other nodes representing possible outcomes that could occur as a result of the initial decision. The final nodes of the diagram represent the end results.


23 diapositivas
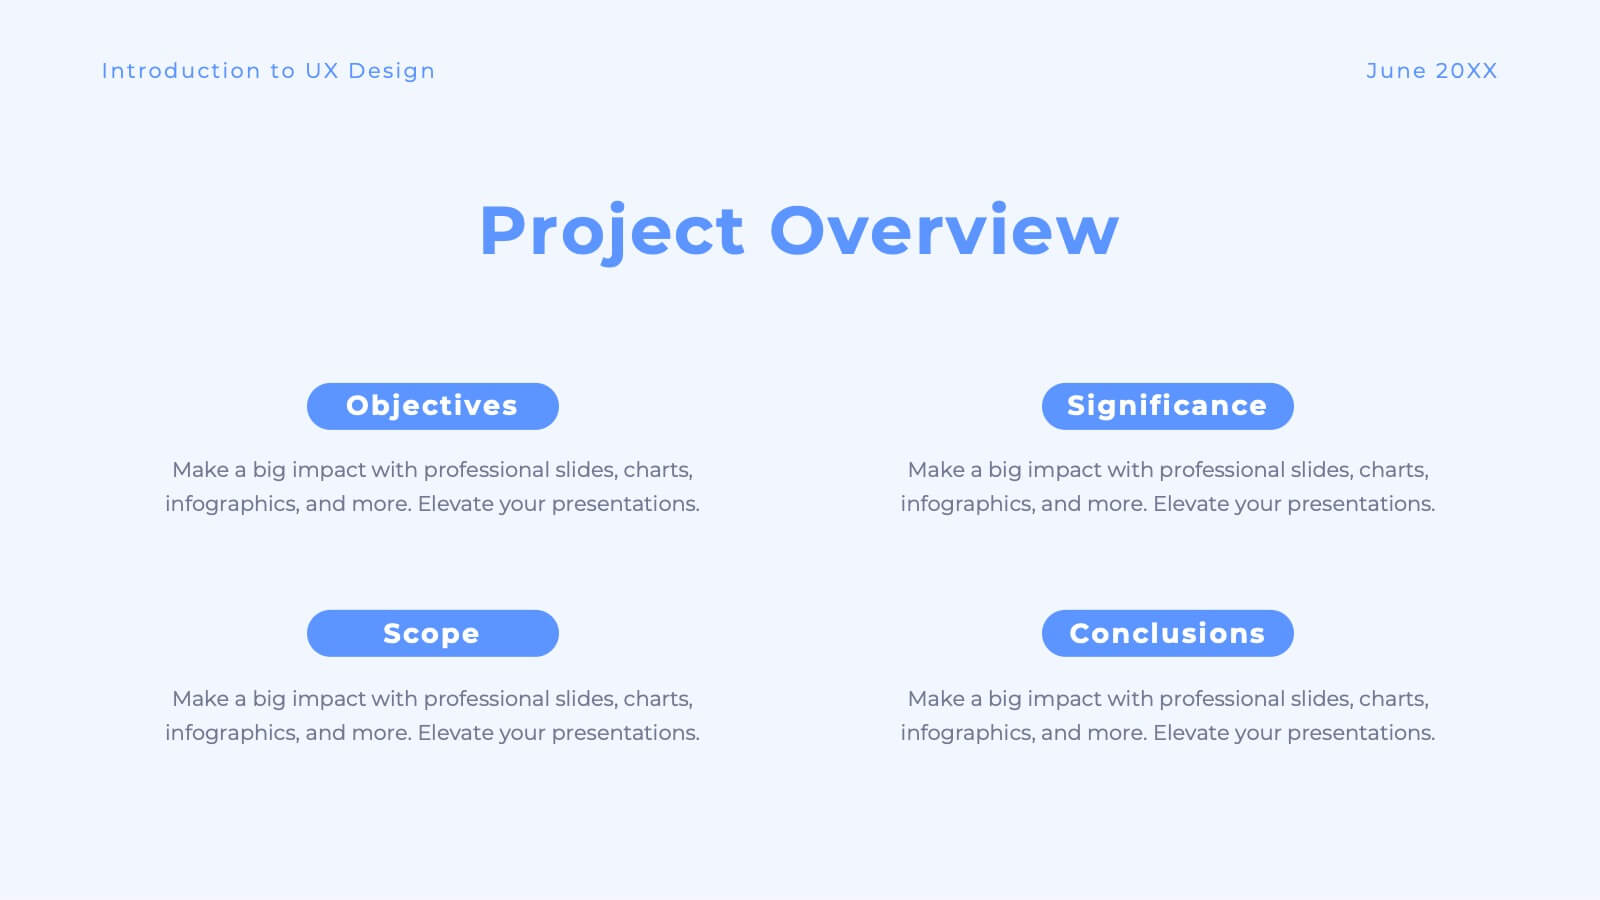
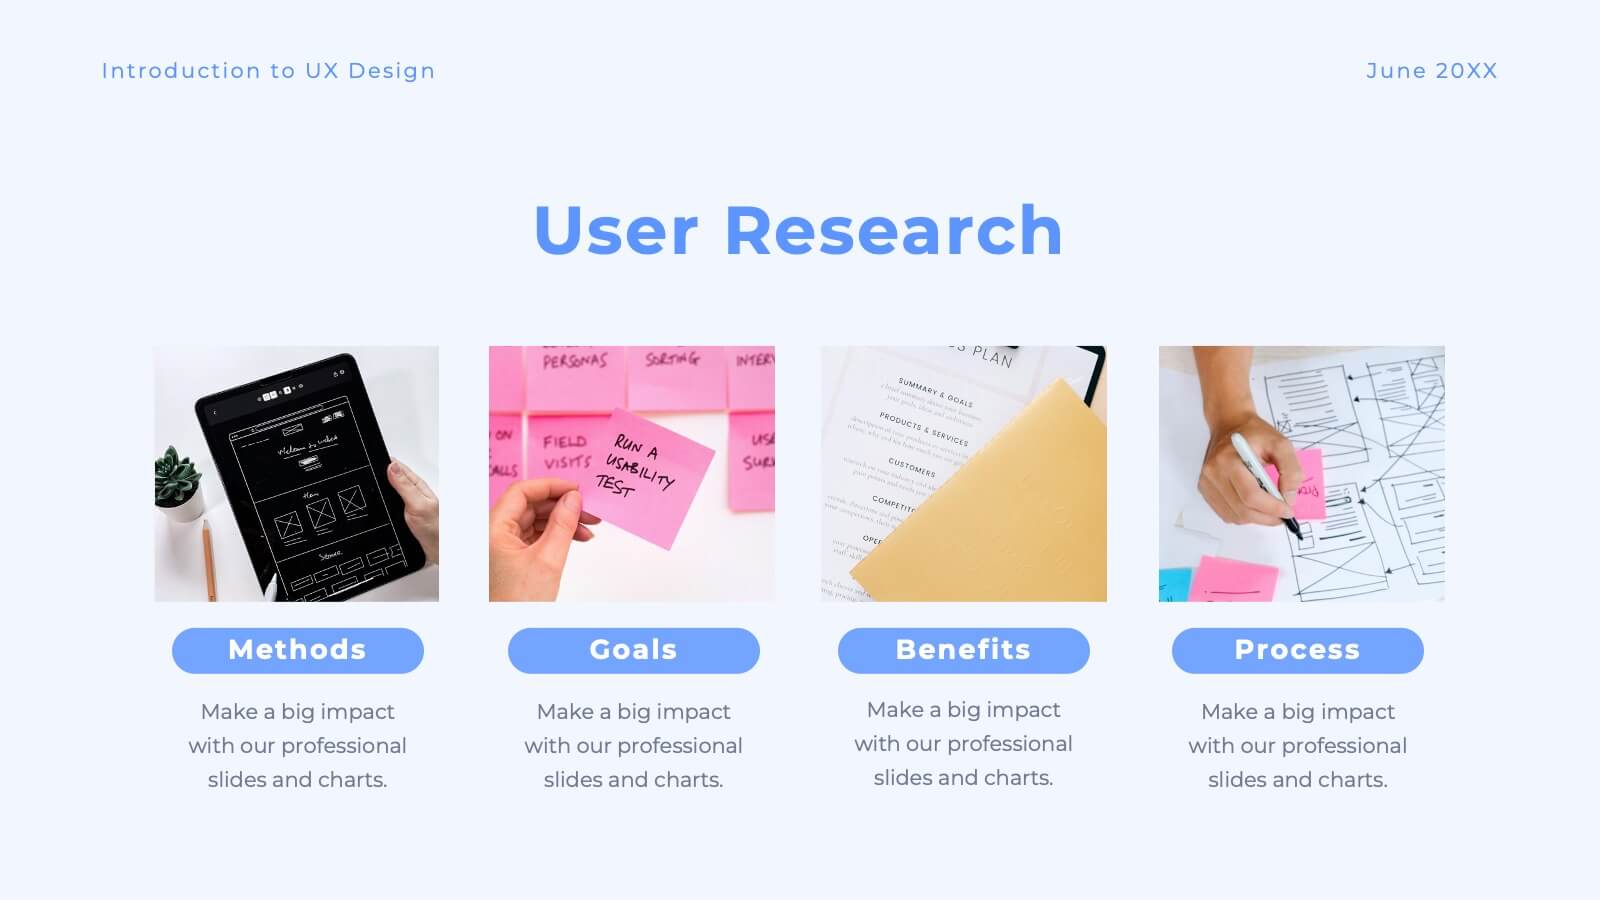
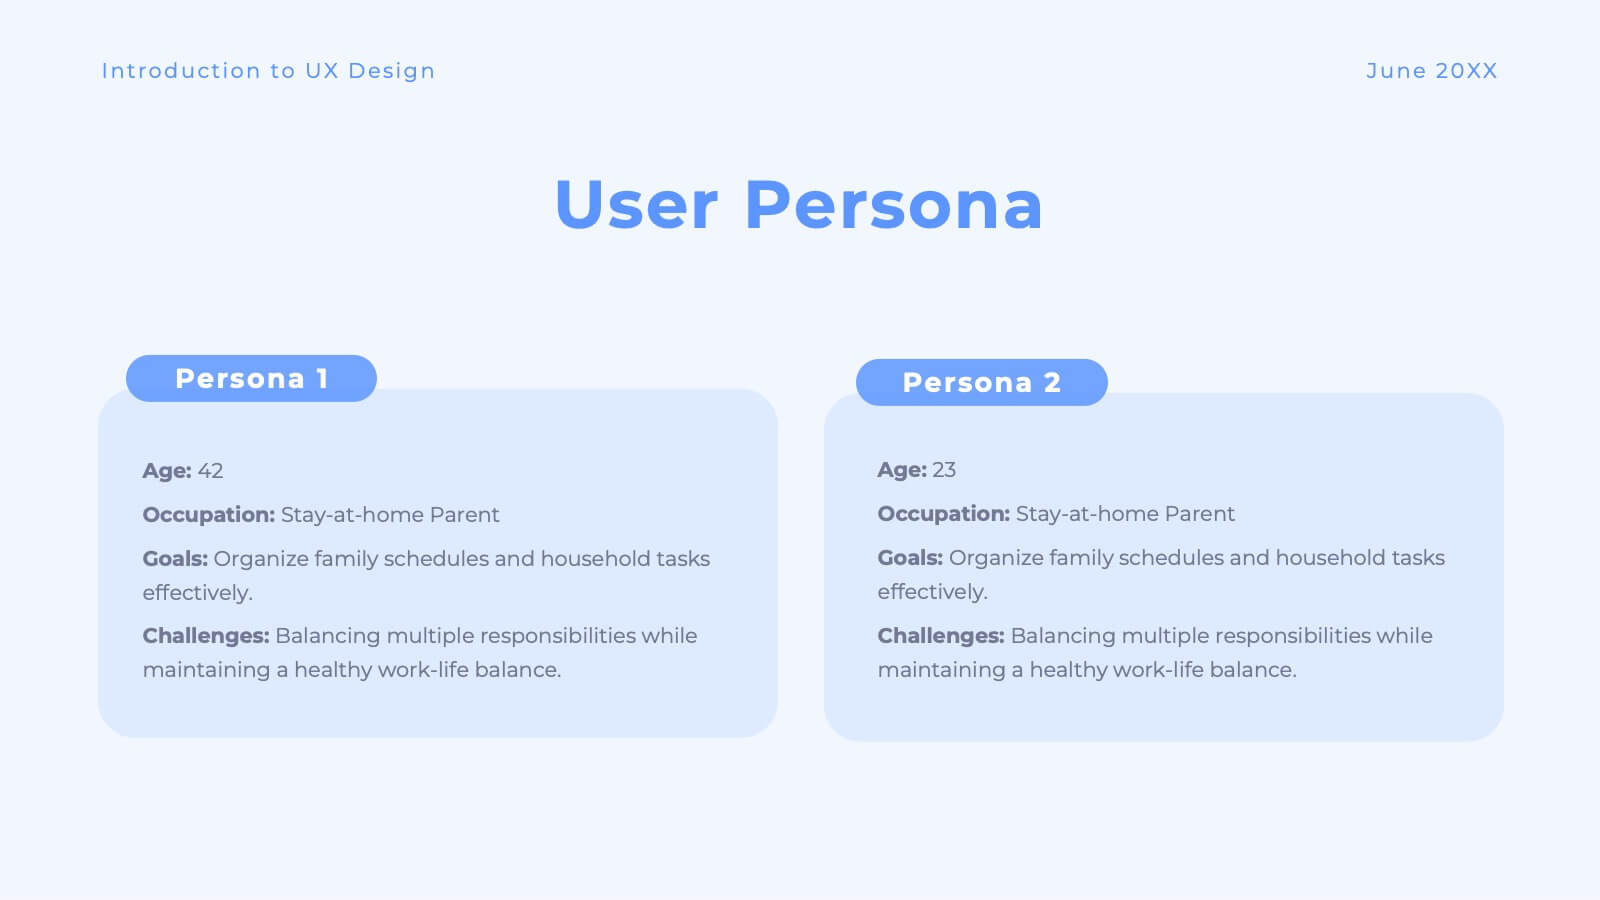
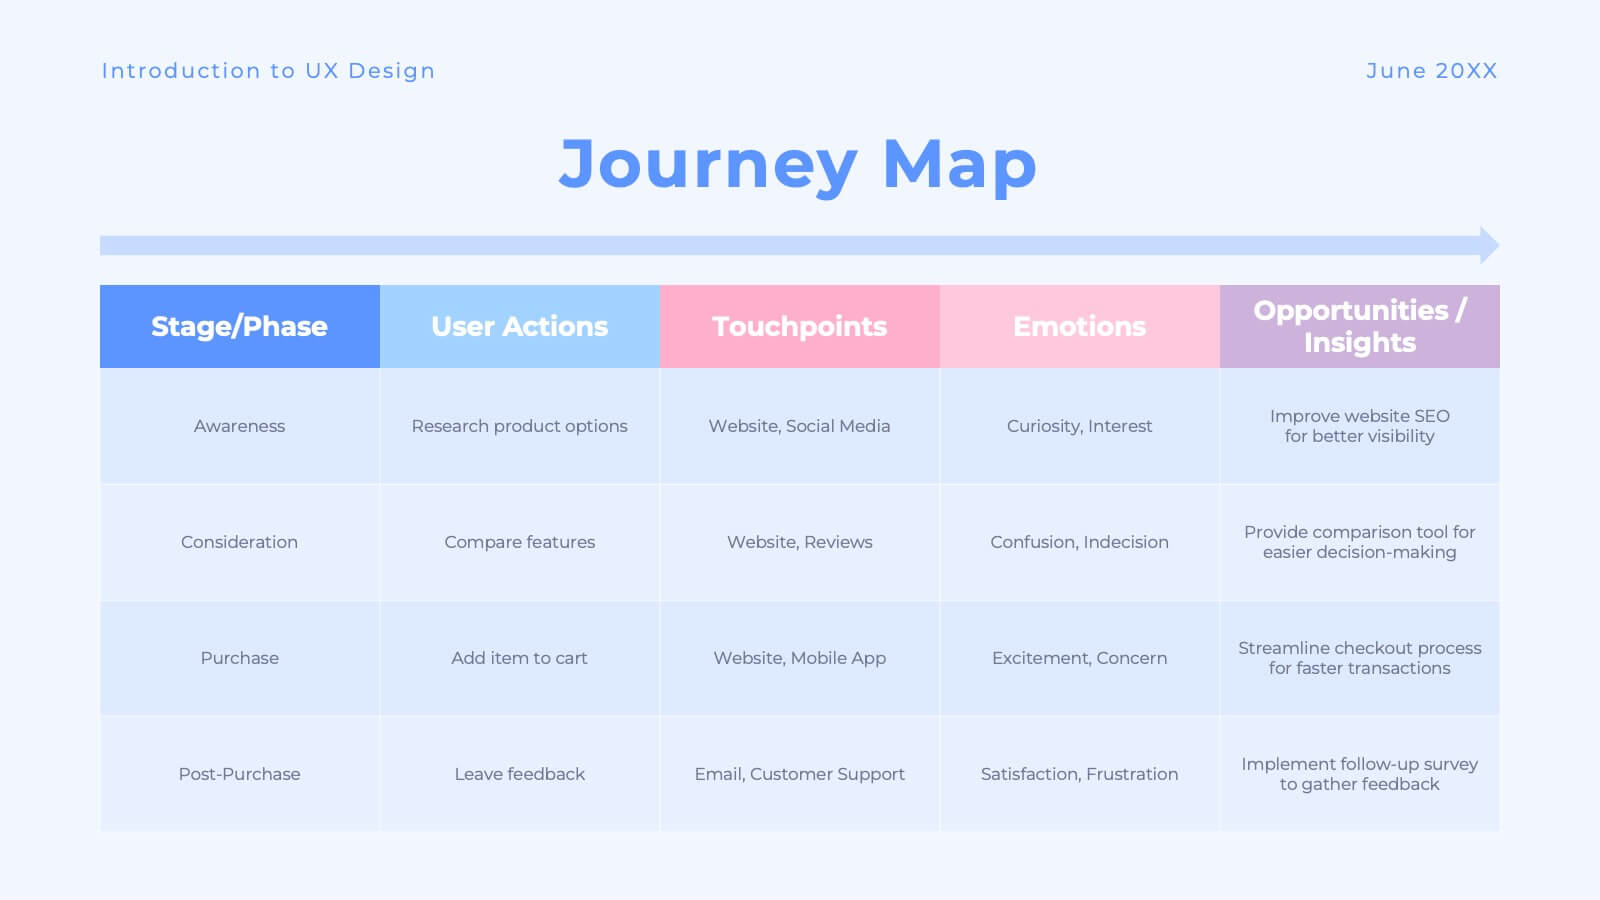
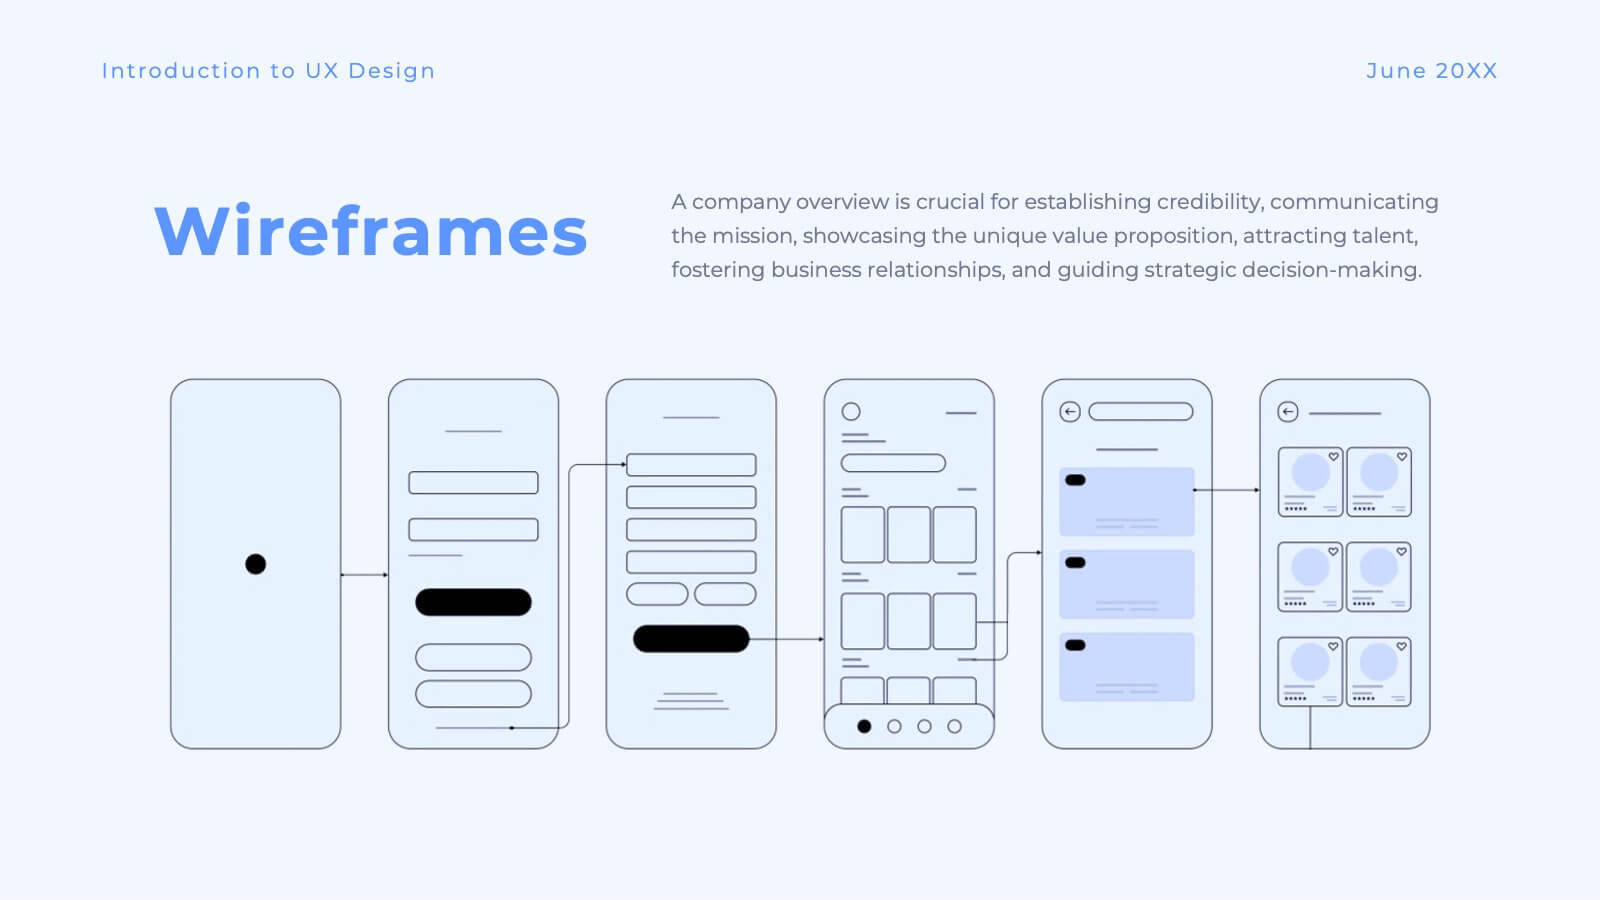
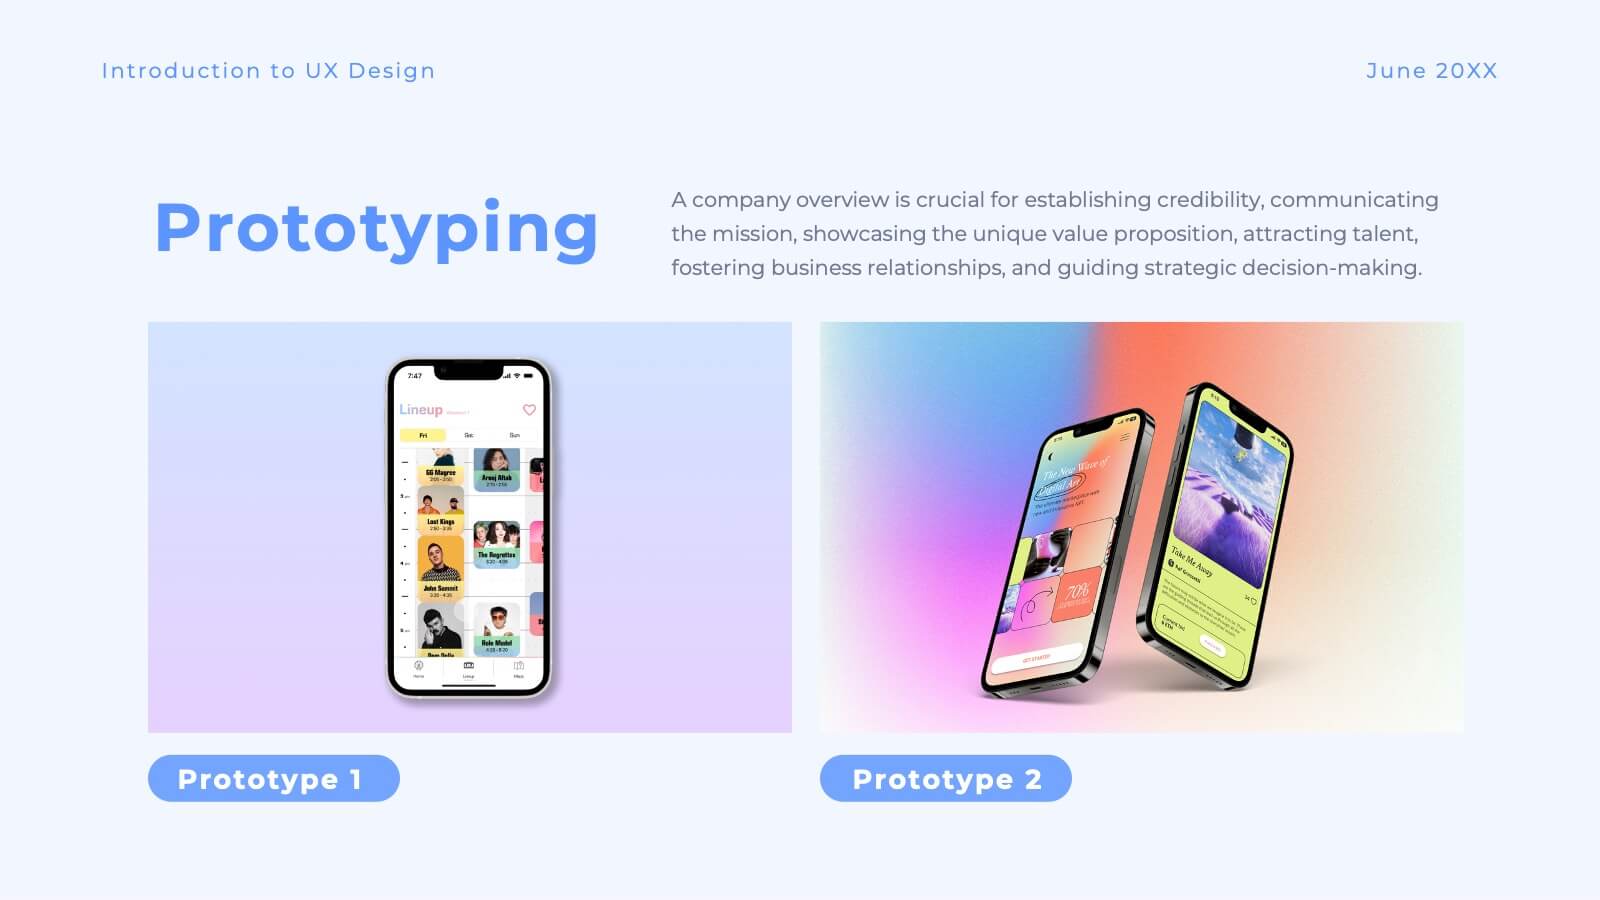
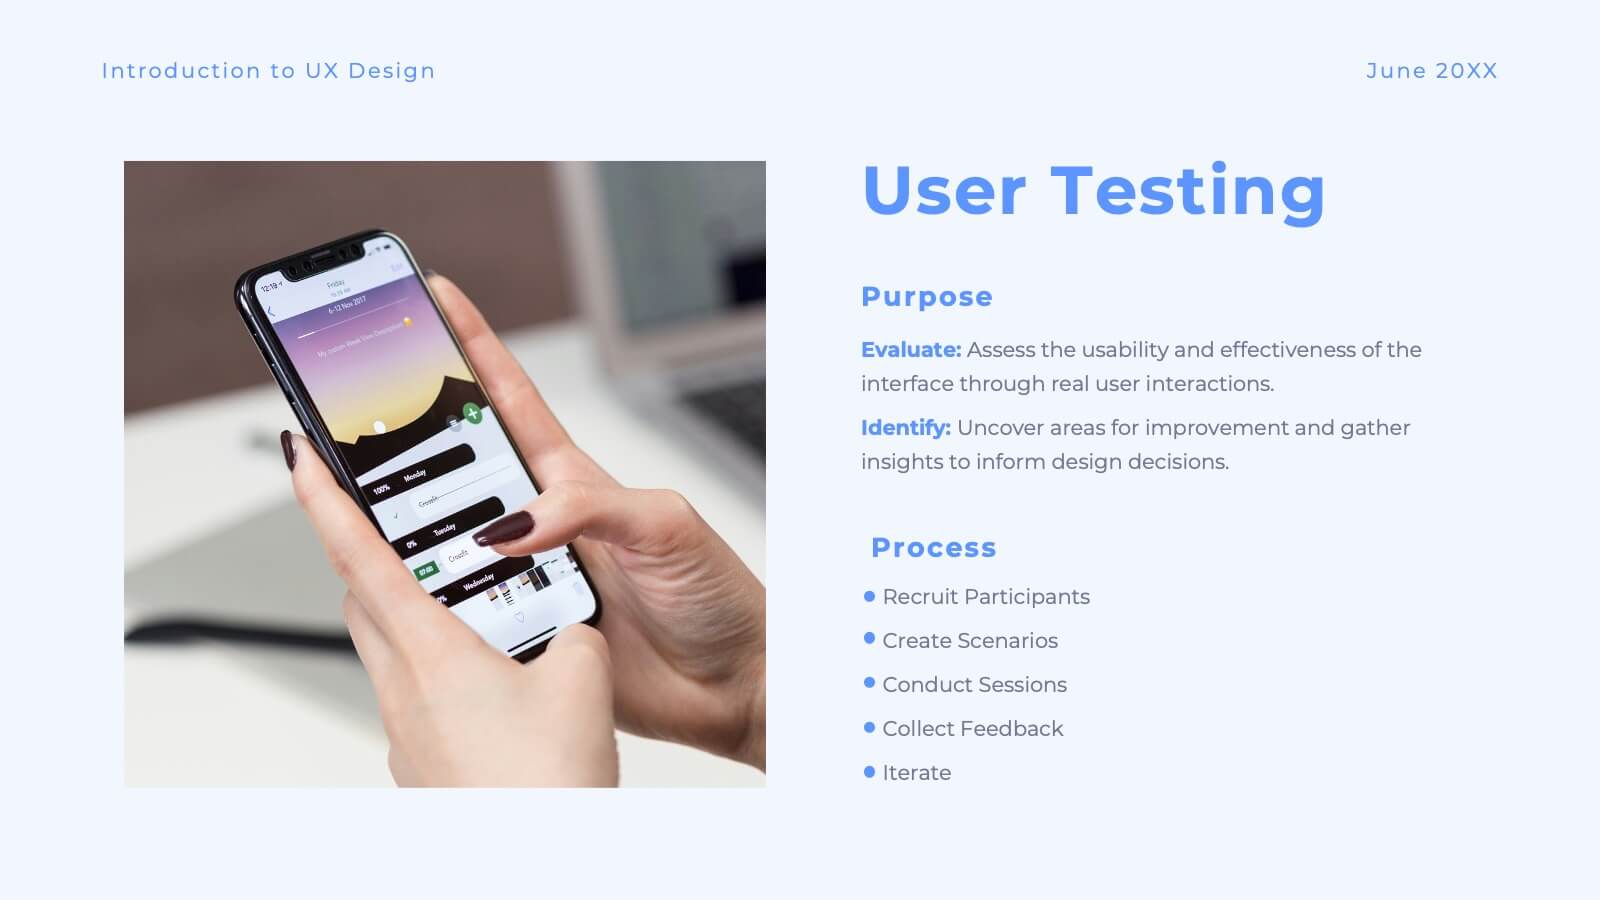
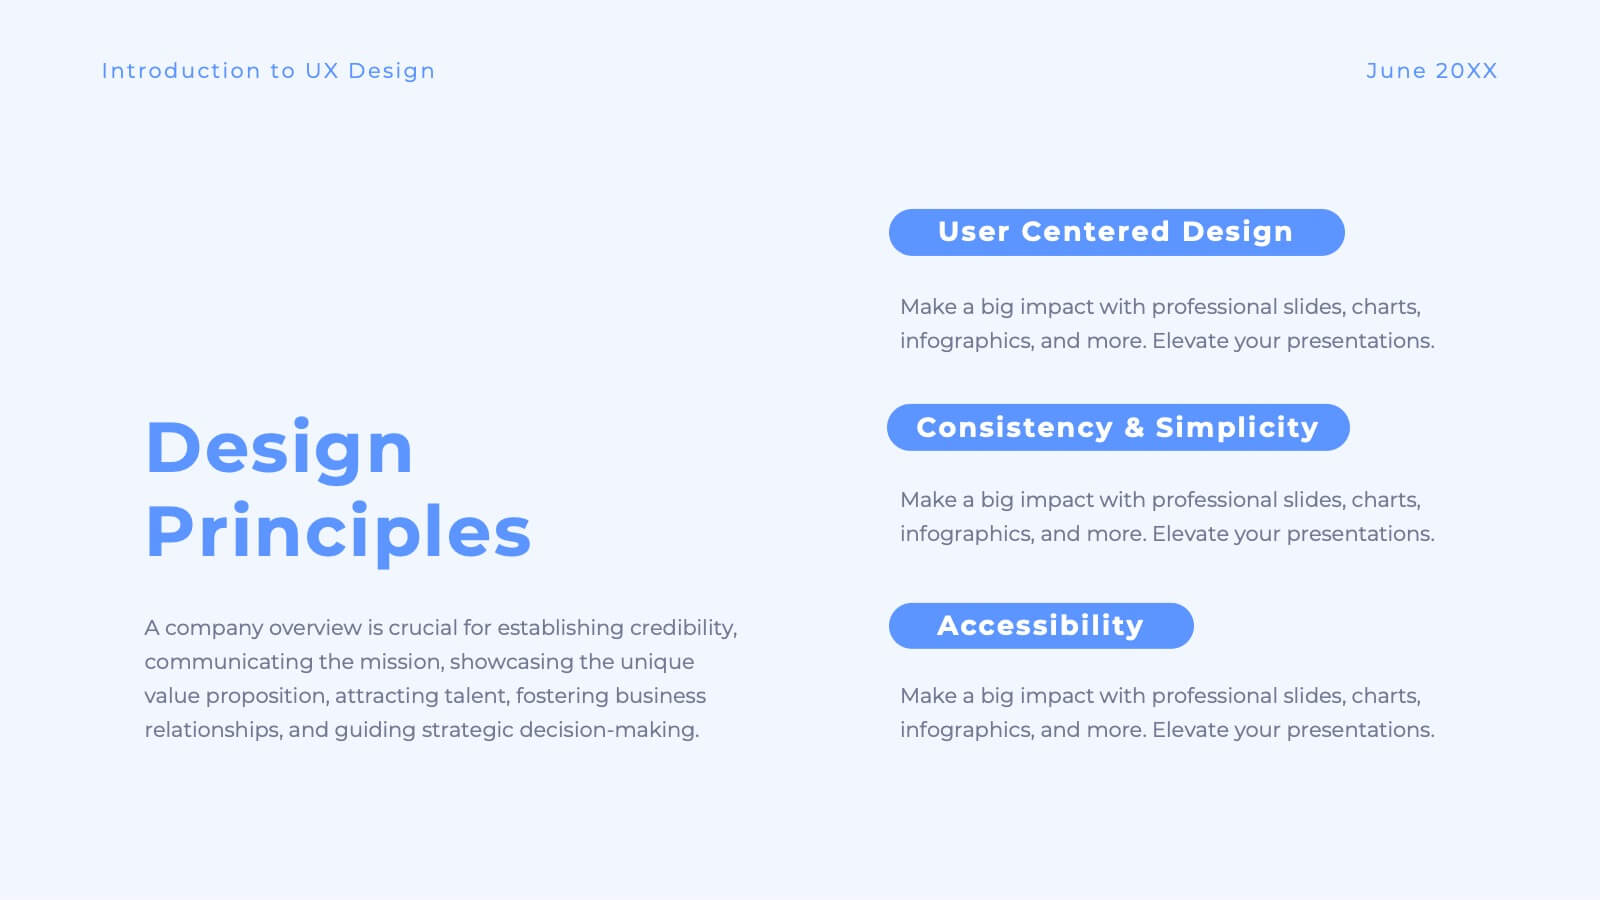
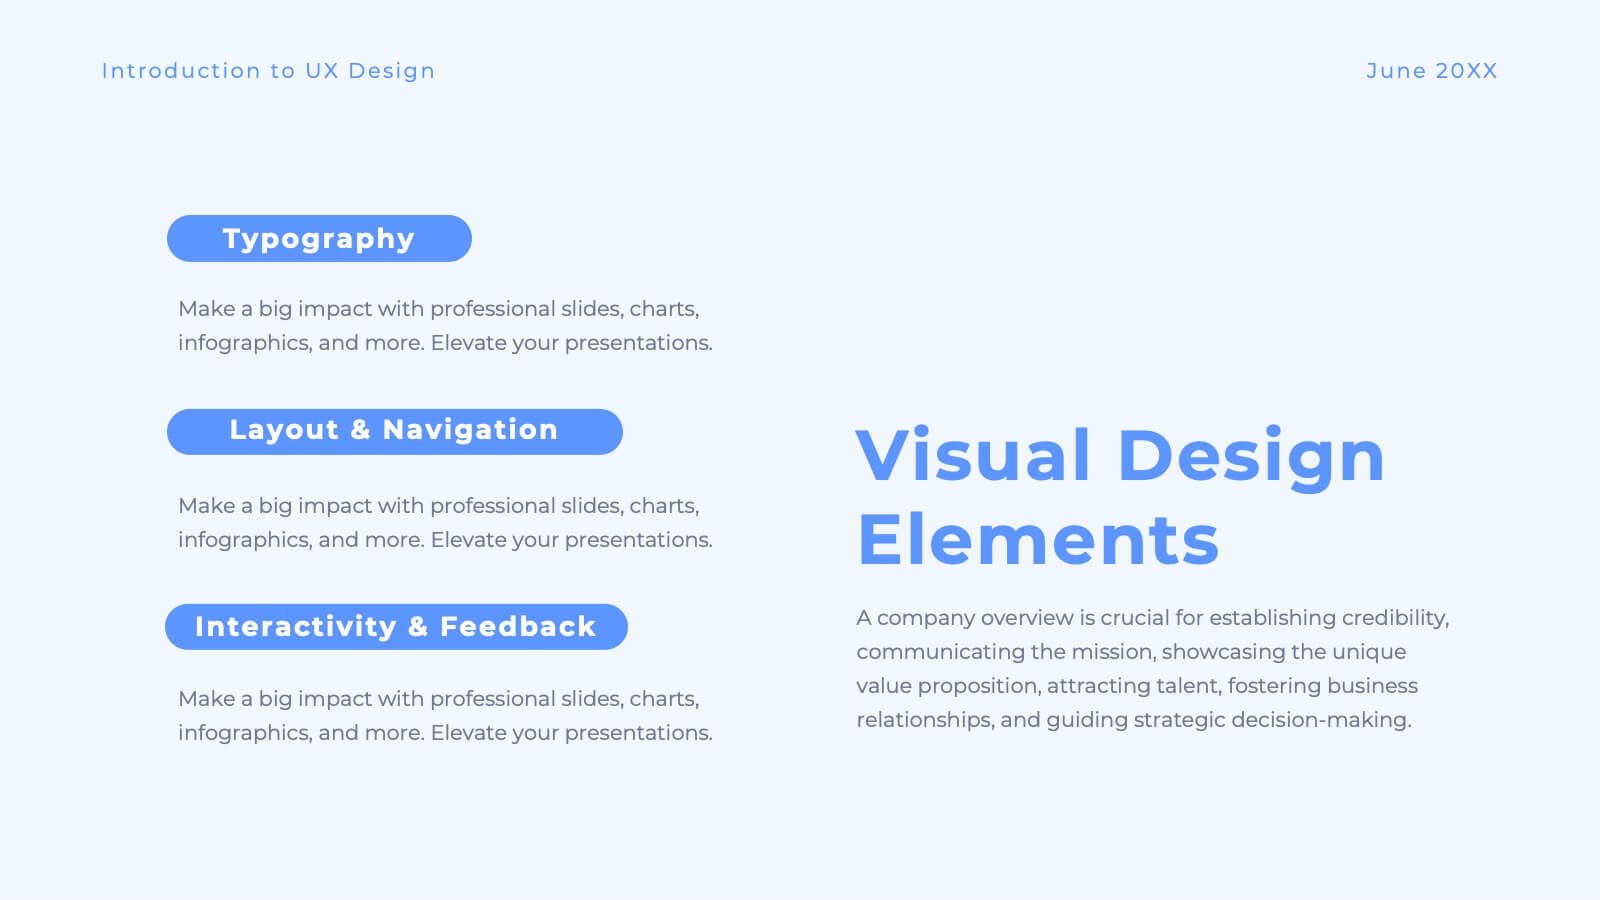
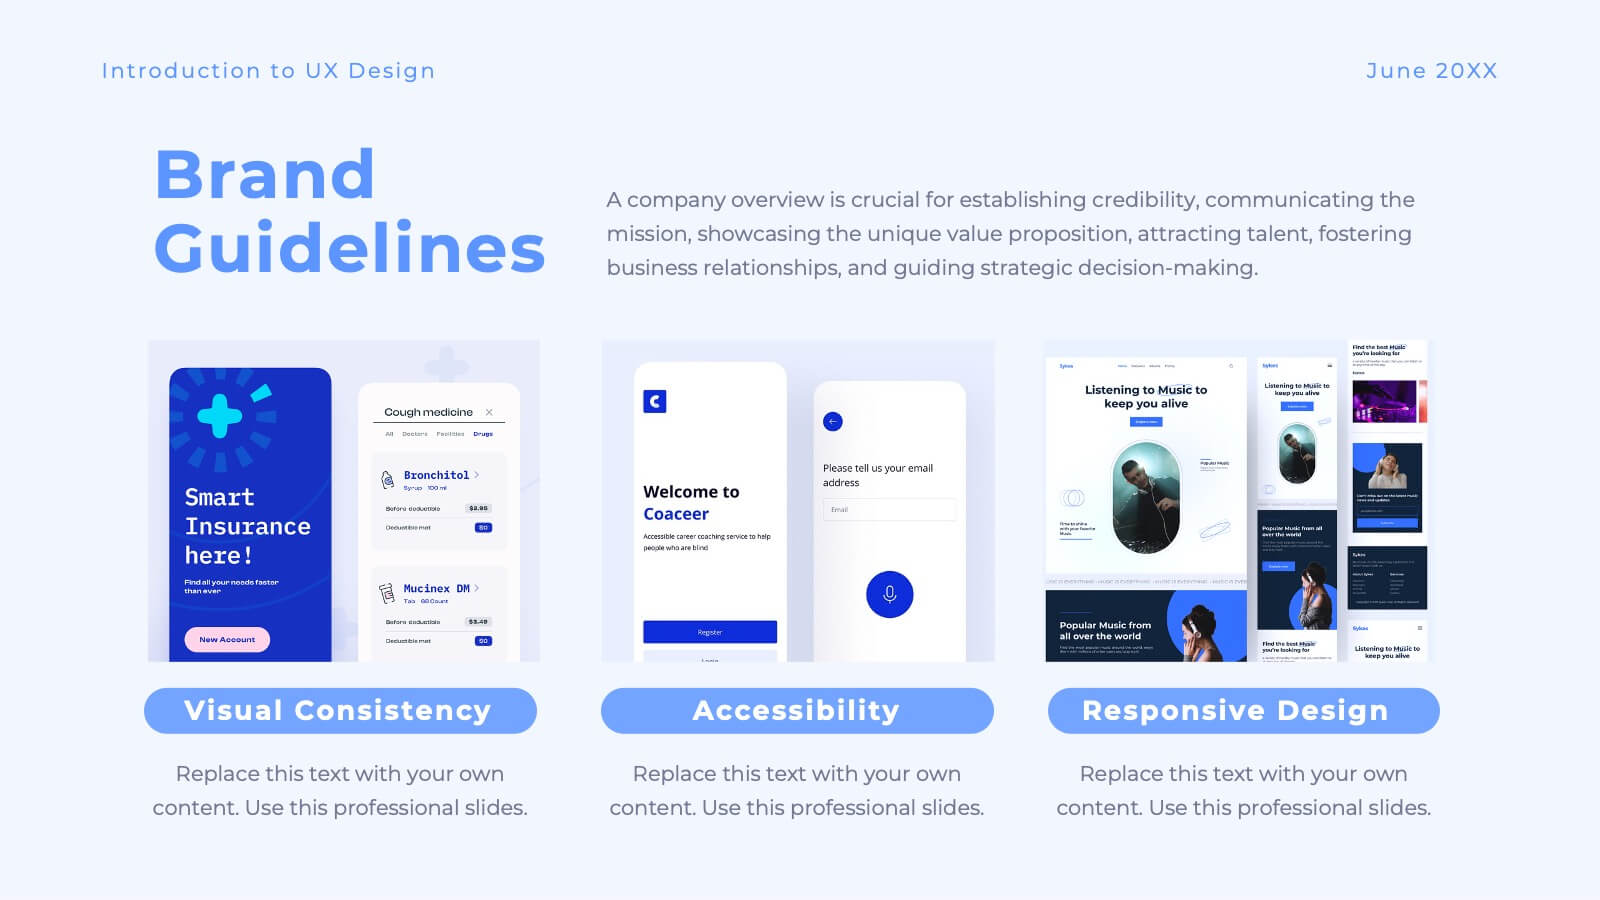
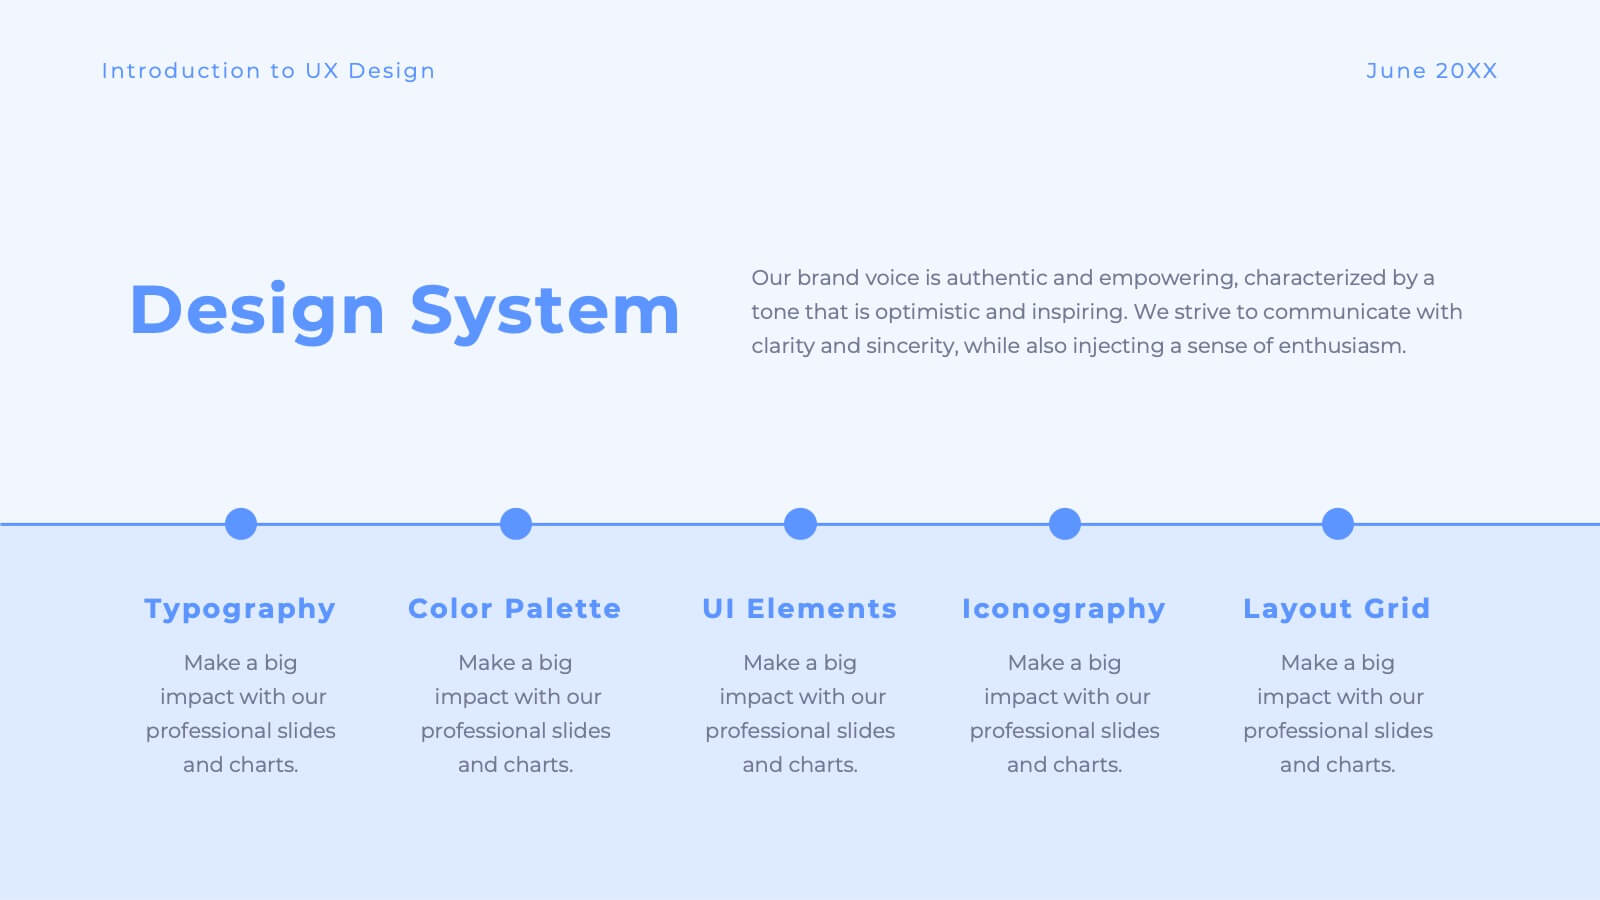
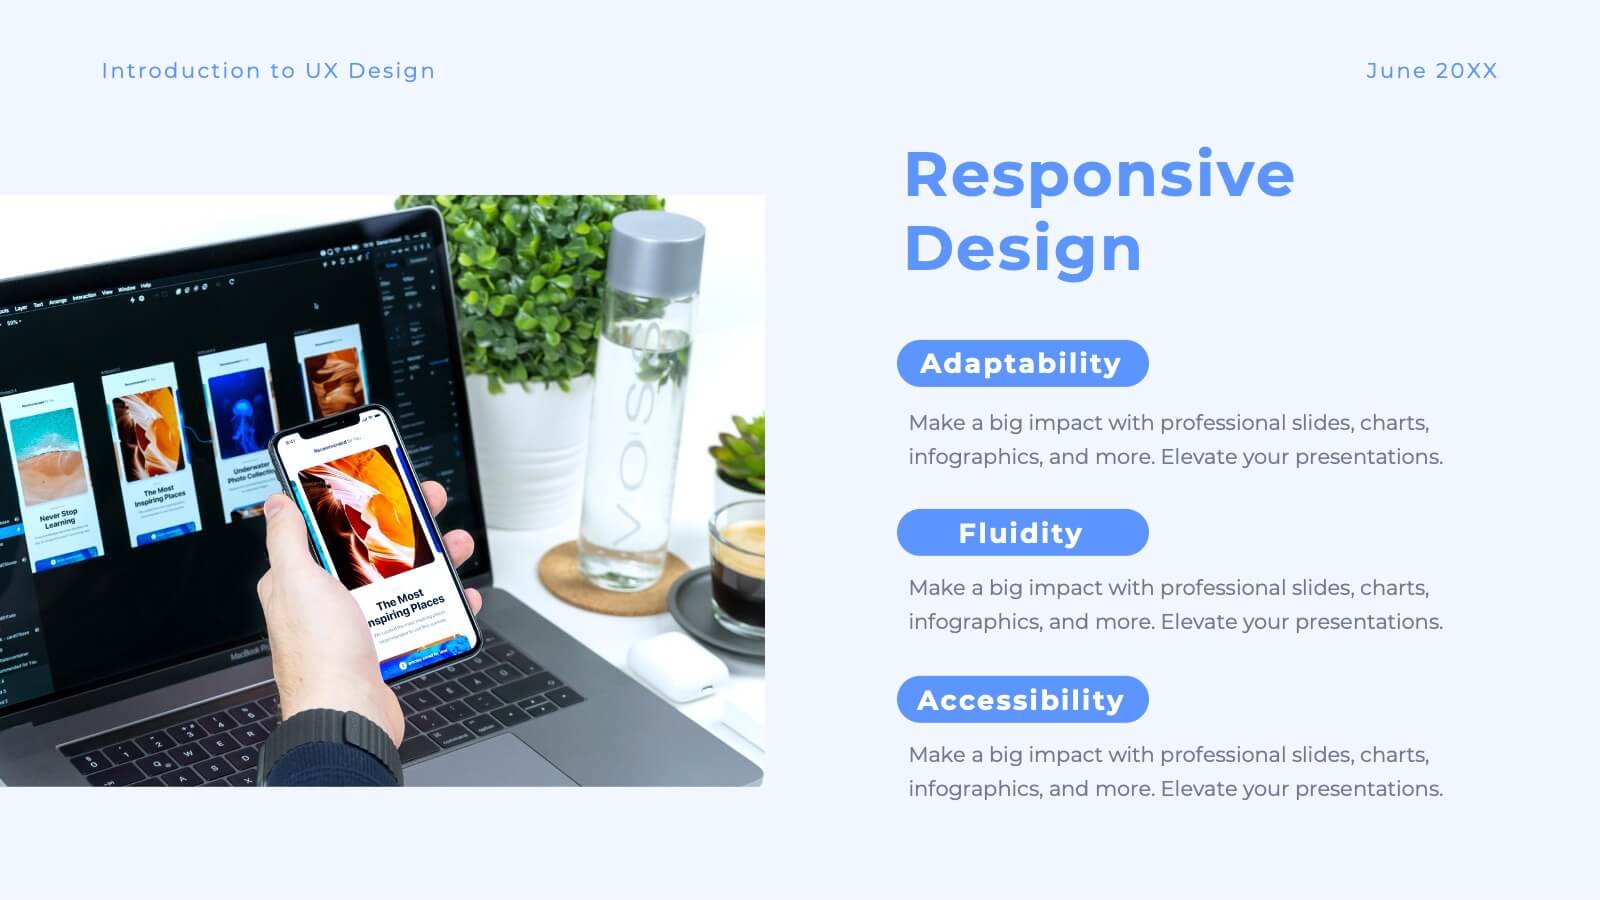
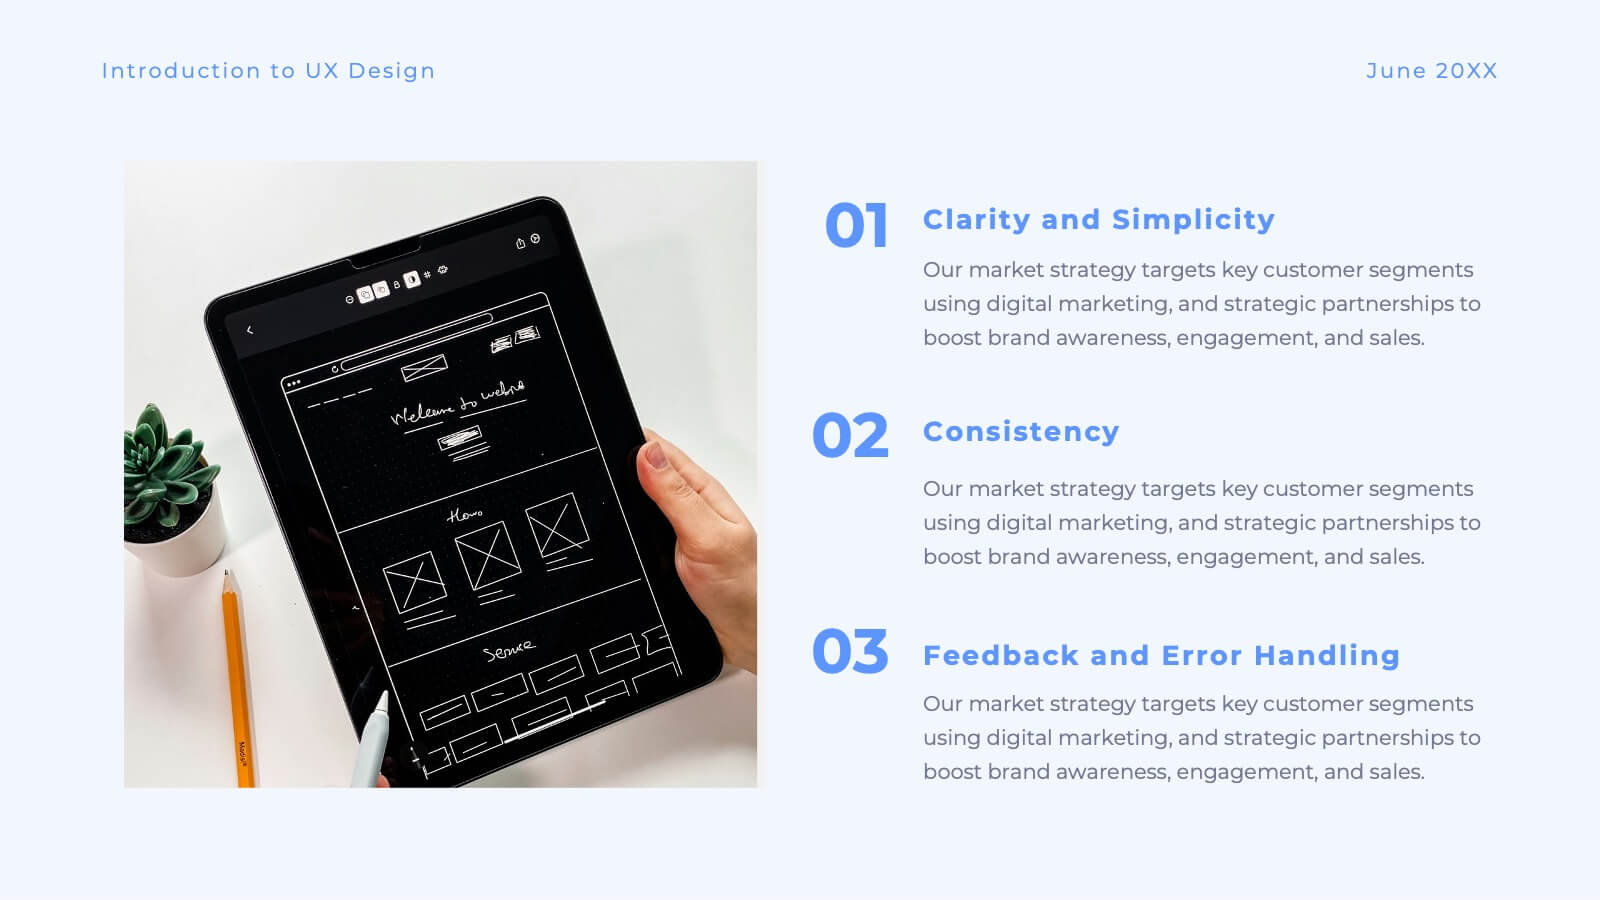
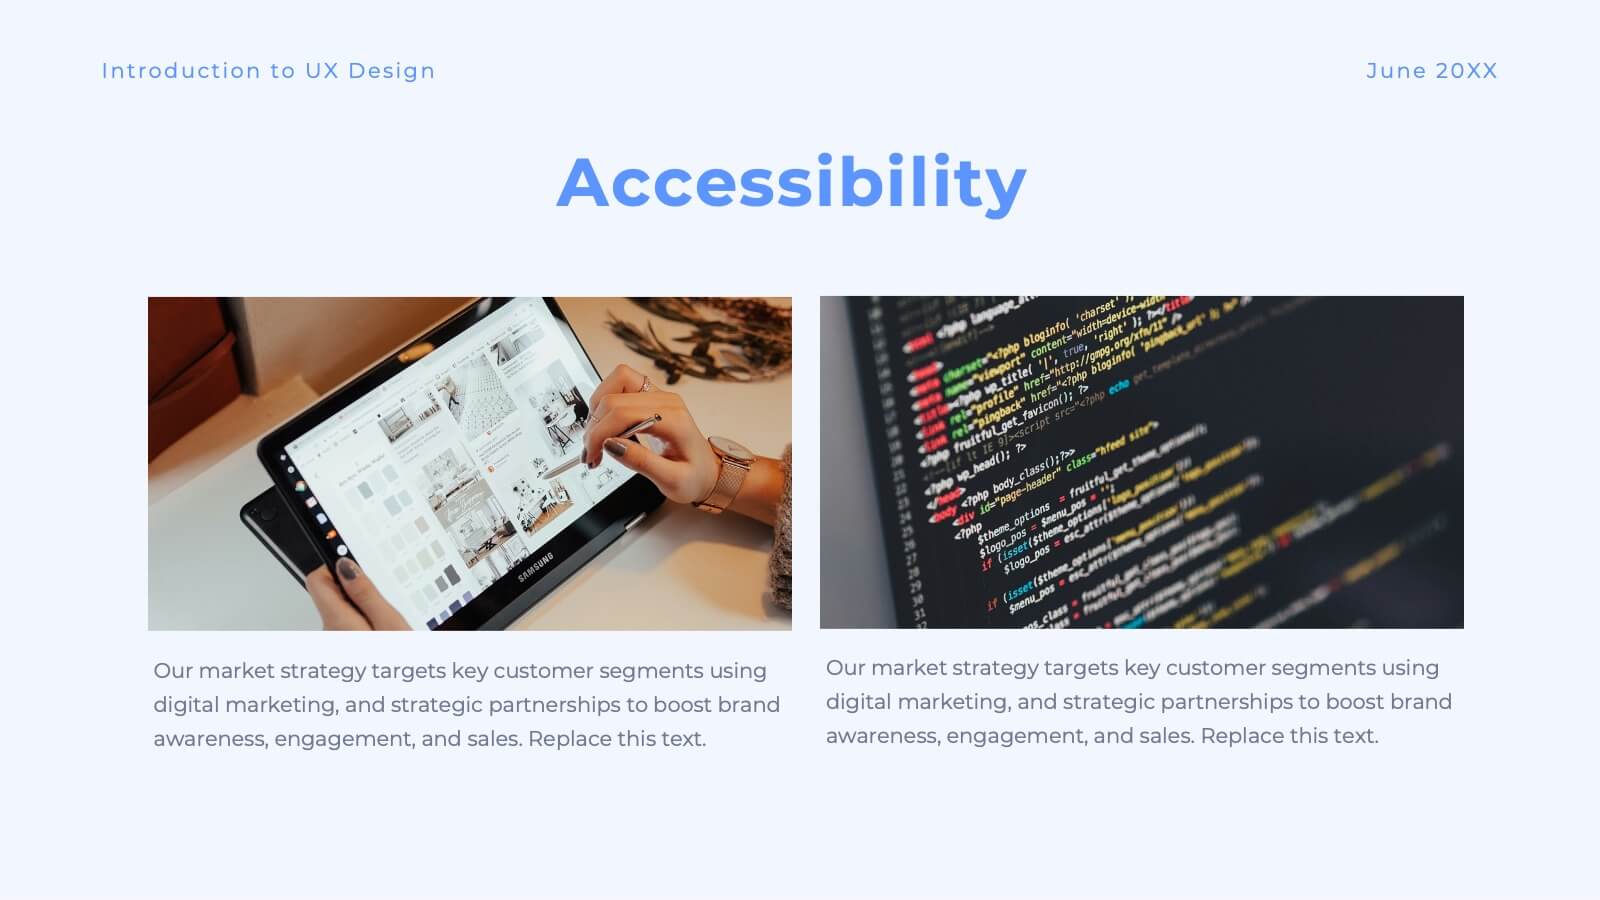
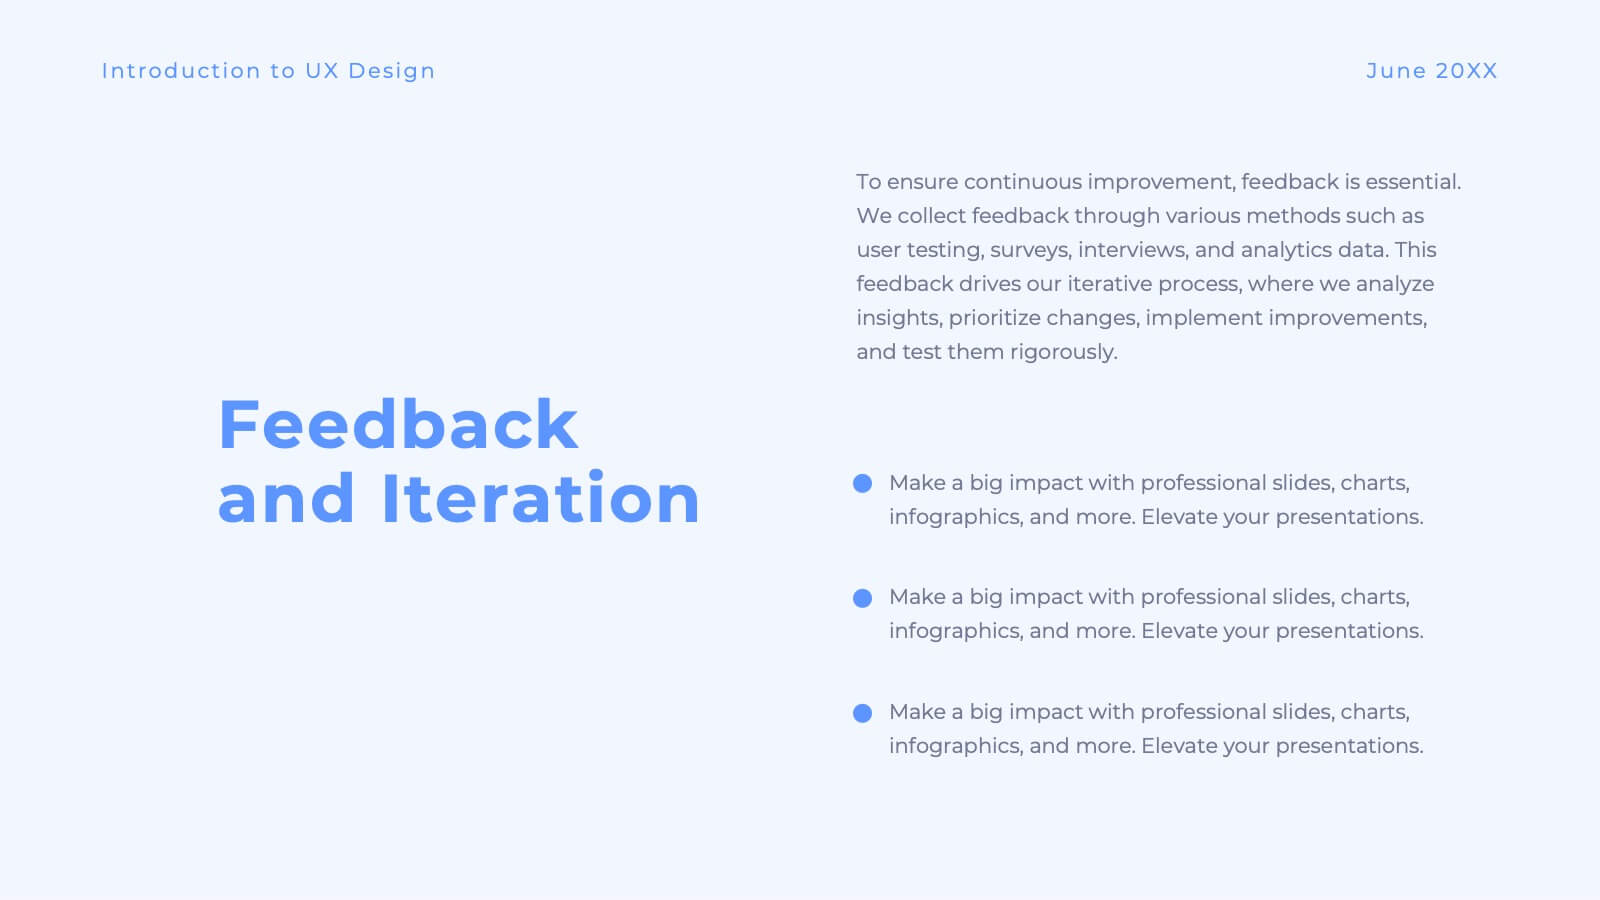
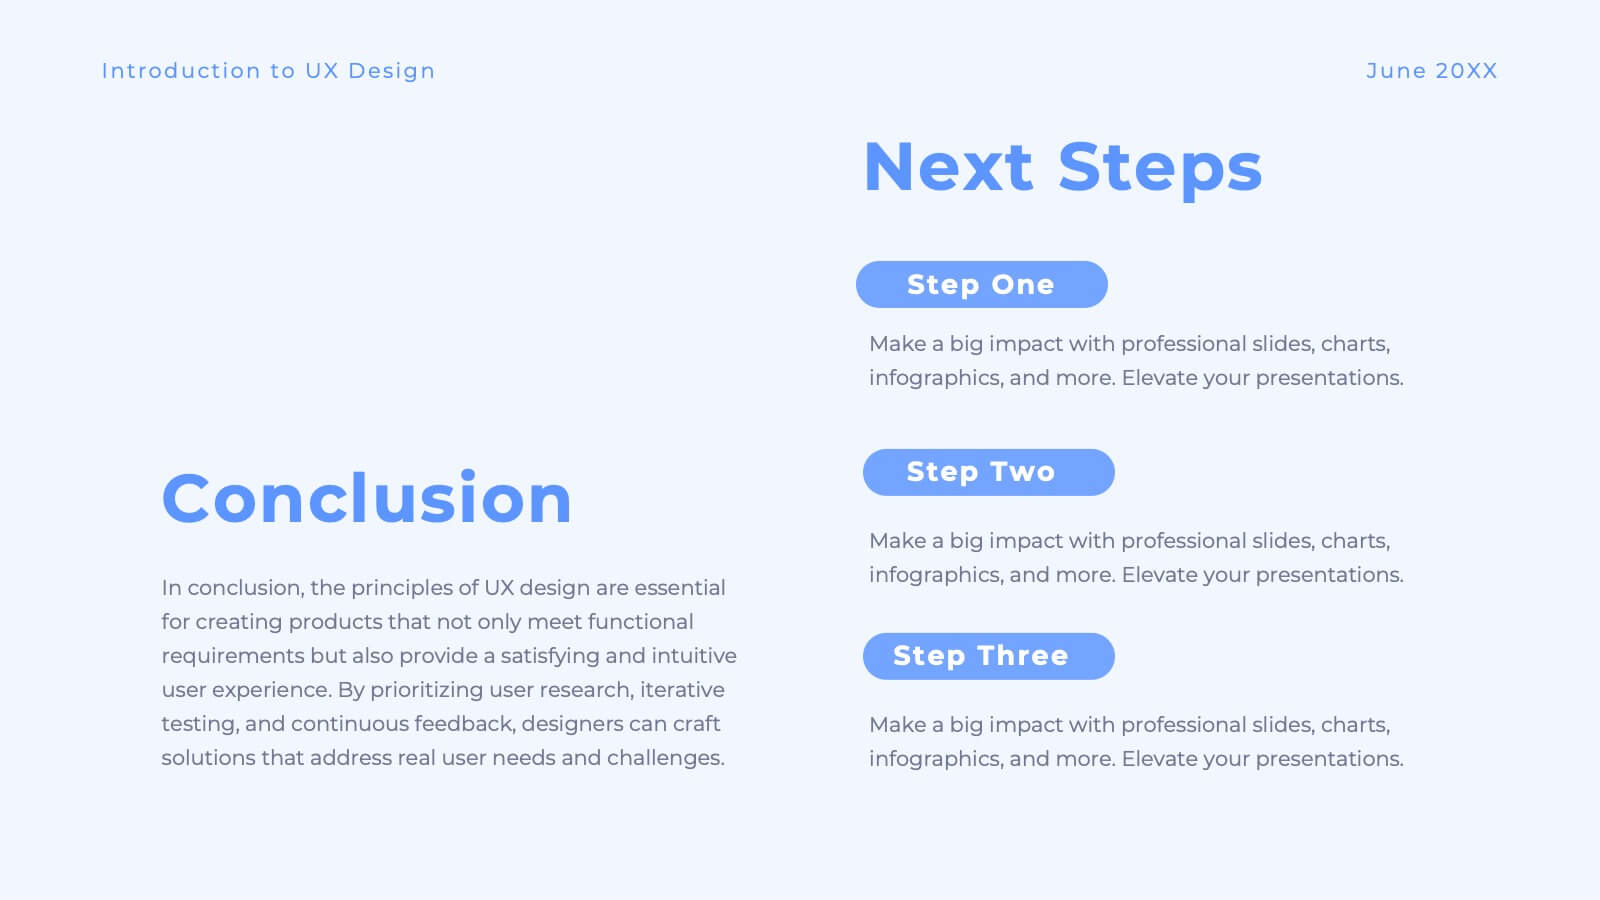
Luster UX Strategy Plan Presentation
Enhance user experience with this comprehensive UX strategy template! Perfect for outlining user research, personas, and design principles. Ideal for UX/UI designers aiming to present their strategies effectively. Compatible with PowerPoint, Keynote, and Google Slides, this template ensures your UX presentations are clear, professional, and impactful. Create exceptional user experiences today!


8 diapositivas
Large-Scale Data Processing Tools Presentation
Simplify the complexity of data processing with this sleek and modern template for mapping large-scale tools and systems. Ideal for tech teams, data analysts, and IT professionals, this slide helps you explain how data flows through cloud-based infrastructures. Fully customizable and compatible with PowerPoint, Keynote, and Google Slides.


20 diapositivas
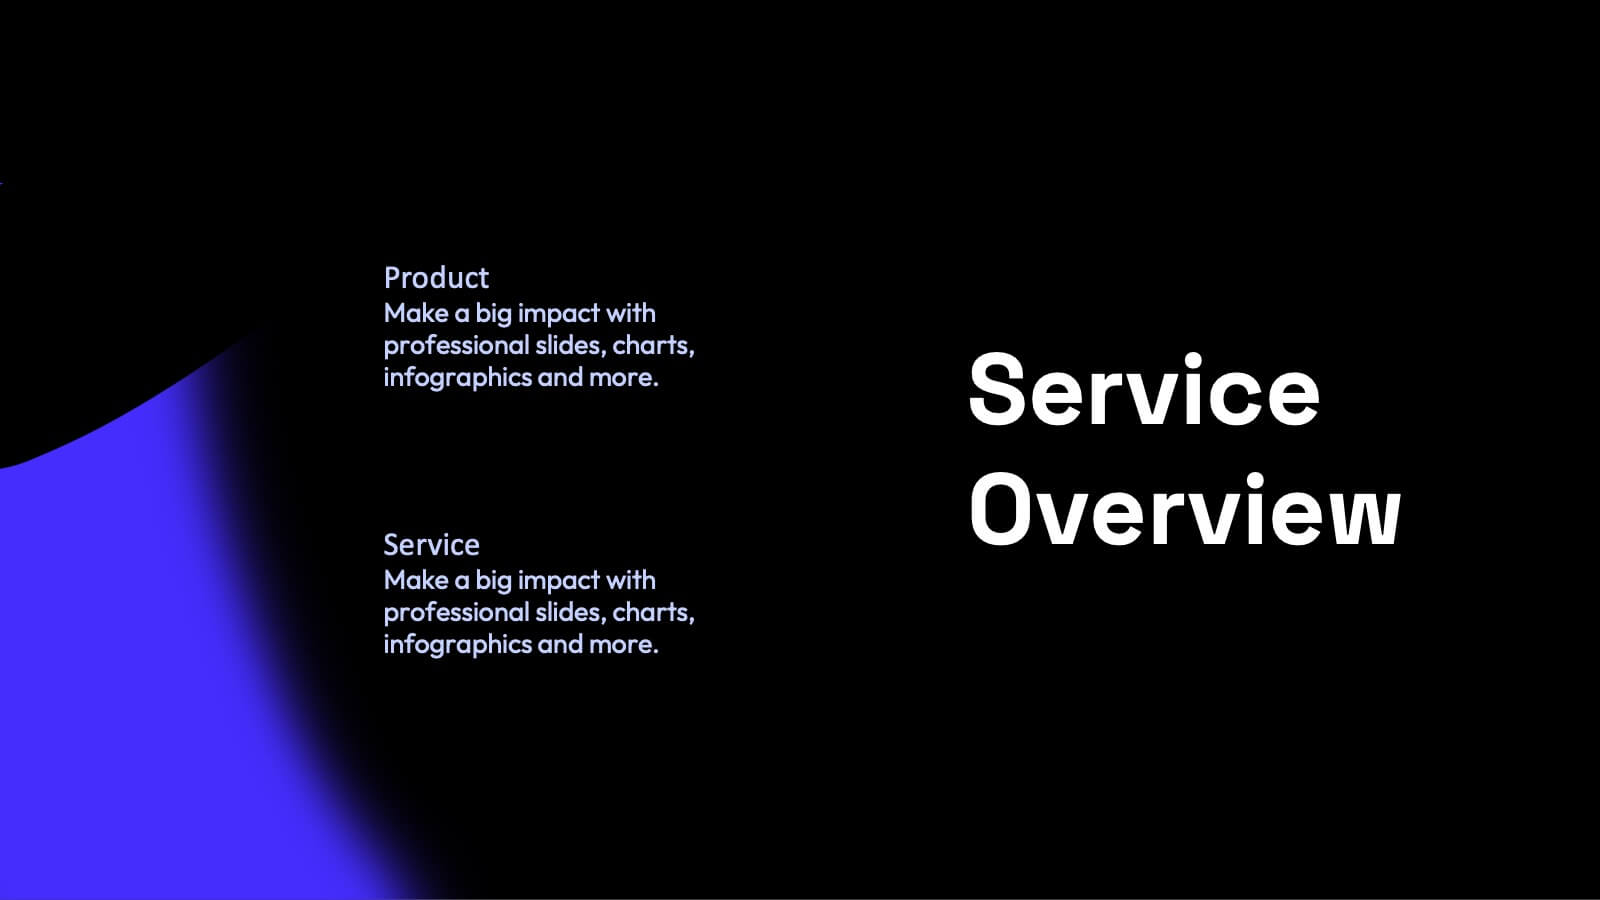
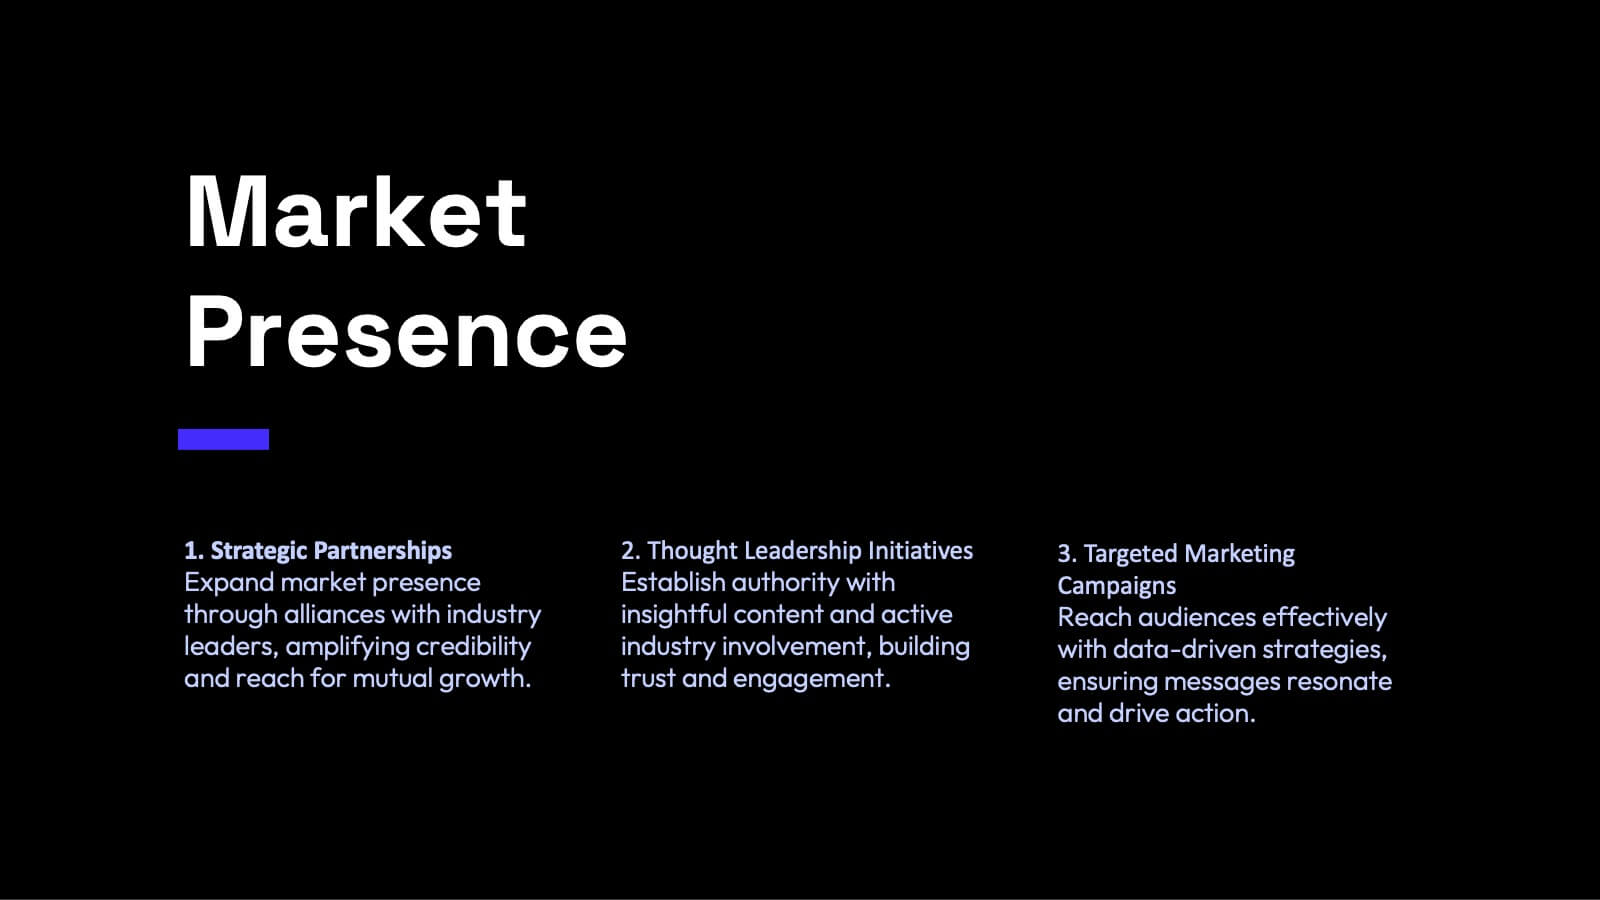
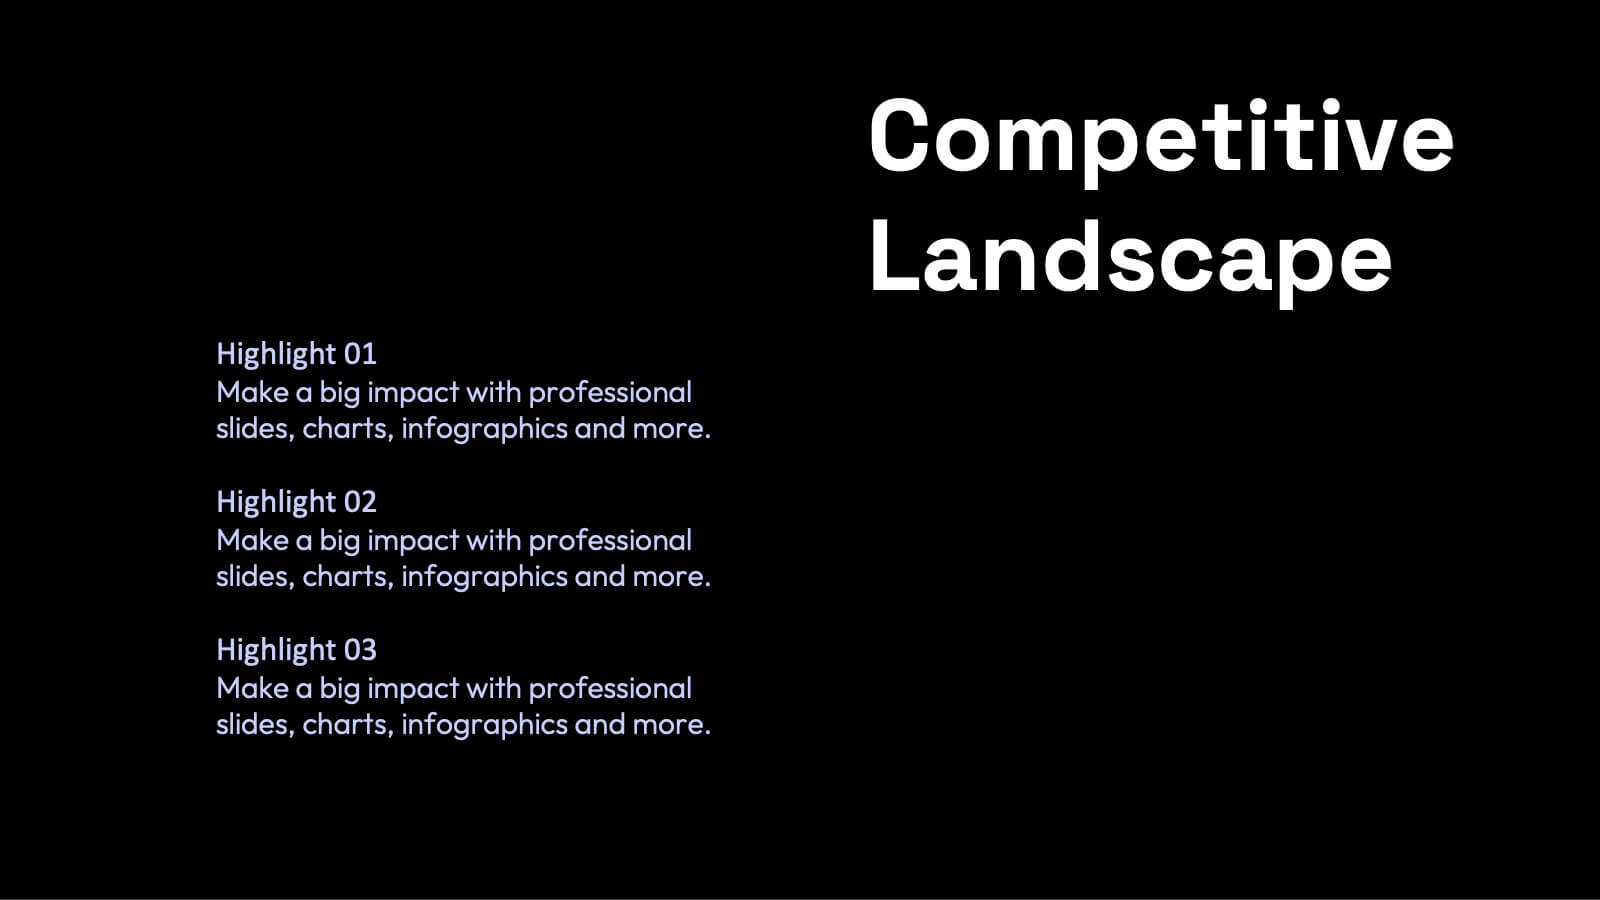
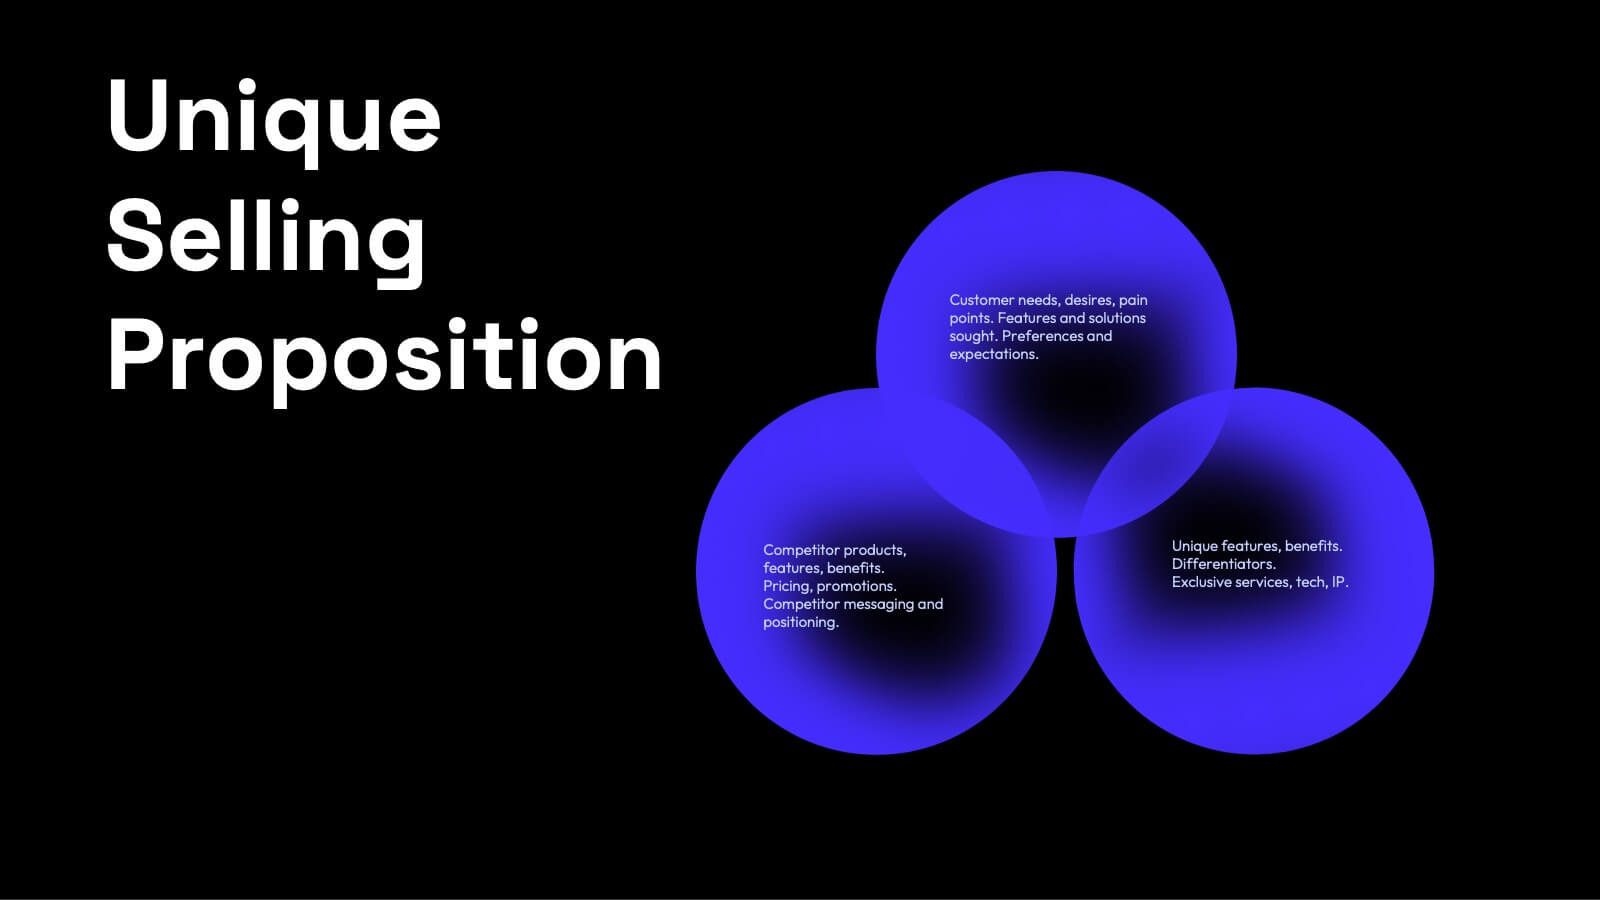
Apex Content Marketing Pitch Deck Presentation
Ignite your marketing strategy with this captivating pitch deck! Perfect for showcasing content marketing plans, it features slides on company history, target audience, and unique selling propositions. Make a lasting impression with sleek, modern designs and compelling content. Compatible with PowerPoint, Keynote, and Google Slides for a smooth presentation experience on any platform.


5 diapositivas
Best Travel Planning Template
Bring wanderlust to life with a slide that turns trip planning into a clear, engaging journey. This presentation breaks down key travel steps—documents, packing, routes, and timing—using simple visuals that keep details organized and easy to follow. Fully customizable and compatible with PowerPoint, Keynote, and Google Slides.


8 diapositivas
Eco-Friendly Business Practices Presentation
The "Eco-Friendly Business Practices" presentation template is thoughtfully designed to showcase sustainable business practices. Each section of the template features a labeled bin, representing different aspects or initiatives within a company's eco-friendly approach. The clear, colorful representations facilitate easy understanding and effective communication of key environmental strategies. This template is perfect for businesses looking to highlight their commitment to sustainability, discuss green policies, or outline specific recycling or waste reduction methods. It's especially useful for presentations aimed at stakeholders interested in corporate responsibility and environmental stewardship.


6 diapositivas
Business Task Checklist Presentation
Bring order and focus to your workflow with a clean, structured layout that tracks progress and priorities at a glance. Ideal for project updates, task planning, or performance reviews, this presentation makes organization effortless. Fully compatible with PowerPoint, Keynote, and Google Slides for easy customization and professional use.


5 diapositivas
Risks Assessment Matrix Presentation
Visualize risk like never before with a clear, color-coded grid that helps you evaluate impact, likelihood, and priority in seconds. Perfect for project planning, compliance reviews, or business strategy sessions, this presentation makes complex assessments simple. Fully compatible with PowerPoint, Keynote, and Google Slides for effortless editing.


8 diapositivas
Marketing Plan and Audience Targeting Presentation
Visualize your audience segmentation strategy with the Marketing Plan and Audience Targeting Presentation. This bullseye diagram template highlights three key focus areas, making it ideal for showcasing market research, targeting tactics, or funnel stages. Fully editable in Canva, PowerPoint, Keynote, and Google Slides to match your branding and goals.


21 diapositivas
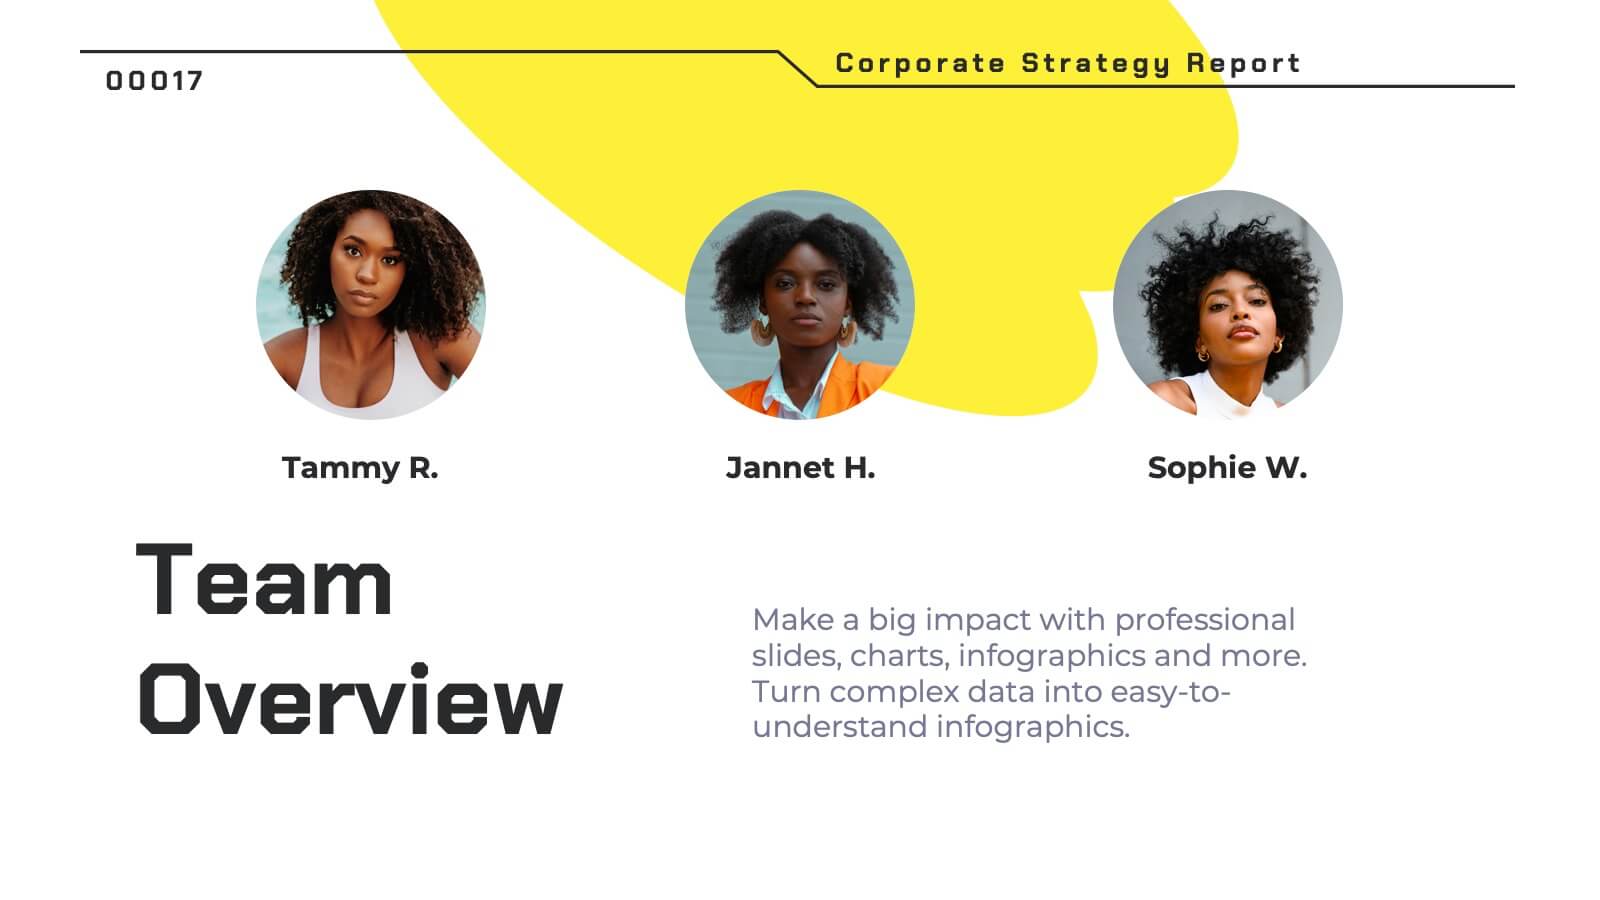
Pyronova Corporate Strategy Report Presentation
This professional corporate strategy template includes slides for market opportunity, SWOT analysis, objectives, marketing plan, revenue model, and competitive analysis. Designed for impactful presentations, it highlights financial performance, investment opportunities, and operational plans. Fully customizable in PowerPoint, Keynote, and Google Slides to suit diverse business needs.


5 diapositivas
DMAIC Six Sigma Framework
Visualize process improvement with this clear and structured DMAIC Six Sigma slide. Perfect for business analysts, quality teams, and project managers, it highlights each phase—Define, Measure, Analyze, Improve, and Control—in a streamlined format. Fully editable in PowerPoint, Keynote, and Google Slides.