


Características


¿Tienes alguna pregunta?
Recomendar


5 diapositivas
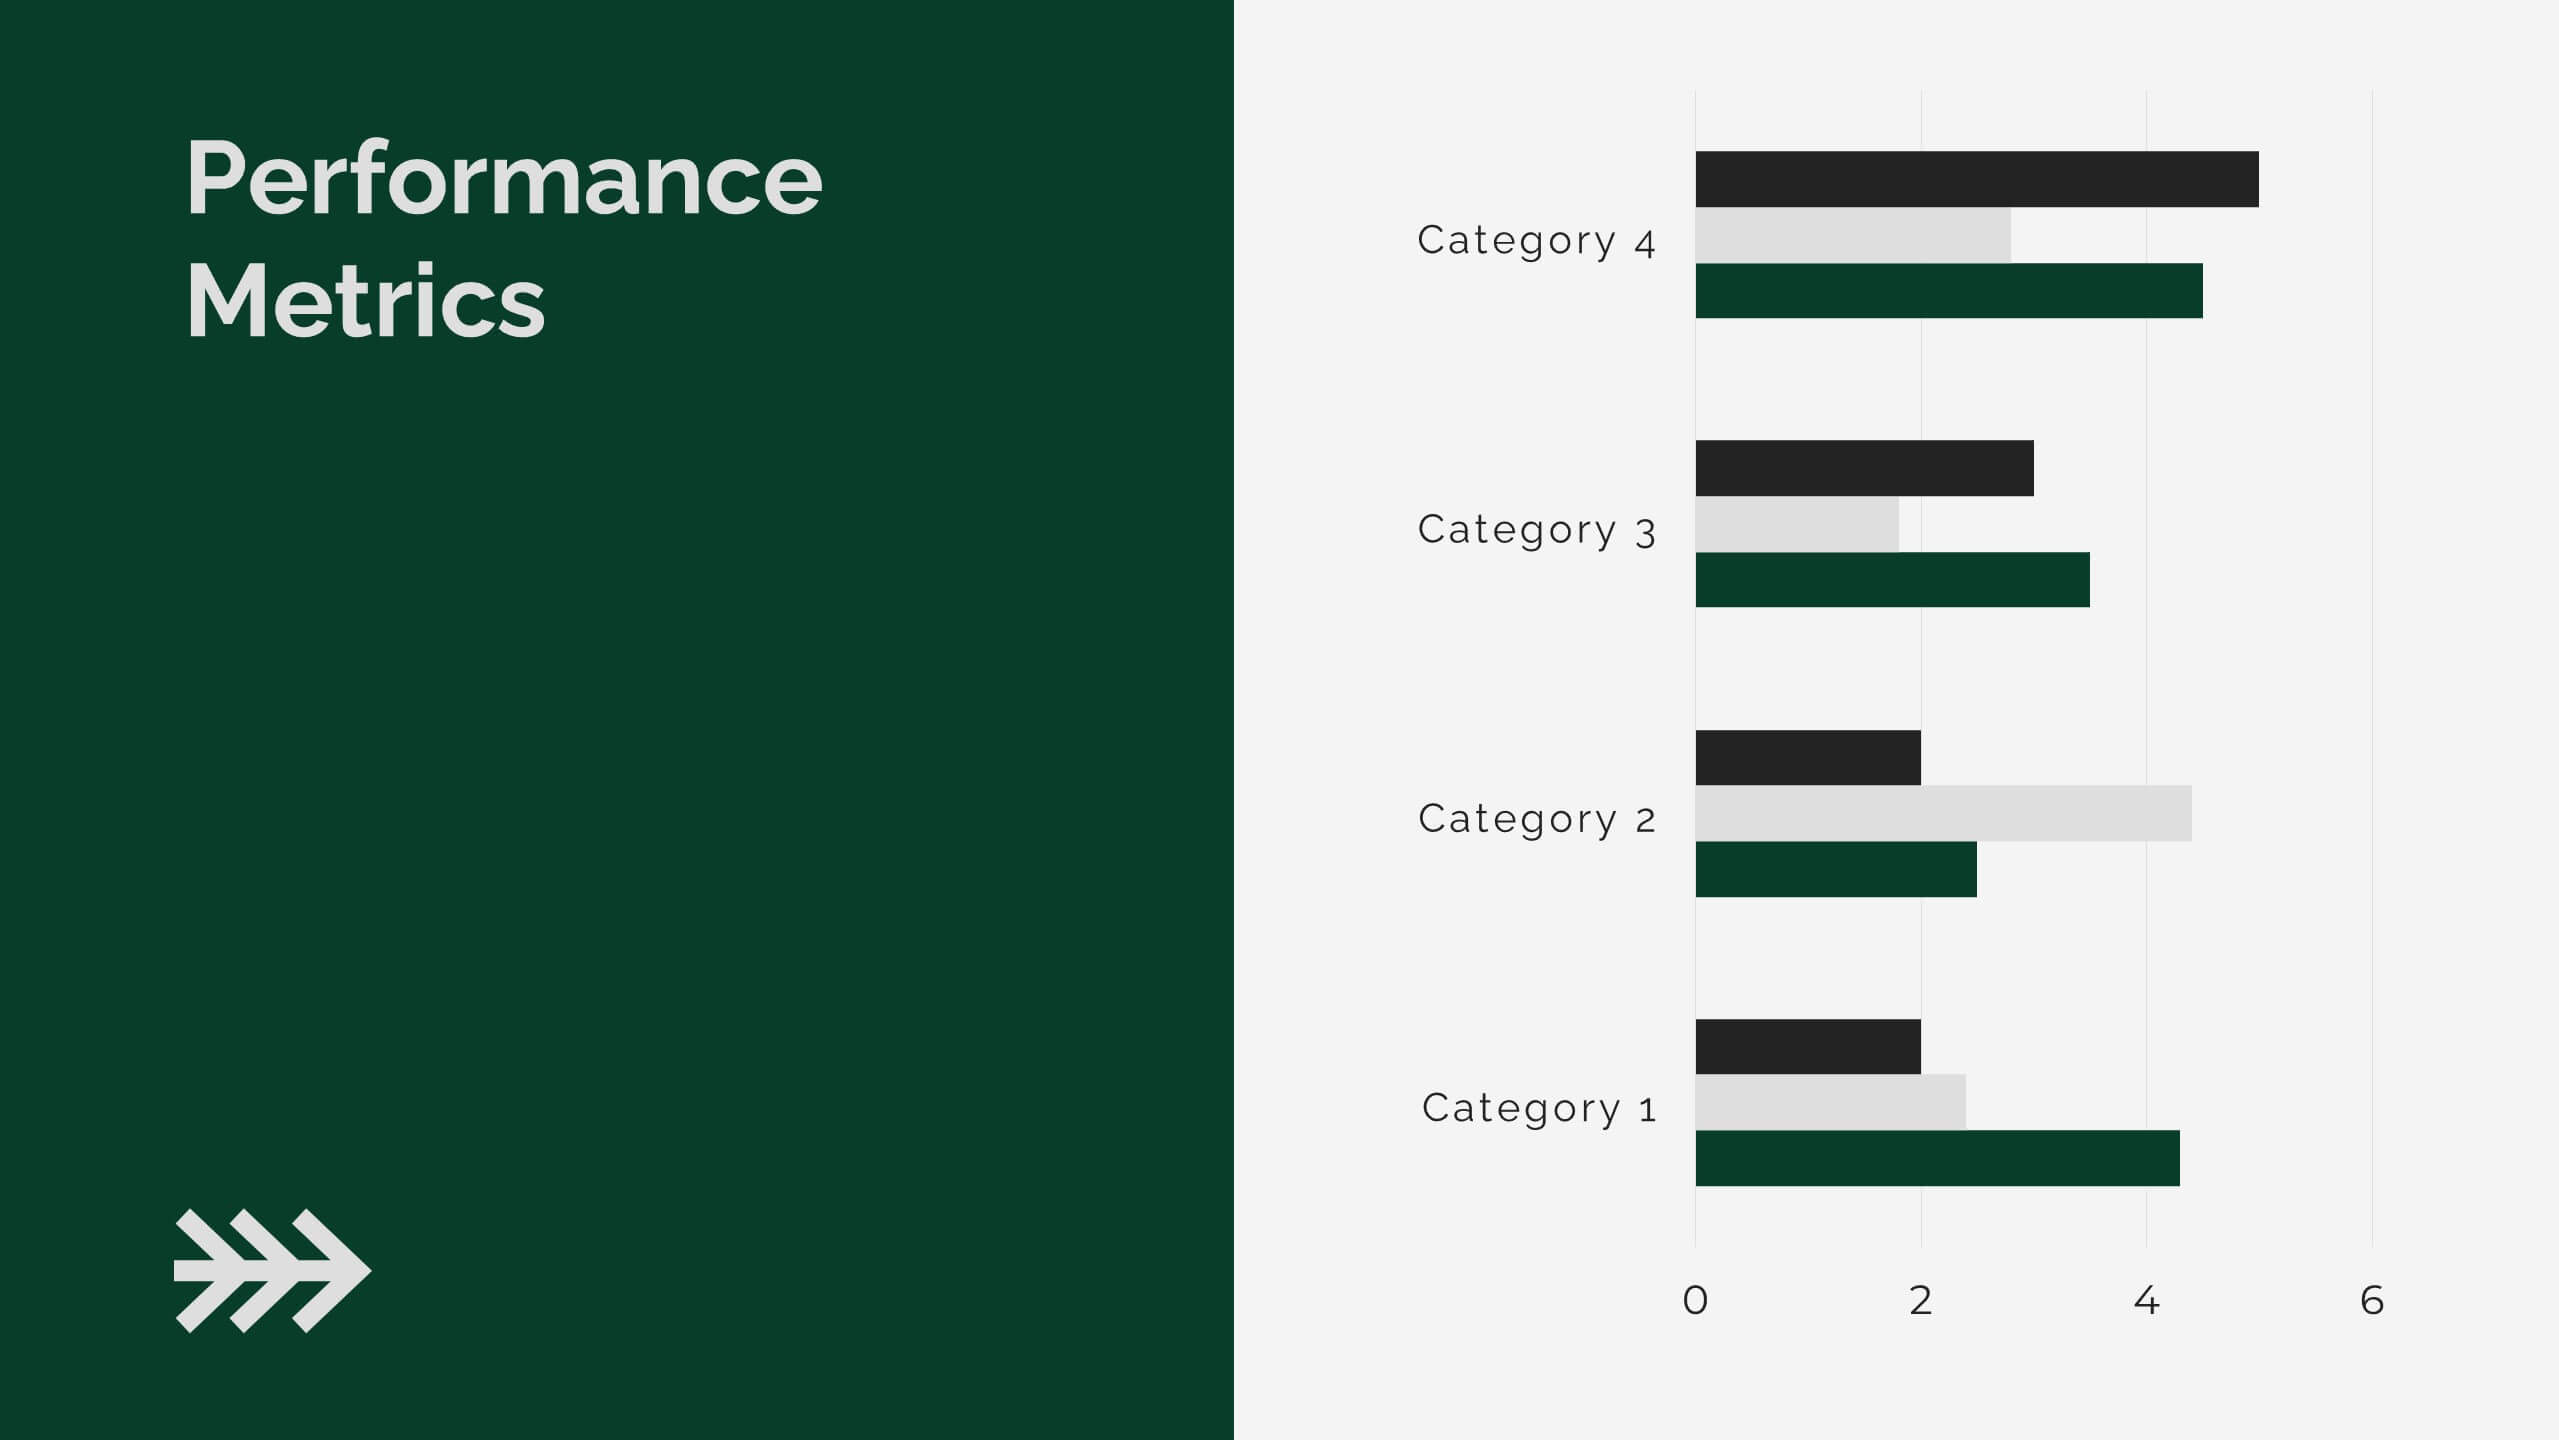
Statistical Insights for Business Growth Presentation
Showcase key business statistics with impact using this radial chart-style presentation slide. Ideal for visualizing growth percentages, progress tracking, or survey results, this design helps break down five distinct insights with matching callouts. Perfect for analytics reports, performance dashboards, and stakeholder updates. Fully customizable in PowerPoint, Keynote, and Google Slides.


5 diapositivas
Aviation Industry Market Analysis
Break down key metrics in the aviation sector with this sleek, aircraft-themed layout. Ideal for highlighting five data points or insights, each icon aligns with a section of the airplane to reinforce structure and clarity. Perfect for presentations on industry trends, airline strategies, or market performance. Fully editable in PowerPoint, Keynote, and Google Slides.


8 diapositivas
Business Lifecycle Circle Format Presentation
Present your business stages with clarity using this lifecycle circle diagram. Ideal for showcasing four key phases—planning, execution, growth, and review—in a circular format that emphasizes continuity. Each section includes icons and editable text. Fully customizable in PowerPoint, Keynote, or Google Slides for strategy meetings, reports, or progress updates.


5 diapositivas
Product Life Cycle Stages Presentation
Explore the 'Product Life Cycle Stages' with this concise presentation template. Perfect for marketing professionals and product managers, it outlines the product journey from introduction to decline. Enhance your strategy discussions using this template, compatible with PowerPoint, Keynote, and Google Slides.


7 diapositivas
Root Cause Analysis for Problem Solving Presentation
Identify and Resolve Issues Effectively with this Root Cause Analysis for Problem Solving presentation template. Designed to streamline complex problem-solving, this layout features clear visual markers, structured iconography, and step-by-step segmentation to help teams analyze causes, pinpoint bottlenecks, and implement solutions efficiently. Ideal for project managers, business analysts, and operational teams, this template is fully customizable and works seamlessly in PowerPoint, Keynote, and Google Slides, ensuring a professional and engaging presentation experience.


4 diapositivas
Freelancer Portfolio Showcase Presentation
Showcase your talents with this clean and modern portfolio slide. Featuring a photo placeholder, bold typography, and a vertical skill layout, it's perfect for freelancers and creatives. Easily customizable in PowerPoint, Keynote, or Google Slides—ideal for highlighting services, experience, and personal branding with a sleek, professional flair.


4 diapositivas
Organic Farming Overview Presentation
Present your sustainable agriculture strategies with this organic farming overview template, featuring vibrant icons and clean layouts. Perfect for eco-friendly initiatives, farm project plans, and environmental reports. Fully editable in Canva, PowerPoint, and Google Slides, allowing you to adjust colors, icons, and text to align with your branding and goals.


5 diapositivas
Sustainable Growth and Green Policy Presentation
Showcase your eco-initiatives with the Sustainable Growth and Green Policy Presentation. This unique leaf-shaped diagram highlights four key environmental pillars—ideal for presenting climate strategies, energy policies, or green development goals. With a sleek and modern design, it’s perfect for NGOs, government briefings, or corporate sustainability reports. Editable in Canva, PowerPoint, Keynote, and Google Slides.


6 diapositivas
Job Progress Infographics
Track and communicate job progress effectively with our Job Progress infographic template. This template is fully compatible with popular presentation software like PowerPoint, Keynote, and Google Slides, allowing you to easily customize it to illustrate and communicate key milestones, accomplishments, and the status of your projects or tasks. The Job Progress infographic template offers a visually engaging platform to depict the progress of your work, whether it's a project, assignment, or task. Whether you're a project manager, team leader, or anyone looking to showcase your achievements, this template provides a user-friendly canvas to create informative presentations and progress reports. Optimize your job progress tracking with this SEO-optimized Job Progress infographic template, thoughtfully designed for clarity and ease of use. Customize it to showcase project timelines, completion percentages, key accomplishments, and future goals, ensuring that your audience gains a comprehensive understanding of your progress and achievements. Start crafting your personalized infographic today to effectively communicate your job progress.


12 diapositivas
Alphabet Learning and Education Presentation
Introduce concepts creatively with this bold "A"-shaped infographic designed for education topics. Each segment of the letter highlights a numbered point, making it ideal for step-by-step instructions, learning stages, or literacy development. Use it to simplify complex ideas visually. Fully editable in PowerPoint, Keynote, and Google Slides.


5 diapositivas
Public Health Data Presentation
Bright visuals and clean data blocks make this slide an energizing way to present key insights, instantly pulling viewers into the story behind your metrics. It helps simplify complex information while keeping everything clear, structured, and easy to follow. Fully compatible with PowerPoint, Keynote, and Google Slides.


6 diapositivas
Market Trends and Insights Year in Review Presentation
Analyze seasonal shifts with clarity using the Market Trends and Insights Year in Review Presentation. This quarterly layout lets you break down key trends, data, and highlights by month, helping stakeholders visualize market behavior throughout the year. Ideal for analysts, marketers, and strategy teams. Fully customizable and works seamlessly with PowerPoint, Keynote, and Google Slides.


21 diapositivas
Stellar Content Marketing Pitch Deck Presentation
The Stellar Marketing Pitch Deck template is designed to make your marketing strategies shine like never before! This template is perfect for showcasing your business's potential and engaging your audience with sleek, modern designs that capture attention. Start with a powerful introduction, leading into an in-depth industry overview that highlights key trends and consumer behaviors. With dedicated sections for emerging technologies, content marketing trends, and data-driven marketing, you'll have everything you need to present your innovative approach. The template also includes slides for social media strategies, influencer marketing, and SEO trends, ensuring you're covering all the bases. Personalization trends and video marketing evolution are featured to show your forward-thinking approach, while the customer experience focus slide emphasizes your commitment to quality. Finish strong with insights into e-commerce trends, brand storytelling, and sustainability in marketing. This template is fully compatible with PowerPoint, Keynote, and Google Slides, making it versatile and easy to use for any marketing presentation.


26 diapositivas
Salus Rebranding Project Plan Presentation
This rebranding project plan template offers a clear framework for presenting brand identity transformation. Covering brand values, identity components, target audience, positioning, and guidelines, it’s ideal for companies refreshing their brand. Compatible with PowerPoint, Keynote, and Google Slides, it ensures a streamlined, professional presentation of your rebranding strategy.


22 diapositivas
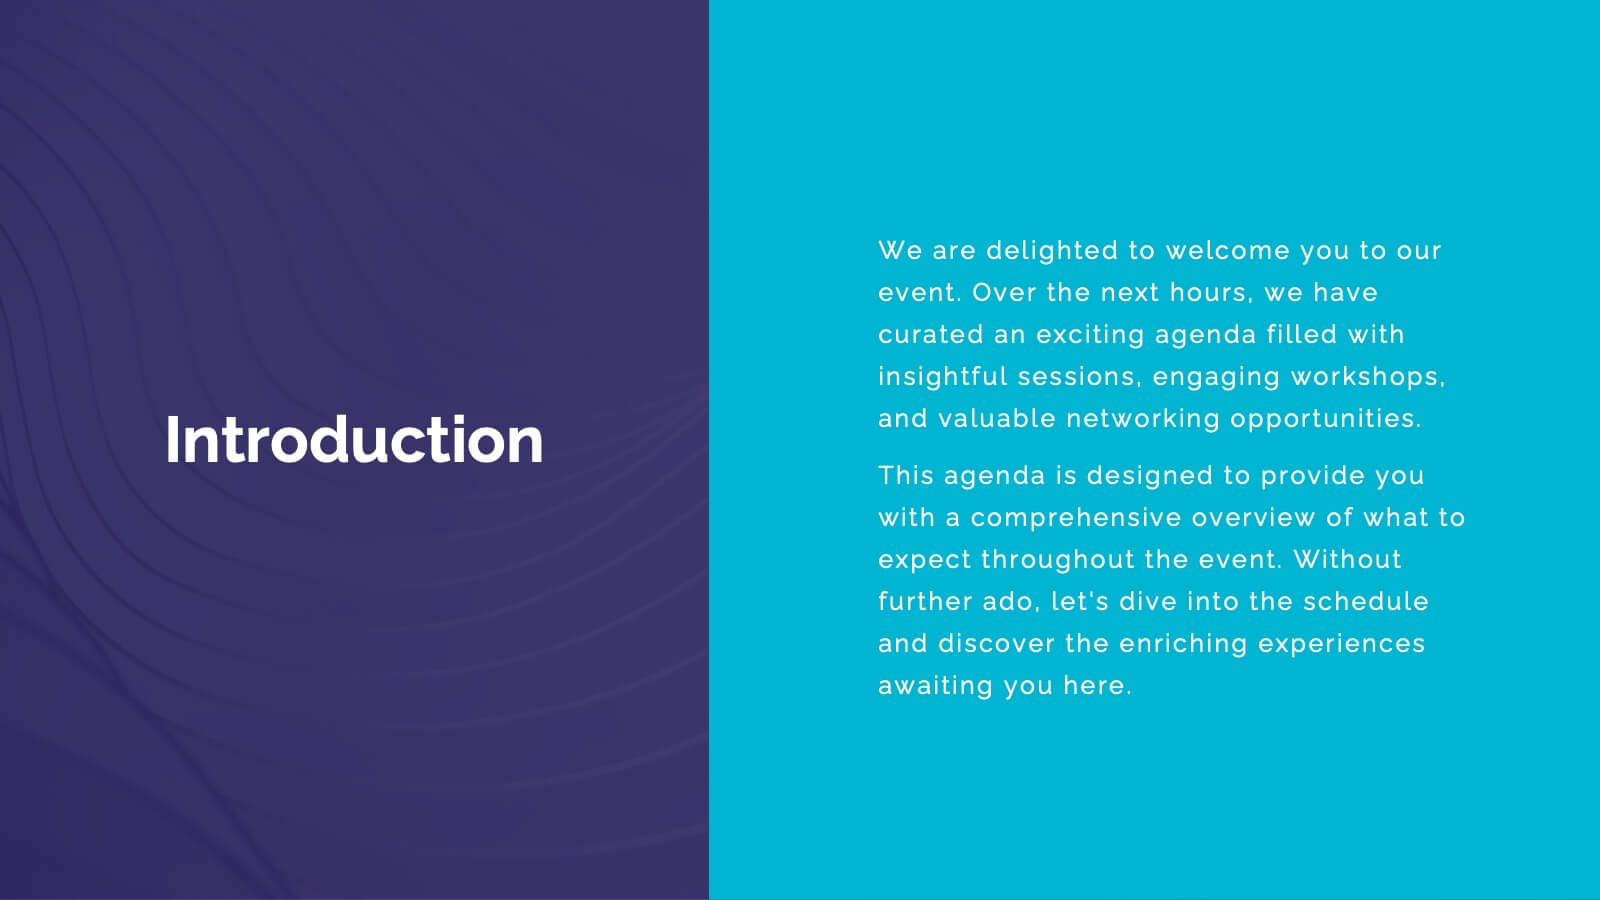
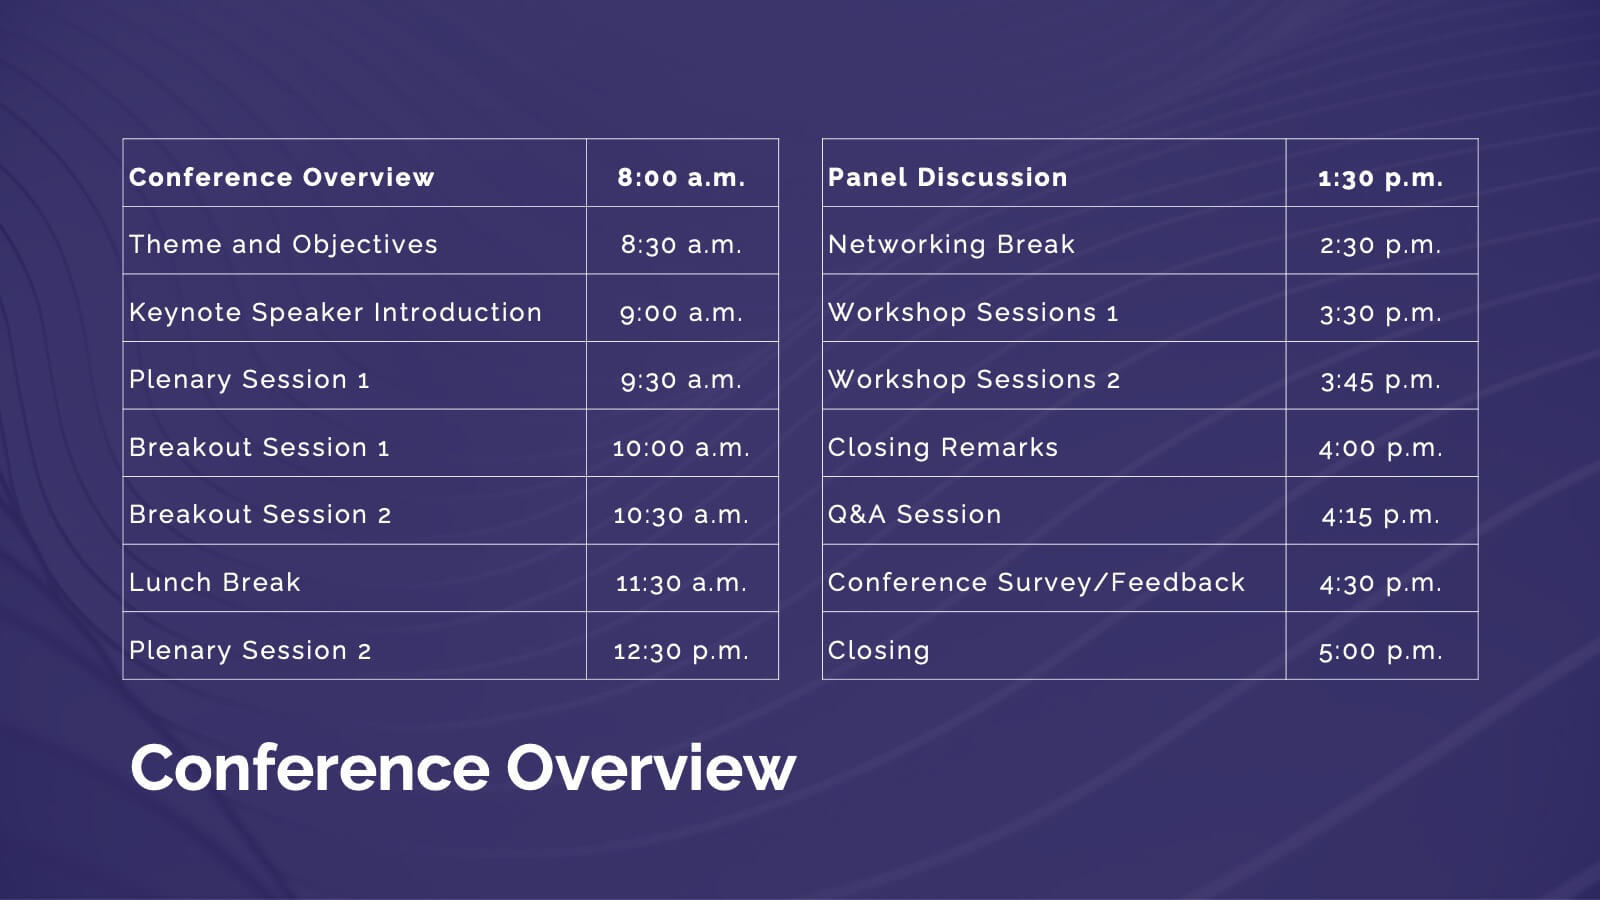
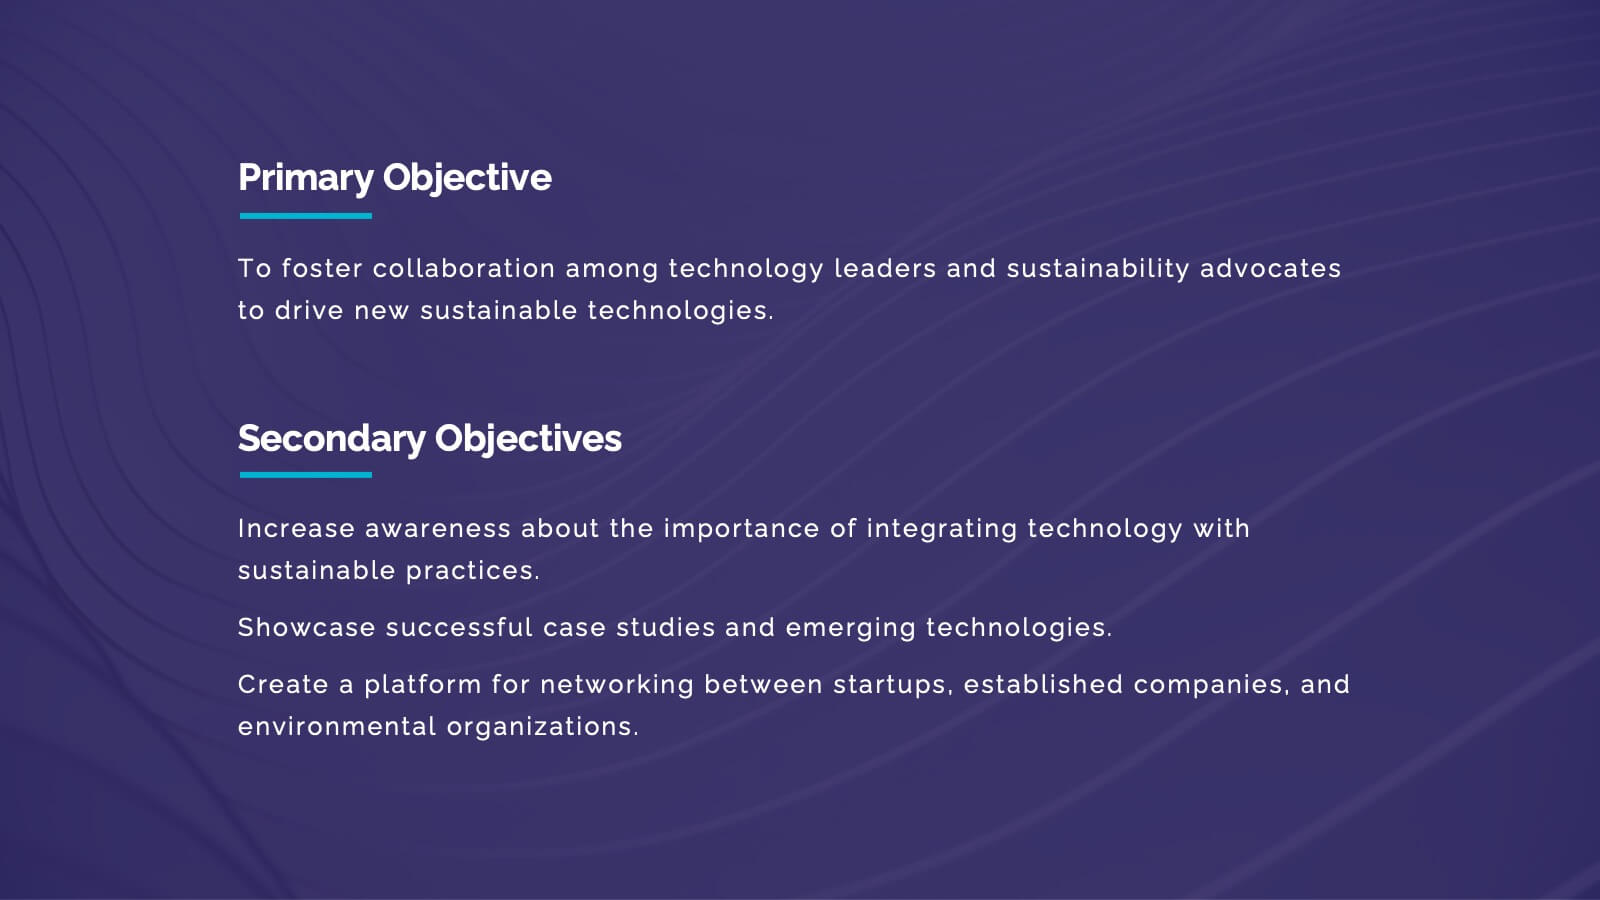
Nimbus Business Development Proposal Presentation
Boost your business presentations with this vibrant, professional template designed for business development proposals. Perfect for detailing conference overviews, themes, objectives, and keynotes, it features a clean and engaging layout. Highlight critical sessions and networking opportunities to captivate your audience. Compatible with PowerPoint, Keynote, and Google Slides, it ensures seamless presentations on any platform.


5 diapositivas
Perspective of Economic Trends in Africa Map Presentation
Visualize key economic insights across Africa with this data-driven map layout. Use labeled progress bars and highlighted countries to present regional performance, sector growth, or market distribution. Fully editable in PowerPoint, Keynote, or Google Slides, this clean template is ideal for business reports, financial reviews, and investment-focused presentations.


7 diapositivas
Sports Illustrated Infographic Presentation
Sports are an important aspect of our lives that provide numerous physical, mental, social, and personal benefits. This sports infographic is designed to help you create an awesome visual content using all sorts of colorful images, charts and graphs that best describe your sports related project. This template is perfect if you need to share statistics and facts about sports. It contains 7 slides with colorful backgrounds, sport visualizations and an area for you to input your important data. This template is compatible with Powerpoint, keynote and google slides, perfect for your next project!