


Características


¿Tienes alguna pregunta?
Recomendar


7 diapositivas
Process Table Infographic
Unveil the intricacies of any process with our process table slide infographic. Situated on a clean white base, the design flourishes with a spectrum of green for growth, purple for innovation, blue for consistency, and orange. With its detailed infographics, symbolizing icons, and flexible image placeholders, this template offers a structured representation of step-by-step processes, from initiation to completion. Perfectly calibrated for Powerpoint, Keynote, or Google Slides. An indispensable tool for business analysts, operations managers, educators, or anyone looking to streamline and visualize processes.


7 diapositivas
Weight Challenge Infographic Presentation
Challenges are essential for personal and professional growth, and they play an important role in our lives in several ways. This template is designed for any and all use. You can use it in business, academic presentations, or home. This template is designed to give you flexibility in your presentations and allow you to create dynamic content that stands out from the crowd. This is compatible with Powerpoint, Keynote, and Google Slides so you can easily edit your presentation. This template can be used for a variety of projects, including team building, goal setting and brainstorming!


10 diapositivas
Creative Thinking and Innovation
Inspire fresh perspectives and spark ideas with this Creative Thinking and Innovation presentation. Designed around a dynamic lightbulb concept, it features five clearly numbered stages for visualizing brainstorming, concept development, and strategic creativity. Perfect for workshops, ideation sessions, or innovation planning. Fully editable in PowerPoint, Keynote, and Google Slides.


4 diapositivas
Market Expansion Strategy in South America Map Presentation
Visualize growth opportunities with this South America market expansion map. Designed with directional arrows and regional color highlights, it helps communicate entry strategies, investment plans, or operational shifts. Ideal for business reports or strategy decks. Easily customizable and compatible with PowerPoint, Google Slides, and Keynote for seamless editing.


21 diapositivas
Logos Content Marketing Pitch Deck Presentation
The Marketing Presentation Template is designed for impactful business storytelling. With 20+ slides, it features sections for company history, core values, target audience, competitive analysis, growth plans, and testimonials. Ideal for agencies and brands, it's fully customizable and compatible with PowerPoint, Keynote, and Google Slides. Perfect for pitching ideas effectively!


8 diapositivas
Professional Title Slide Presentation
Start your presentation with impact using a bold, modern cover design that captures attention instantly. Perfect for introducing reports, creative projects, or business pitches, this layout combines professional typography with clean visuals for a polished first impression. Fully editable in PowerPoint, Keynote, and Google Slides for seamless customization.


7 diapositivas
Consulting Business Strategy Infographic Presentation
A company’s business strategy is a plan that helps it achieve its goals and meet long-term objectives. A business strategy should be designed to fulfill the company’s mission, vision, and values. This template is designed to make your business or company plan, easy to understand and present in a professional way with the best design. This template can be used to present your company's strategic vision, long-term goals, and key initiatives. With its colorful and dynamic design, this can attract your audience’s attention, while also providing them with useful information about your strategy.


5 diapositivas
Corporate Strategic Planning Presentation
Create a winning strategy with this corporate strategic planning template. Designed for business leaders, it helps structure goals, initiatives, and key performance areas in a clear, visual format. Ideal for strategic decision-making and long-term planning. Fully customizable and compatible with PowerPoint, Keynote, and Google Slides for seamless editing and presentation.
5 diapositivas
Project Progress Milestones Tracker Presentation
Stay on track and make timelines shine with this clean, visual layout. This template helps you clearly showcase task progress, deadlines, and deliverables over time—perfect for project updates, team planning, or stakeholder reporting. Fully editable and easy to use in PowerPoint, Keynote, and Google Slides for seamless collaboration.


4 diapositivas
Key Stakeholder Identification Presentation
A great presentation starts with clarity, and this slide brings your message to life with bold, visual focus. Use it to break down key stakeholder groups, highlight their roles, and communicate insights with ease. Clean lines and intuitive icons keep everything clear and engaging. Fully compatible with PowerPoint, Keynote, and Google Slides.


4 diapositivas
Project Development Progress Report Presentation
Track milestones with precision using this clean, data-driven slide designed for showcasing project completion percentages. Circular progress visuals paired with text blocks allow you to highlight achievements, issues, or next steps at a glance. Perfect for project managers, teams, and stakeholders. Fully editable in PowerPoint, Keynote, and Google Slides.


5 diapositivas
Business and Personal Goal Planning Presentation
Align your vision with action using the Business and Personal Goal Planning slide. This clean, professional layout helps break down up to four key objectives using flag-themed visuals, customizable text blocks, and supportive icons. Perfect for comparing business goals with personal development targets in a single view. Fully editable in PowerPoint, Keynote, and Google Slides—ideal for team meetings, coaching sessions, or strategic planning.


23 diapositivas
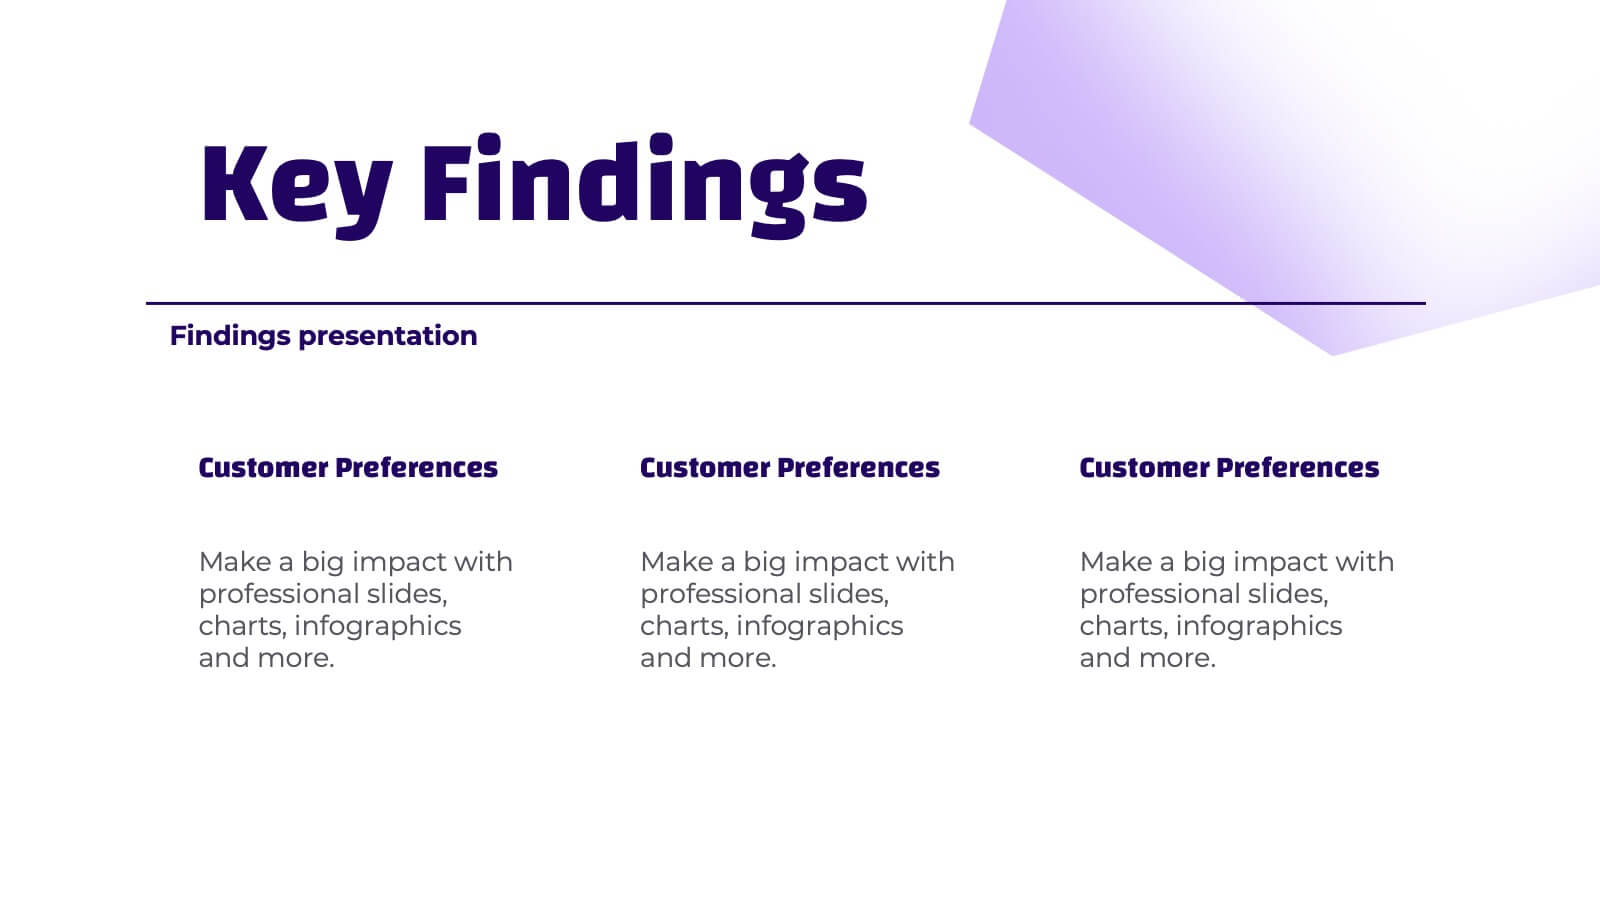
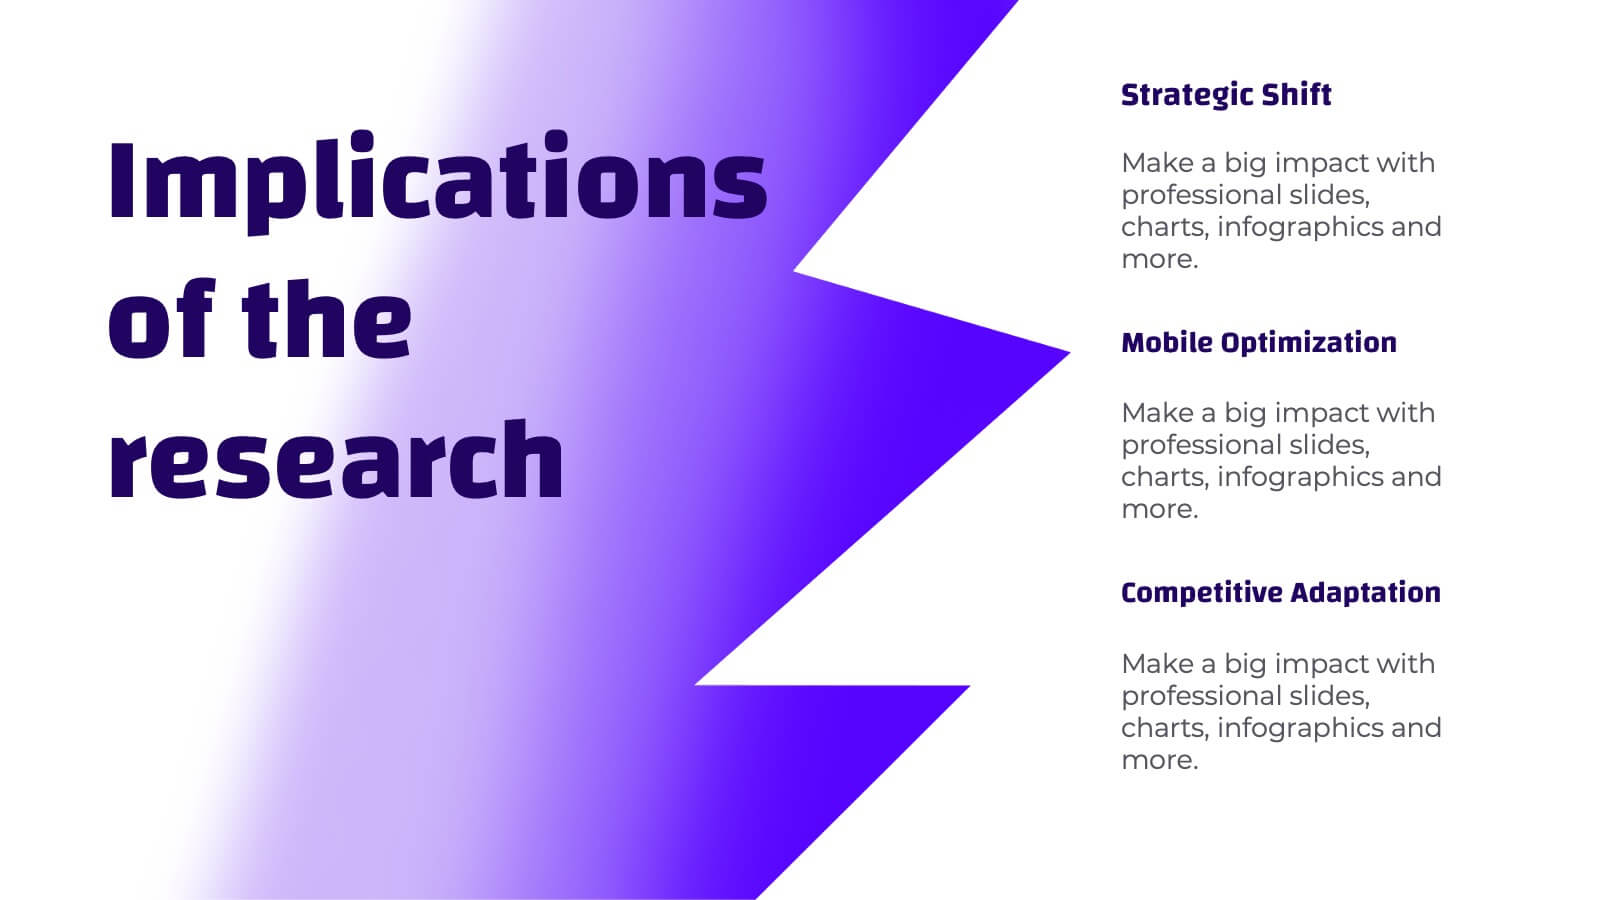
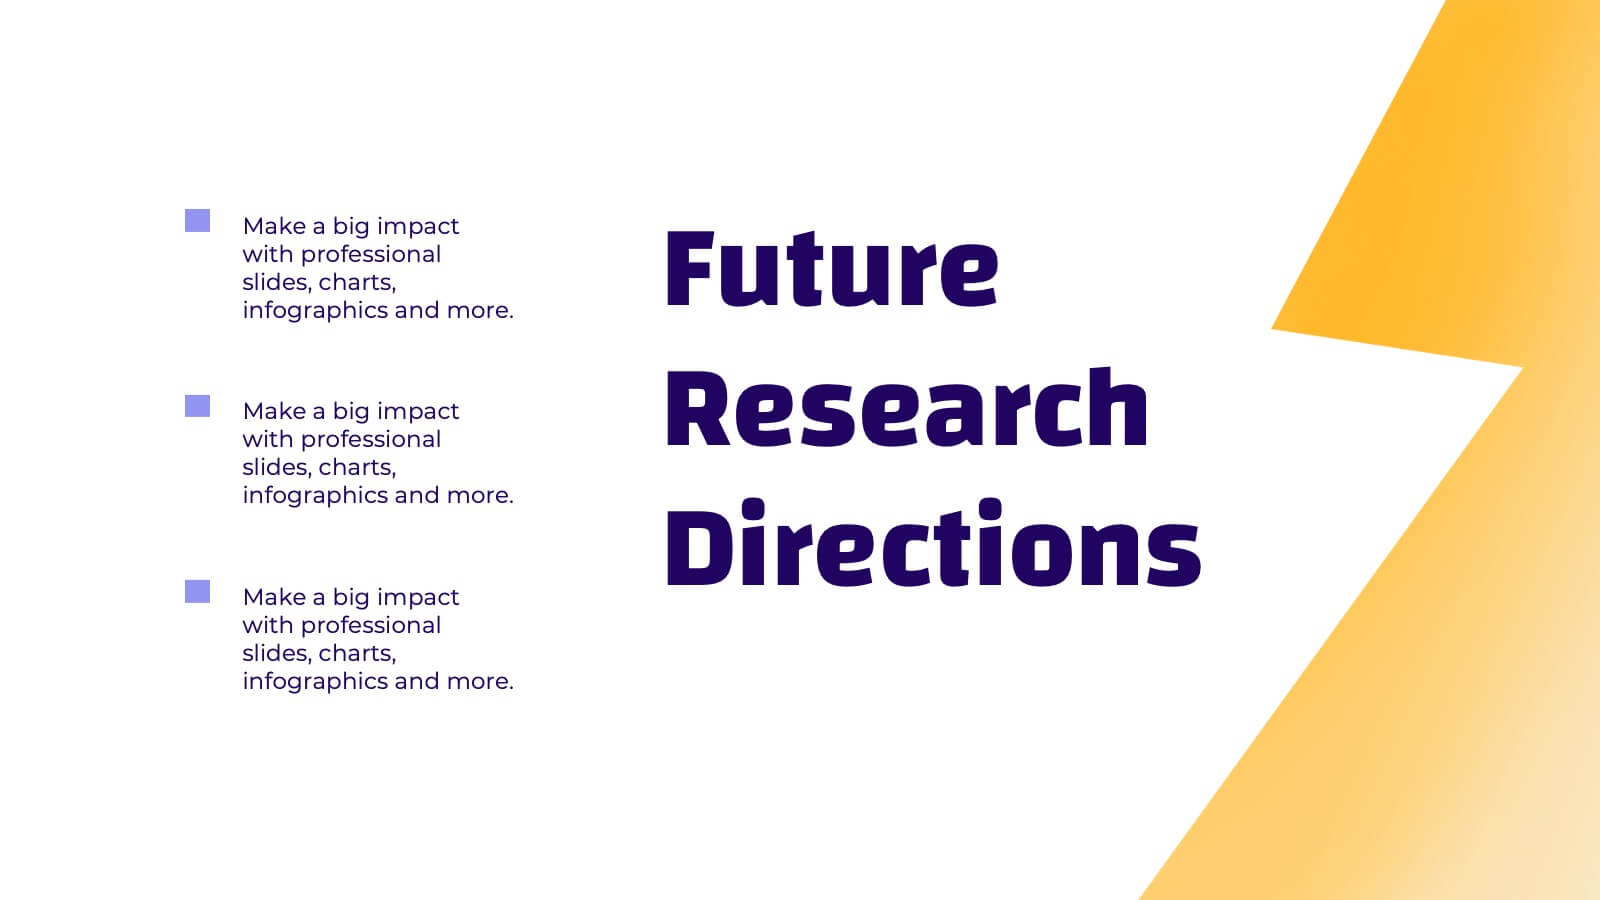
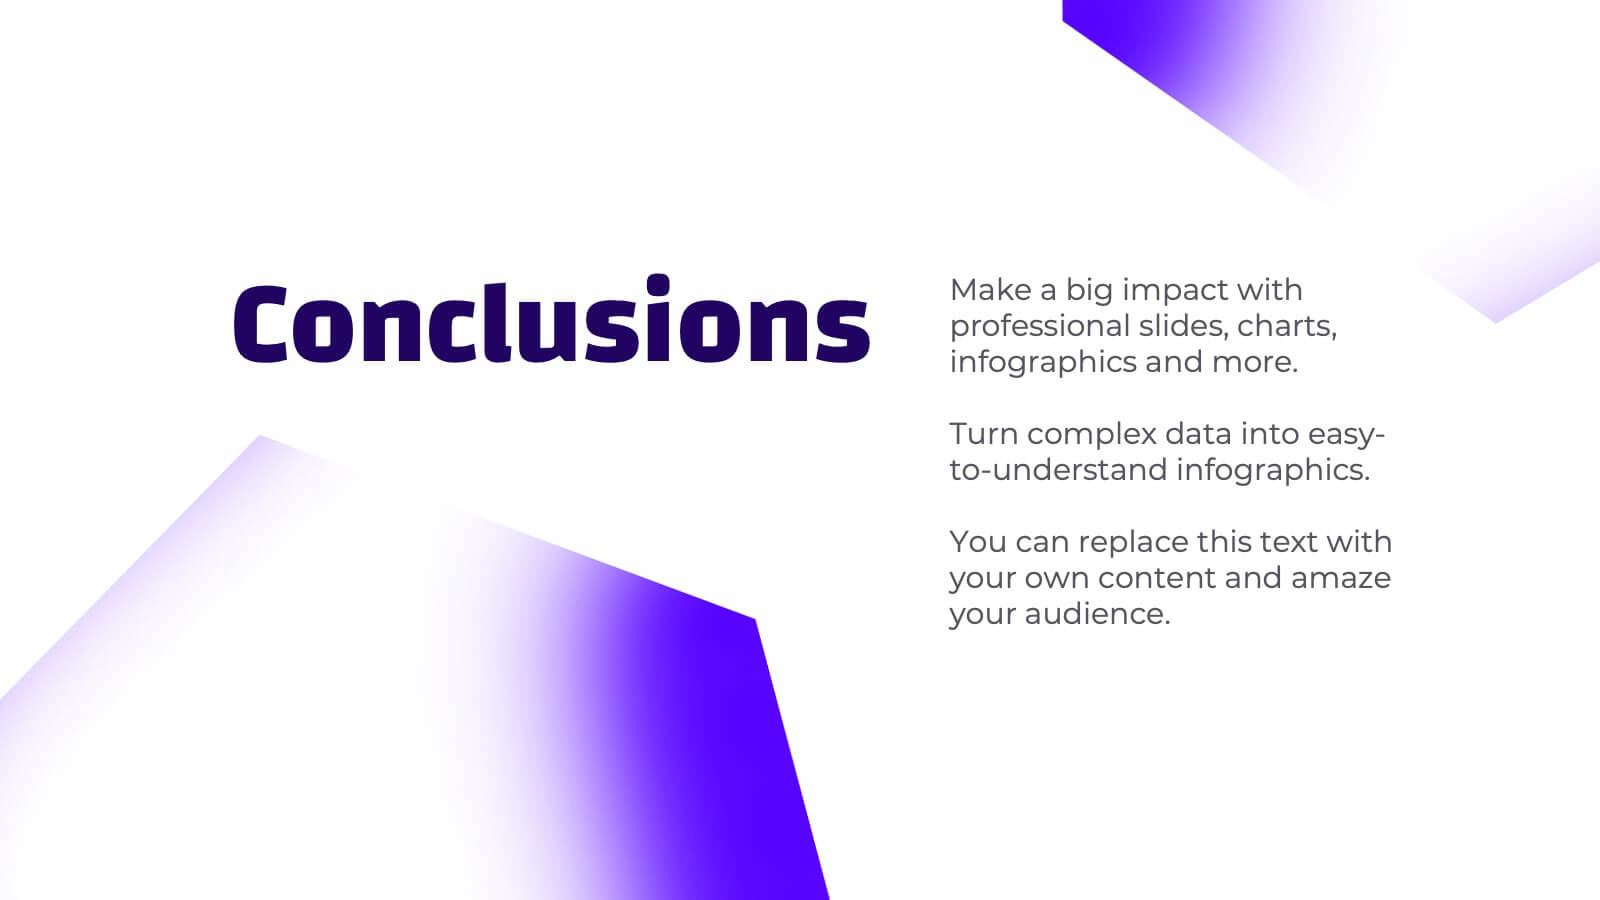
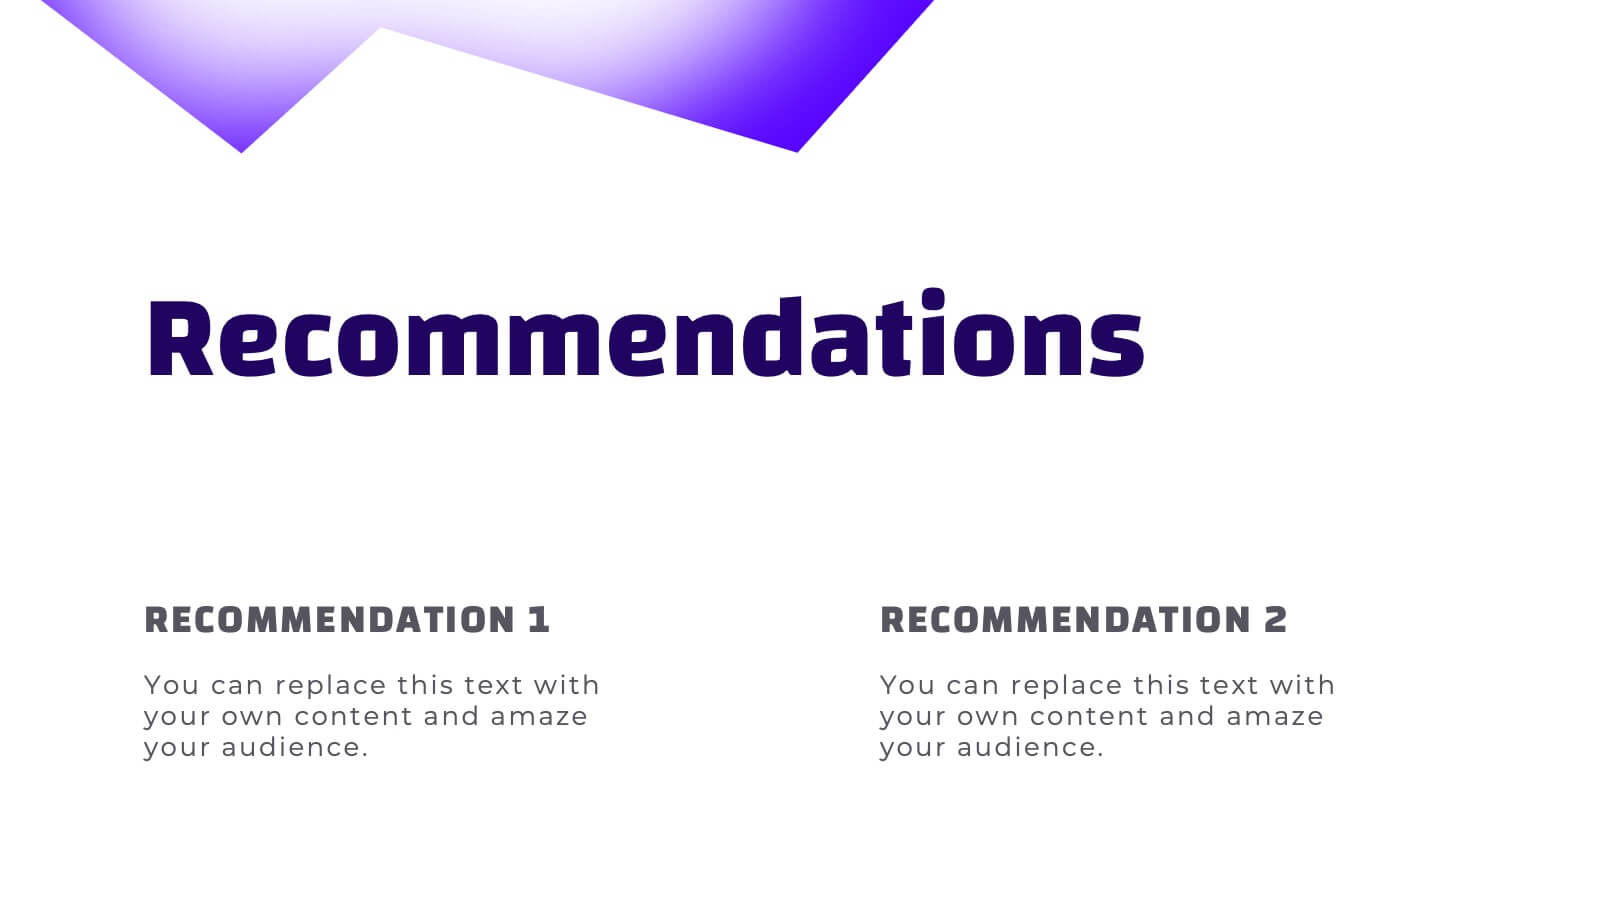
Naiad Qualitative Research Findings Presentation
Dive into your data with this refreshing, Naiad-inspired presentation template, perfect for sharing qualitative research findings! Designed to showcase insights, trends, and key conclusions with clarity, this visually appealing layout ensures your research captivates and informs. Make your data flow effortlessly. Compatible with PowerPoint, Keynote, and Google Slides for easy customization.


10 diapositivas
Adapting to Business Transformation Presentation
Guide your audience through change with this dynamic, step-by-step layout tailored for showcasing transformation journeys. The slide features a curved flow design with five customizable stages, perfect for visualizing digital shifts, organizational restructuring, or innovation roadmaps. Best for corporate strategists, consultants, and change managers. Fully editable in PowerPoint, Keynote, and Google Slides.


7 diapositivas
Medical Group Infographic
introducing our medical group infographic, a seamless blend of clinical precision and informative clarity. Designed predominantly in a calming palette of white and healing green, this infographic effectively encapsulates the diverse facets of a medical group. Through a series of graphics, specialized medical icons, and dedicated image placeholders, one can effortlessly convey intricate medical processes or healthcare strategies. This template is ideally suited for healthcare administrators, medical educators, hospital marketing teams, and anyone striving to present complex medical group data in a simplified, digestible manner.


10 diapositivas
Business Growth and Market Statistics Presentation
Showcase key business growth trends and market insights with the "Business Growth and Market Statistics" presentation templates. These visuals are crafted to enhance clarity in communicating growth drivers, market dynamics, and performance metrics effectively. Ideal for corporate presentations, they're compatible with PowerPoint, Keynote, and Google Slides, ensuring a professional look across all platforms.


5 diapositivas
Corporate Ethics and Legal Guidelines
Clearly outline company policies and ethical standards with this organized and professional slide. Featuring a checklist-style layout with customizable categories, it’s ideal for corporate trainings, compliance presentations, and HR onboarding. Fully editable and compatible with PowerPoint, Keynote, and Google Slides.