


Características


¿Tienes alguna pregunta?
Recomendar


6 diapositivas
5-Stage Workflow Presentation
Turn complex processes into clear, visual stories with this structured step-by-step layout. Ideal for showcasing project stages, workflows, or development phases, it guides your audience through each milestone with precision and flow. Fully editable and compatible with PowerPoint, Keynote, and Google Slides for easy customization and professional results.


6 diapositivas
Learning Models and Instructional Design Presentation
Present educational strategies with clarity using the Learning Models and Instructional Design Presentation. This wavy, multi-step visual helps illustrate instructional stages, e-learning workflows, or training models with ease. Ideal for educators, coaches, and corporate trainers. Fully editable in PowerPoint, Keynote, Canva, and Google Slides.


5 diapositivas
Corporate Framework and Structure
Visualize governance, compliance, and assurance in a streamlined framework. This structured slide is ideal for outlining business functions, responsibilities, and reporting lines across departments. Fully editable in PowerPoint, Keynote, and Google Slides for seamless customization.


7 diapositivas
Target Audience Demographics Slide Presentation
Capture attention with a clean, data-driven layout that makes understanding your audience quick and intuitive. This presentation helps you showcase key demographic insights, highlight behavioral patterns, and communicate strategic findings with clarity. Designed for easy editing and smooth workflow, it’s fully compatible with PowerPoint, Keynote, and Google Slides.


7 diapositivas
Target Customer Profile Infographic
This Target Customer Profile infographic template is designed to help businesses clearly define and present their ideal customer segments. Available for PowerPoint, Google Slides, and Keynote, it includes various sections to detail demographics, customer needs, purchasing habits, and more. With a clean layout and a warm color scheme of oranges and blues, it facilitates the easy organization of customer information. Icons and comparison charts enable users to visualize customer motivations, goals, and product alignment efficiently. Ideal for marketers and business planners, this template simplifies the process of profiling target customers in a visually engaging and informative manner.


8 diapositivas
Health Metrics and Wellbeing Dashboard Presentation
Visualize patient insights with this dashboard-style layout combining human figures, progress bars, and anatomical icons. Ideal for healthcare data, wellness reporting, or gender-based analysis, it balances stats and storytelling effectively. Customize it easily in PowerPoint, Keynote, or Google Slides for your next health-focused presentation.


4 diapositivas
Employee Training and Development
Train smarter, not harder—with this bold funnel-style visual that maps your employee development journey from initial training to measurable impact. It's perfect for illustrating progress, performance shifts, or development stages across teams or roles. Fully customizable in PowerPoint, Keynote, and Google Slides for smooth integration into any professional presentation.


6 diapositivas
Change Management Process Infographic
Change management is a structured approach used by organizations to transition from their current state to a desired future state. This infographic template is designed to showcase the steps and components involved in managing organizational changes effectively. This template helps viewers understand the process and key elements required for successful change management. This informative infographic can be shared with employees, managers, or students to provide a clear understanding of the steps and strategies involved in successfully implementing organizational changes. Compatible with Powerpoint, Keynote, and Google Slides.


6 diapositivas
Data-Driven Decision Making Presentation
Showcase your data-to-action process with this clean, step-by-step layout. Ideal for illustrating analytics workflows, this template features five connected stages with modern icons and clear labeling. Perfect for business, tech, or strategy presentations. Fully editable in Canva, PowerPoint, and Google Slides to match your branding and communication needs.


6 diapositivas
Circular Strategy Wheel Breakdown Presentation
Visualize interconnected steps or strategies using this five-part circular wheel layout. Ideal for showcasing workflows, processes, or recurring phases. Each segment includes an icon, number, and editable text field. Perfect for business, marketing, or planning teams. Fully customizable in PowerPoint, Keynote, and Google Slides to match your branding needs.


8 diapositivas
Product Development and Innovation
Break down your product journey with this modern step-by-step infographic. Ideal for startups, product managers, and innovation teams, this slide illustrates four stages—perfect for visualizing design thinking, MVP rollouts, or feature planning. Easily editable in PowerPoint, Keynote, and Google Slides.


21 diapositivas
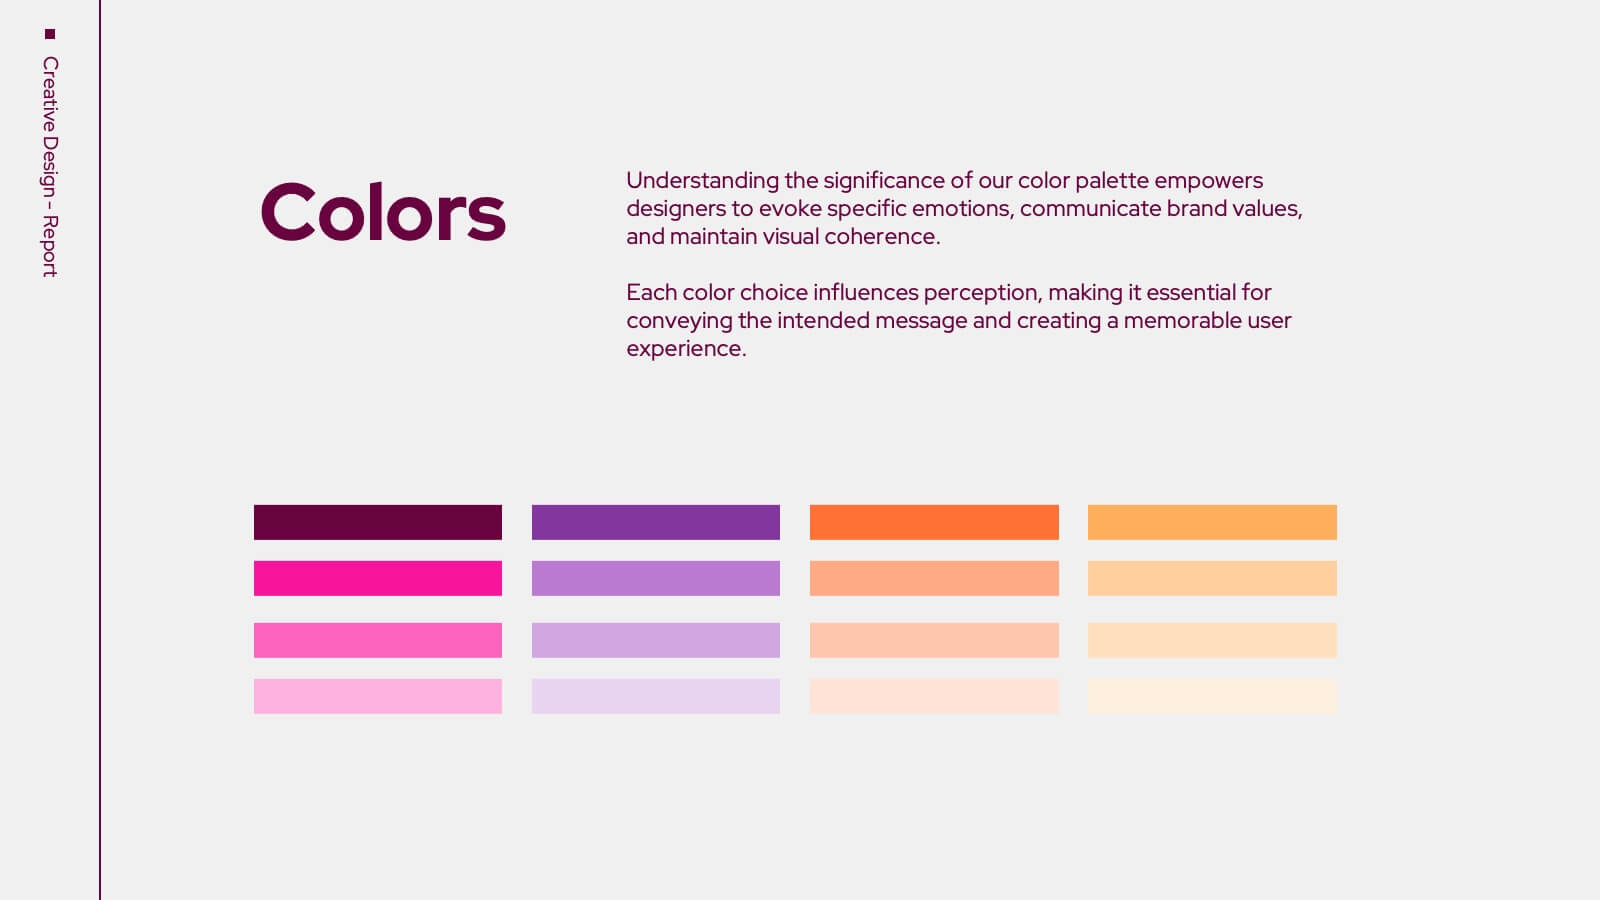
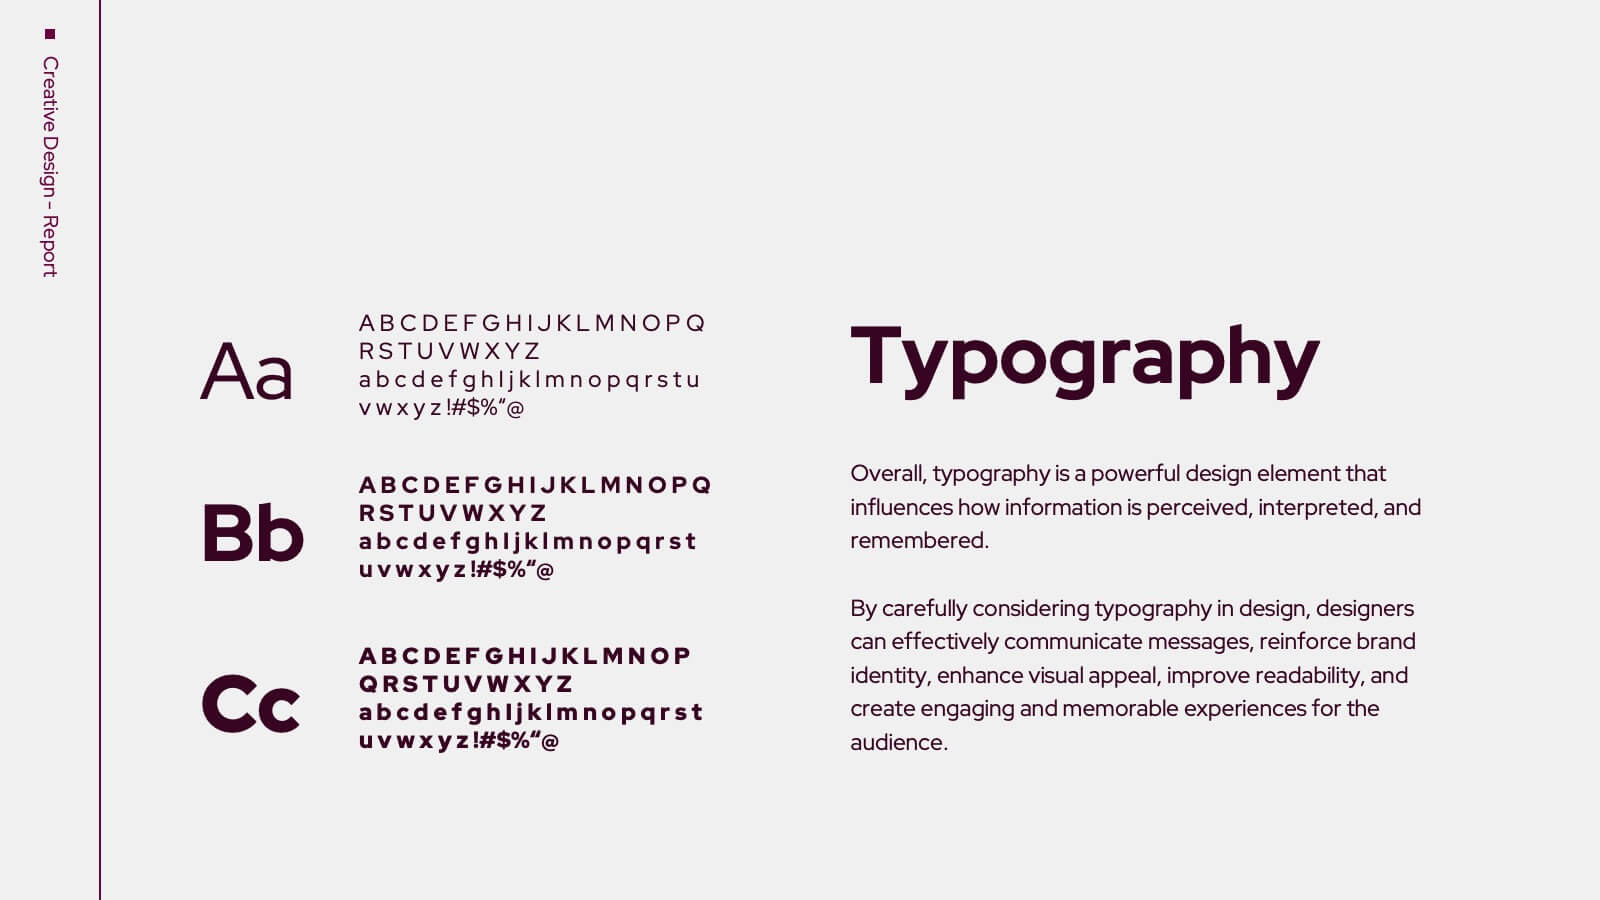
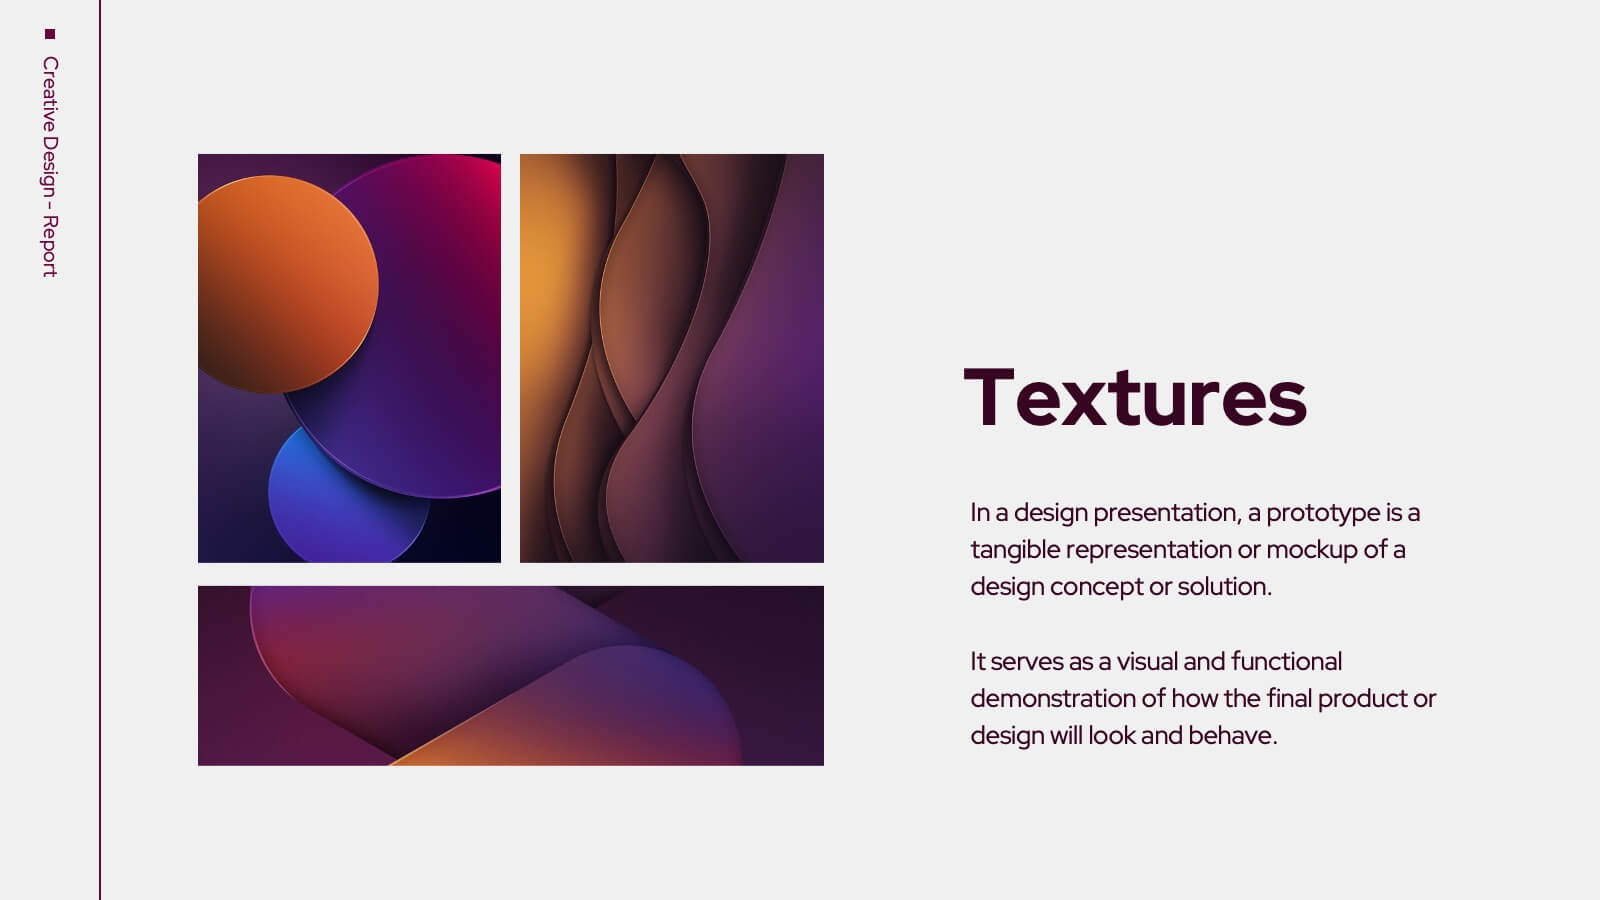
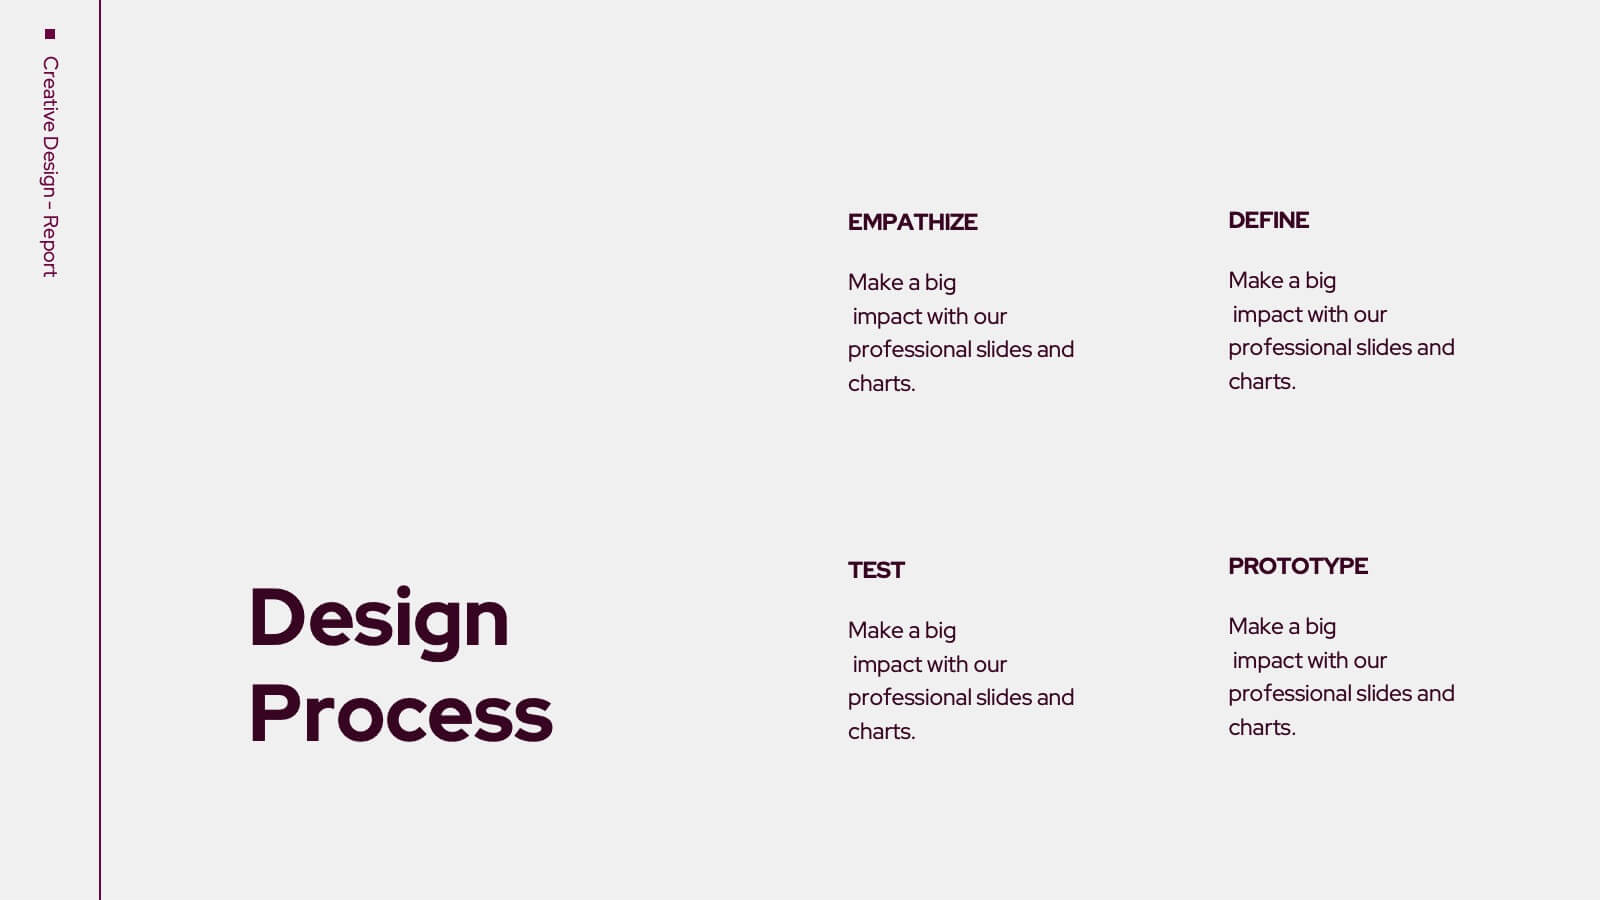
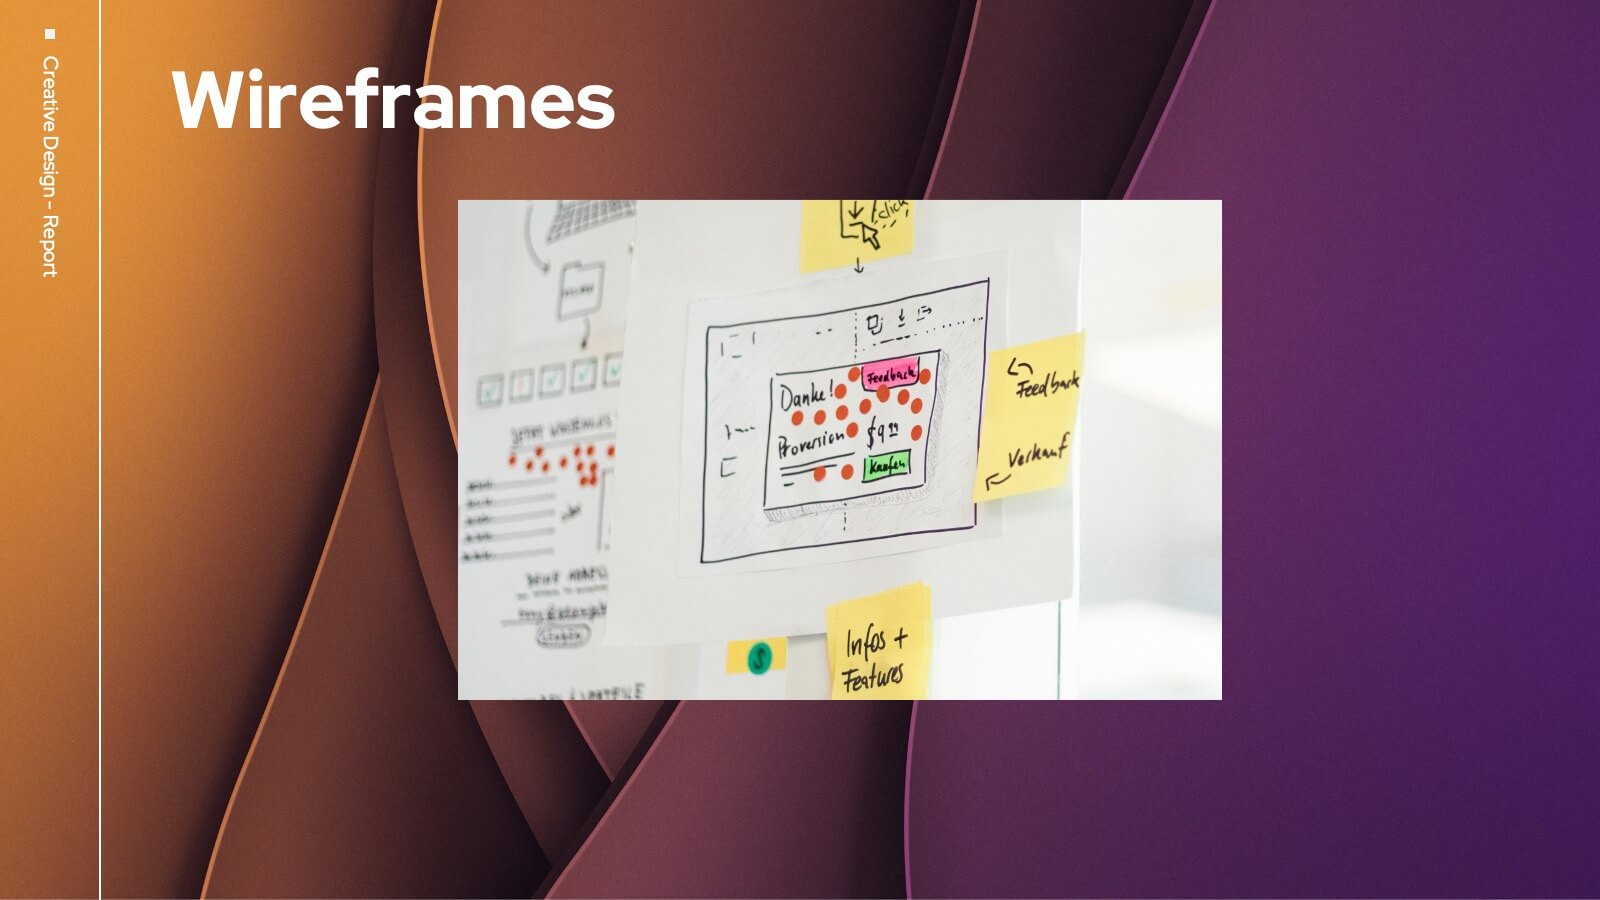
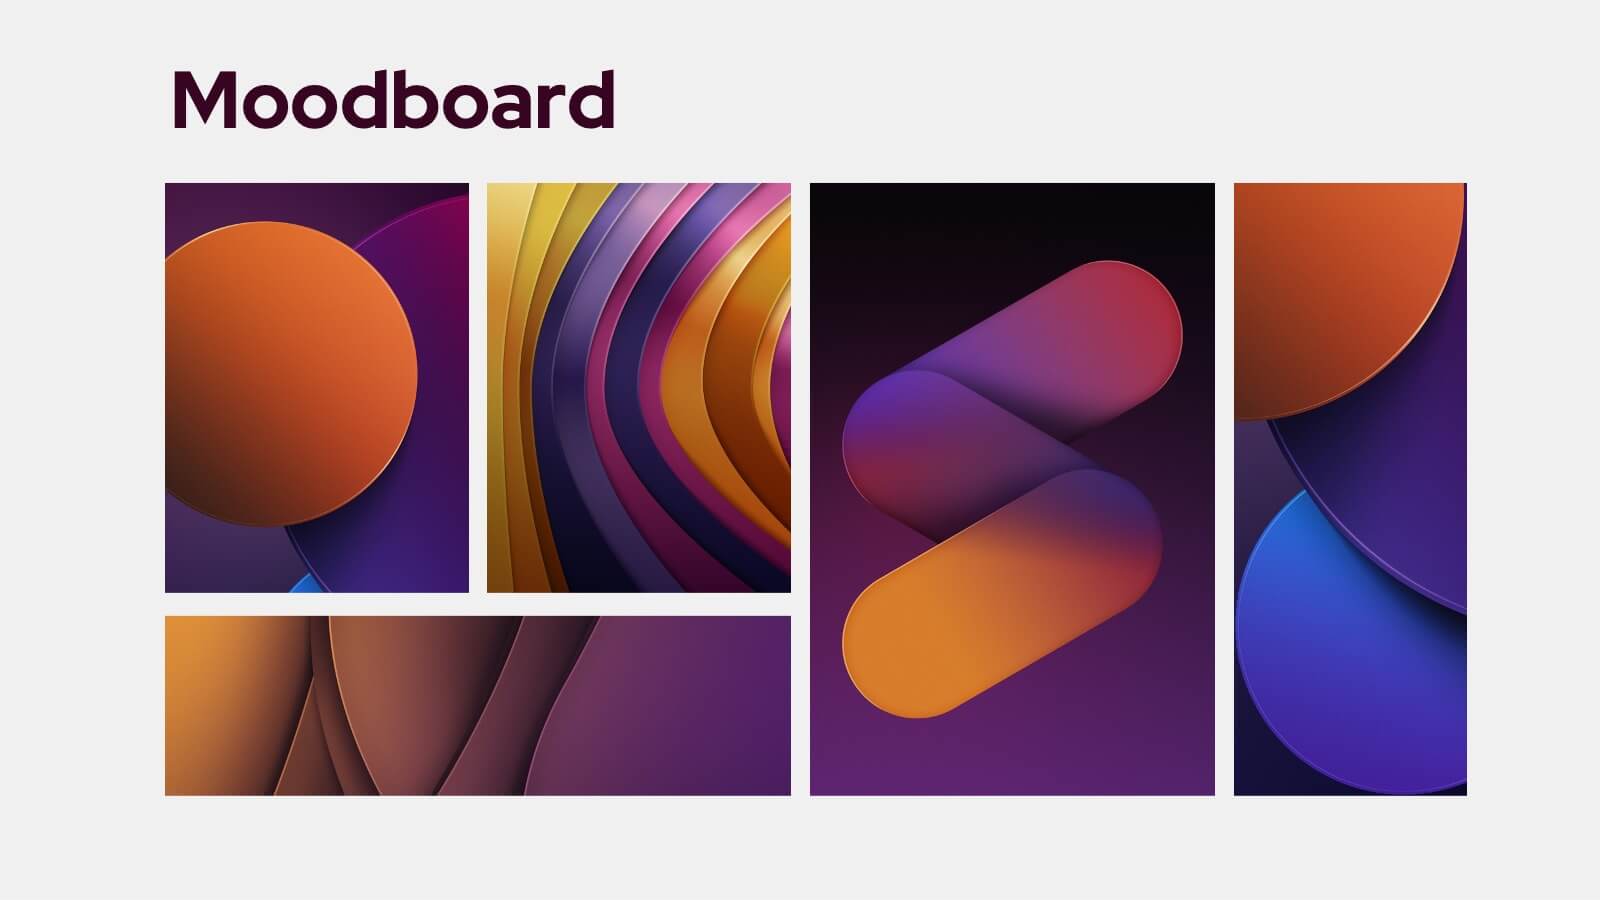
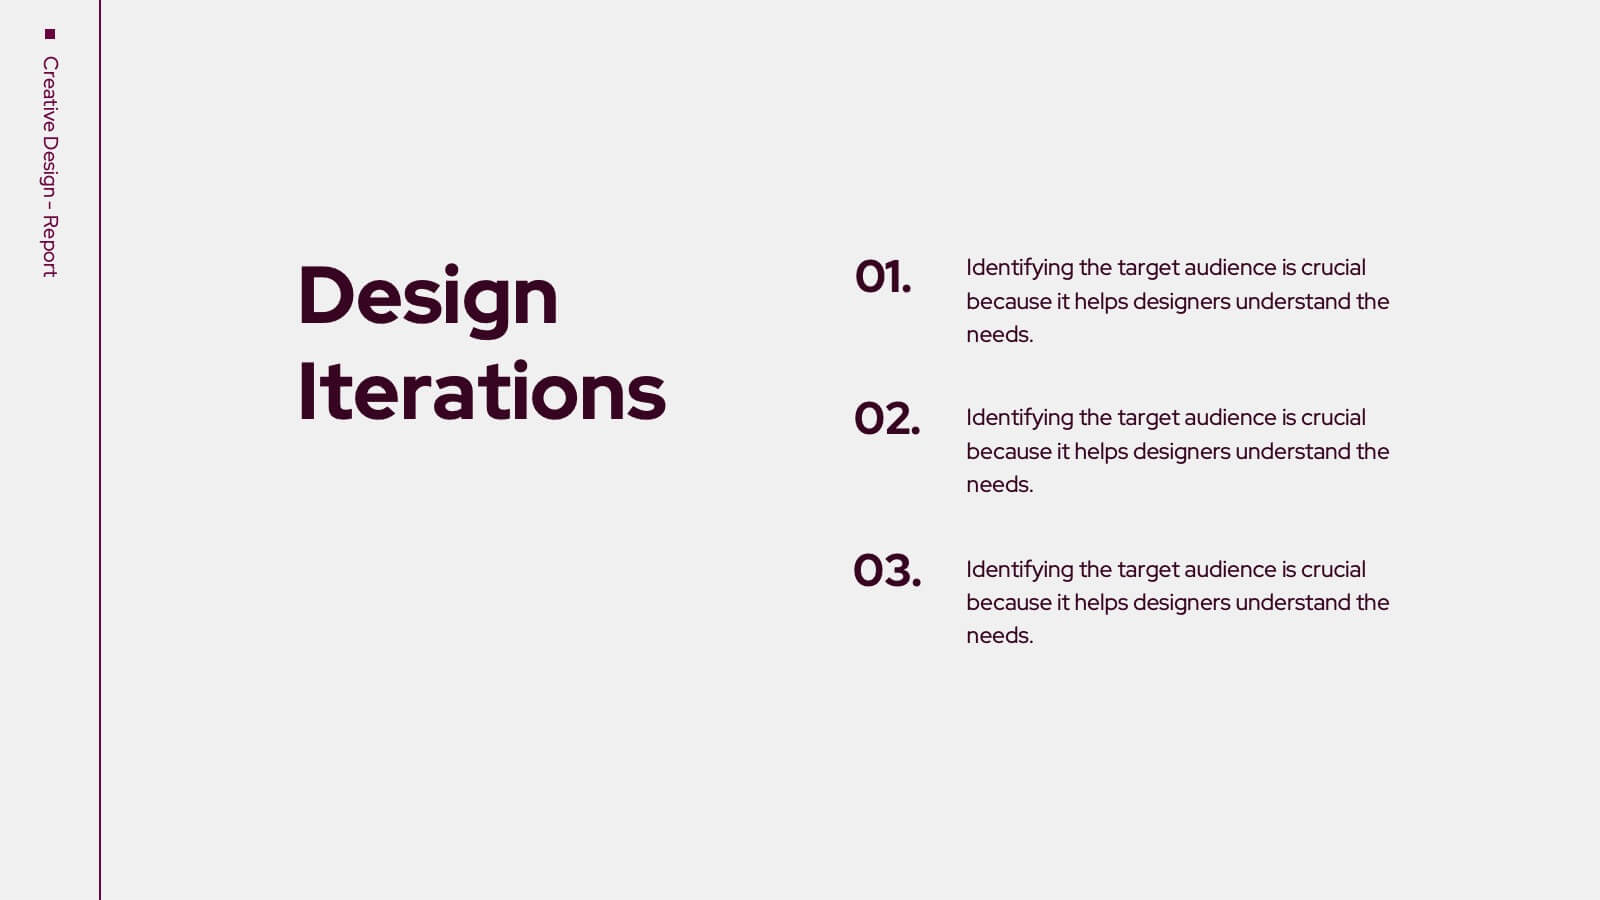
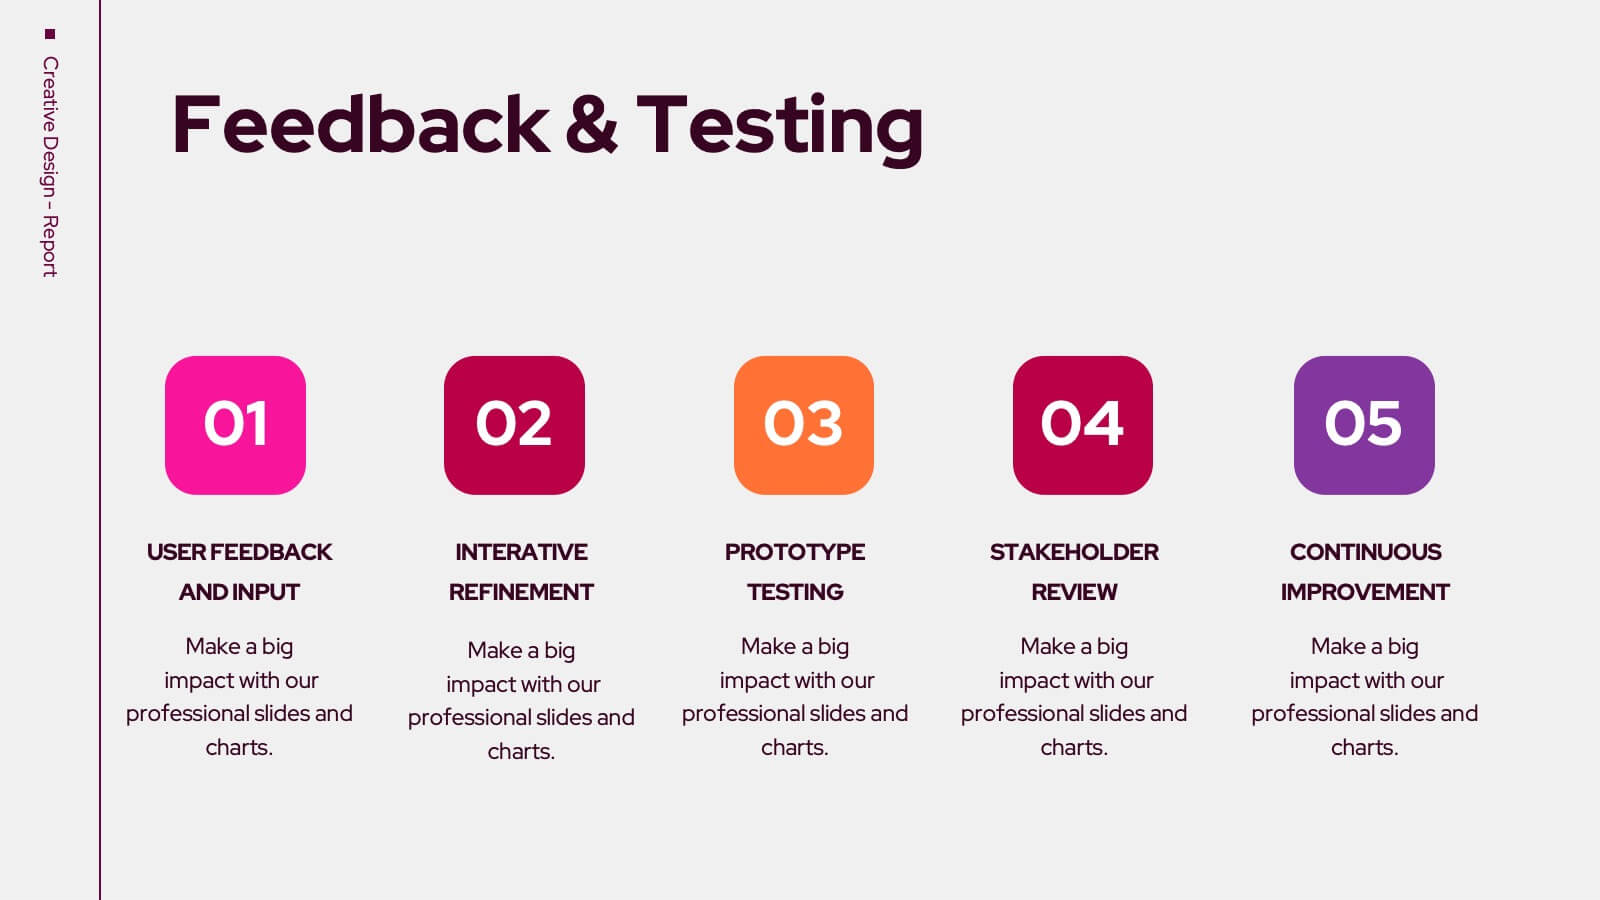
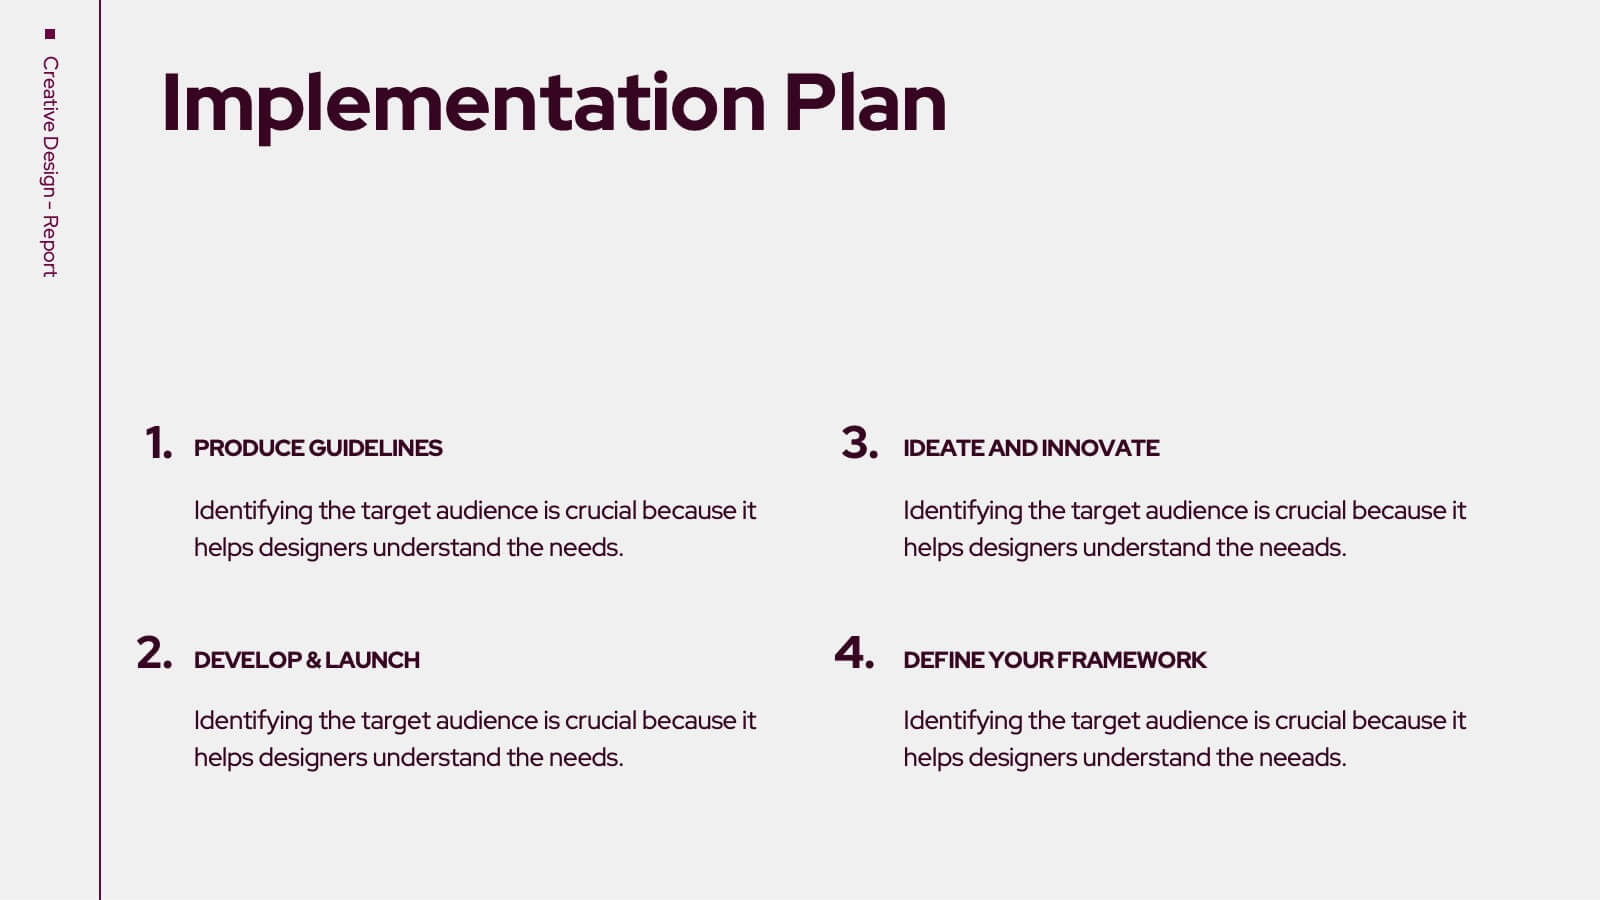
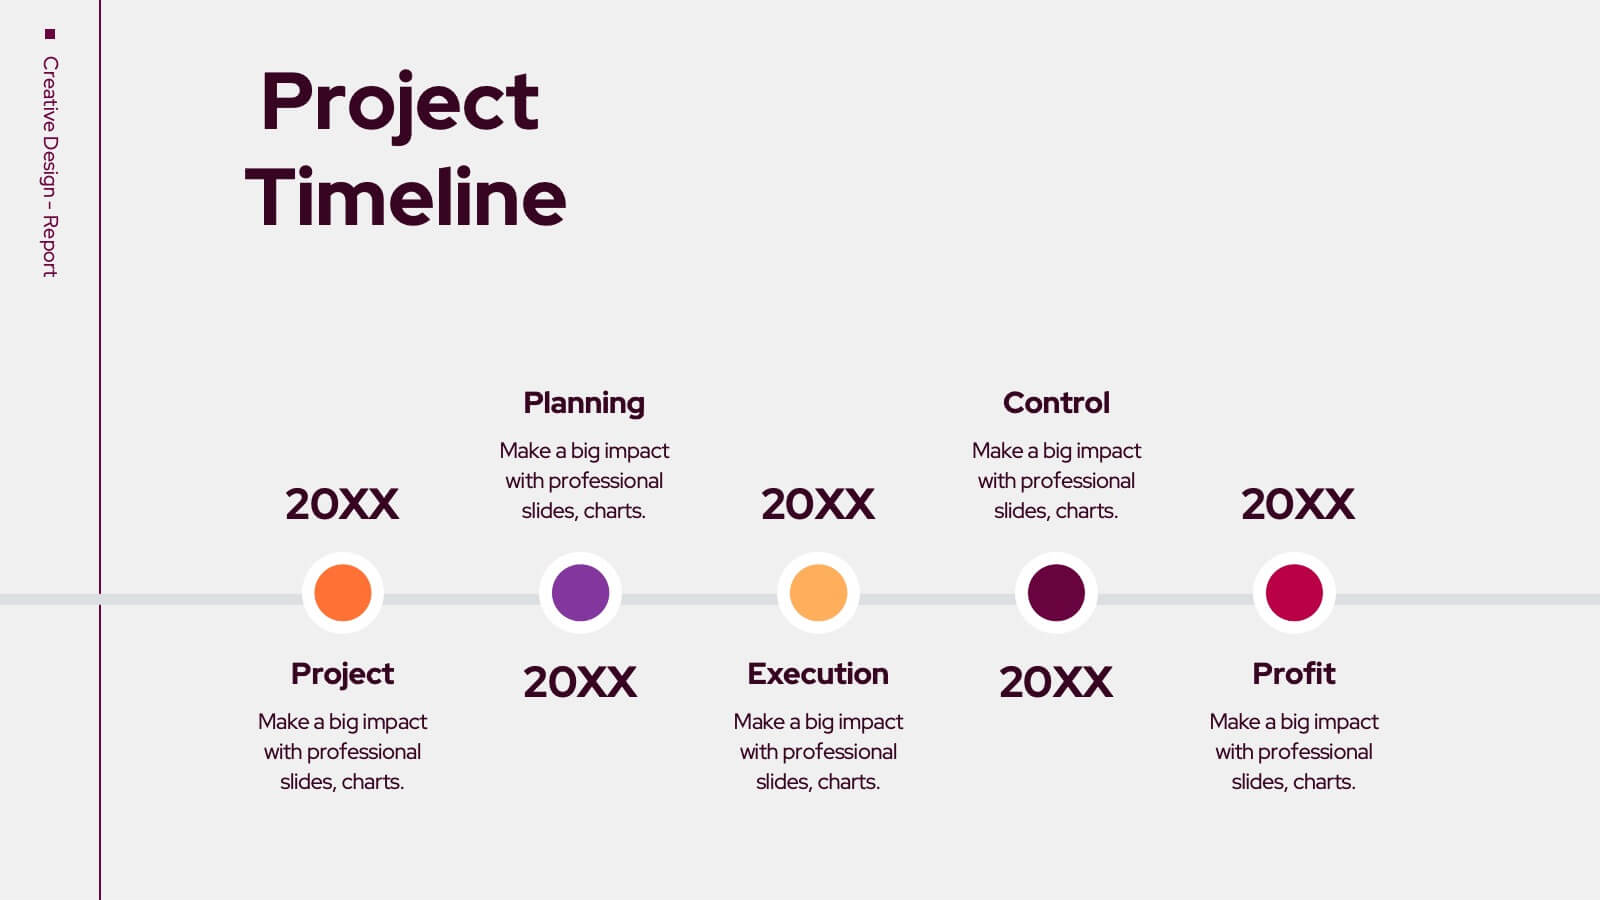
Trojan Creative Design Report Presentation
Unleash your creativity with this striking Trojan-inspired presentation template! Ideal for showcasing your design projects, this presentation enables you to highlight key concepts, inspirations, and visual elements effectively. Its engaging layout ensures your ideas shine through, captivating your audience. Compatible with PowerPoint, Keynote, and Google Slides for seamless presentations.
5 diapositivas
Business Strategy Arrow Presentation
Enhance your strategic planning with the Business Strategy Arrow Presentation. This visually structured template guides your audience through a step-by-step progression, making it ideal for business roadmaps, strategic plans, and goal-oriented workflows. Easily customize the colors, text, and icons to align with your brand. Fully compatible with PowerPoint, Keynote, and Google Slides for effortless editing and professional presentations.


5 diapositivas
Impacts of Information Technology Infographics
Information Technology has had a profound impact on various aspects of society, including business, communication, education, healthcare, and entertainment. These infographic templates are designed to help you communicate complex technological concepts in a visually compelling way, making it suitable for IT professionals, businesses, or anyone interested in understanding and highlighting the transformative power of information technology. The template features a sleek design with customizable layouts, icons, and color schemes that can be adjusted to match your branding. It is compatible with PowerPoint, Keynote, and Google Slides.


4 diapositivas
3-Circle Venn Diagrams Presentation
Unlock clarity with a bold visual that highlights how ideas, data, or teams connect at key intersection points. This presentation makes complex relationships easy to explain with clean circles, labels, and structured insights. Fully editable and compatible with PowerPoint, Keynote, and Google Slides.


5 diapositivas
4-Phase Product Lifecycle Diagram Presentation
Visualize your product’s evolution with the 4-Phase Product Lifecycle Diagram Presentation. Perfect for marketing, strategy, and product teams, this template maps out introduction, growth, maturity, and decline stages. Fully editable in PowerPoint, Keynote, and Google Slides—ideal for product managers, analysts, and educators presenting strategic roadmaps or lifecycle planning.


5 diapositivas
Brain Chemistry Infographics
Brain chemistry refers to the complex interplay of chemicals, also known as neurotransmitters, that are responsible for transmitting signals within the brain. These infographic templates are designed to illustrate the intricate workings of brain chemistry. They aim to explain complex concepts in a clear and engaging way, making it suitable for educational settings, psychology courses, neuroscience presentations, or any context where understanding brain chemistry is essential. These templates set the foundation for exploring various aspects of brain chemistry. Colorful illustrations and icons help visualize the neurotransmitters and their impact.