


Características


¿Tienes alguna pregunta?
Recomendar


2 diapositivas
Pink Ribbon Event Slide Deck Presentation
Bring awareness and compassion to your presentation with a bold ribbon design that symbolizes unity and support. Perfect for health campaigns, charity events, or educational talks, this layout helps you share key messages with clarity and impact. Fully compatible with PowerPoint, Keynote, and Google Slides for easy customization.


7 diapositivas
Mind Map Program Infographic Presentation
Mind Maps are appealing visuals that are easy to follow. Use our high quality template to create a mind map infographic that explains your concepts, or use it to highlight the benefits of your product in an educational way. Map out your ideas and create a visual that can be explored from many different directions. This template is suitable for both business and educational applications, so you can use it at work, school or as part of your portfolio. It’s easy to customize and compatible with PowerPoint, Keynote and Google Slides. Easily create a dynamic and engaging project in just minutes!


4 diapositivas
Healthcare Impact on Breast Cancer Day Presentation
Educate and inspire with the Healthcare Impact on Breast Cancer Day Presentation. This thoughtfully designed layout uses meaningful visuals to highlight data, awareness efforts, and key messages around breast cancer healthcare. Ideal for awareness campaigns, health reports, or nonprofit presentations. Fully editable in PowerPoint, Google Slides, Keynote, and Canva.


6 diapositivas
Circle Schedule Infographic
A circle schedule, also known as a radial schedule, is a visual representation of time management that organizes tasks or activities in a circular format. This visually engaging infographic allows you to create a dynamic and intuitive schedule using a circular design. The template offers a creative way to showcase time-based information, such as daily routines, event schedules, project timelines, or weekly agendas. This can be used in various contexts where schedules or timelines need to be visually presented. Fully customizable and compatible with Powerpoint, Keynote, and Google Slides.

20 diapositivas
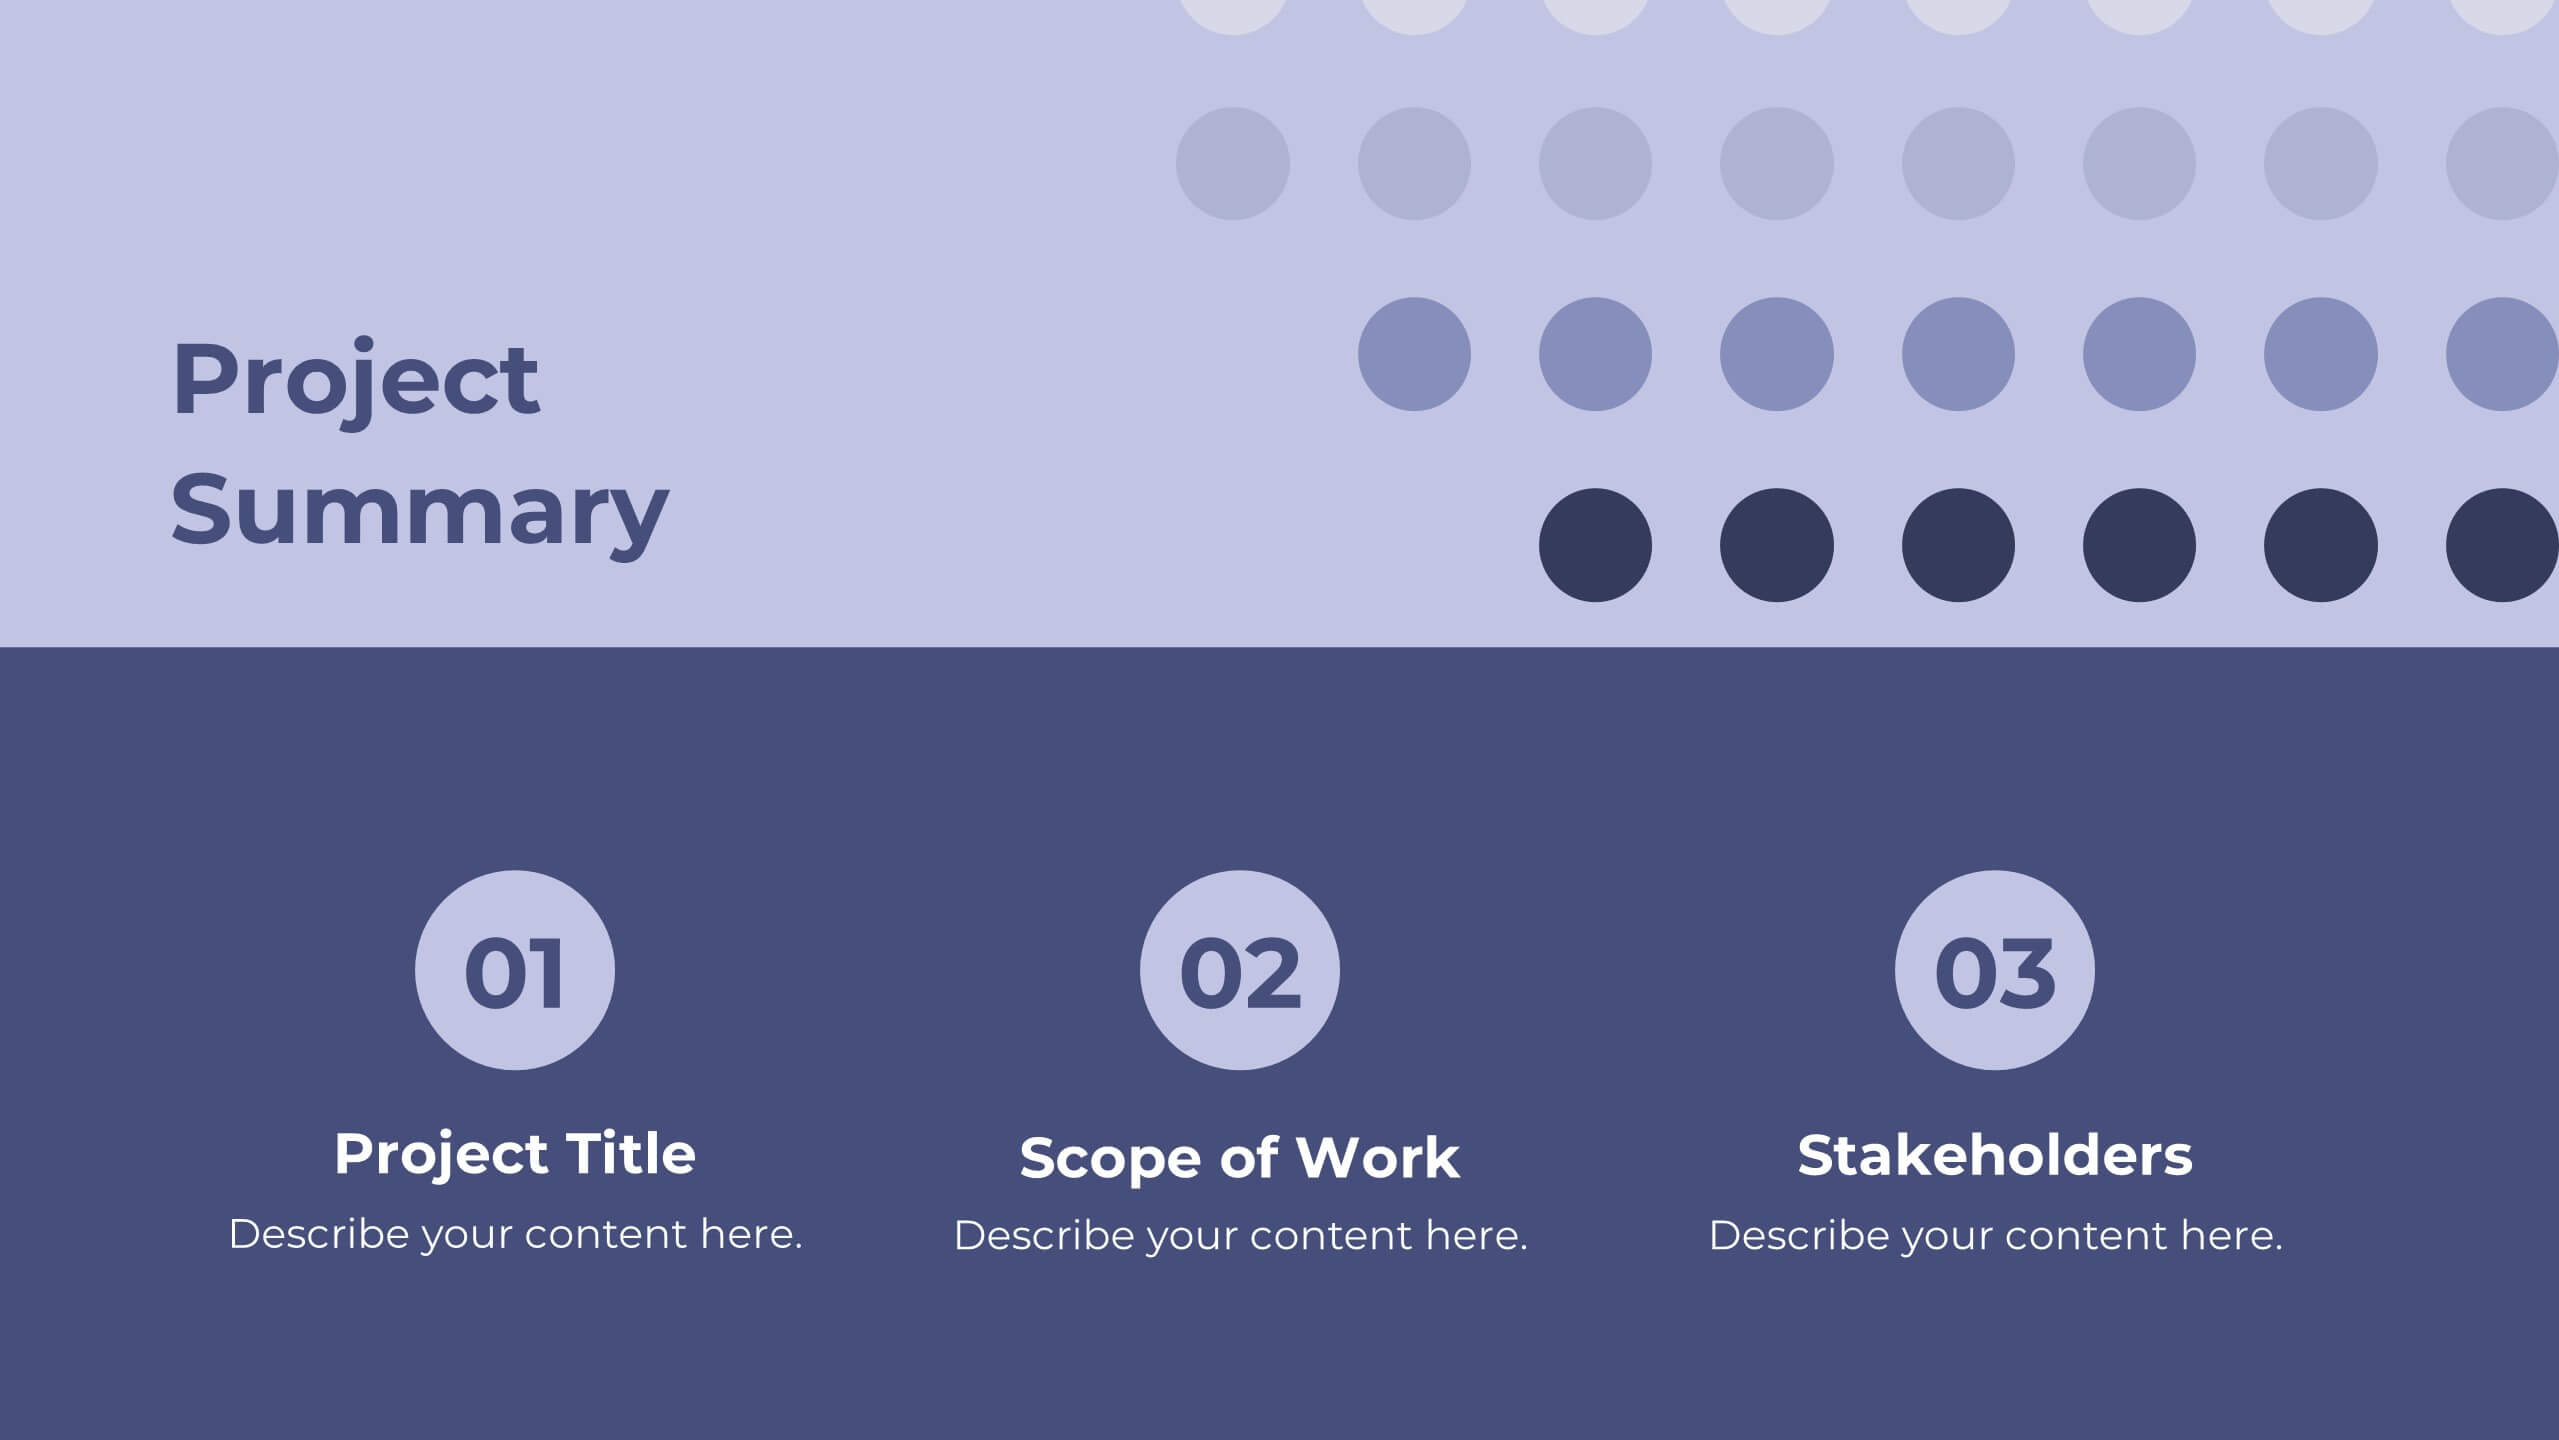
Labyrinth Project Proposal Presentation
Present your project proposal with this clean and professional template! Covering sections such as objectives, scope of work, timeline, and budget breakdown, it helps you convey your plan clearly and effectively. Fully customizable and compatible with PowerPoint, Keynote, and Google Slides, it’s perfect for delivering impactful proposals to clients.


5 diapositivas
Buyer Journey Infographic Presentation
Understanding how buyers move from awareness to action becomes effortless with this clean, visual presentation. It guides you through each stage, helping you explain behaviors, insights, and touchpoints with clarity. Easy to customize and fully compatible with PowerPoint, Keynote, and Google Slides.


2 diapositivas
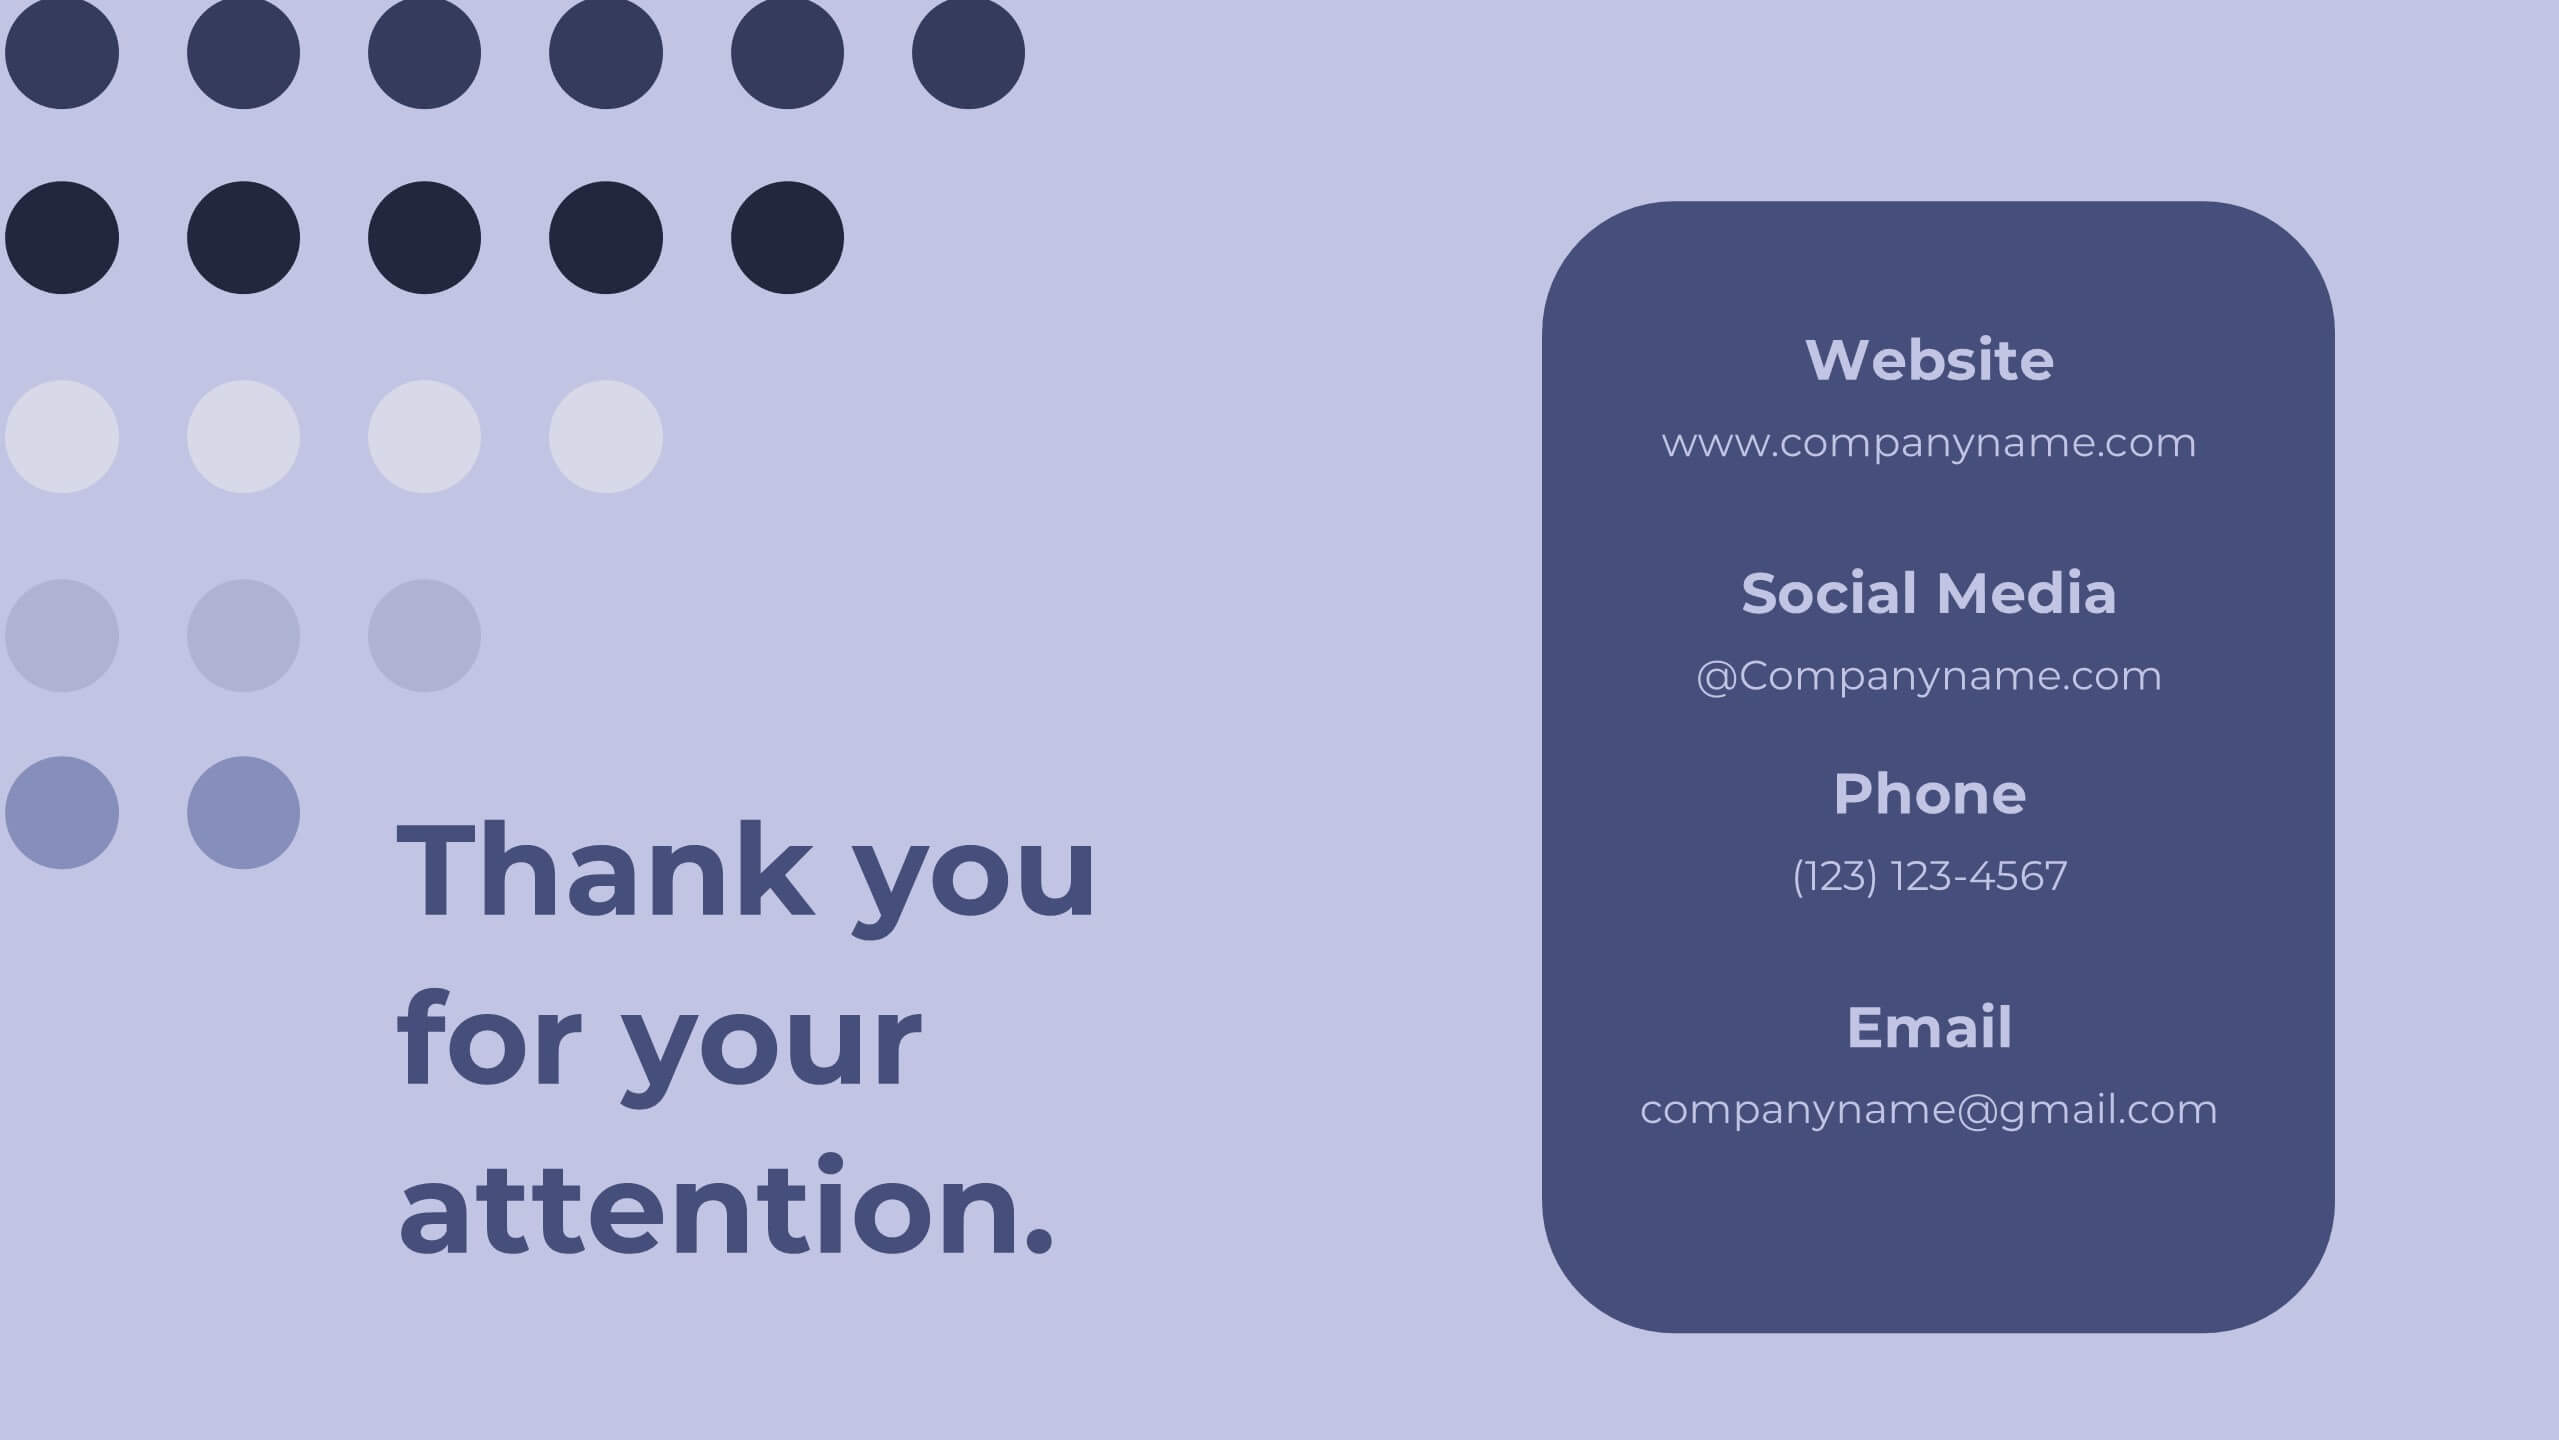
Closing Slide with Appreciation Note Presentation
Wrap up your presentation with energy using the Closing Slide with Appreciation Note Presentation. This bold, modern design features a “Thanks” message and a standout CTA—perfect for directing your audience to more content. Includes light and dark background options to match your theme. Fully editable in Canva, PowerPoint, Keynote, and Google Slides.


4 diapositivas
Leadership and Team Challenges Presentation
Illustrate your team’s journey with this engaging visual that highlights progress, obstacles, and achievements. Featuring a dynamic leader figure ascending an arrow-shaped path, this template is ideal for showcasing leadership development, team-building stages, or challenge-resolution frameworks. Fully editable and compatible with PowerPoint, Keynote, and Google Slides.


6 diapositivas
Results & Milestones Shown with Numbers
Track progress and showcase success with the Results & Milestones Shown with Numbers Presentation. This visual timeline highlights five key steps using numbered markers connected by a path—perfect for reporting achievements, product phases, or strategic milestones. Fully editable in PowerPoint, Keynote, and Google Slides.


5 diapositivas
Product Life Cycle Diagram Presentation
Bring your business insights to life with this dynamic visual layout designed to simplify complex growth stages. Ideal for showcasing product performance, innovation timelines, or strategic planning, it transforms data into a clear, engaging narrative. Fully editable and compatible with PowerPoint, Keynote, and Google Slides for professional use.


21 diapositivas
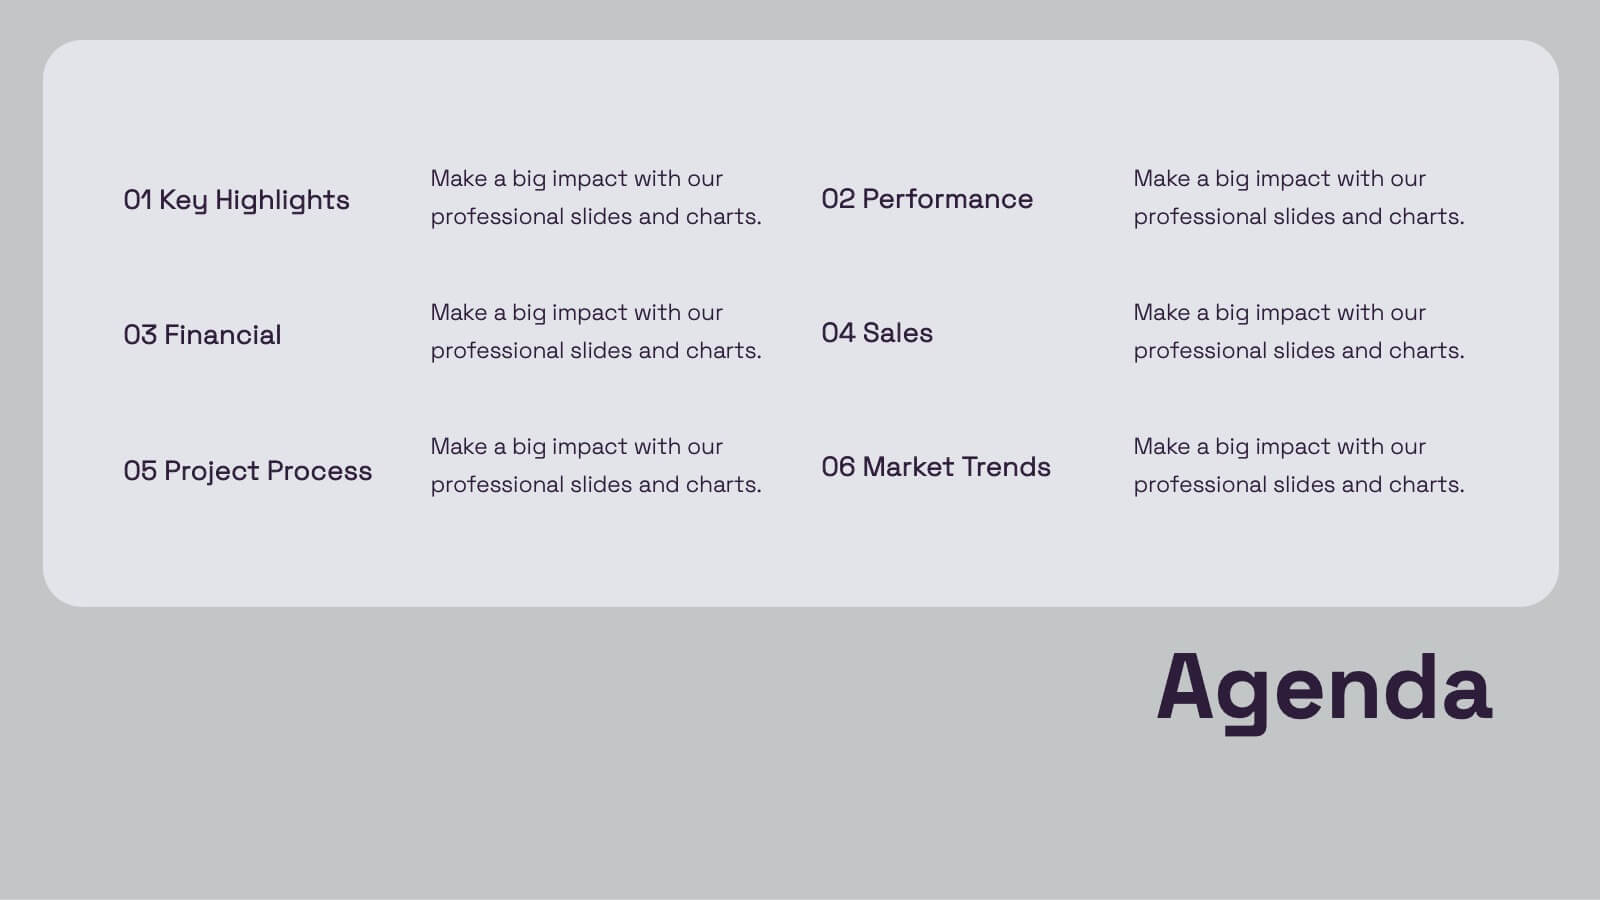
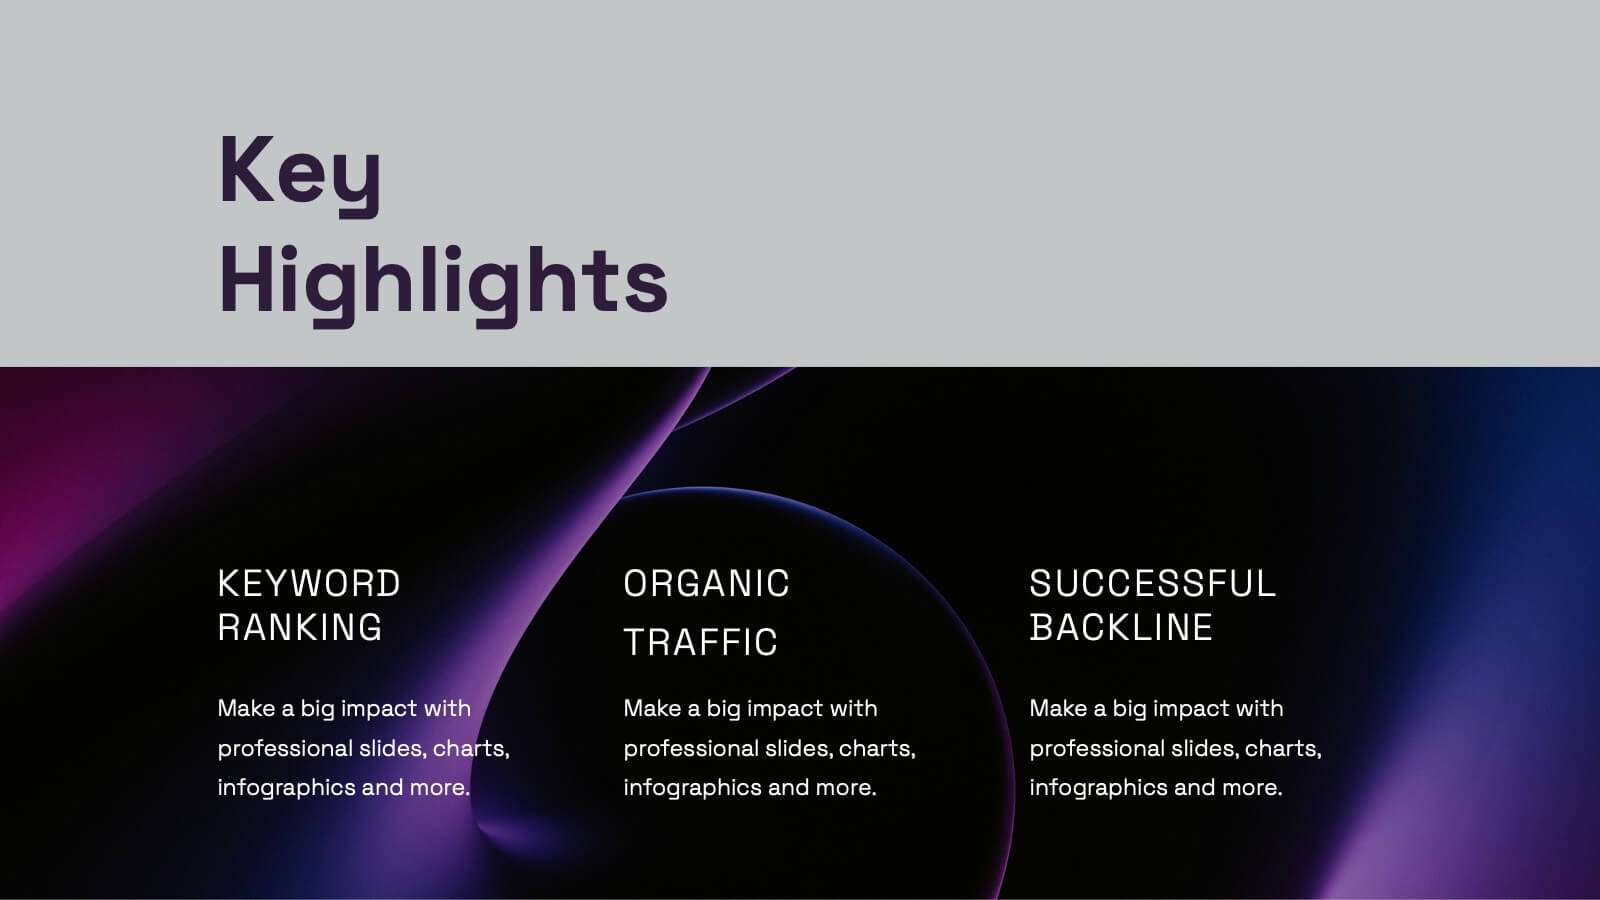
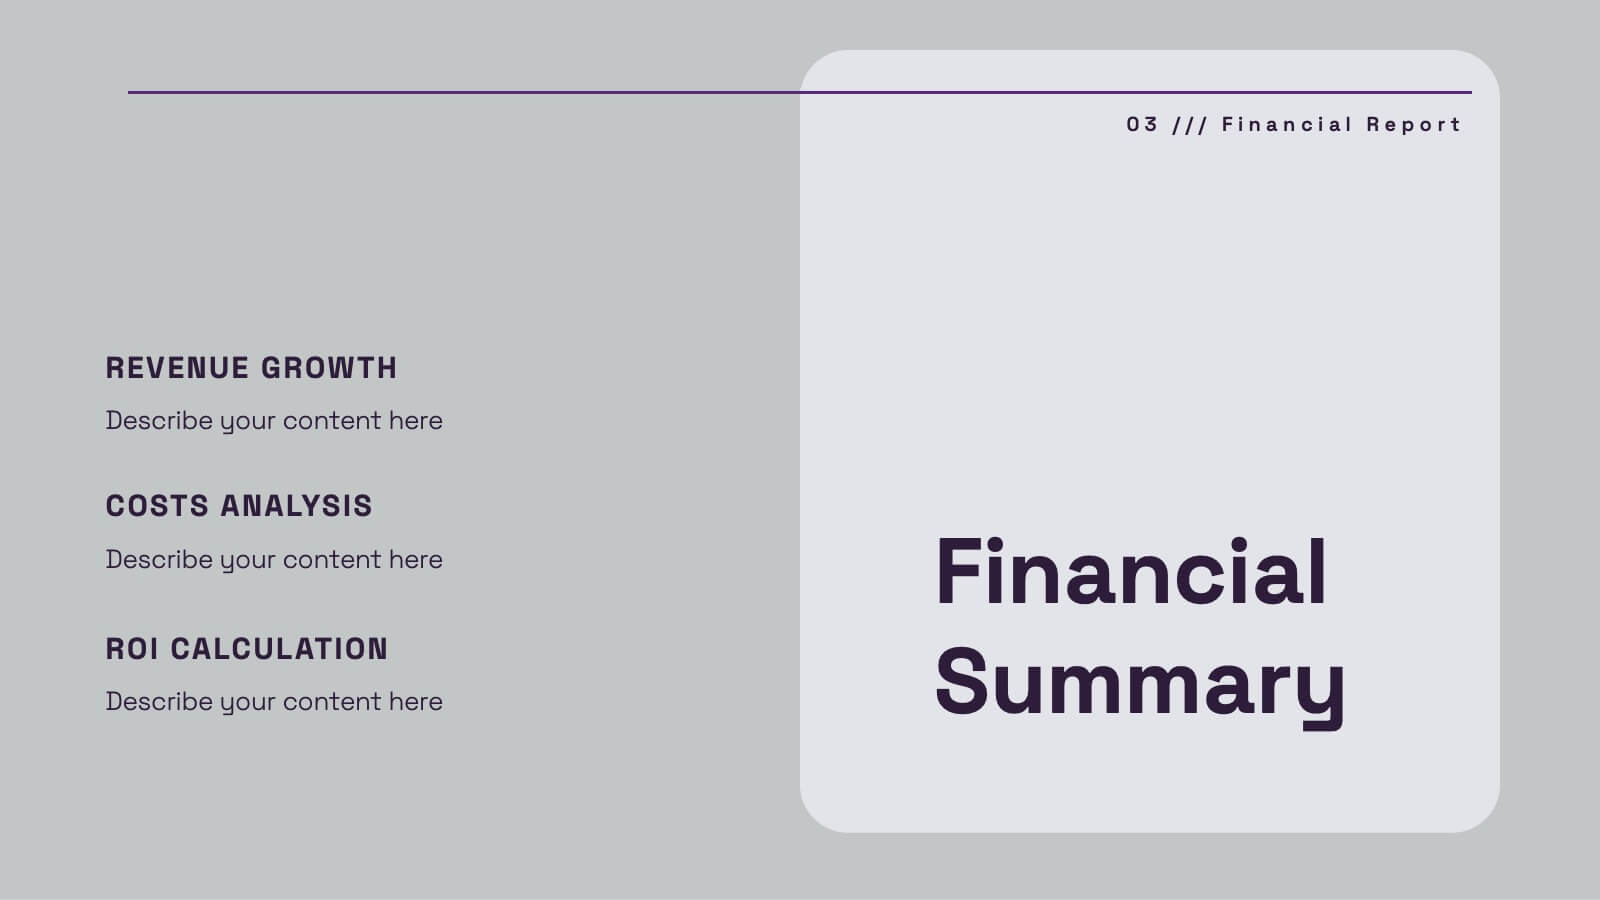
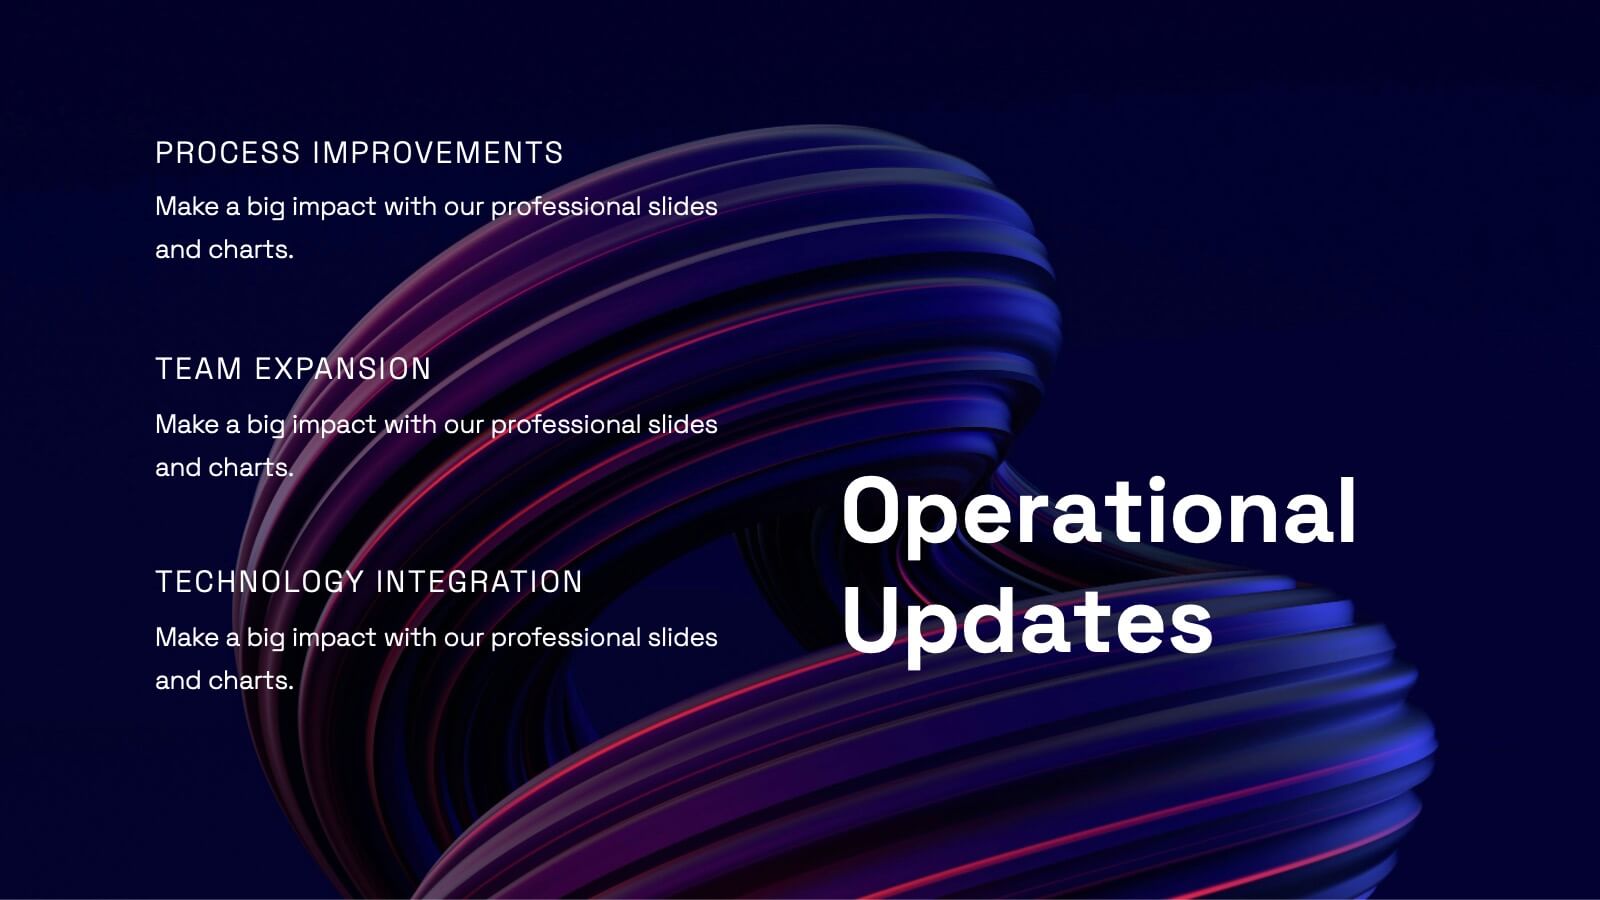
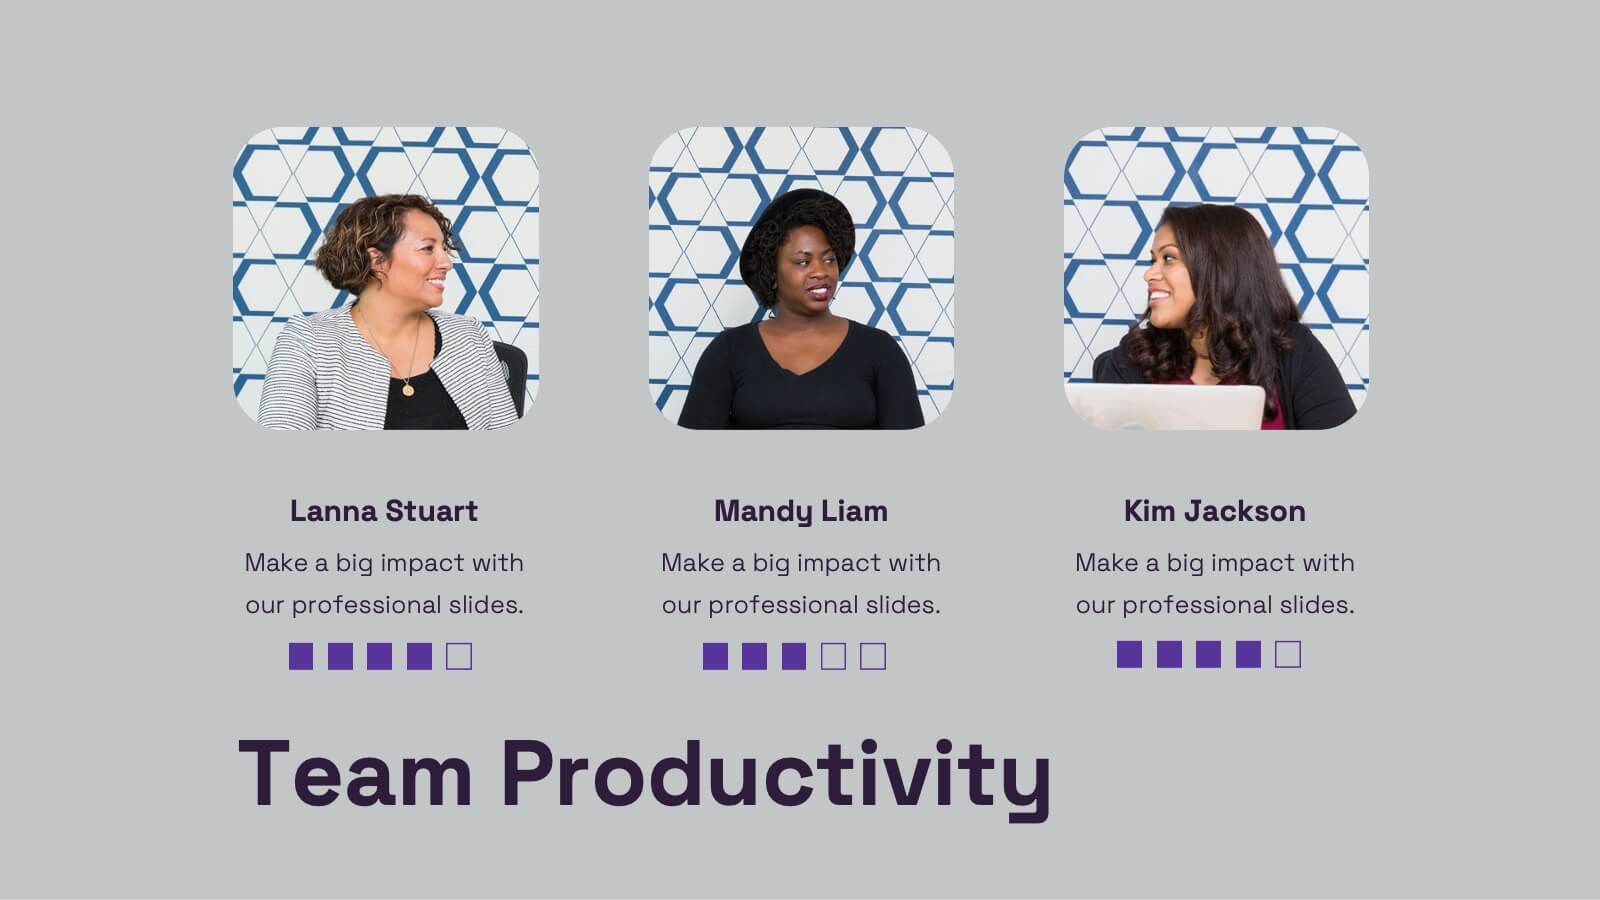
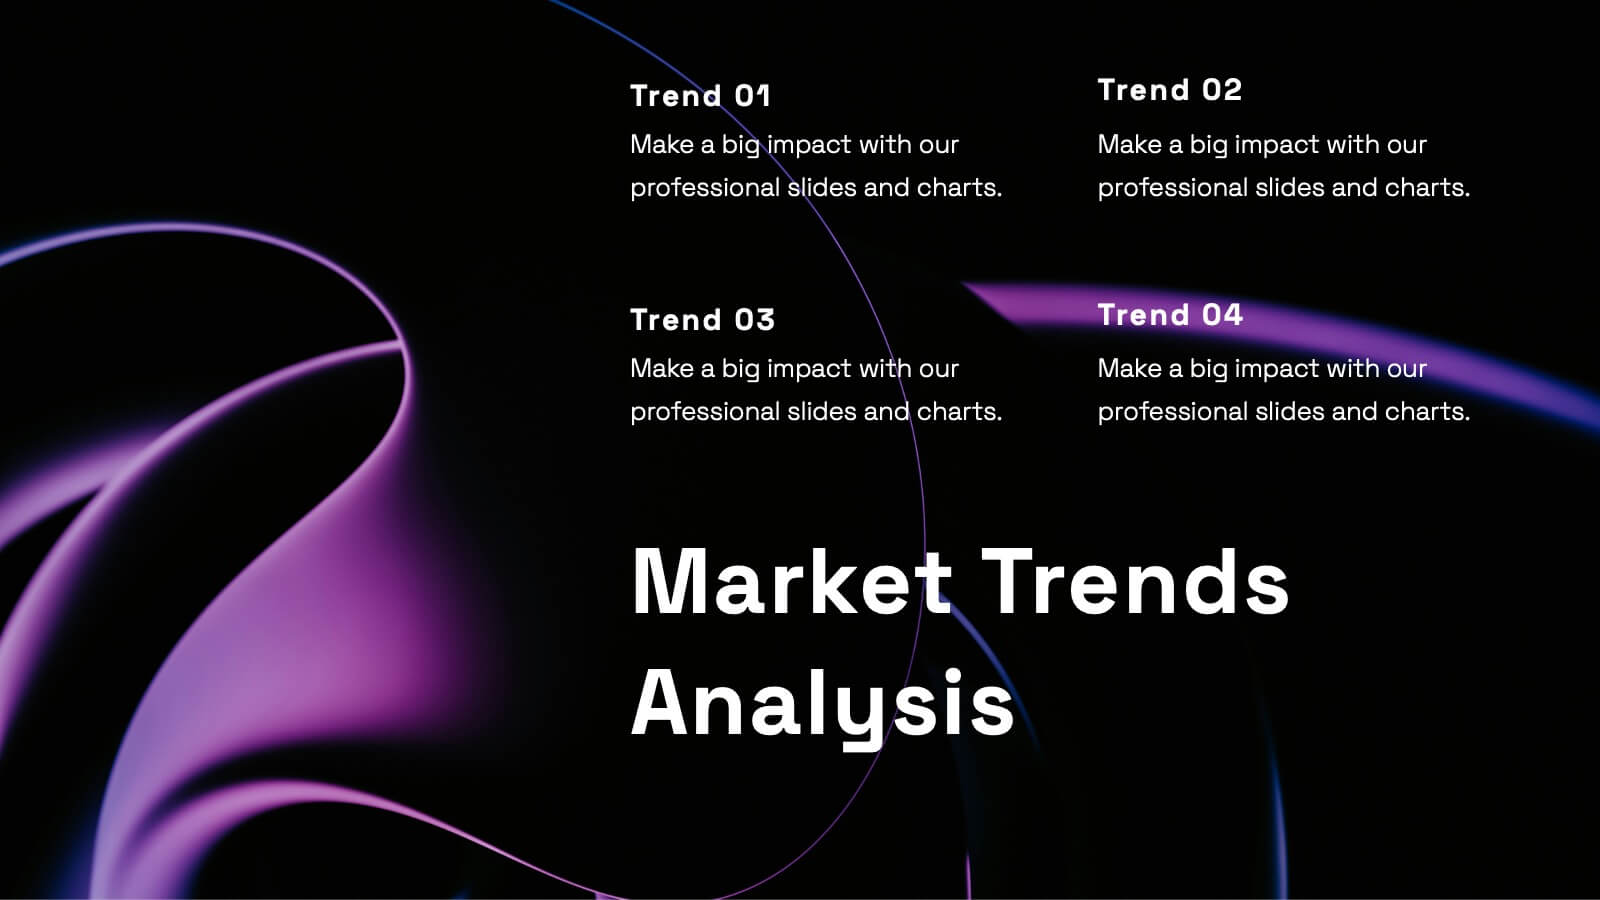
Uplift Financial Report Presentation
Present your financial or business report with this sleek and modern presentation template! It includes essential sections such as performance metrics, financial summaries, project progress, and market trends analysis, ensuring a comprehensive overview. Whether you're discussing key achievements or competitor insights, this template is perfect for delivering a professional and polished report. Compatible with PowerPoint, Keynote, and Google Slides for easy use and customization.


5 diapositivas
Healthcare Services and Medical Systems Presentation
Visualize your healthcare processes with this hexagonal layout designed for medical topics. Each section highlights key service areas, ideal for presenting hospital systems, diagnostics, or treatment paths. With five editable steps, it's perfect for health professionals, researchers, or medical trainers using PowerPoint, Keynote, or Google Slides.


5 diapositivas
Western Europe Political Map Slide Presentation
Showcase political insights and regional data with a clear, modern map design that highlights countries across Western Europe. Perfect for comparing demographics, election data, or market performance, this layout combines clarity with visual impact. Fully compatible with PowerPoint, Keynote, and Google Slides for easy customization and professional presentations.


3 diapositivas
Emerging Tech Innovations Deck Presentation
Present futuristic ideas with this Emerging Tech Innovations Deck. Perfect for tech leaders, startups, and educators, this slide set features modern visuals with robot illustrations and sleek layouts. Easily editable in PowerPoint, Keynote, or Google Slides. Ideal for showcasing cloud computing, automation, or AI-driven strategies in a compelling format.


6 diapositivas
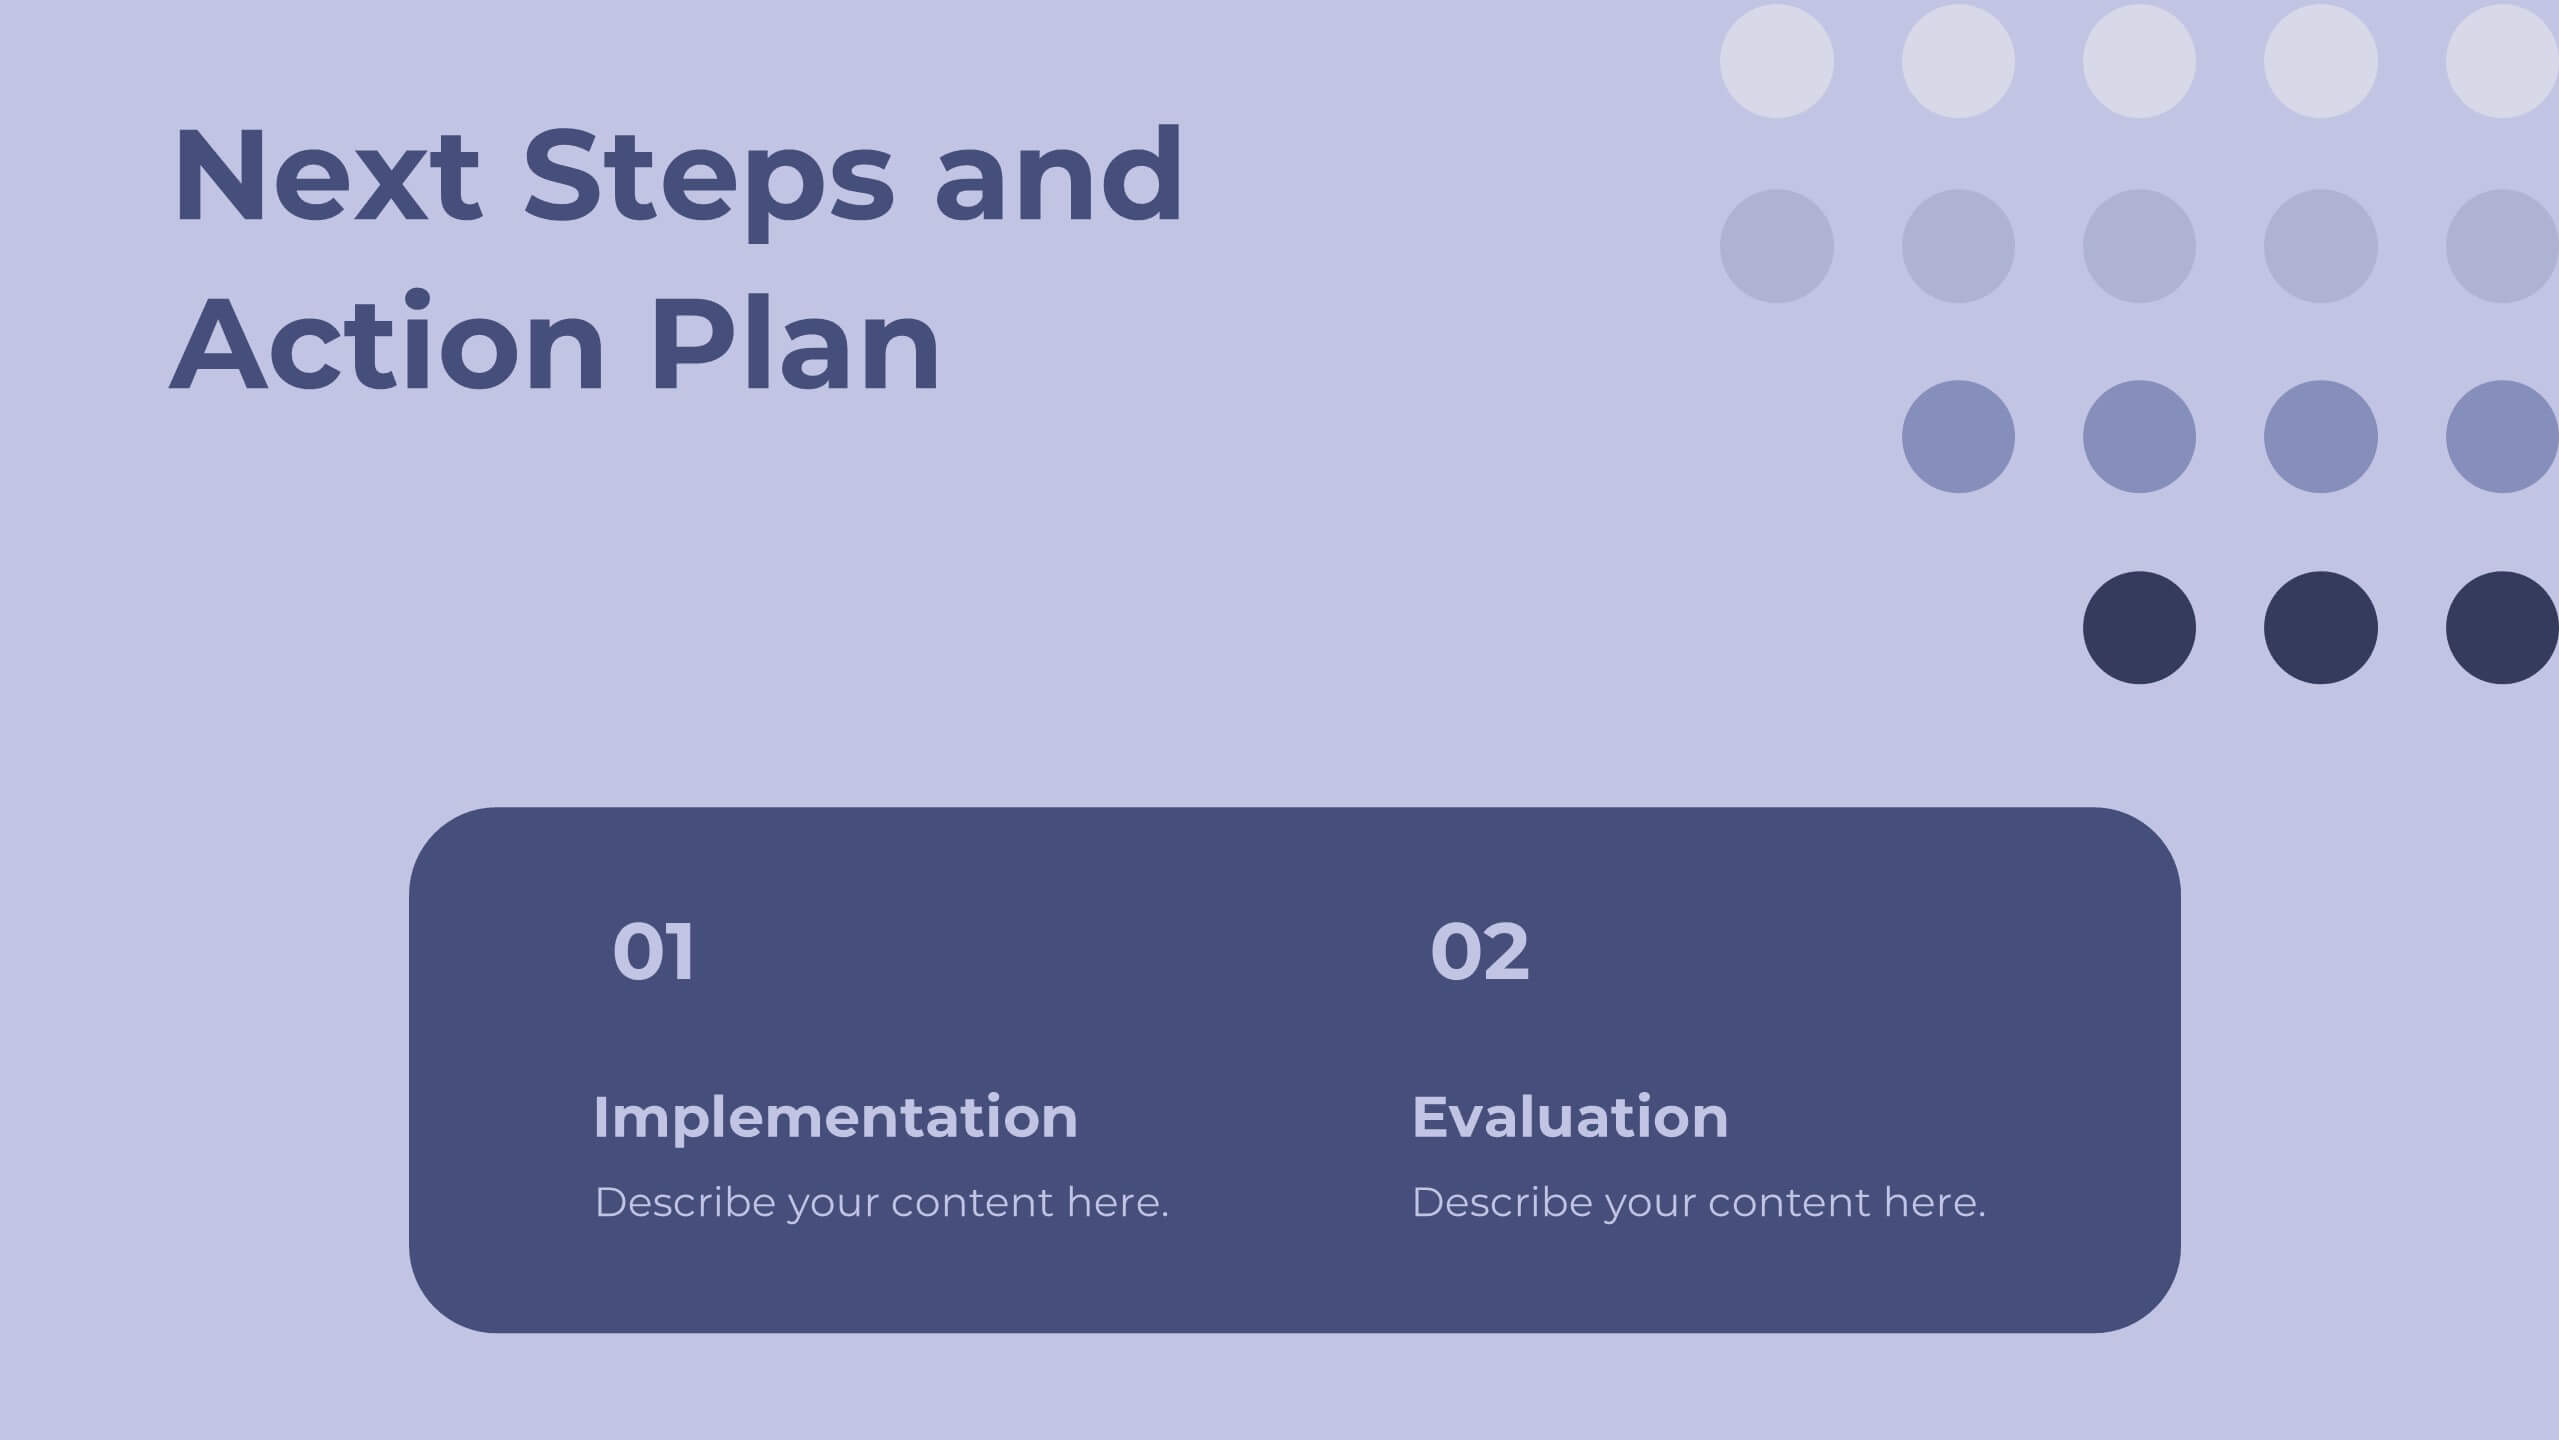
Business Plan Next Steps Presentation
Map out your strategy with the Business Plan Next Steps Presentation template. This visually structured layout helps outline key actions, milestones, and priorities for business growth and execution. Ideal for entrepreneurs, executives, and project managers, this slide ensures clarity and alignment on upcoming initiatives. Fully customizable in PowerPoint, Keynote, and Google Slides for easy integration into your planning process.


4 diapositivas
Top Priorities and Checklist Format Presentation
Stay focused and aligned with the Top Priorities and Checklist Format Presentation. This clear, checklist-based design is ideal for highlighting action items, goals, or key project deliverables. Visually guide your team with structured sections and a checklist illustration that reinforces accountability. Fully editable in PowerPoint, Keynote, and Google Slides.


8 diapositivas
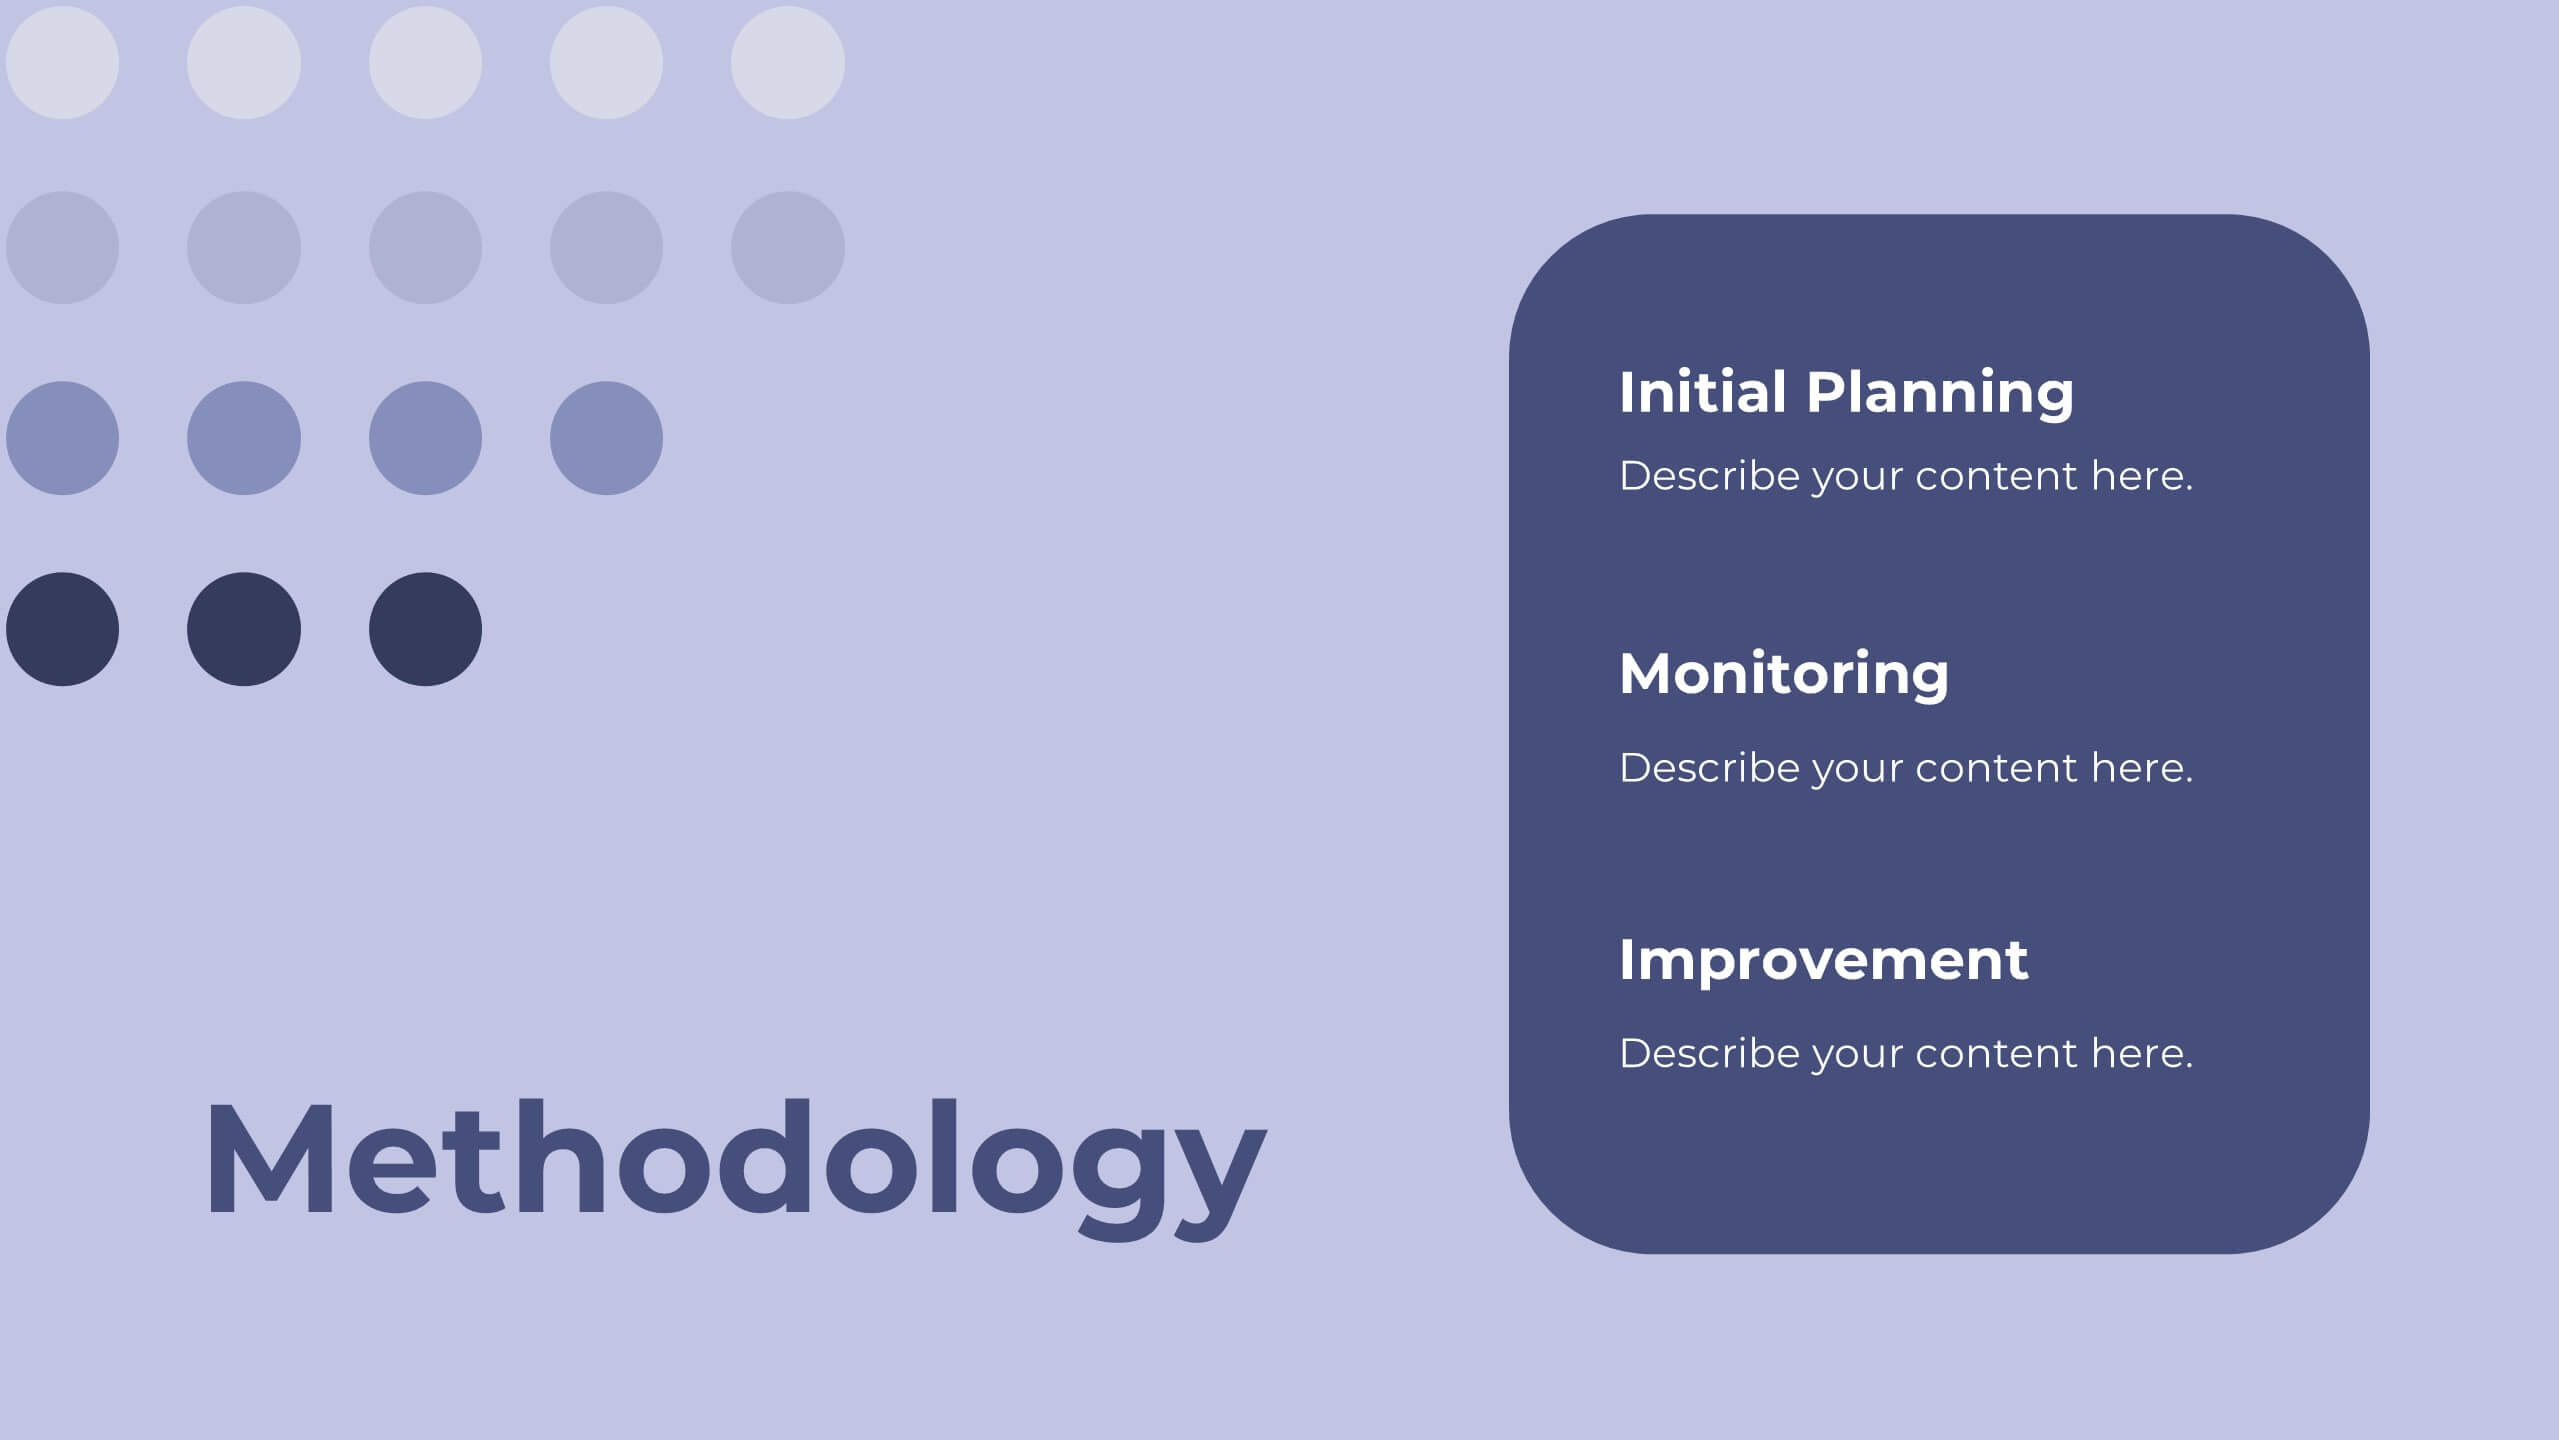
Project Milestones and Deliverables Presentation
Visualize your project’s journey with this step-by-step milestone timeline—ideal for tracking key phases, task ownership, or delivery checkpoints. The diagonal path connects colorful icons and editable text blocks, helping teams align on objectives and timelines. Compatible with PowerPoint, Keynote, and Google Slides.