


Características


¿Tienes alguna pregunta?
Recomendar


6 diapositivas
Organized TOC Page for Reports Presentation
Make your reports easy to navigate with this Organized Table of Contents slide. Featuring modern icons, image placeholders, and clean formatting, it’s perfect for business briefs, analytics, and internal documents. Fully editable in PowerPoint, Keynote, and Google Slides—ideal for structuring complex information into a visually appealing and accessible format.


7 diapositivas
Rotational Process Flow in Wheel Layout Presentation
Showcase continuous workflows, lifecycle stages, or strategic loops with the Rotational Process Flow in Wheel Layout Presentation. This visually engaging circular diagram breaks down processes into six distinct segments, each with editable icons, colors, and titles—ideal for marketing funnels, product development stages, or team cycles. Fully compatible with PowerPoint, Keynote, and Google Slides.


4 diapositivas
Skills Development Training Schedule Presentation
Organize learning paths with clarity using the Skills Development Training Schedule Presentation. This structured grid layout helps you map out training modules by skill category and timeline. Ideal for internal workshops, L&D planning, or certification programs. Fully editable in PowerPoint, Keynote, Google Slides, or Canva for seamless customization.


5 diapositivas
TAM SAM SOM Markets Analysis Presentation
Turn complex market insights into clear, visual storytelling with this dynamic layered presentation. Ideal for demonstrating market potential, target segments, and opportunity scope, it helps you communicate data with structure and impact. Fully compatible with PowerPoint, Keynote, and Google Slides for effortless editing and professional, presentation-ready results.


5 diapositivas
Dual Axis Butterfly Diagram Presentation
Give your data the spotlight it deserves with a modern layout designed for clarity and balance. This presentation is perfect for comparing two perspectives, processes, or variables side by side in a visually appealing way. Fully customizable and compatible with PowerPoint, Keynote, and Google Slides.


27 diapositivas
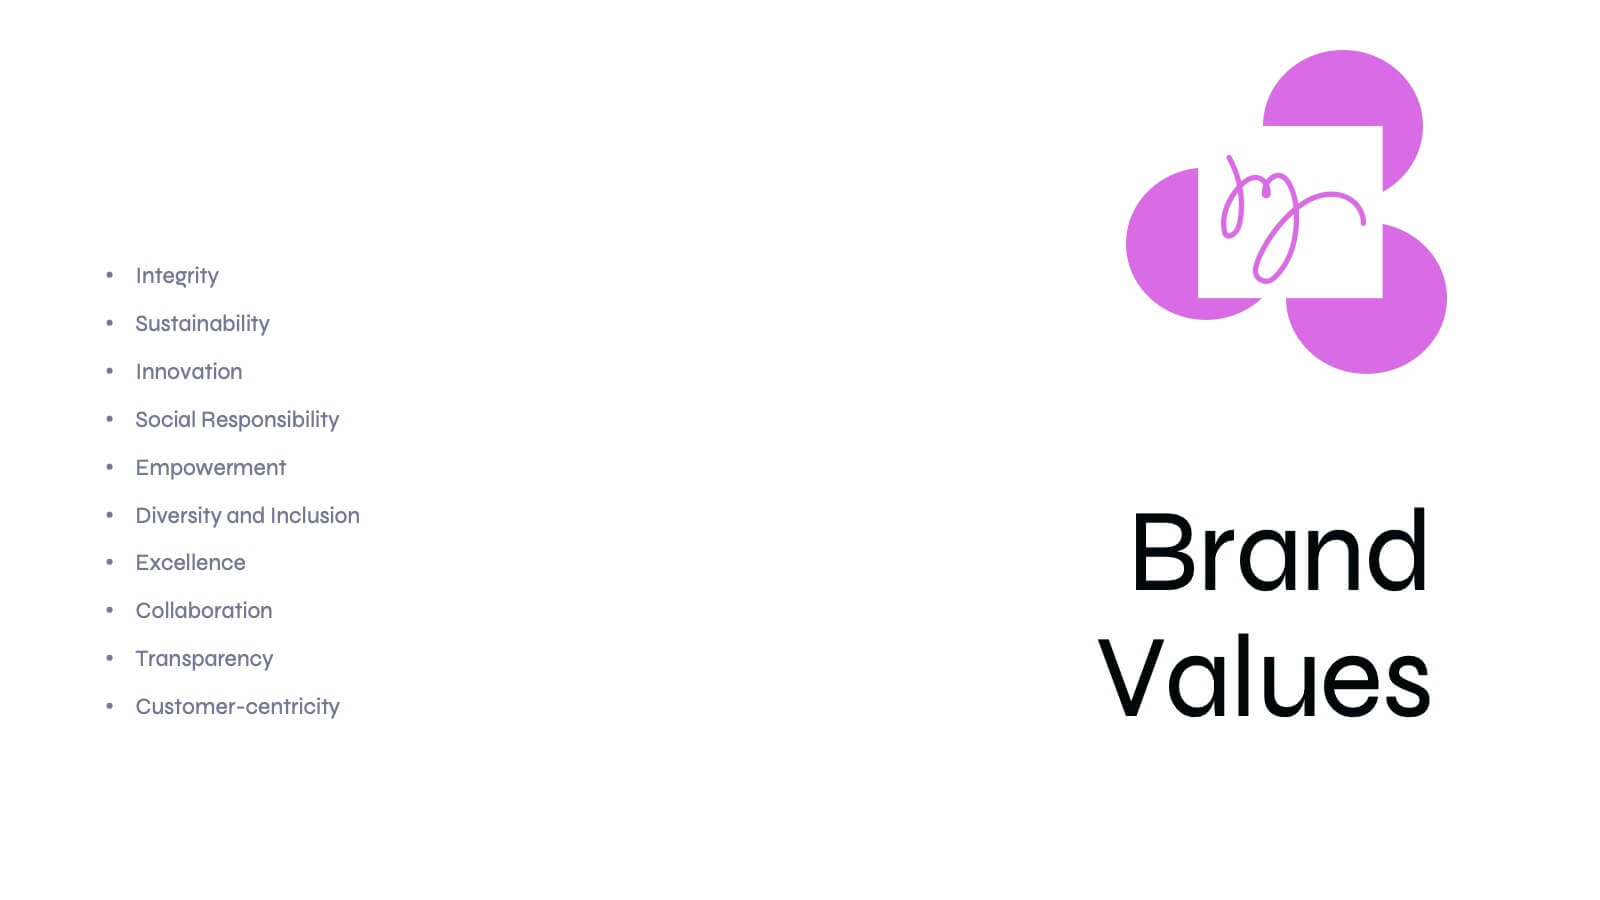
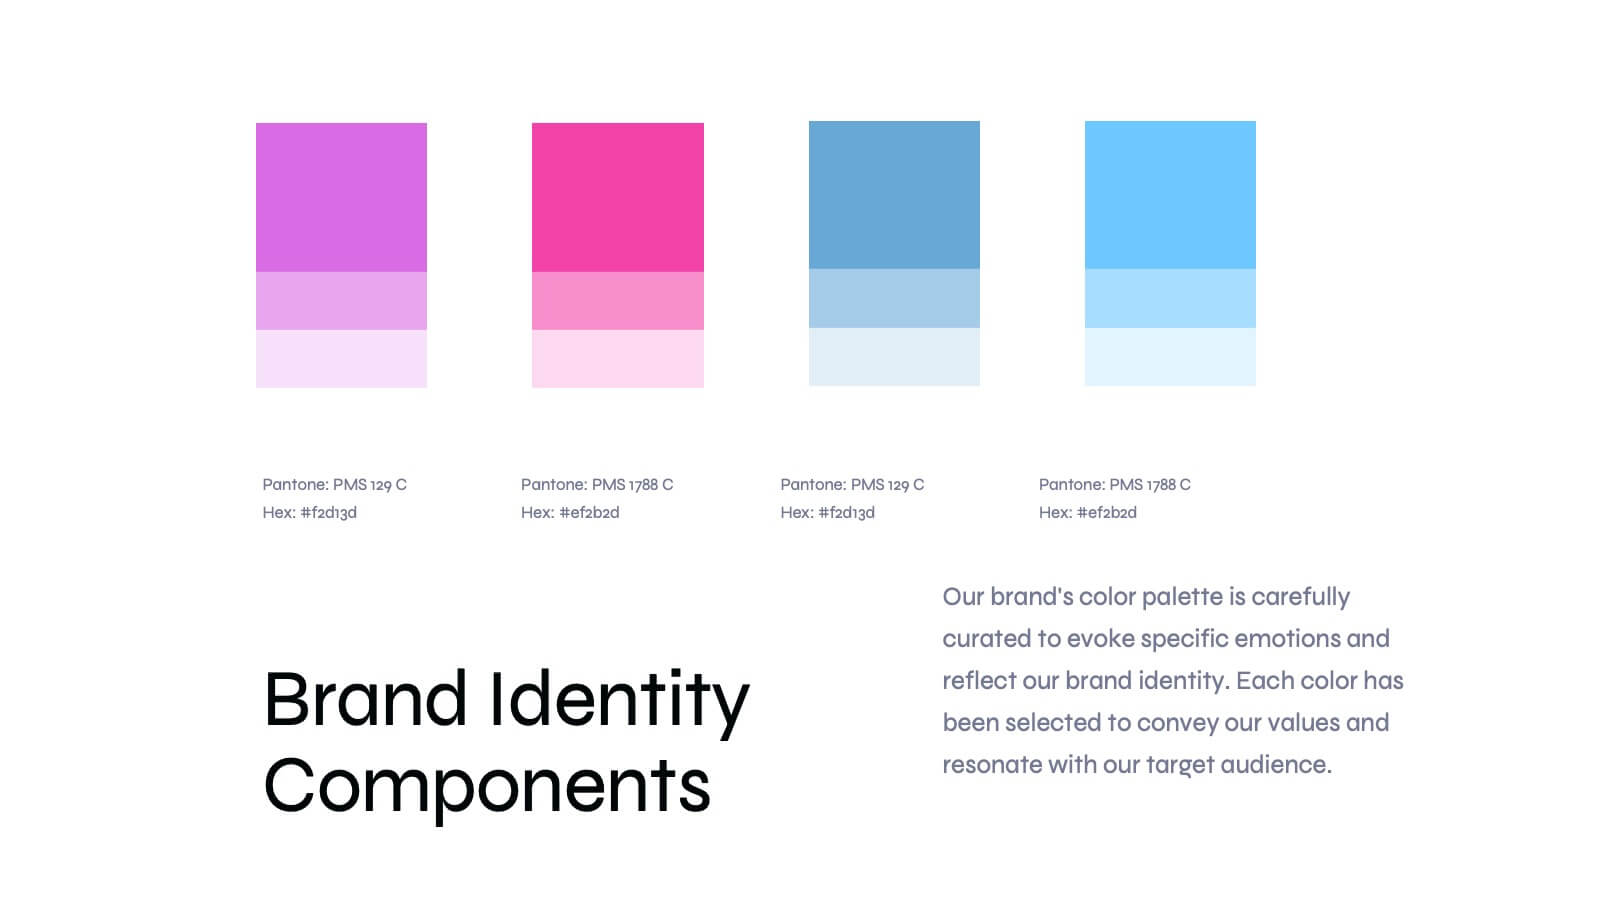
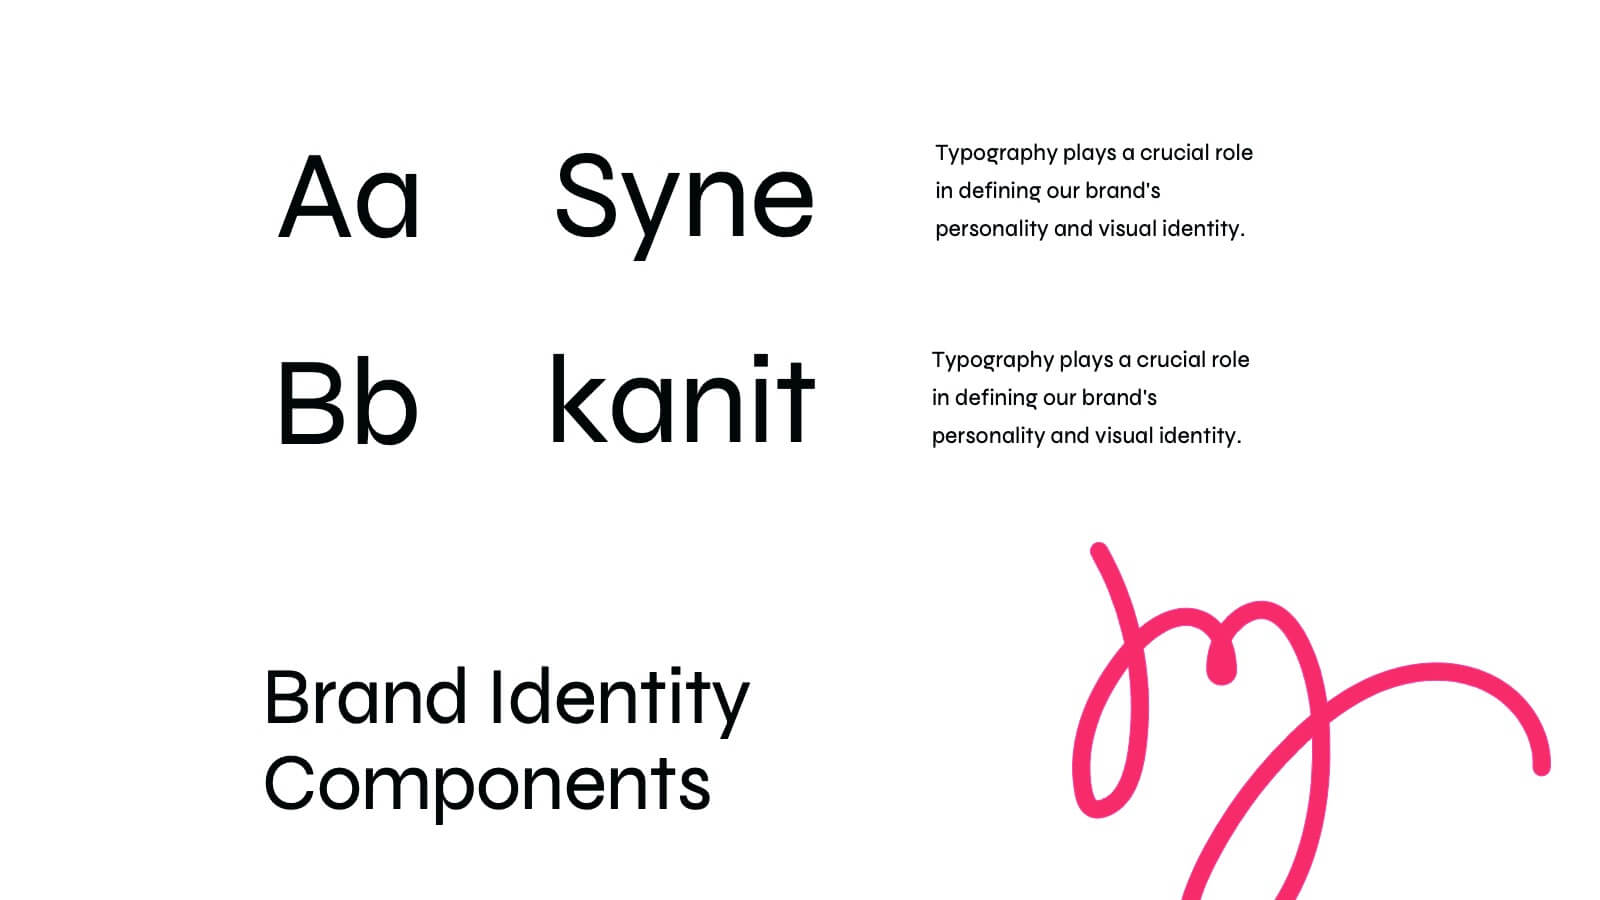
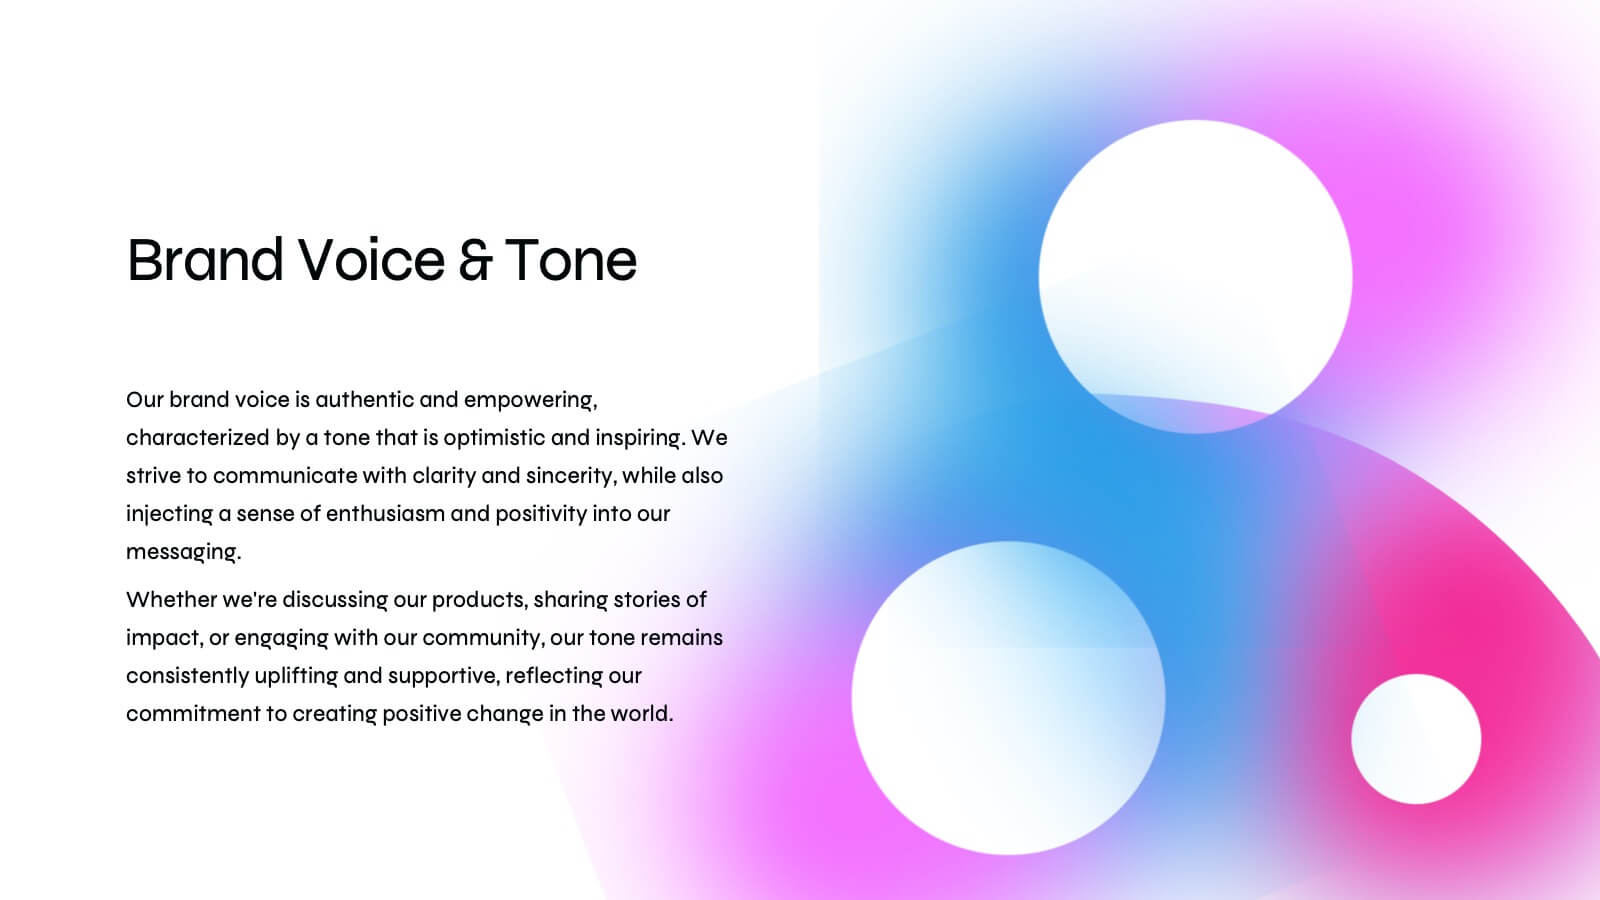
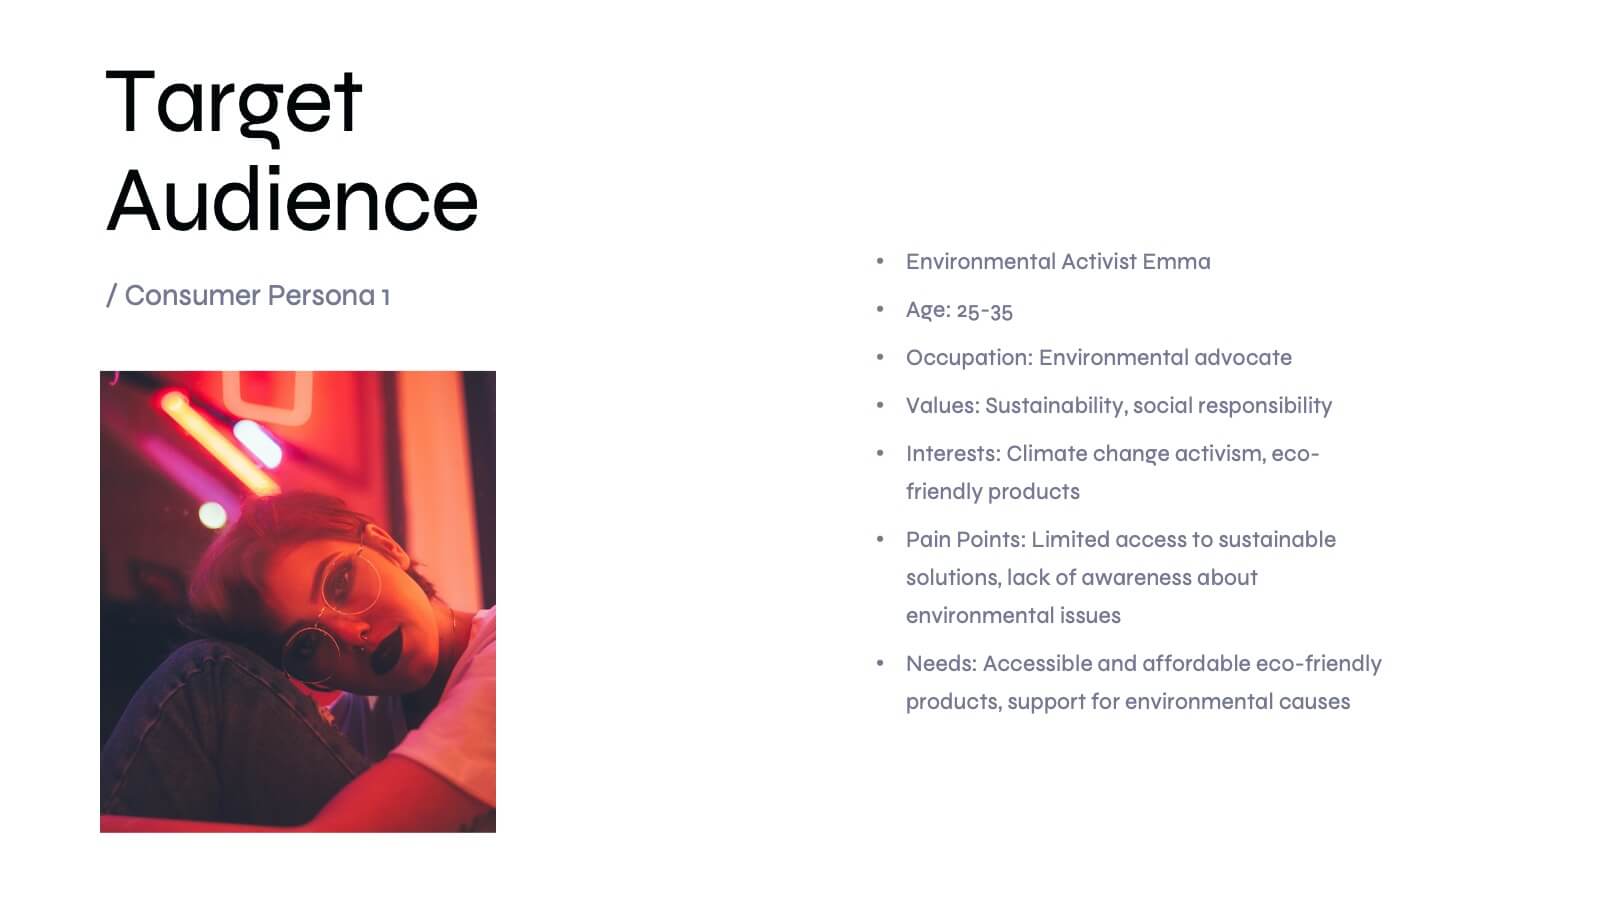
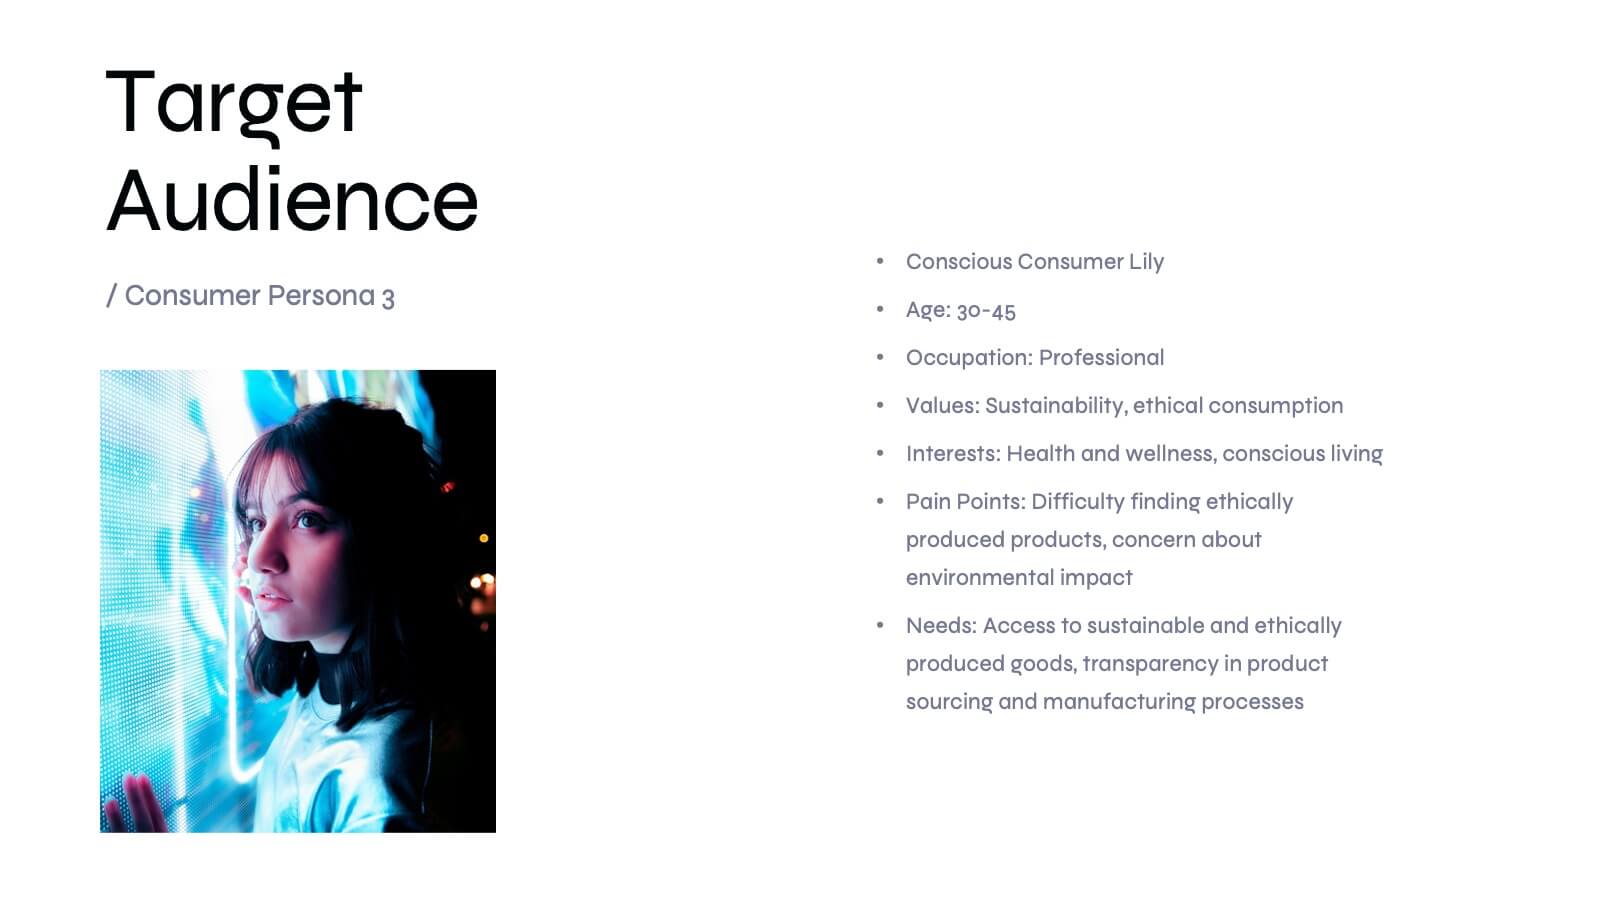
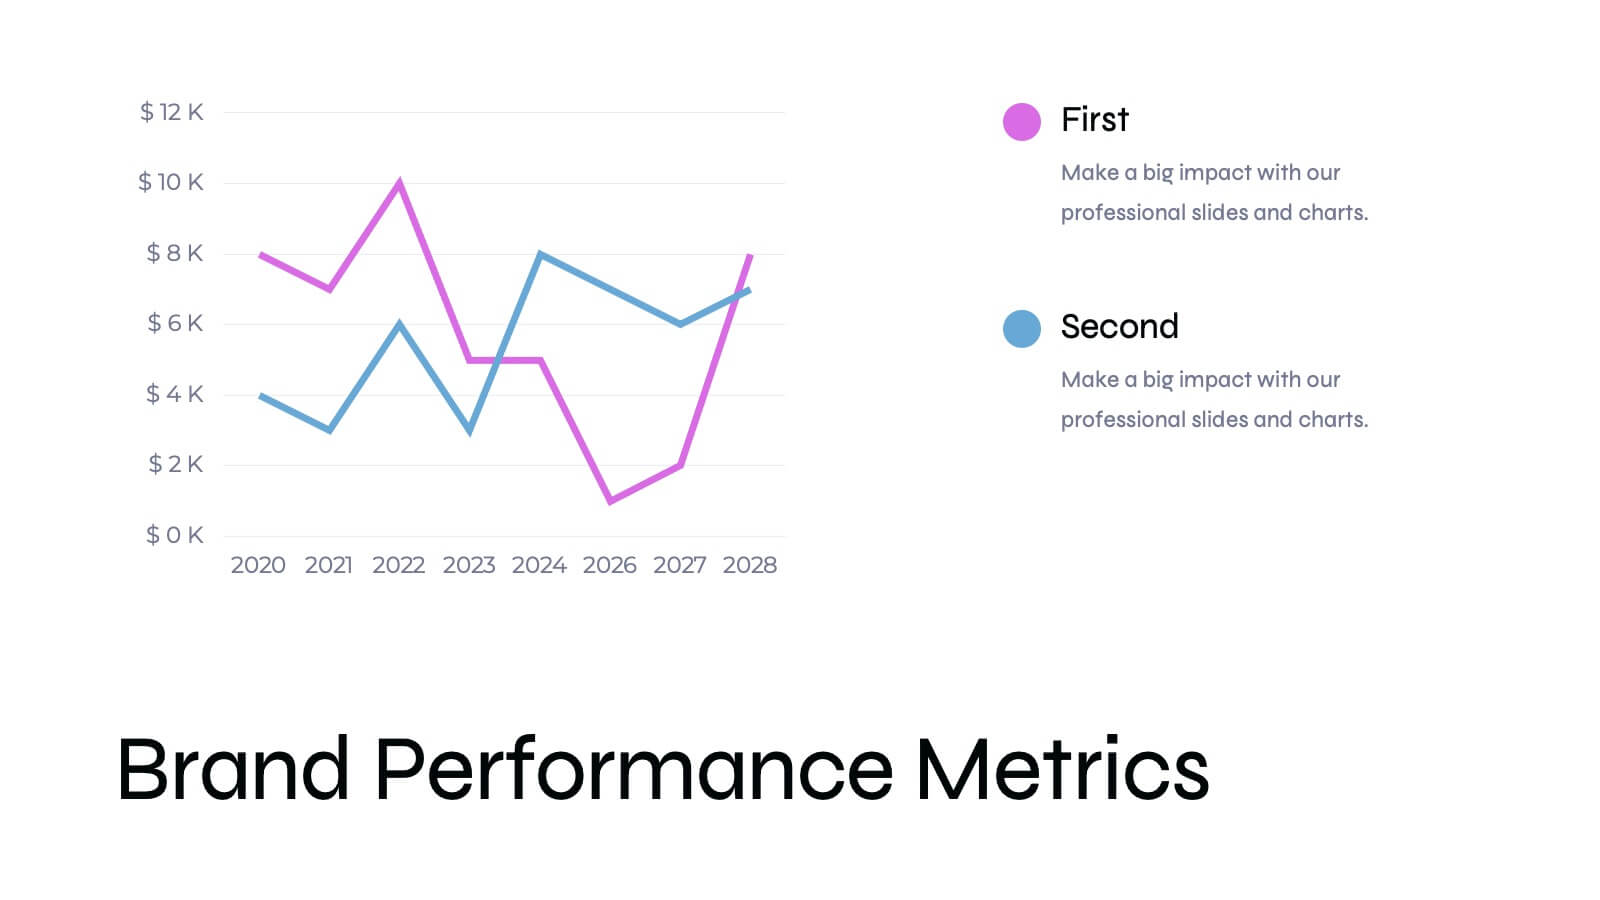
Basilisk Brand Guidelines Proposal Presentation
Present your brand strategy effectively with this modern brand guidelines proposal template! It includes sections for brand vision, values, identity, and market analysis. Fully customizable and compatible with PowerPoint, Keynote, and Google Slides, it’s perfect for showcasing your brand's identity and ensuring consistency across all platforms.


8 diapositivas
Product Showcase on Devices Presentation
Present your features in a sleek, mobile-first layout with the Product Showcase on Devices Presentation. This vertical slide design mimics a smartphone screen, making it ideal for displaying app features, service tiers, or digital tool highlights. Each section is clearly segmented, perfect for comparisons or step-by-step product walkthroughs. Fully editable in PowerPoint, Keynote, Canva, and Google Slides.


6 diapositivas
Leadership and Business Teamwork Presentation
Drive results through synergy with this dynamic Leadership and Business Teamwork presentation slide. Designed with a six-part segmented pie chart, this layout helps visualize collaborative frameworks, team roles, or leadership models in an engaging way. Ideal for team workshops, leadership development, or strategic planning meetings. Easy to personalize in PowerPoint, Keynote, or Google Slides.


22 diapositivas
Etherwind Advertising Agency Proposal Presentation
This Advertising Agency Proposal Presentation Template offers a sleek and professional layout, perfect for showcasing your agency's capabilities, services, and success stories. Covering essential sections such as market analysis, strategy development, campaign execution, and client testimonials, it ensures a compelling pitch to potential clients. Designed for easy customization in PowerPoint, Keynote, and Google Slides, making it a versatile choice for agencies looking to impress their audience.


6 diapositivas
Innovative Idea Pitching Guide Presentation
Present your ideas with clarity using the Innovative Idea Pitching Guide Presentation. This dynamic five-step circular flow design is perfect for showcasing pitch stages, idea development, or startup concepts. Each section includes icons and text blocks to clearly explain key points, keeping your message organized and impactful. Fully editable in Canva, PowerPoint, Keynote, and Google Slides.


8 diapositivas
Card Services Comparison Layout Presentation
Highlight key differences in financial products with this Card Services Comparison Layout Presentation. Featuring a sleek smartphone-centered design, this template allows you to clearly compare up to three card types or financial service features. Perfect for fintech presentations, banking pitches, or product feature breakdowns. Fully customizable in PowerPoint, Keynote, and Google Slides.


4 diapositivas
Social Campaign Planning Presentation
Bring clarity to your outreach goals with a bold, funnel-style layout that makes every campaign step easy to visualize. This presentation helps you outline stages, objectives, and audience actions in a clean, structured format ideal for marketing teams. Fully editable and compatible with PowerPoint, Keynote, and Google Slides.


5 diapositivas
K–12 School Planning and Curriculum Map Presentation
Visualize your school year with the K–12 School Planning and Curriculum Map Presentation. Designed for academic teams and administrators, this circular diagram helps outline yearly goals, subject milestones, or grade-level plans in five clear segments. Fully editable in PowerPoint, Keynote, Google Slides, and Canva for total customization.


20 diapositivas
Symphonix Marketing Campaign Presentation
The Marketing Campaign Presentation Template is designed for impactful storytelling and strategy. With 20 vibrant, customizable slides, it covers key topics like consumer behavior, emerging trends, data-driven strategies, and sustainability. Perfect for marketers and agencies, it’s fully compatible with PowerPoint, Keynote, and Google Slides for seamless presentations.


6 diapositivas
Project Rollout Milestone Timeline Presentation
Visually map out your project phases with the Project Rollout Milestone Timeline Presentation. Featuring a modern cylinder path layout, this slide is perfect for showcasing five key milestones in sequential or strategic order. Ideal for project managers and teams, and fully editable in Canva, PowerPoint, Keynote, and Google Slides.


4 diapositivas
Scrum Team Retrospective Overview Deck Presentation
Reflect on past sprints with this structured Scrum Team Retrospective Deck. Featuring four quadrants for clear team feedback—what worked, what didn’t, ideas for improvement, and action items. Ideal for agile coaches and team leads. Fully editable in PowerPoint, Keynote, and Google Slides to match your team's review process.


4 diapositivas
Incident Prevention and Safety Culture Presentation
Promote a proactive approach to workplace wellbeing with the Incident Prevention and Safety Culture presentation. This visually structured slide uses bold safety icons—such as warning signs, first aid, and hazard symbols—to represent core pillars of a safety-first environment. Ideal for outlining safety protocols, risk mitigation strategies, training initiatives, and cultural values, each section includes editable placeholders for concise messaging. The clean layout supports quick communication in HR briefings, onboarding, or compliance meetings. Fully customizable and compatible with PowerPoint, Keynote, and Google Slides.