


Características


¿Tienes alguna pregunta?
Recomendar


4 diapositivas
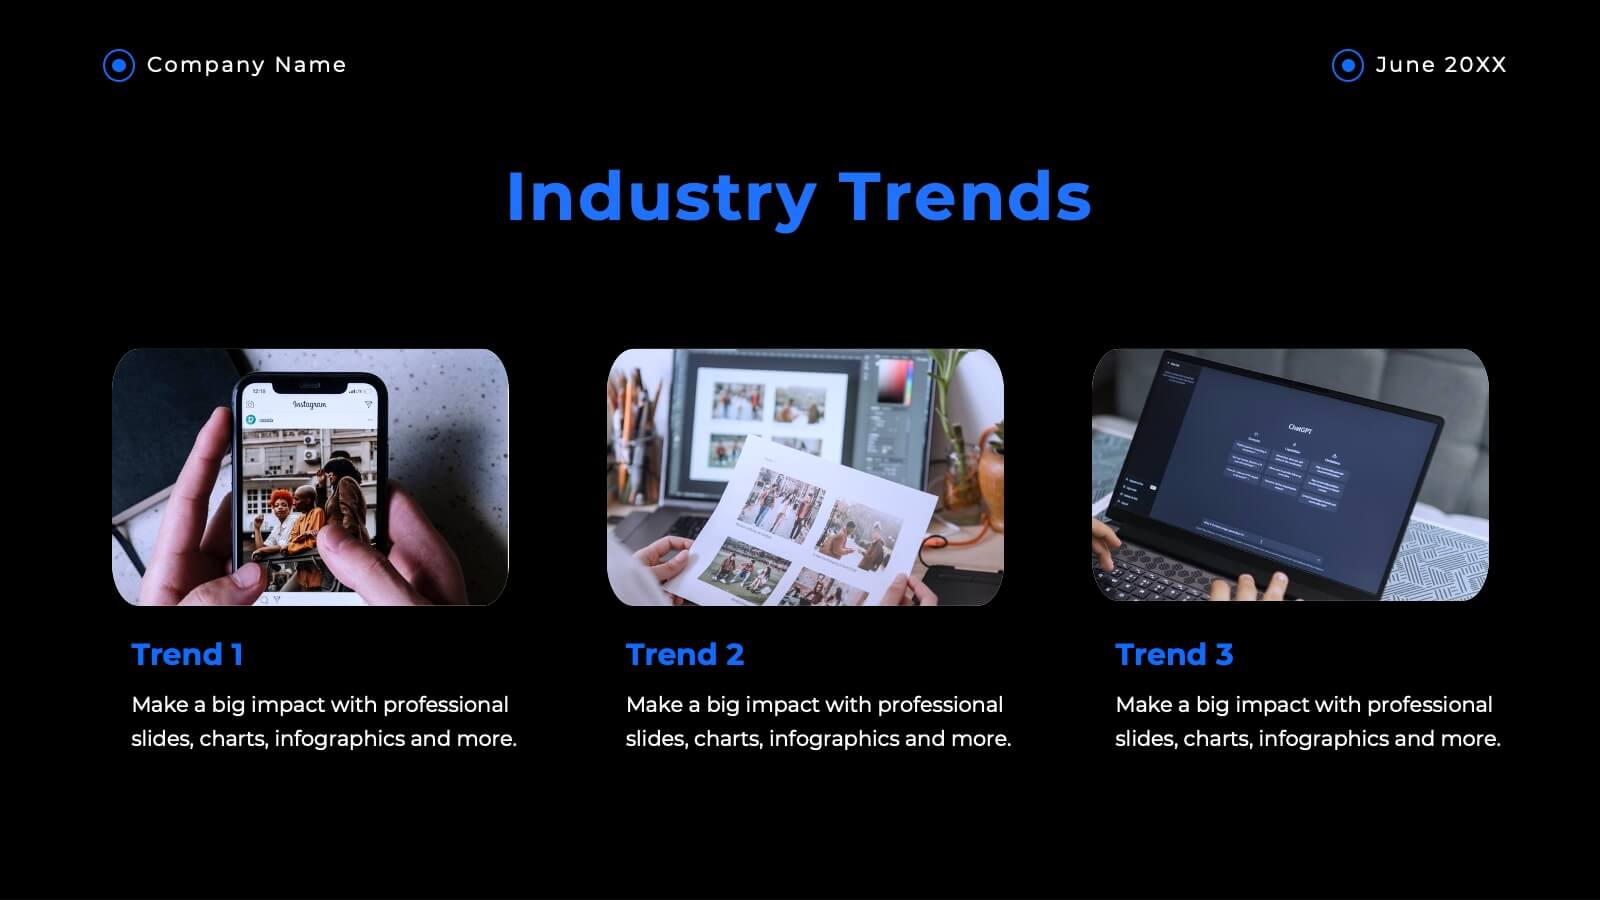
Social Media and Online Marketing Trends
Showcase emerging strategies with this mobile-inspired layout perfect for social media and online marketing updates. The clean design highlights trends like SEO, influencer marketing, and content innovation with clarity. Fully customizable and compatible with PowerPoint, Keynote, and Google Slides.


2 diapositivas
Creative Title Slide Presentation
Bring your audience in with a burst of personality using this bold, playful cover-style presentation slide. Designed to spotlight a creative message, it uses vibrant shapes and striking color to set an energetic tone while keeping your title front-and-center. Fully compatible with PowerPoint, Keynote, and Google Slides.


6 diapositivas
Sales Associate Infographics
The "Sales Associate" infographic template is a vibrant and informative visual tool, meticulously crafted for PowerPoint, Keynote, and Google Slides. This template is an invaluable asset for retail managers, sales trainers, and marketing teams aiming to showcase the key responsibilities, skills, and performance metrics of a sales associate role. This template effectively highlights the diverse aspects of a sales associate's position, including customer service, product knowledge, sales techniques, and point-of-sale operations. It's designed to provide a comprehensive overview of the role, making it an essential tool for training new hires, setting performance standards, or enhancing sales strategies. The design is as engaging as the role itself, with a color scheme that is both lively and professional. This not only makes the presentation visually attractive but also resonates with the dynamic and customer-oriented nature of a sales associate's job. Whether used in a retail staff meeting, a training workshop, or a sales strategy session, this template ensures that the "Sales Associate" role is presented in a detailed, visually compelling, and easily understandable manner.


6 diapositivas
Stakeholder Management Analysis Infographics
Efficiently manage stakeholders with our Stakeholder Management Analysis infographic template. This template is fully compatible with popular presentation software like PowerPoint, Keynote, and Google Slides, allowing you to easily customize it to analyze and communicate your stakeholder management strategies. The Stakeholder Management Analysis infographic template offers a visually engaging platform to assess, categorize, and prioritize stakeholders based on their influence and interest in your projects or initiatives. Whether you're a project manager, business leader, or involved in stakeholder engagement, this template provides a user-friendly canvas to create informative presentations and reports on stakeholder management. Optimize your stakeholder relationships with this SEO-optimized Stakeholder Management Analysis infographic template, thoughtfully designed for clarity and ease of use. Customize it to showcase stakeholder mapping, engagement strategies, and communication plans, helping you ensure that your stakeholders' needs and expectations are met effectively. Start crafting your personalized infographic today to excel in stakeholder management.


7 diapositivas
Risk Management Plan Infographics
This Risk Management Plan infographic template is a comprehensive tool for identifying and assessing potential risks in projects or business operations. Compatible with PowerPoint, Google Slides, and Keynote, it features a range of visual aids including risk matrices, probability scales, and impact graphs. Each slide is tailored to categorize risks by severity, from low to high, and includes customizable fields for detailed risk descriptions and mitigation strategies. The color-coding aids in quick recognition of risk levels, and the straightforward design ensures clarity in communication. Ideal for project managers and business strategists, this template streamlines the process of risk analysis and planning in any professional presentation.

22 diapositivas
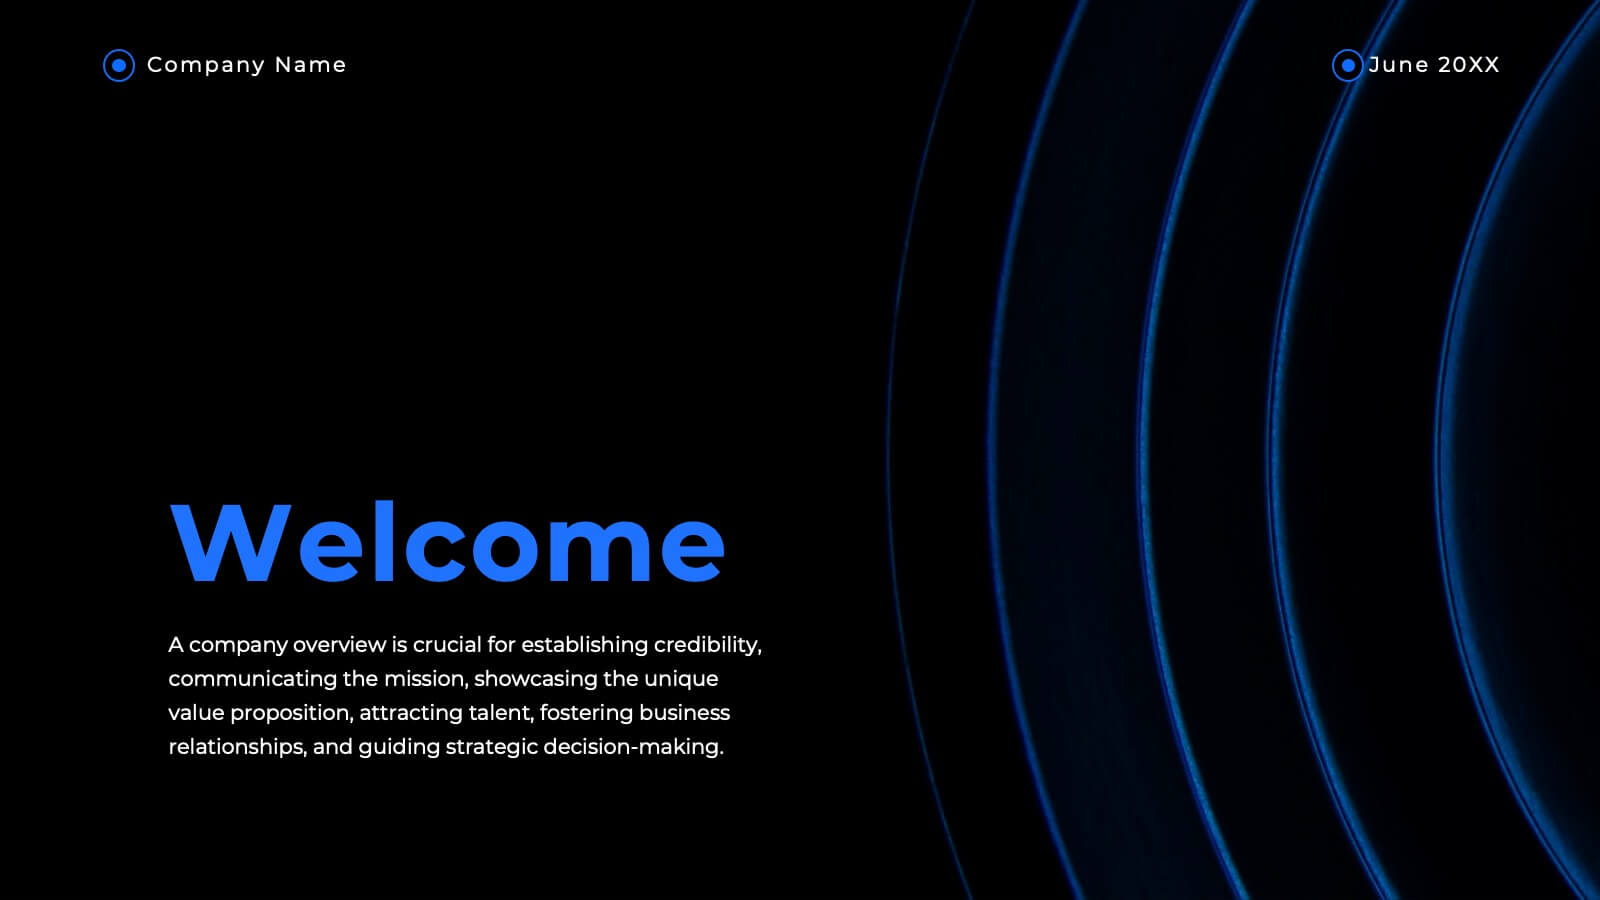
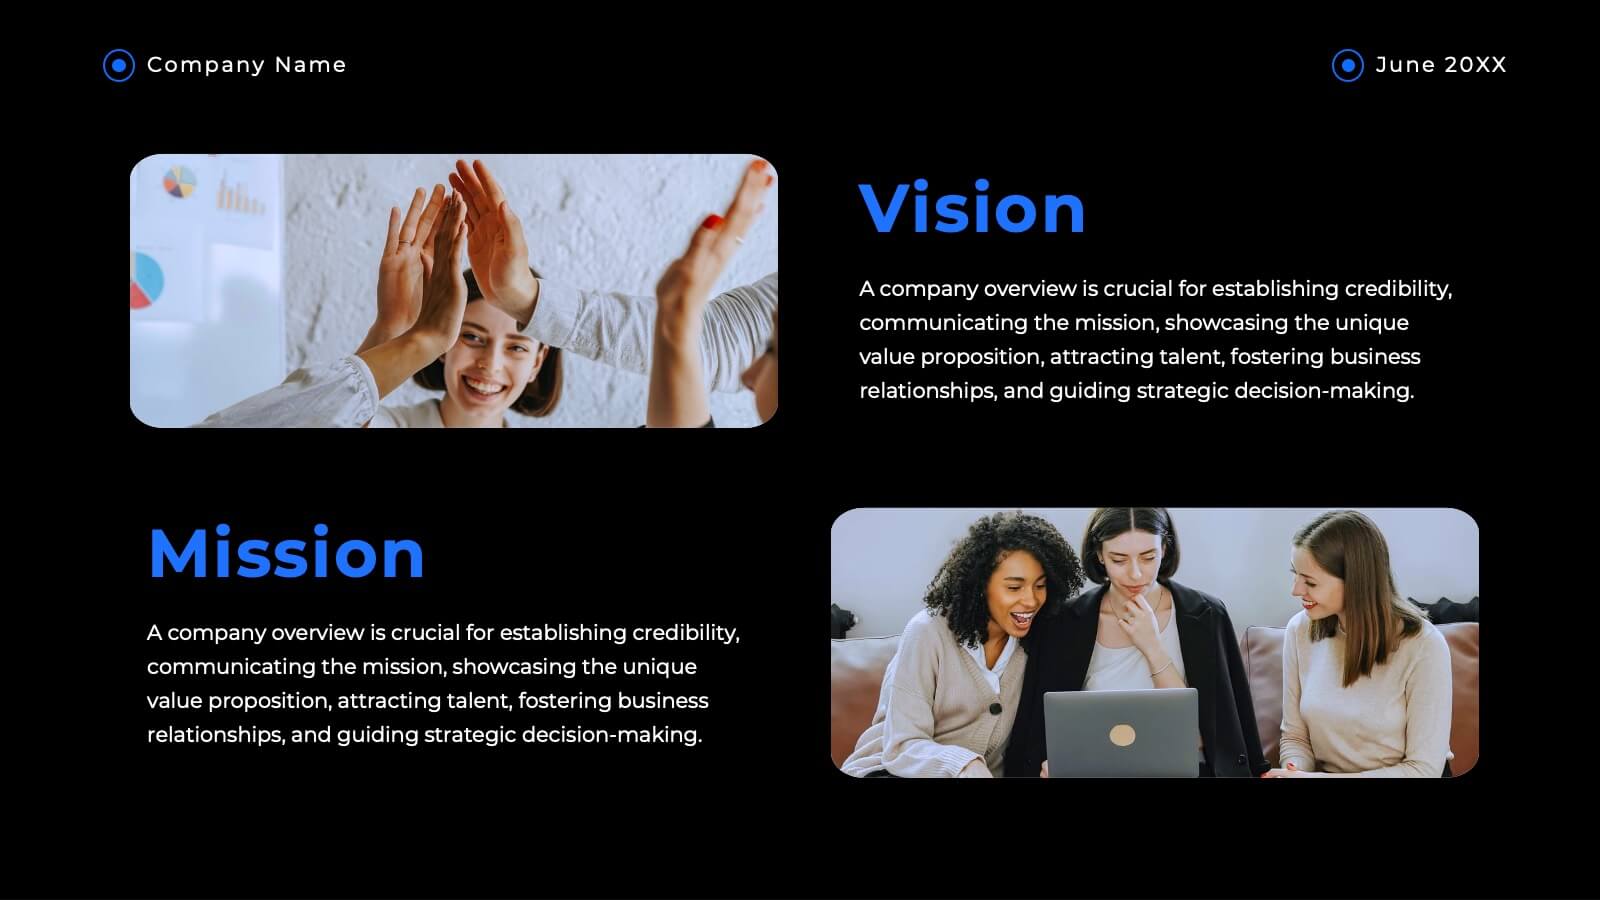
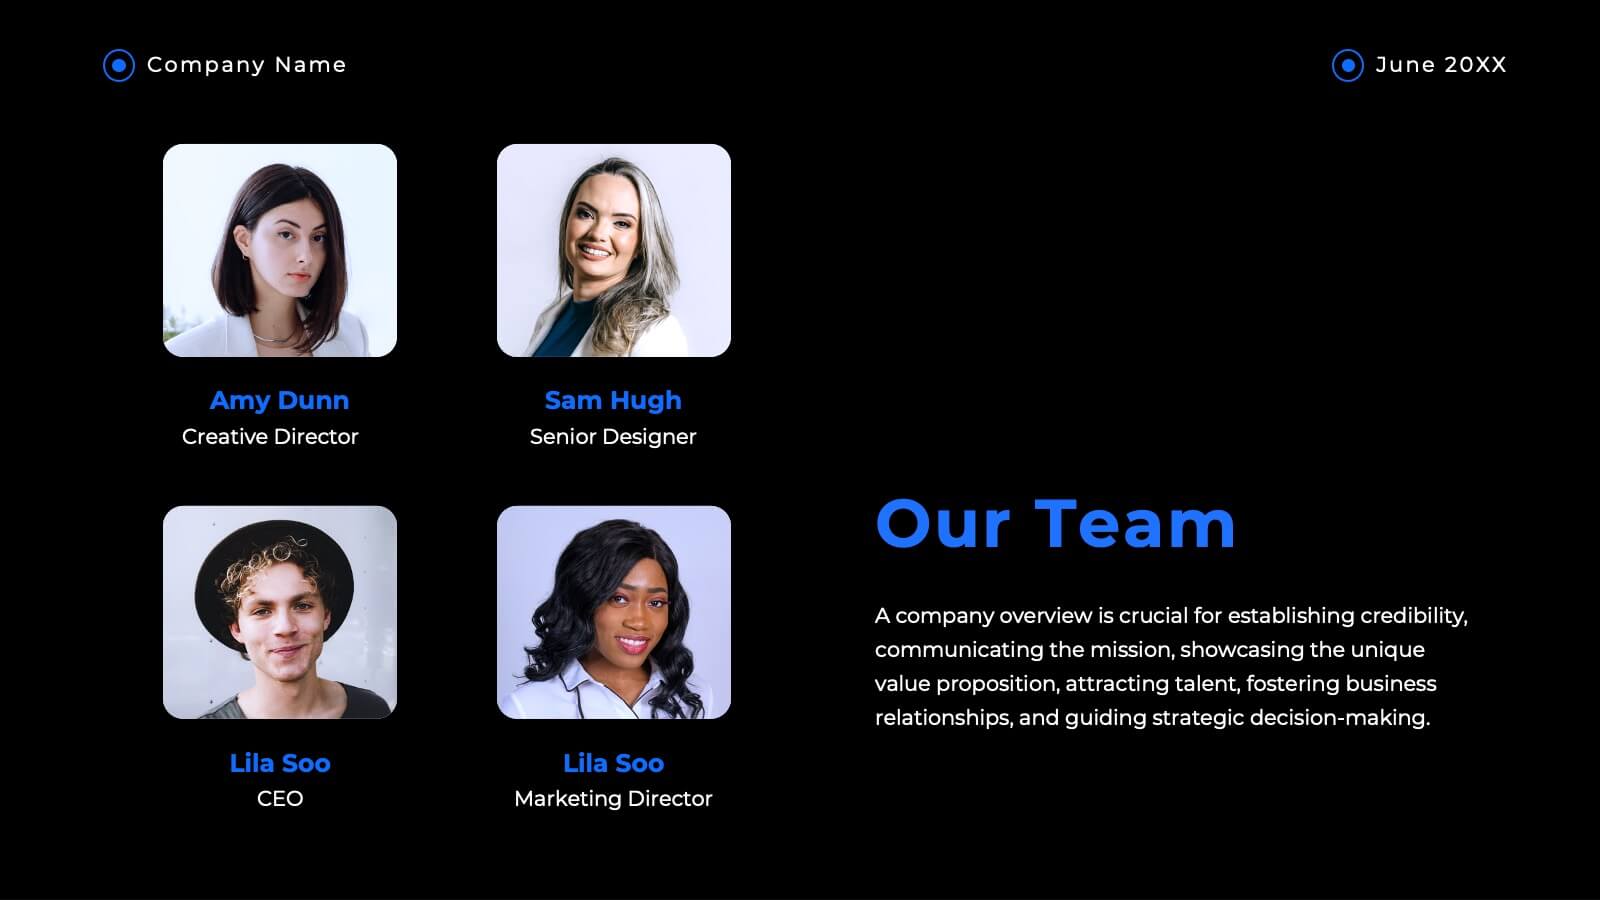
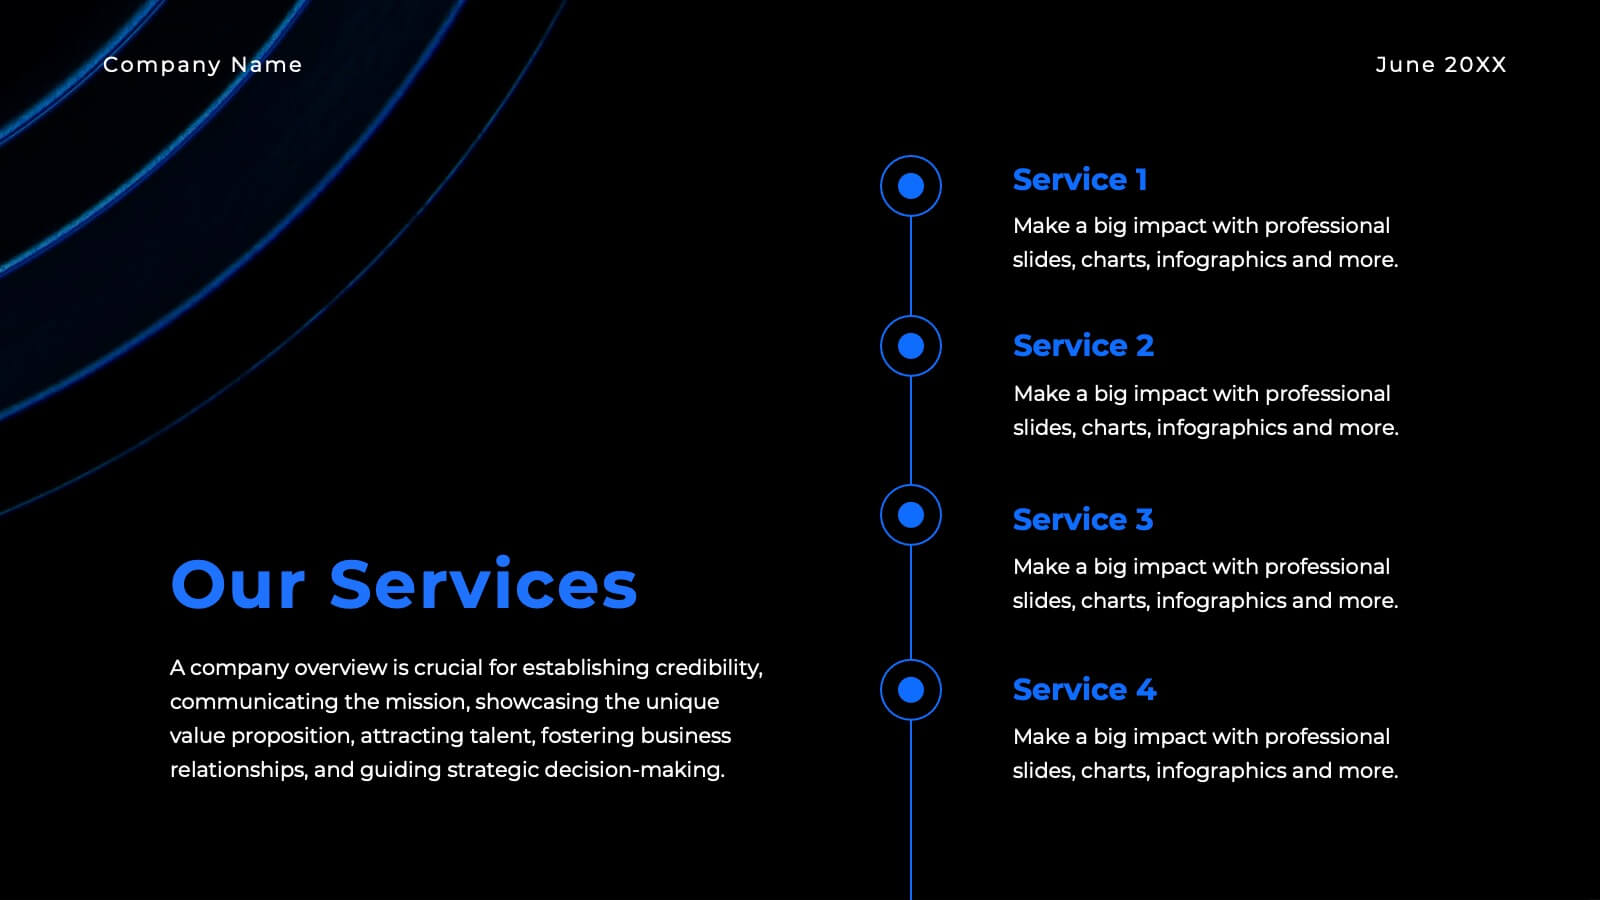
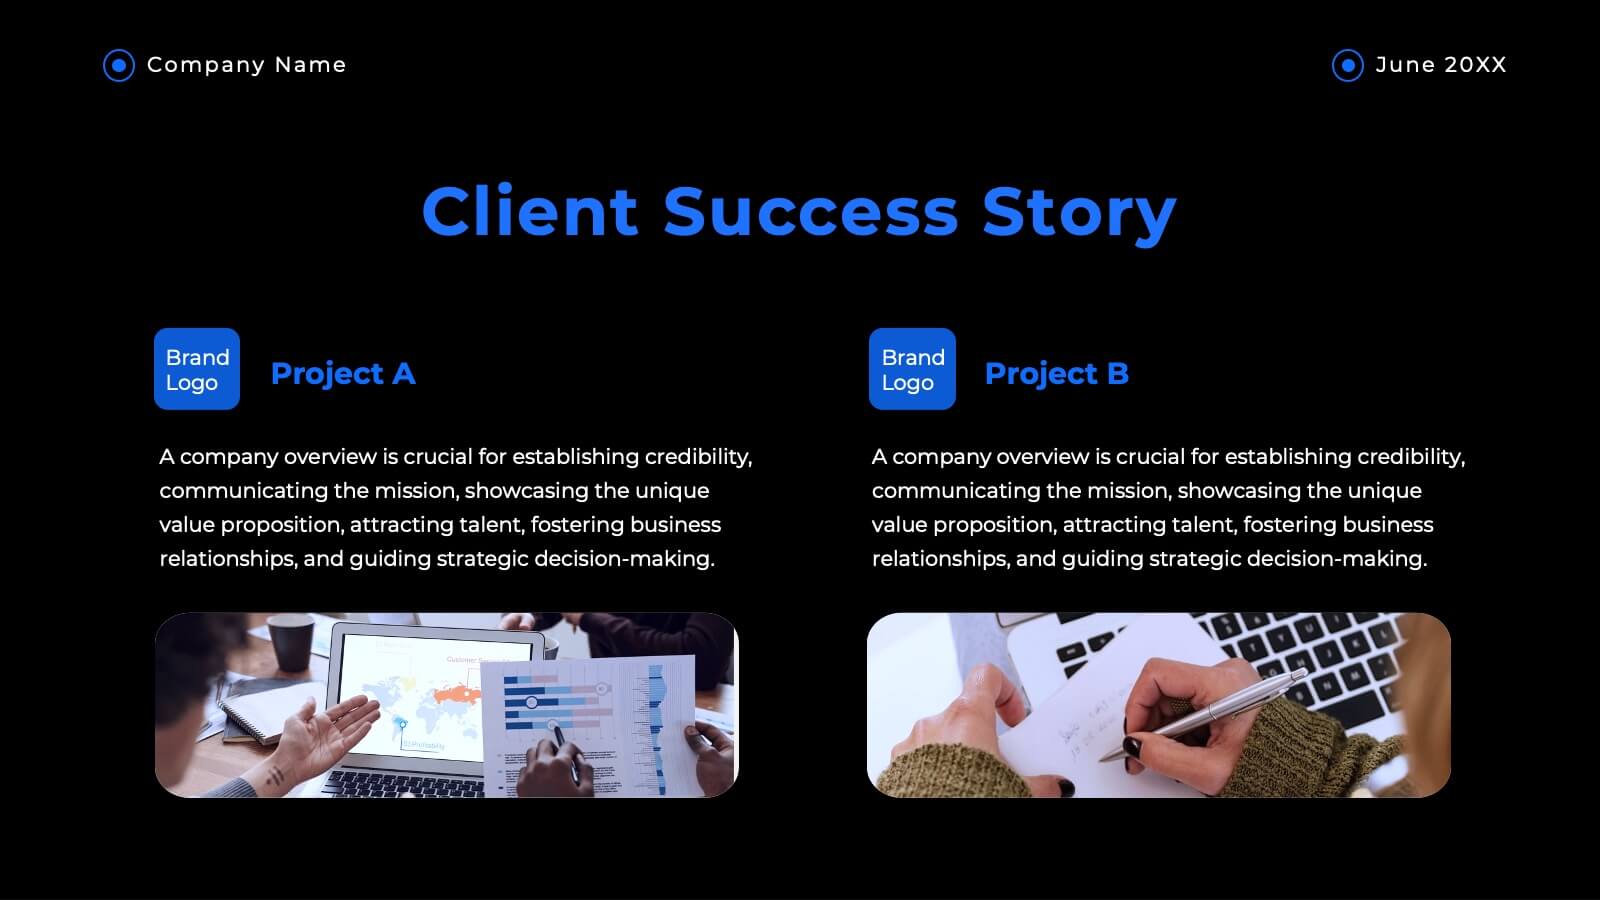
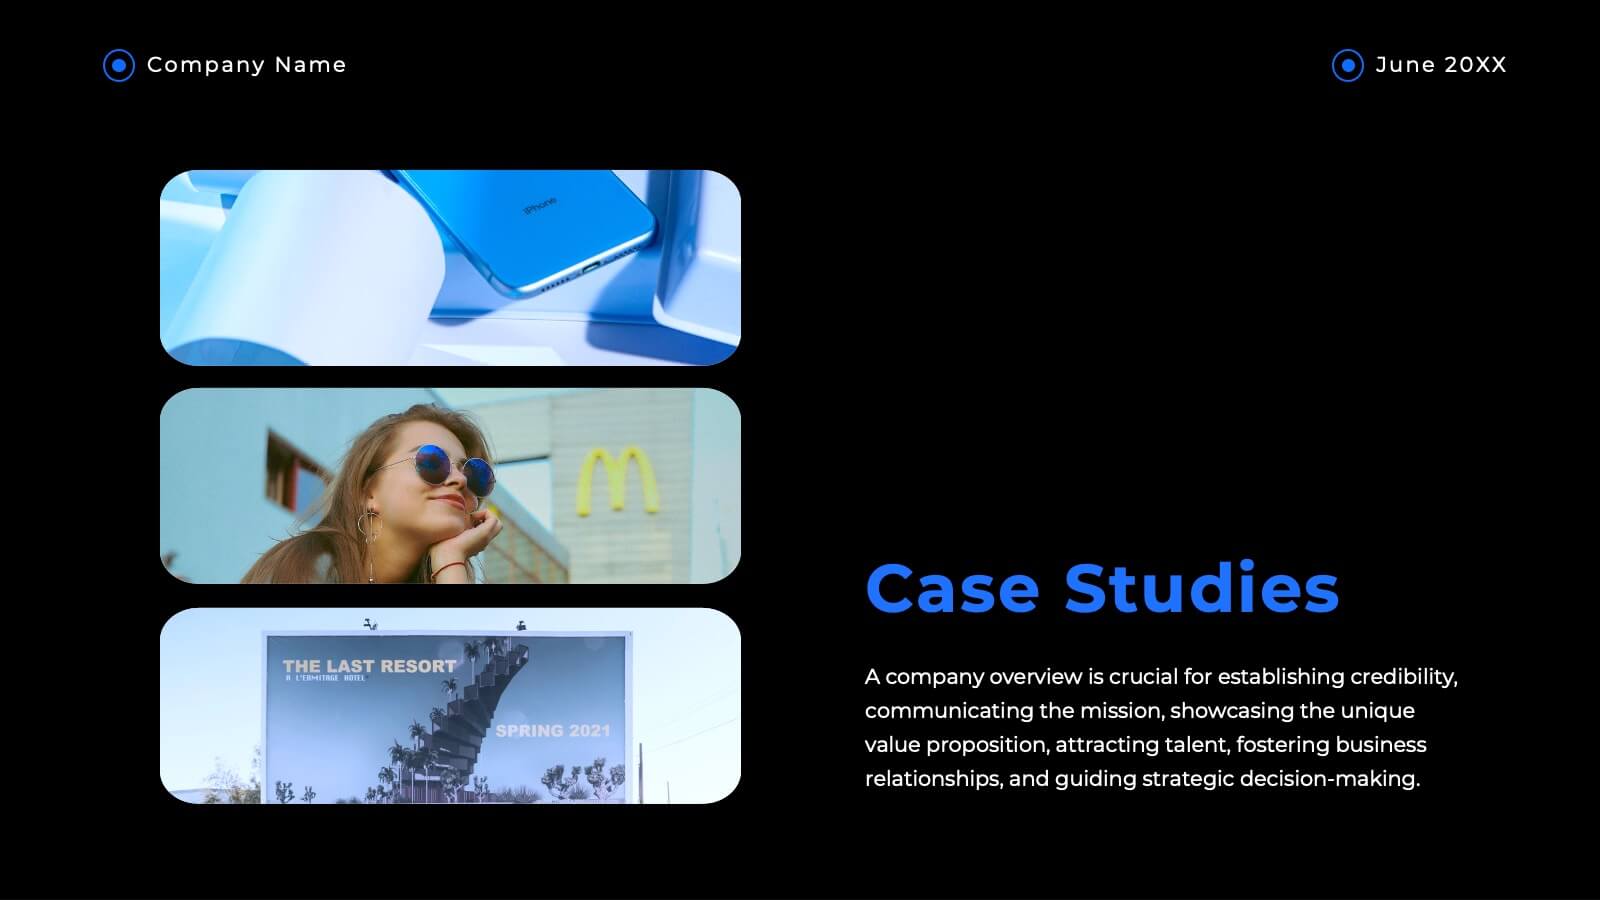
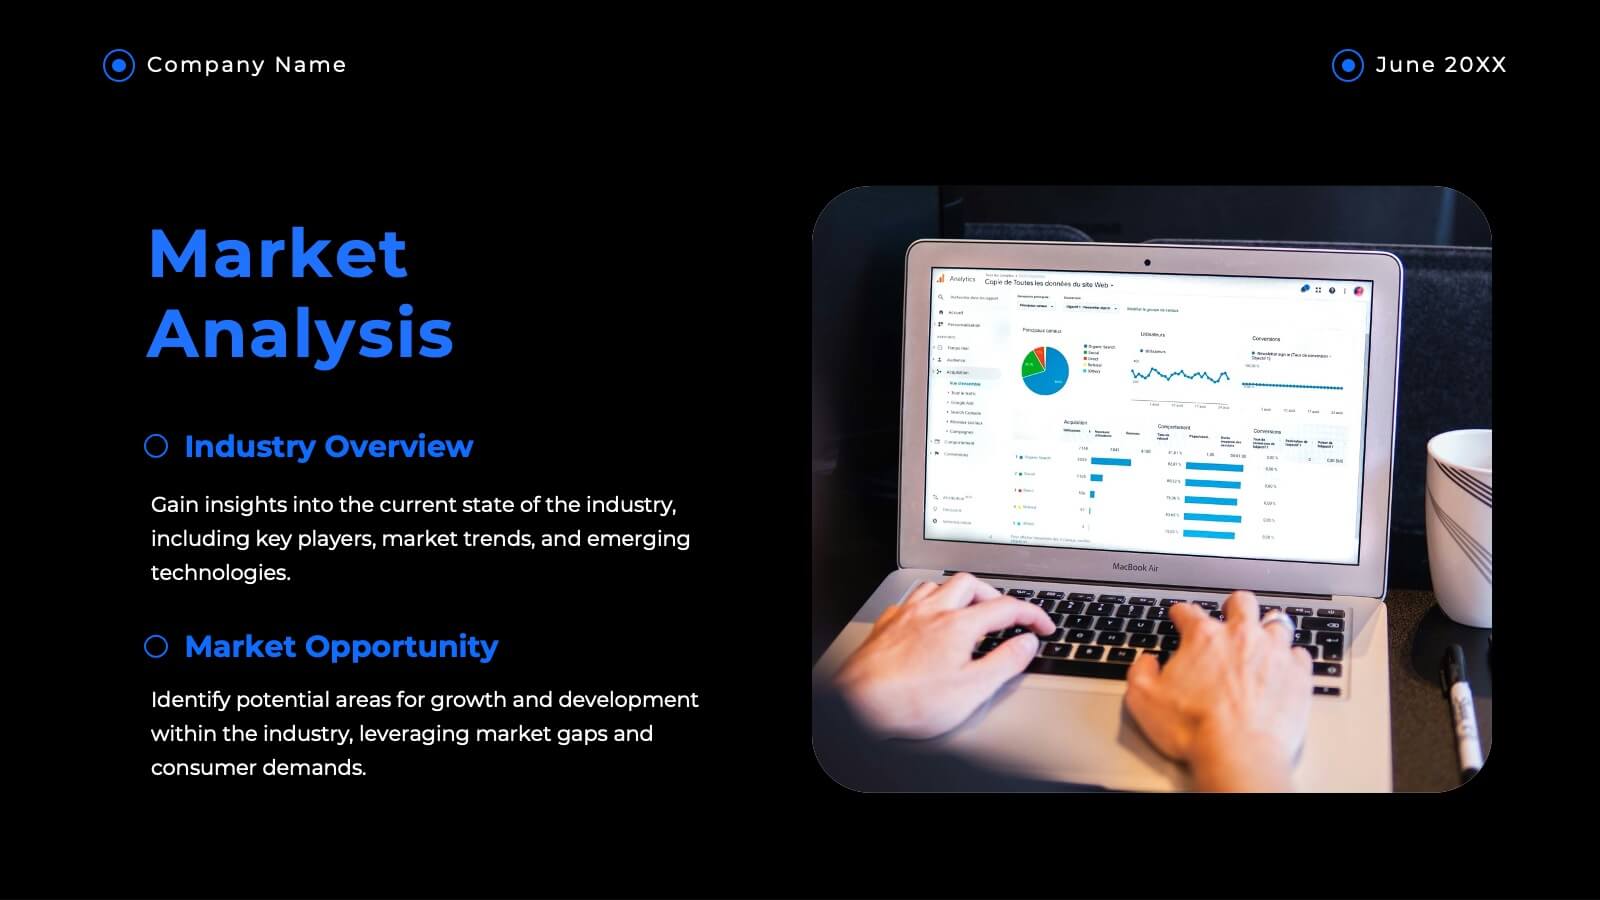
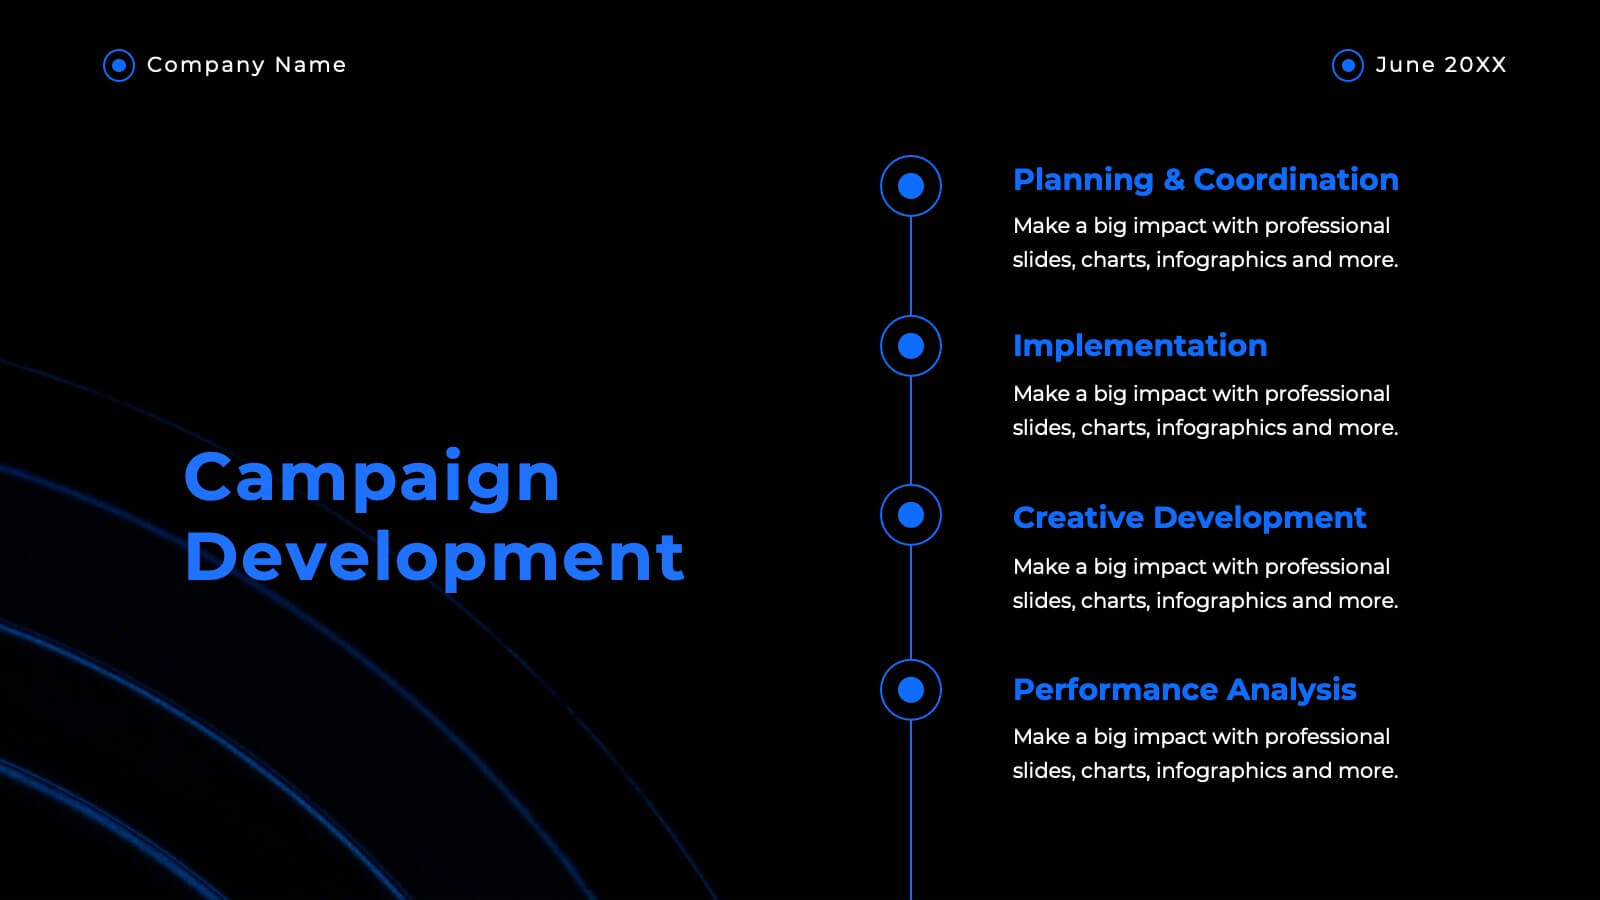
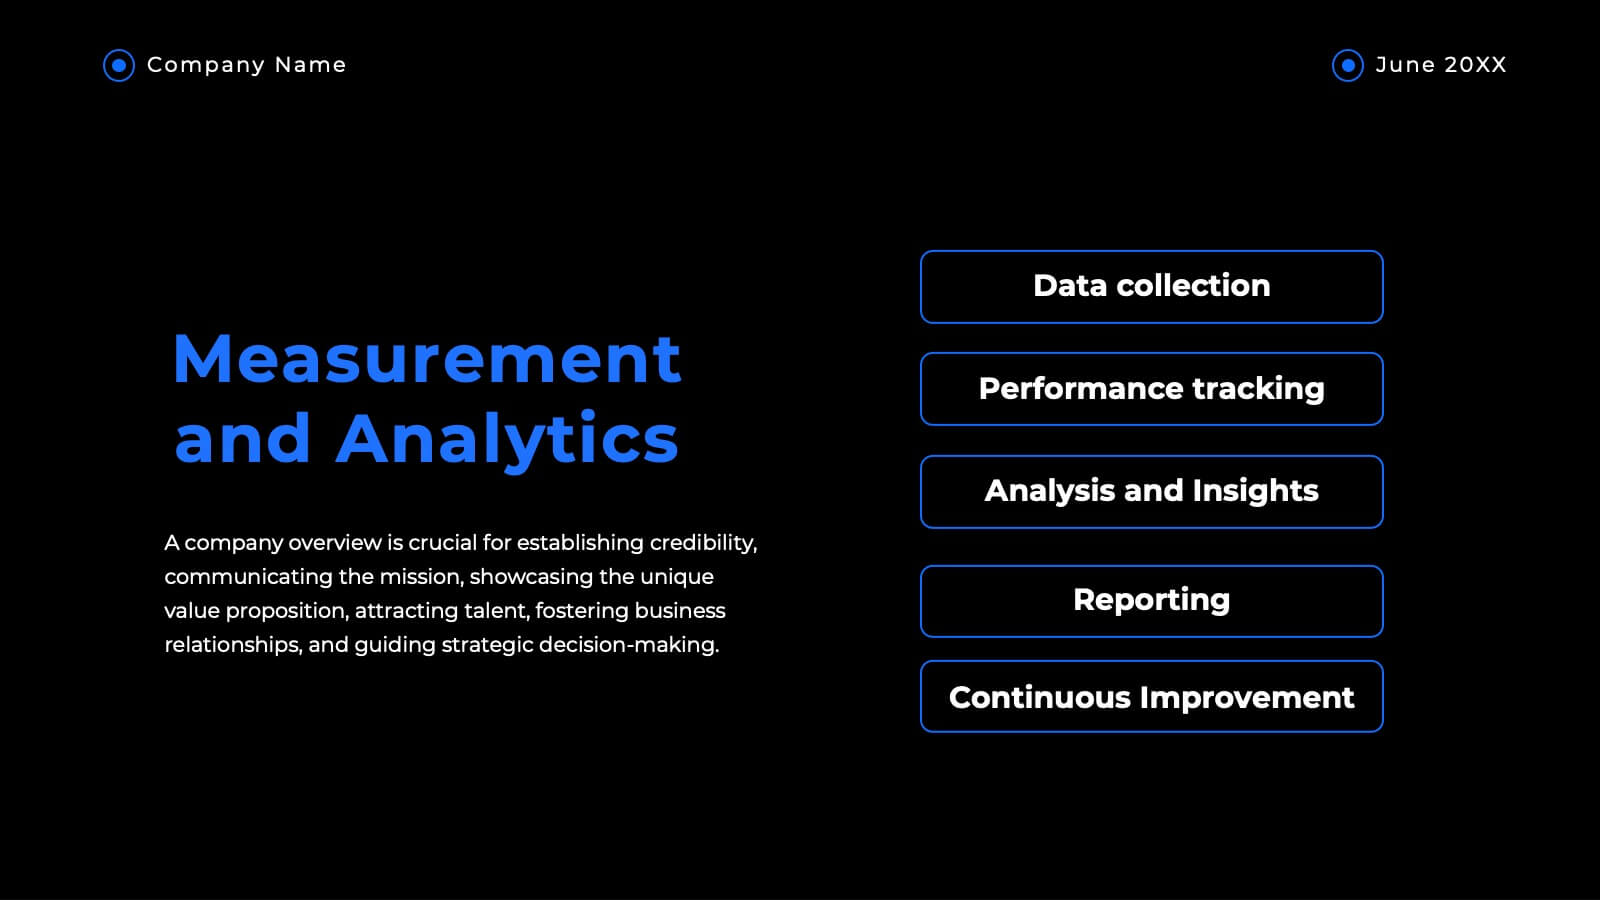
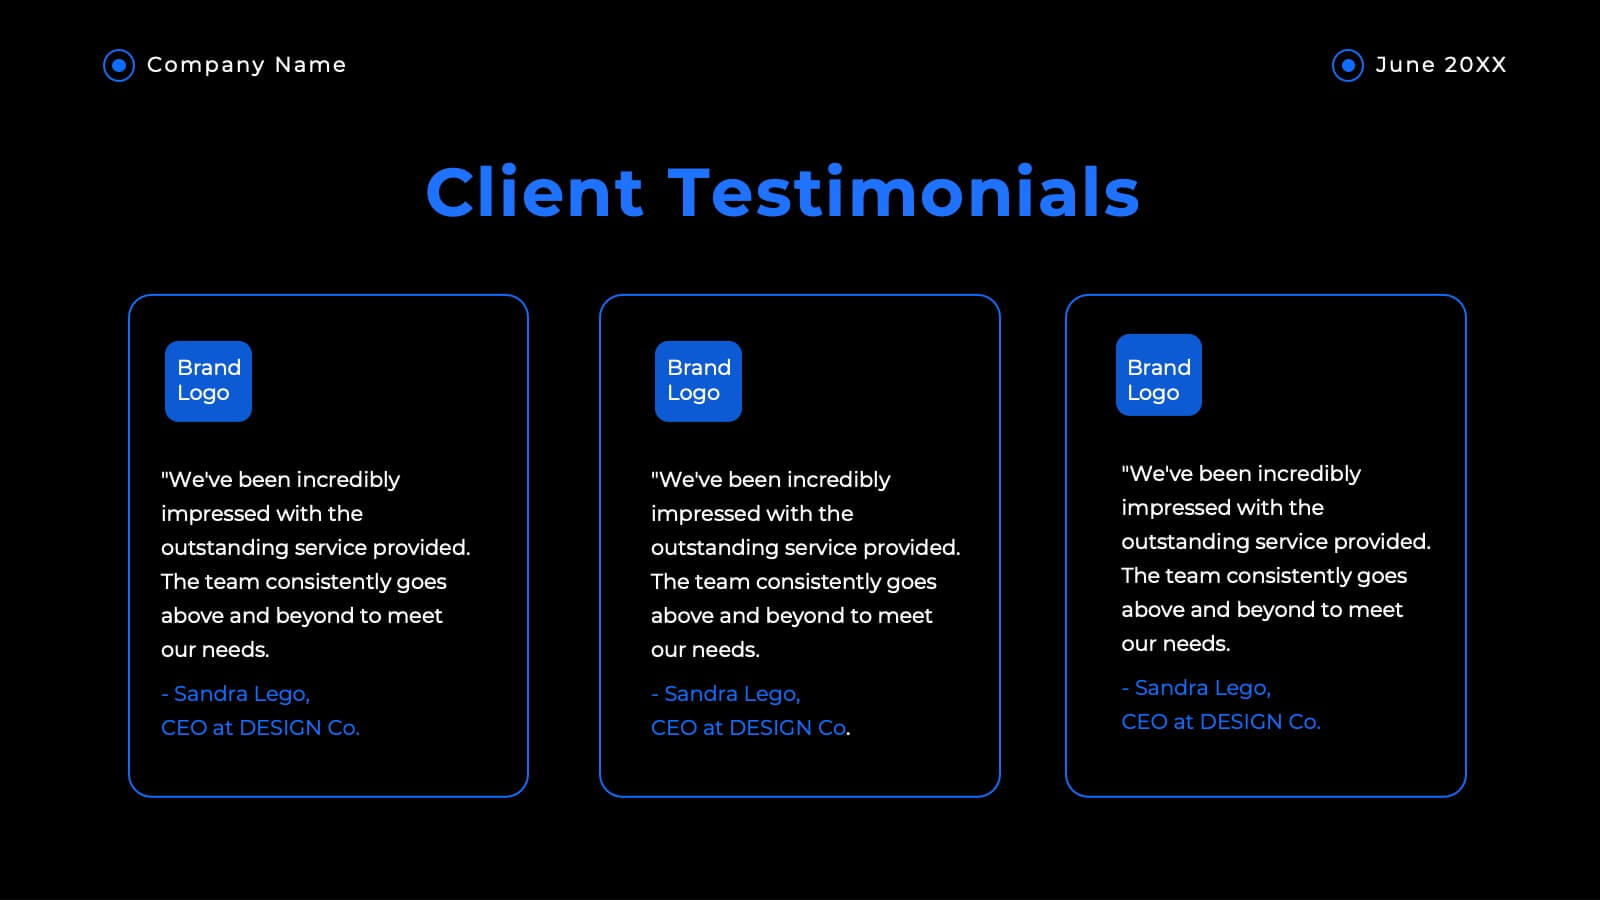
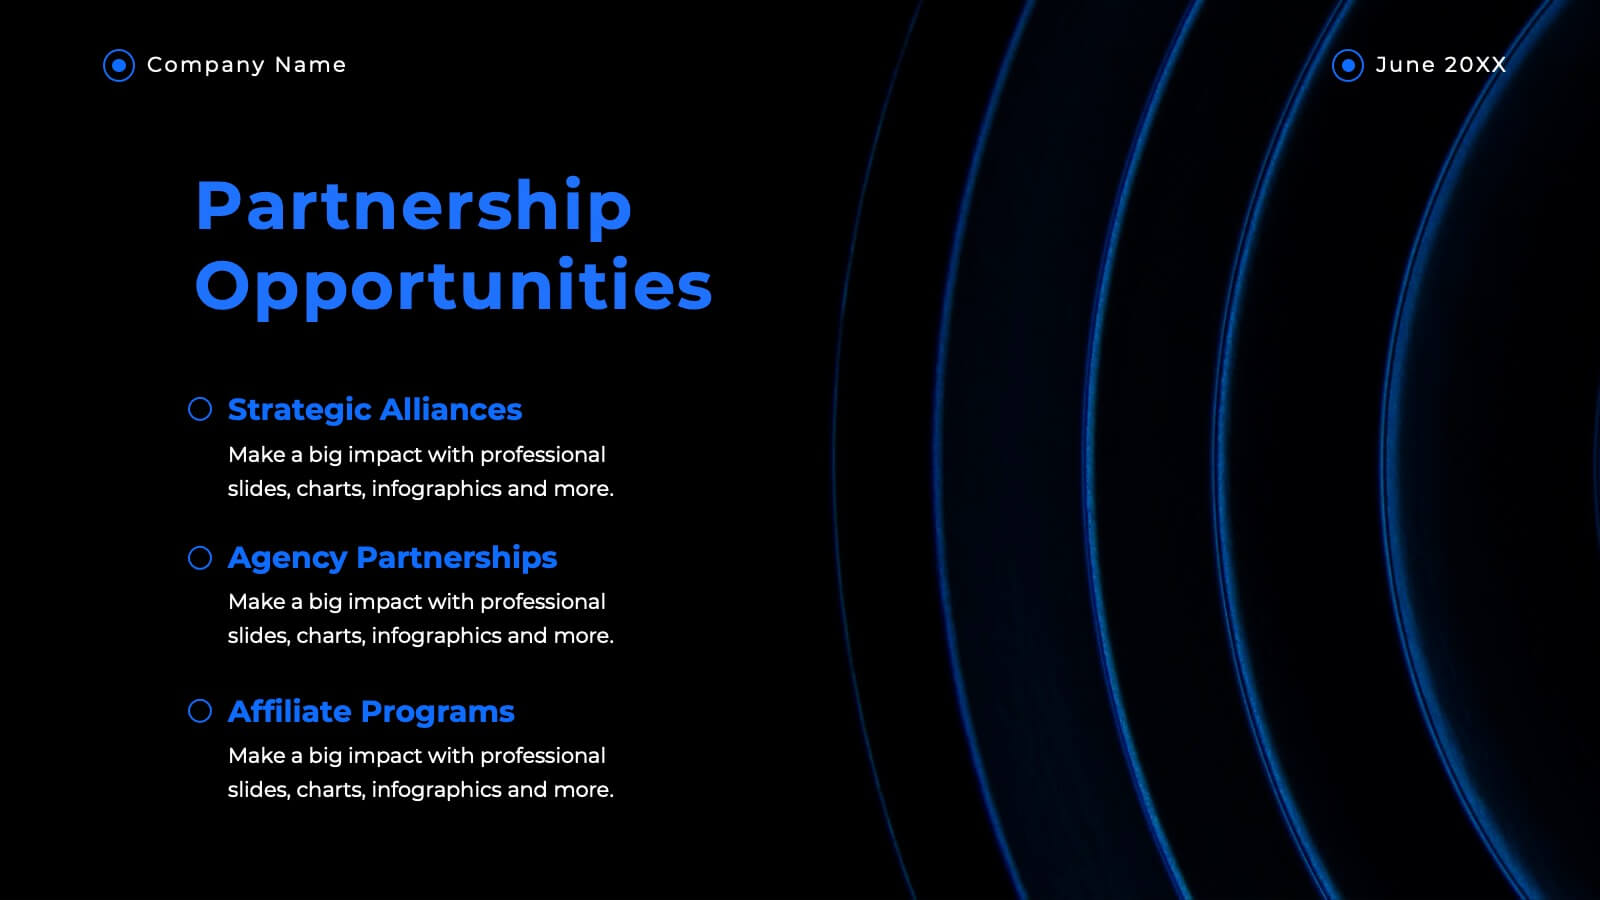
Haven Advertising Agency Proposal Presentation
Wow your clients with this sophisticated agency presentation template! Perfect for showcasing your services, client success stories, and market analysis. Ideal for agencies looking to impress and secure new business. Compatible with PowerPoint, Keynote, and Google Slides, this template ensures your proposals stand out with professional elegance. Perfect for any pitch or proposal.


7 diapositivas
Team Leadership and Management Presentation
Unlock the secrets of effective team leadership and management with our detailed presentation template. Designed for training sessions and workshops, it provides clear guidance on key leadership principles and team management tactics through engaging graphics and strategic layouts. Ideal for enhancing team dynamics and leadership skills.


8 diapositivas
Workforce Skills Gap Analysis Presentation
Identify and Bridge Workforce Skill Gaps! This Workforce Skills Gap Analysis template provides a structured approach to assess, compare, and close competency gaps within an organization. Designed with interactive bar chart visuals, it enables HR professionals, managers, and training specialists to track employee skill levels, identify gaps, and align workforce development strategies. Fully customizable in PowerPoint, Keynote, and Google Slides, this template ensures a clear and data-driven approach to workforce planning and professional growth.


5 diapositivas
Construction Processes Infographics
Dive into the construction industry with this detailed infographic template that provides a comprehensive overview of construction processes, careers, and competitive strategies. Ideal for professionals, educators, and students involved in construction, this resource offers a clear and structured presentation of various aspects of the field. The infographic is divided into sections detailing key areas such as industry sectors, job roles, and strategic approaches for sustainable competitiveness. It highlights important segments like planning, finance, legal aspects, and on-site construction activities, all designed to give a well-rounded view of the construction process. Additionally, it includes data on job growth, employment statistics, and future projections, which are crucial for understanding labor market trends within the construction sector. Vibrant colors and easy-to-understand layouts make this template not only informative but also visually appealing. Whether used in training sessions, academic courses, or professional presentations, this infographic is a valuable tool for conveying the dynamic and multifaceted nature of the construction industry.


6 diapositivas
Strategic Objective Planning Presentation
Present your Strategic Objective Planning with this powerful, chess-themed presentation template. Highlight competitive strategies, goal alignment, and decision-making with visually engaging chess piece graphics. Ideal for corporate strategy, business planning, and leadership presentations. Compatible with PowerPoint, Keynote, and Google Slides.


24 diapositivas
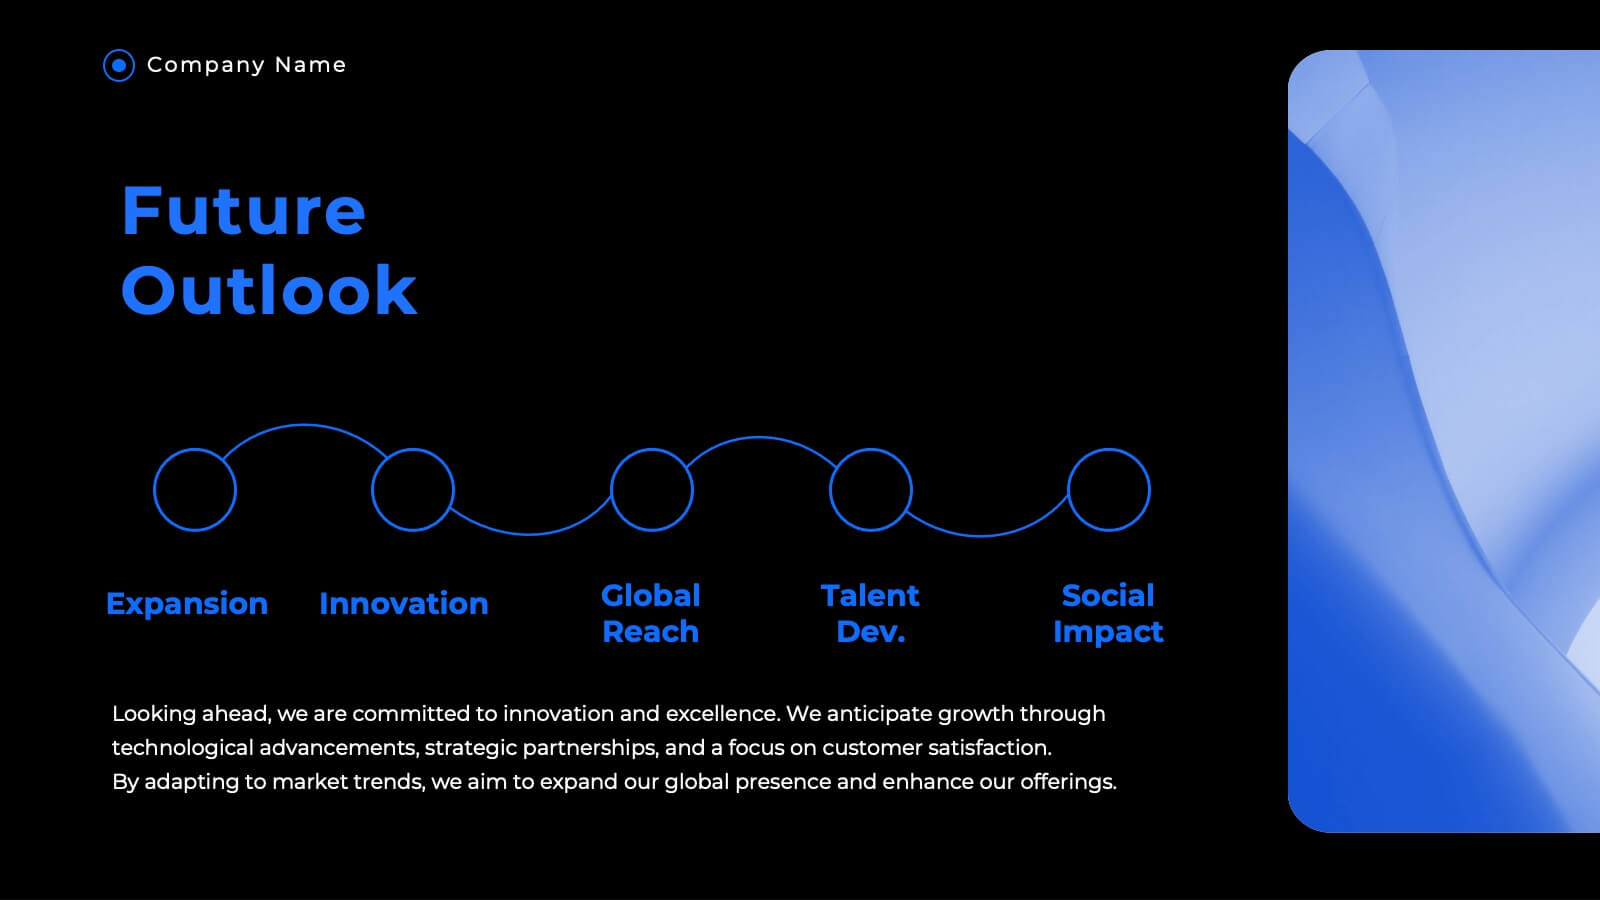
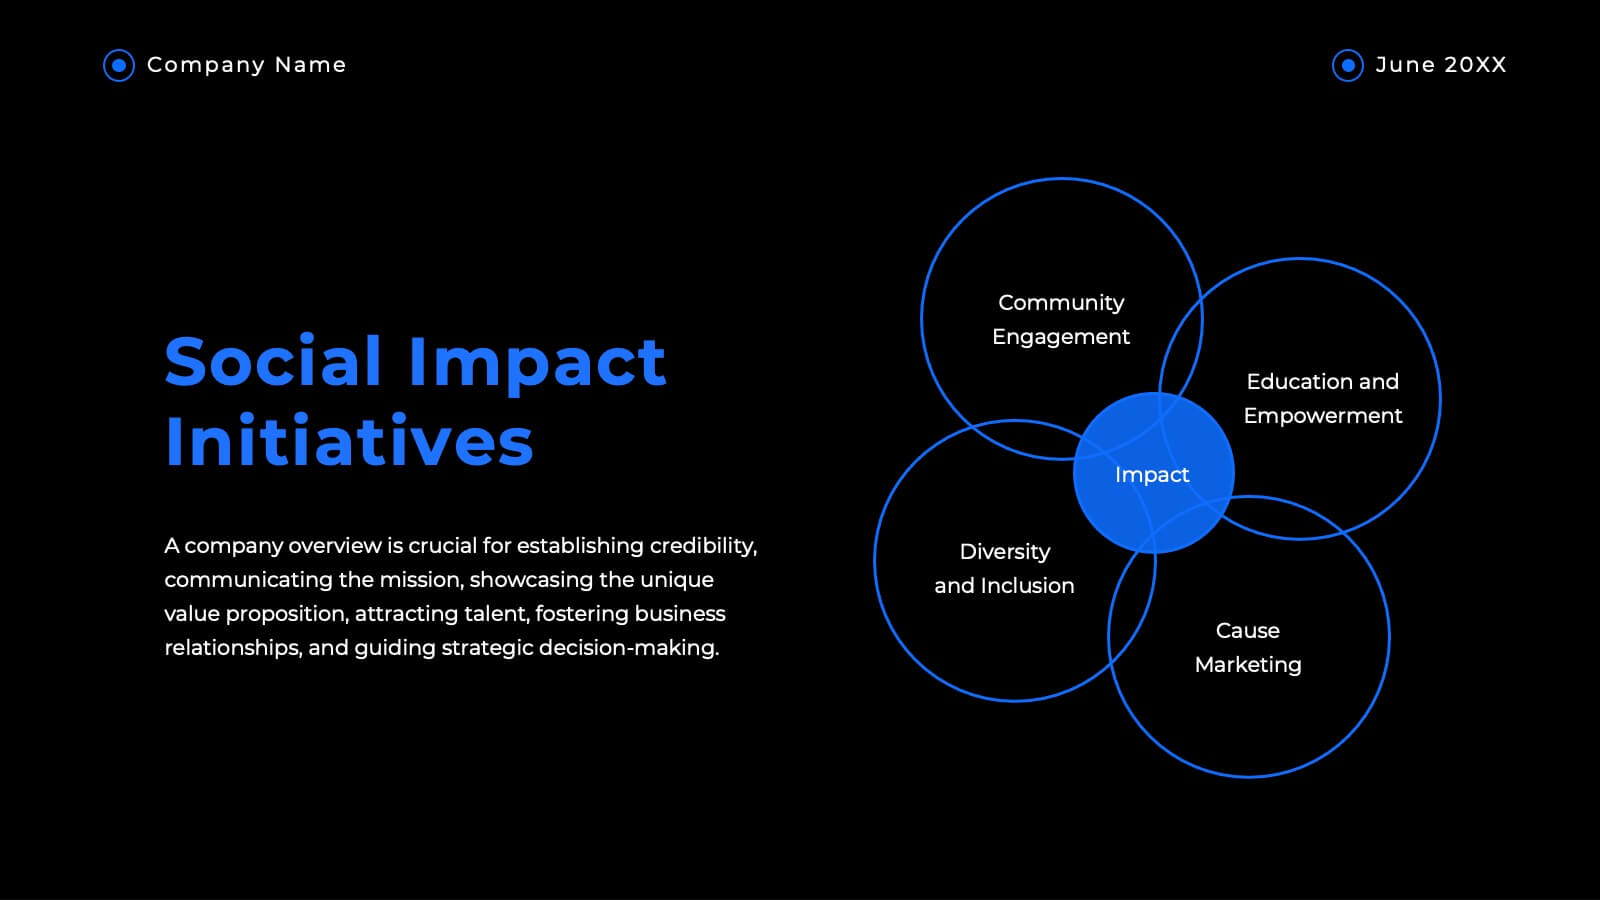
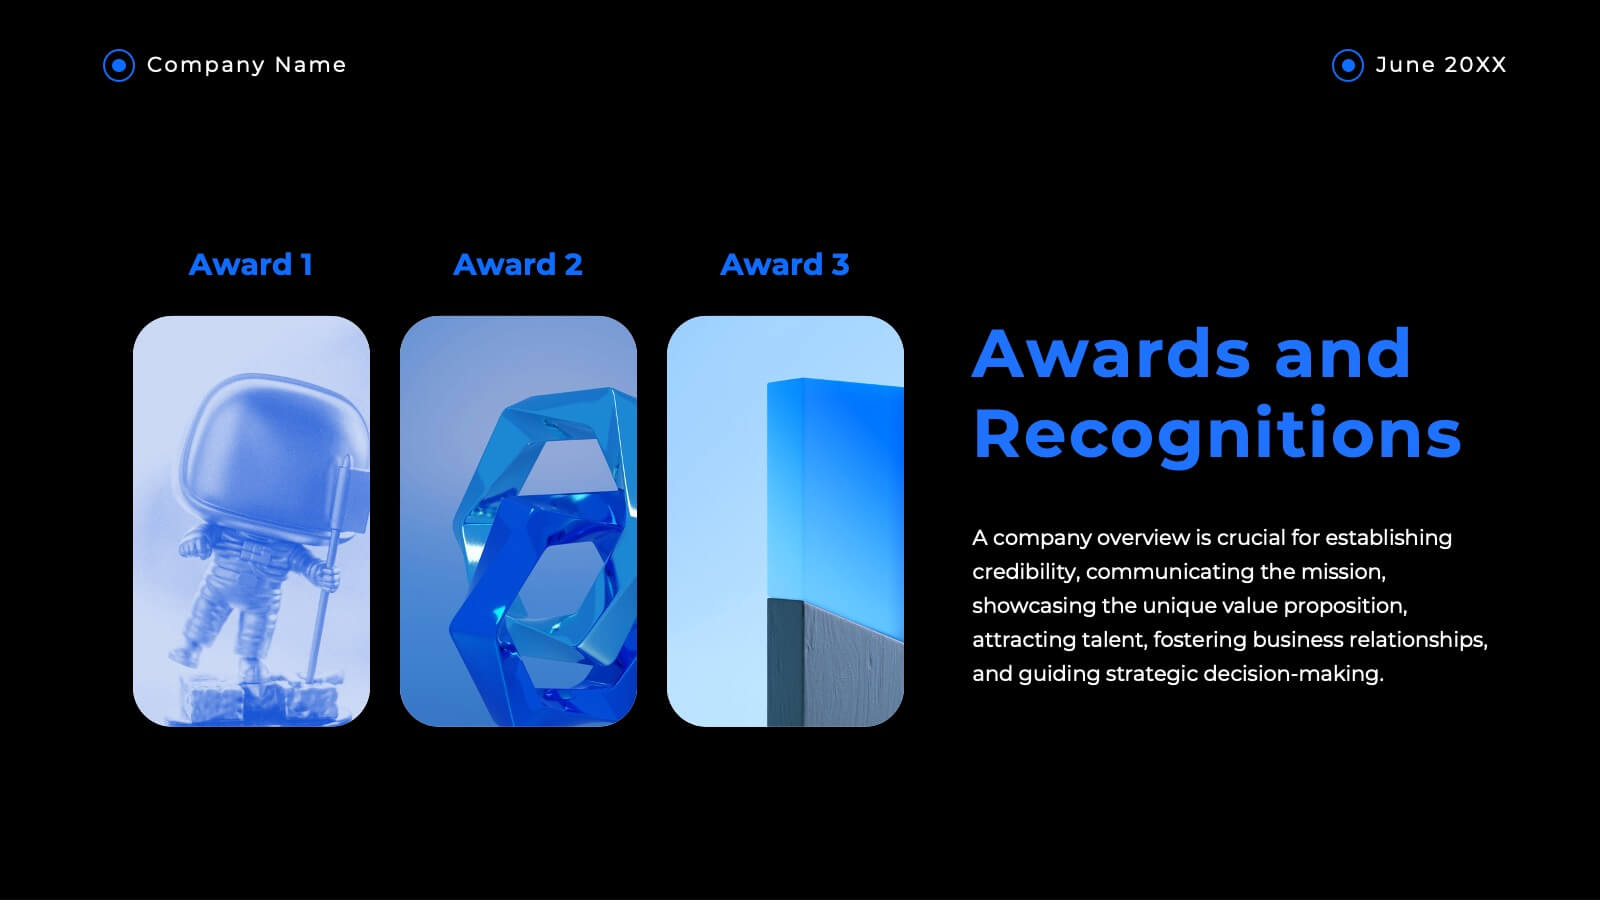
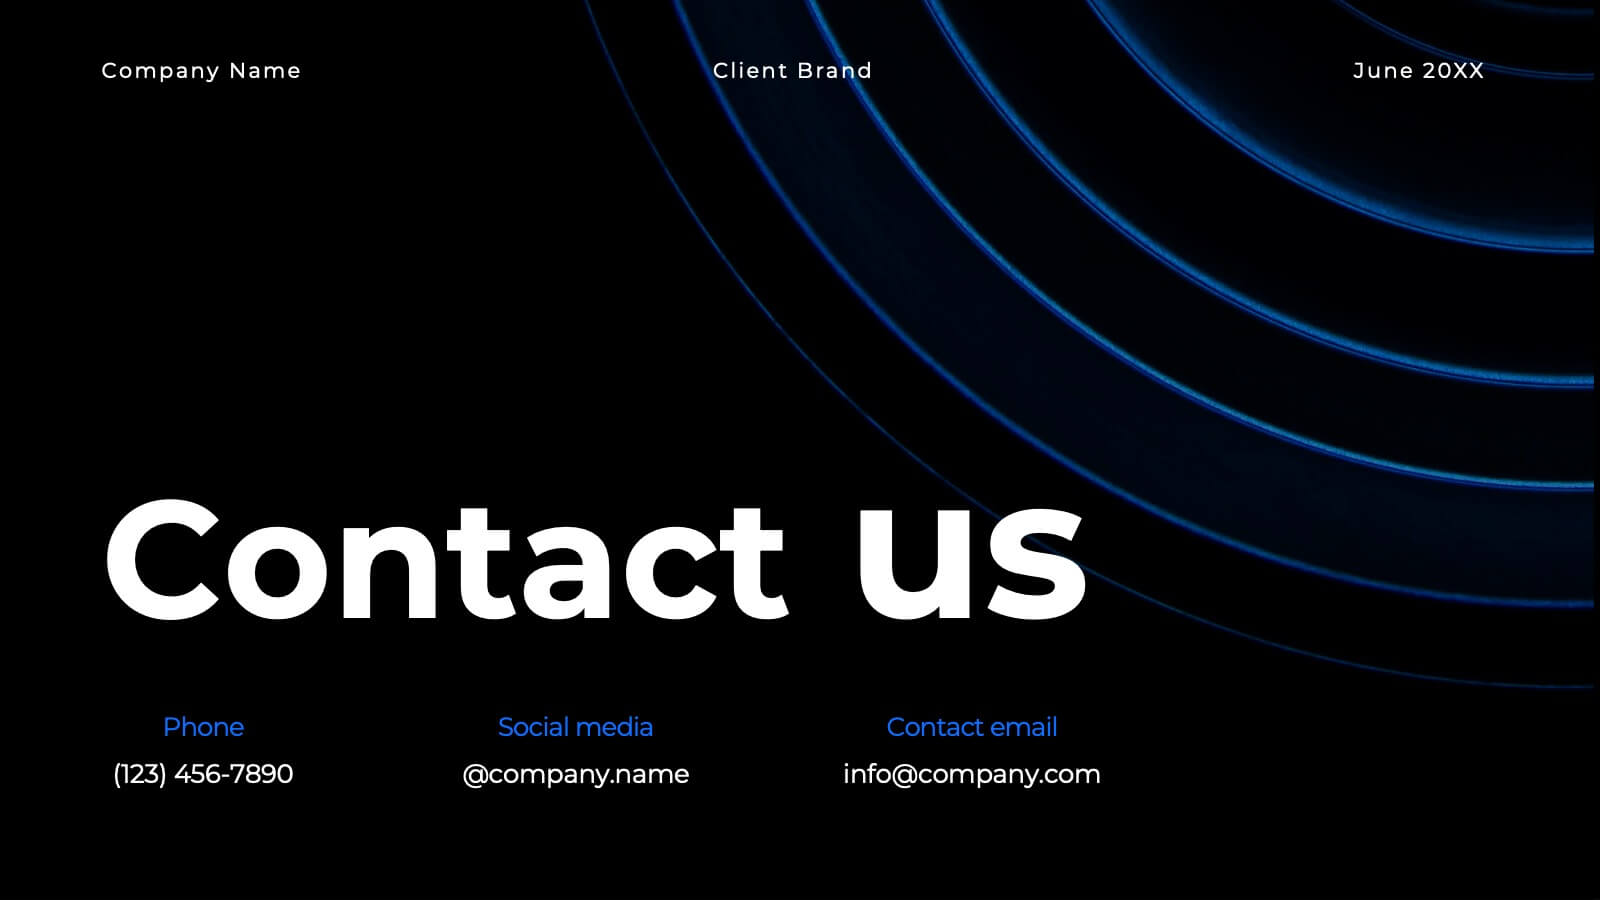
Brand Overview Presentation
Enhance your brand storytelling with our Brand Presentation template. Perfect for showcasing brand vision, values, and strategies, this template includes diverse slides for audience targeting and brand touchpoints. Suitable for all professional settings, it's compatible with PowerPoint, Keynote, and Google Slides.


5 diapositivas
Veterinary Medicine Advances Presentation
Discover the latest in Veterinary Medicine Advances with our engaging presentation template. Designed to highlight key innovations and treatment methods, this template offers a clear visual format for presenting complex information effectively to colleagues and stakeholders in the veterinary field.


3 diapositivas
Financial Market Performance Overview Presentation
Analyze trends with clarity using the Financial Market Performance Overview presentation template. This layout features a storefront-style visual paired with pie charts and a trend graph, ideal for displaying key financial metrics, market breakdowns, or investment summaries. Perfect for analysts, economists, and finance teams aiming to convey insights with simplicity and style. Fully editable and compatible with PowerPoint, Keynote, and Google Slides.


5 diapositivas
Travel Planning and Destination Guide Presentation
Highlight your itinerary or destination comparisons with this suitcase-stacked infographic slide. Each luggage icon aligns with a percentage label and text box, helping you present travel data, tips, or packing categories in an engaging and visually organized way. Perfect for travel agencies, bloggers, and vacation planners. Fully editable in PowerPoint, Keynote, and Google Slides.


5 diapositivas
Country Highlight Asia Map Presentation
Showcase your regional insights with a clean and modern map that brings focus to key countries across Asia. Ideal for displaying market reach, growth metrics, or strategic locations, this visual layout makes data storytelling simple and effective. Fully compatible with PowerPoint, Keynote, and Google Slides for easy customization.


7 diapositivas
Target Market Infographic Presentation Template
A target market Infographic is a visual representation of a specific group of consumers that a business has determined to be the focus of its marketing efforts. This infographic is designed to understand the demographics, behaviors, and motivations of the potential consumers. This infographic can be used to show the size and growth potential of the target market, and how it compares to other market segments. This template is designed to display your information in the form of charts, graphs, or other data visualizations, and is accompanied by written descriptions of your data and insights.


21 diapositivas
Mythspire Market Research Presentation
This market research template offers a clean design for presenting objectives, data collection, analysis, and findings. Perfect for showcasing research methodologies, visualizations, and actionable recommendations. Fully customizable and ideal for business or academic presentations. Compatible with PowerPoint, Keynote, and Google Slides.