


Características


¿Tienes alguna pregunta?
Recomendar


6 diapositivas
Central Idea Spider Layout Presentation
Bring your big idea to life with a sleek, organized layout that keeps every supporting point perfectly connected. This presentation is ideal for mapping strategies, goals, or project concepts in a clear, visual way. Fully customizable and compatible with PowerPoint, Keynote, and Google Slides for effortless editing.


2 diapositivas
Professional Closing Thank You Presentation
End your presentation on a high note with this professional thank-you slide template! Featuring a clean and modern layout, this design includes space for contact details and a call to action, making it perfect for business meetings, proposals, and networking events. Fully customizable and compatible with PowerPoint, Keynote, and Google Slides.


8 diapositivas
Territorial Reach Map of United States Presentation
Showcase your national footprint with the Territorial Reach Map of United States Presentation. This slide visually highlights specific states and aligns them with key data points—perfect for illustrating market penetration, sales concentration, or operational presence. Designed for clarity and impact, it's fully customizable in Canva, PowerPoint, and Google Slides.


7 diapositivas
Thank You Card Infographic
Celebrate the art of gratitude with this sophisticated collection, perfectly blending contemporary design with a personal touch. Each layout is crafted with aesthetic finesse, featuring subtle color palettes, elegant typography, and thoughtful placement of visual elements that enhance the warmth of your message. Offering a variety of designs from minimalist to richly textured backgrounds, this collection provides a unique backdrop for expressing thanks. Customize these cards for any occasion, whether it's professional gratitude towards colleagues and clients, or personal appreciation for friends and family. Ideal for both digital expressions and printed notes, this set ensures your message of thanks is received with the sentiment it’s intended. It’s a wonderful way to convey appreciation and leave a memorable impression on its recipients.


4 diapositivas
Left and Right Brain Diagram Presentation
Unlock the perfect blend of logic and creativity with a visual layout that highlights how analytical thinking and imaginative ideas work together. This presentation makes it easy to compare concepts, explain processes, and illustrate dual perspectives with clarity and color. Fully compatible with PowerPoint, Keynote, and Google Slides.


19 diapositivas
Fableia Marketing Research Report Presentation
Deliver data-driven insights with a professional and visually engaging marketing research report presentation. This template is tailored for marketing professionals, agencies, and businesses looking to showcase research findings with precision and clarity. Highlight key sections such as market trends, consumer behavior analysis, and campaign performance using dynamic visuals and well-structured layouts. Share your insights on emerging technologies, social media strategies, and customer targeting with easy-to-edit graphs, charts, and infographics. Use dedicated slides for SEO analytics, value propositions, and recommendations to present actionable strategies that resonate with your audience. This template is fully customizable and works seamlessly with PowerPoint, Google Slides, and Keynote, ensuring you can adapt it to your unique needs. Present your research with confidence and leave a lasting impact on stakeholders and decision-makers.


4 diapositivas
Environmental Sustainability Presentation
Showcase sustainable strategies with this triangle-style infographic focused on Environmental Sustainability. Perfect for illustrating the relationship between ecological, economic, and social pillars. The arrow-based design emphasizes continuity and impact. Fully customizable and ideal for PowerPoint, Keynote, and Google Slides presentations.


23 diapositivas
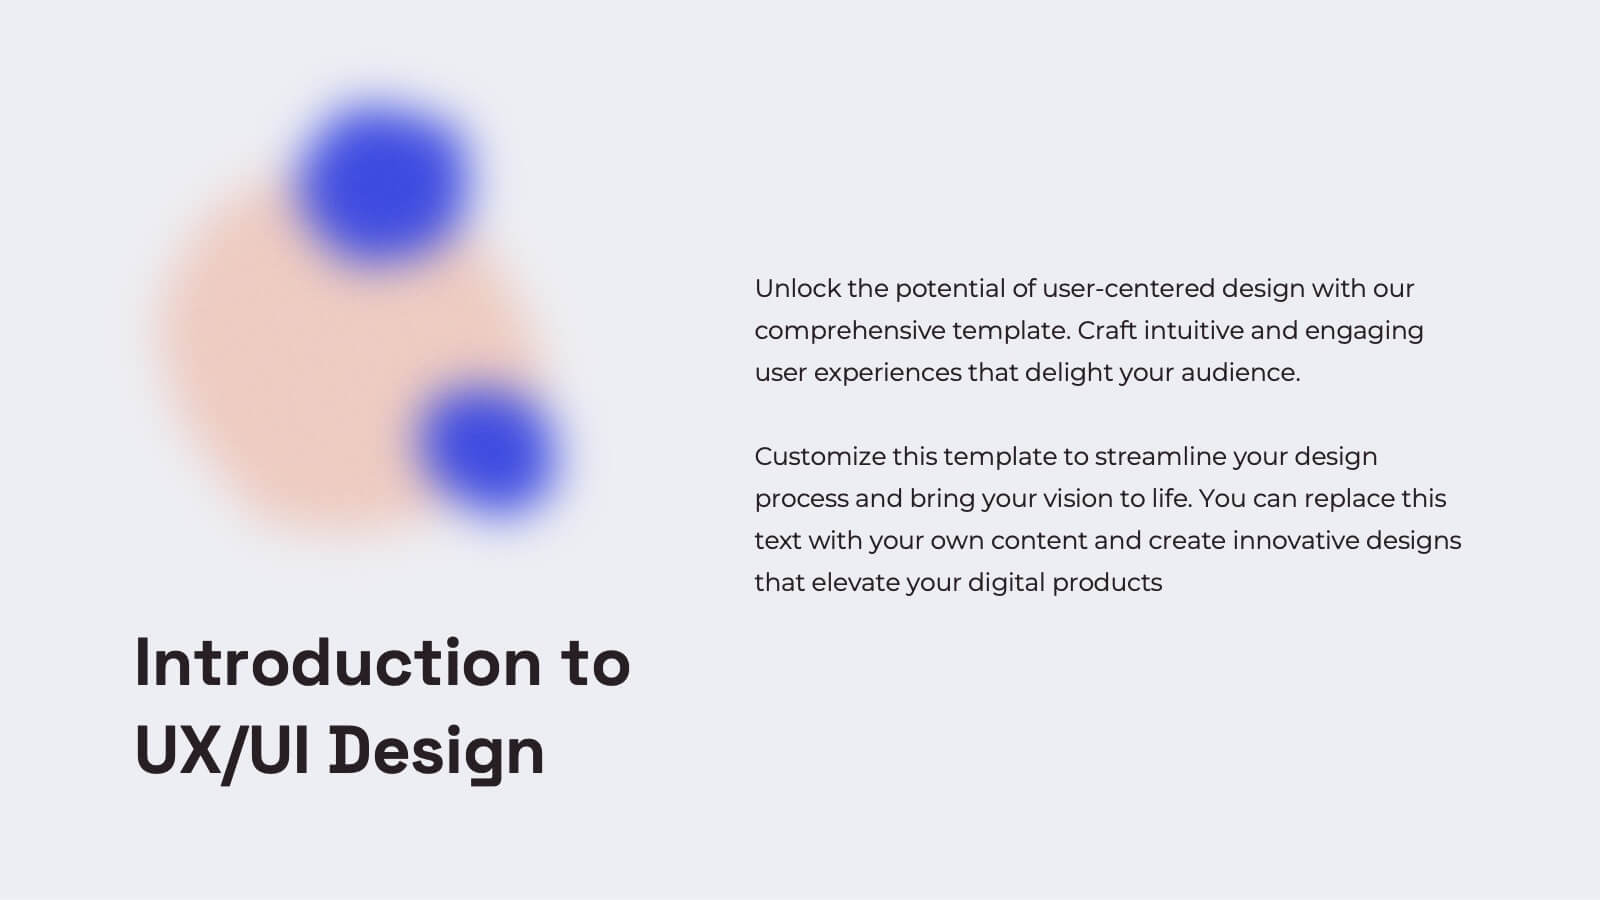
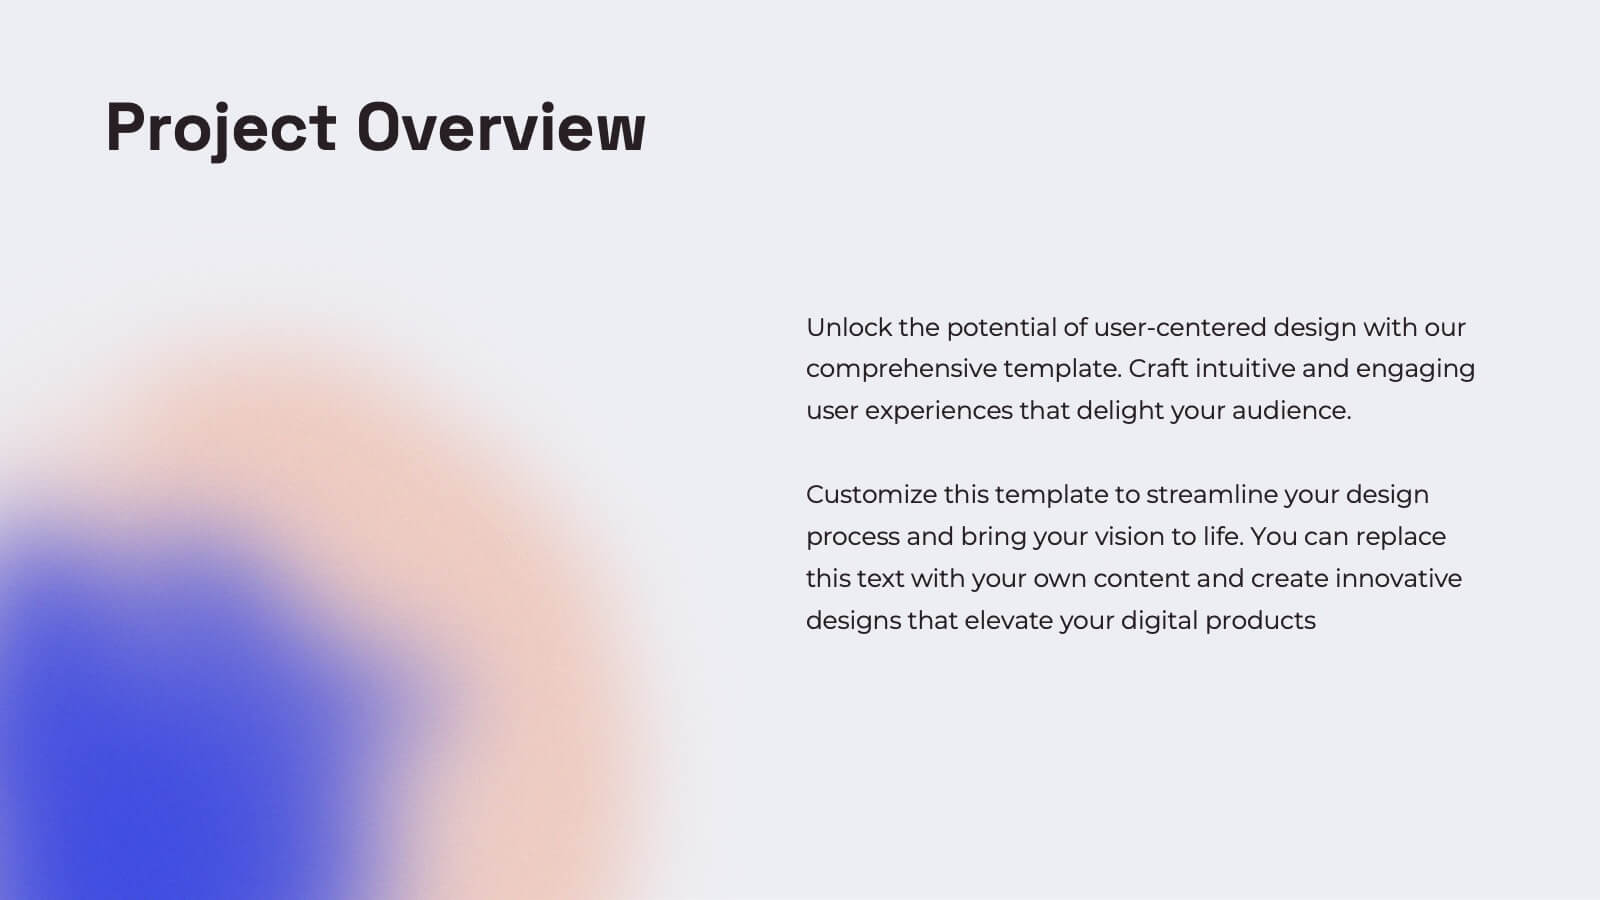
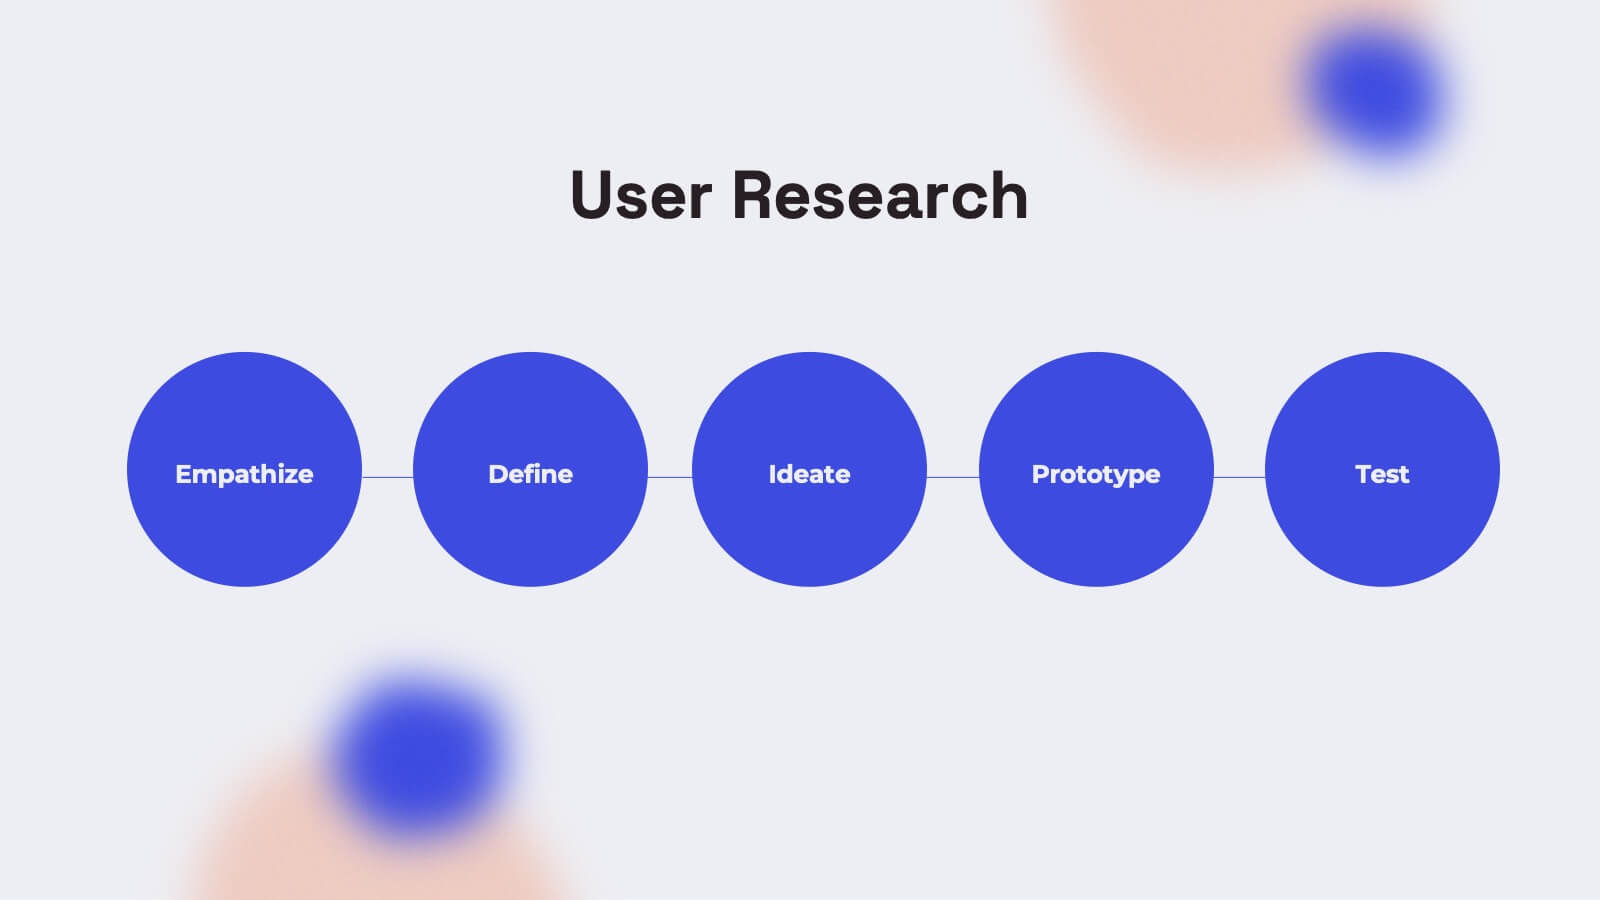
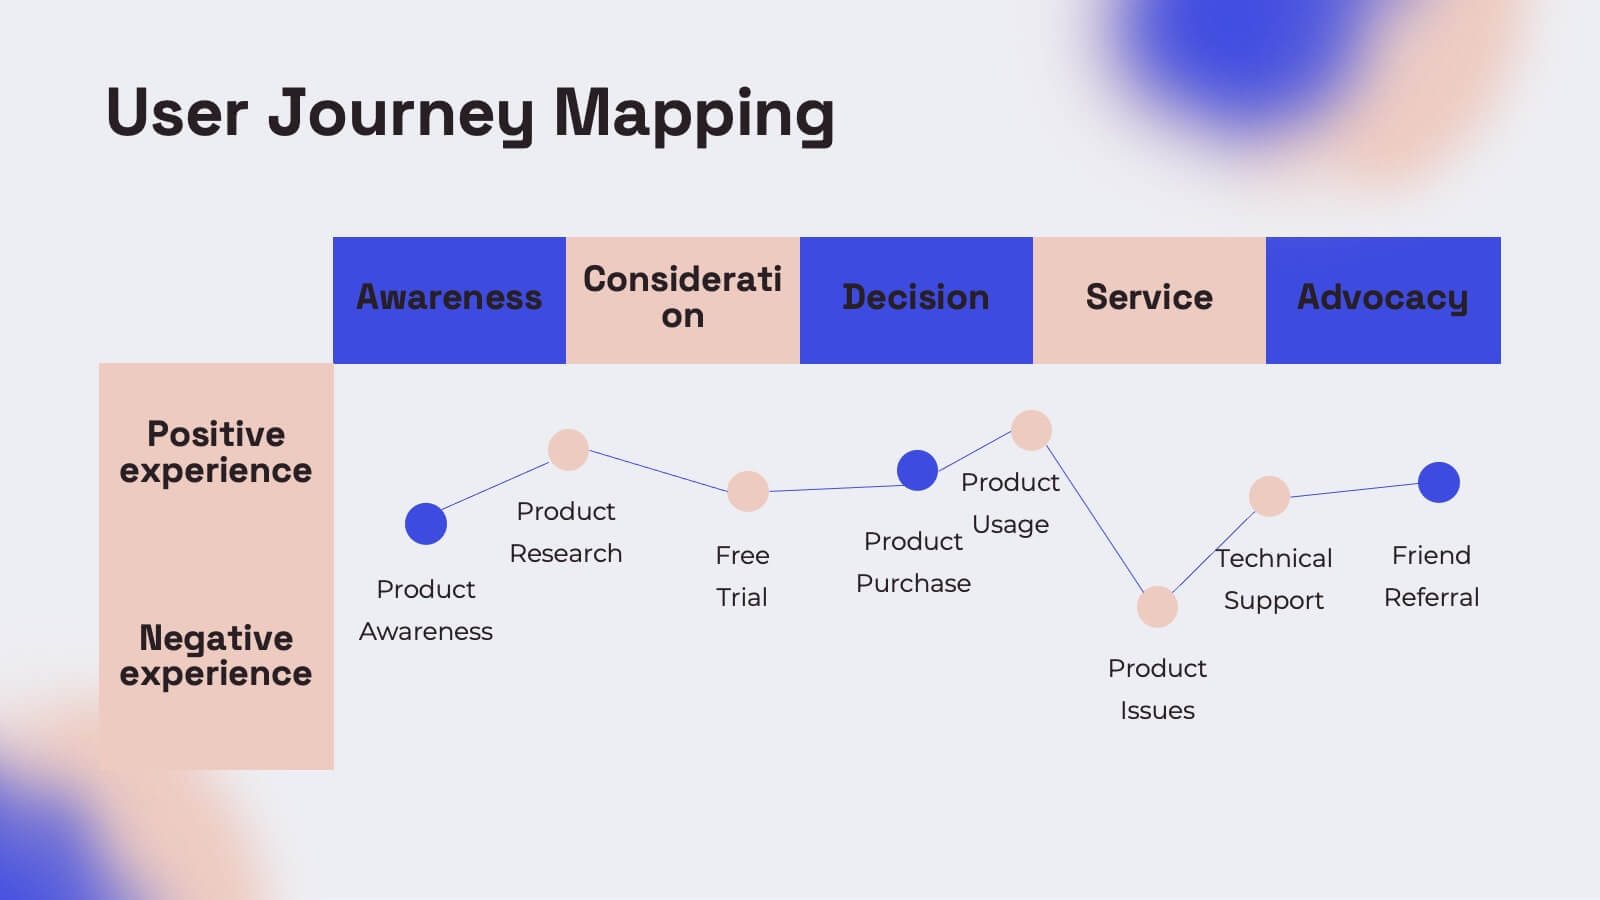
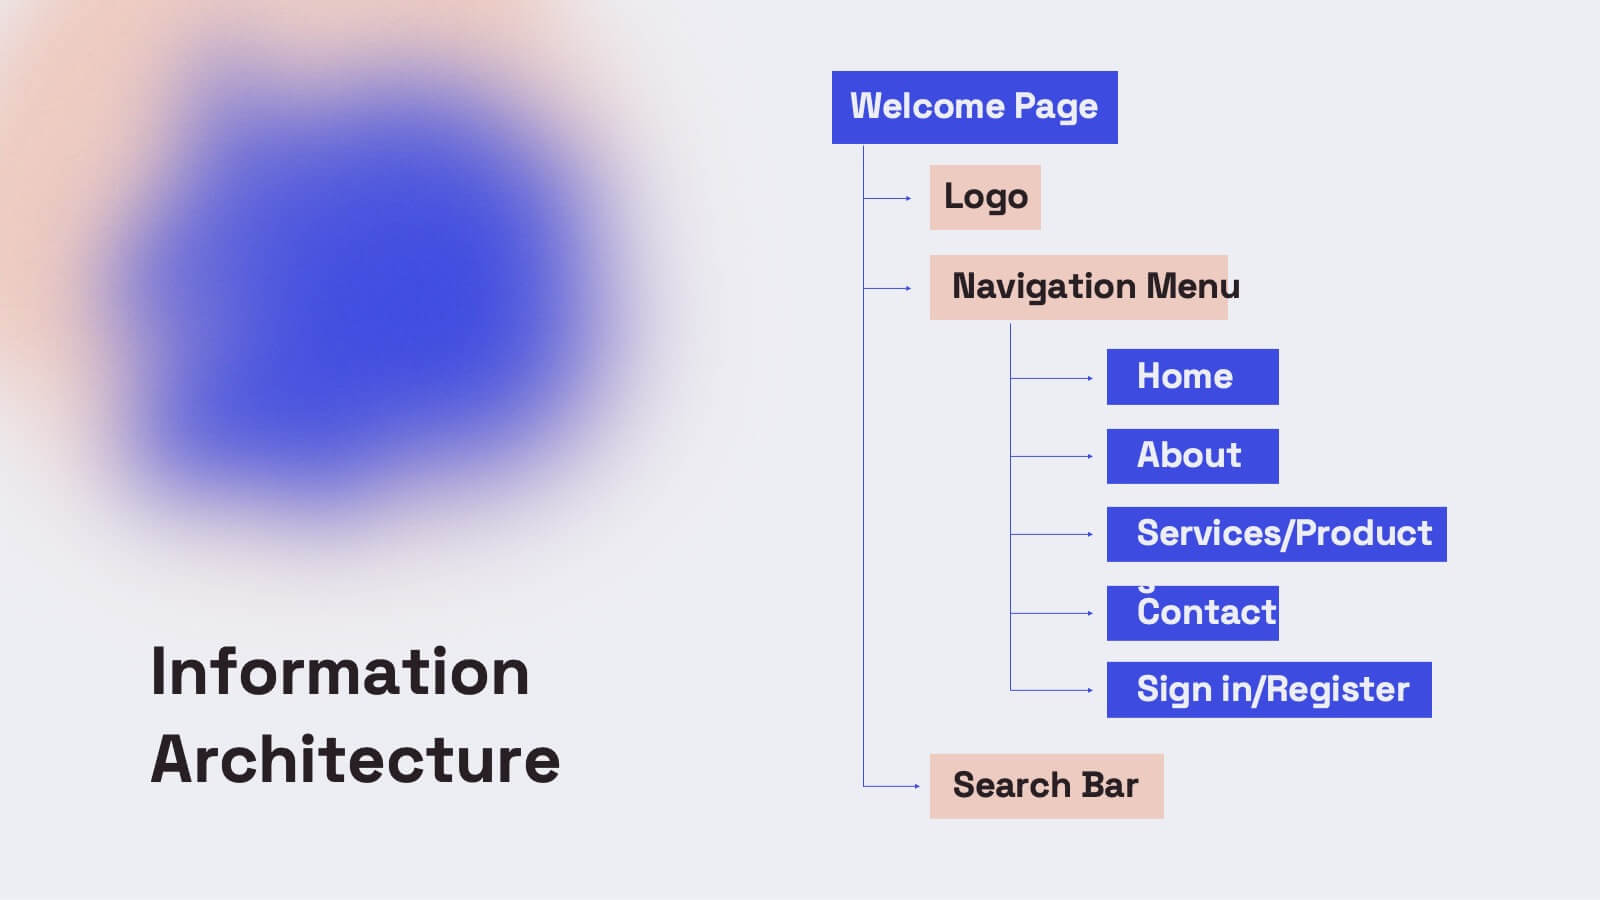
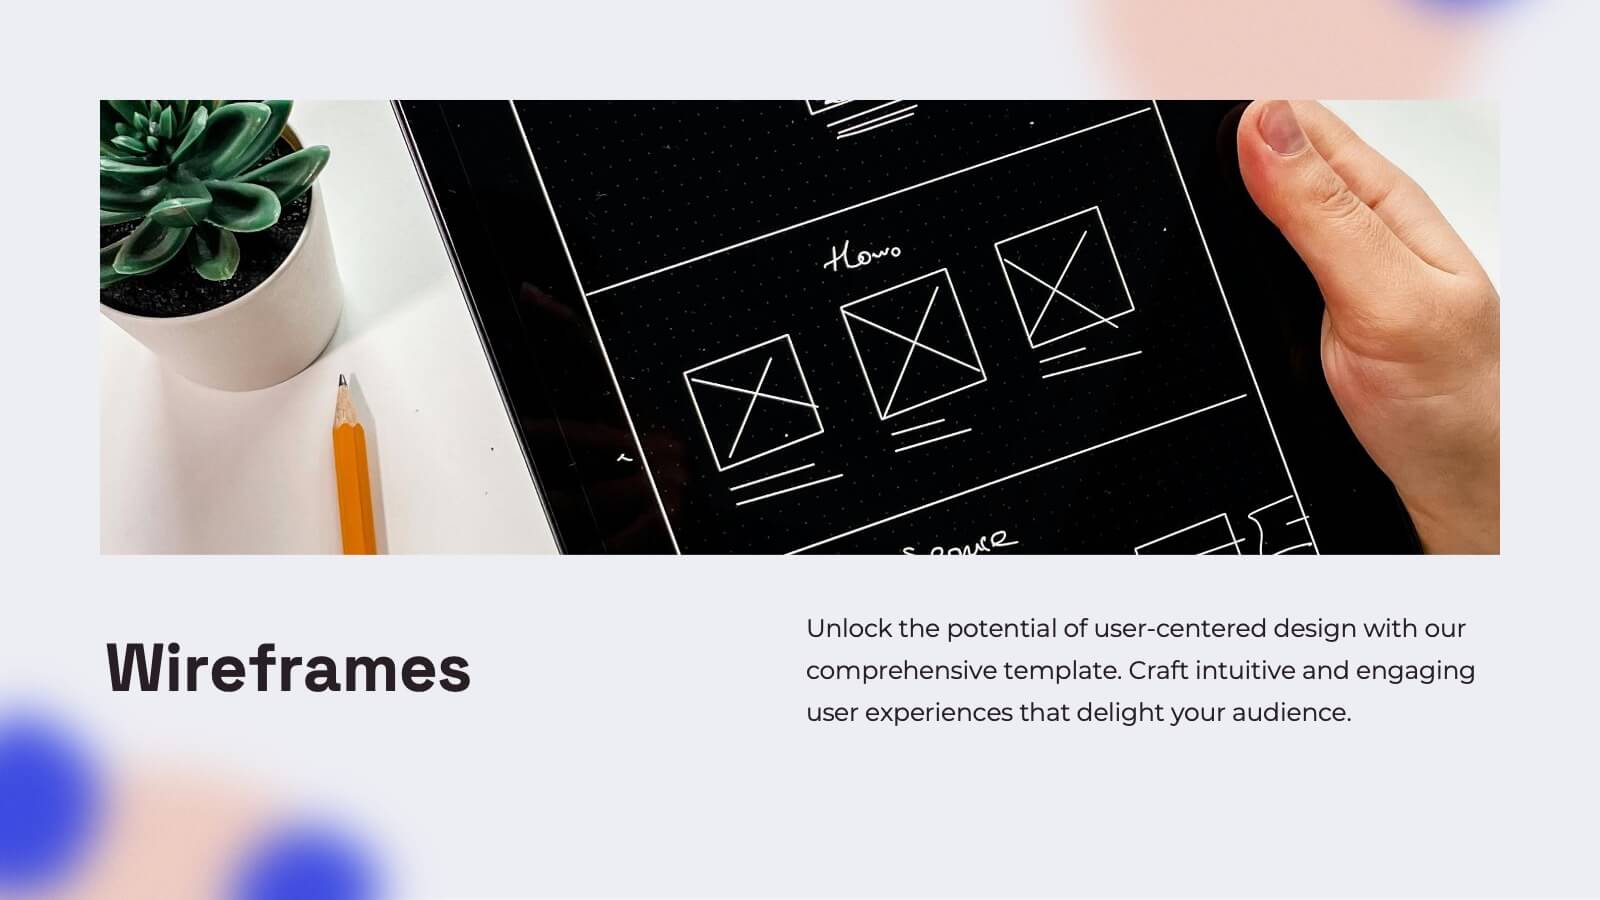
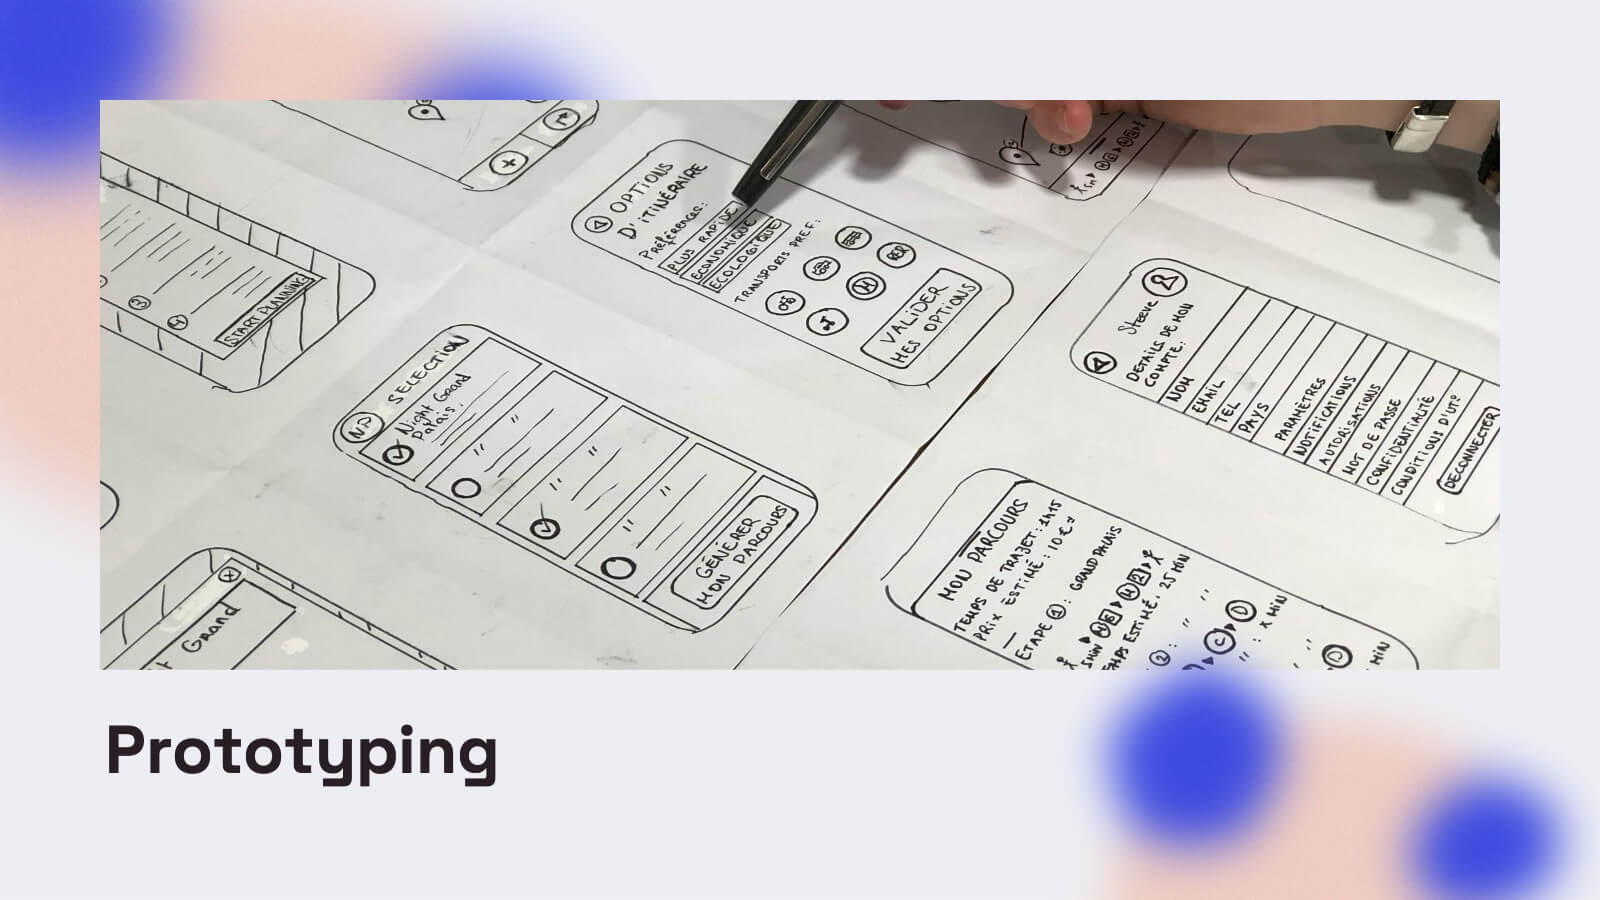
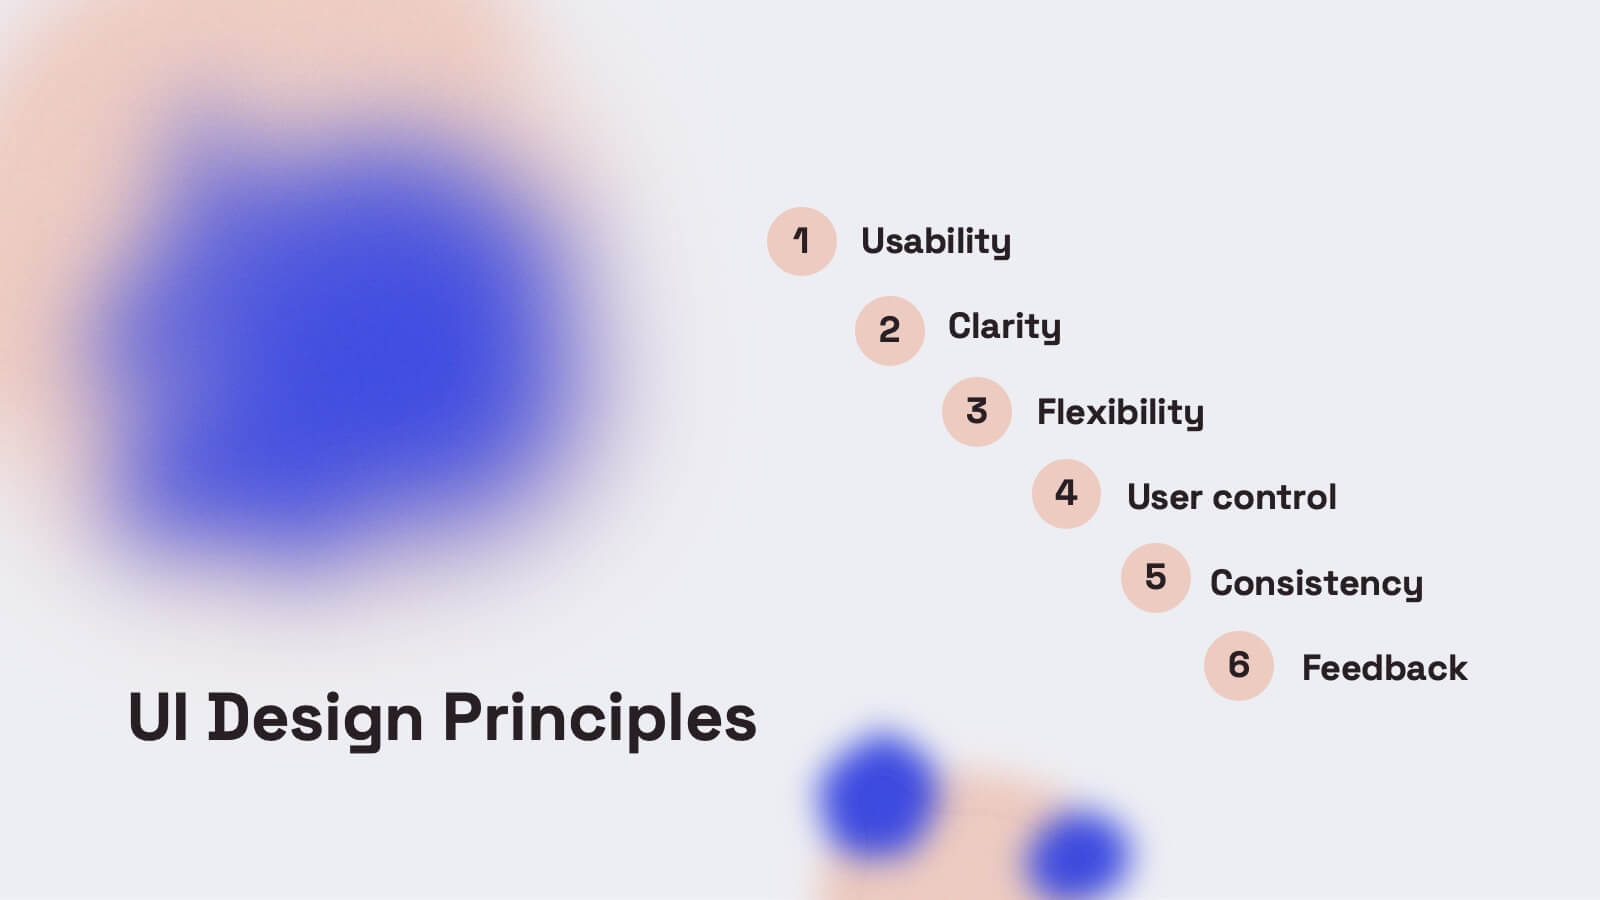
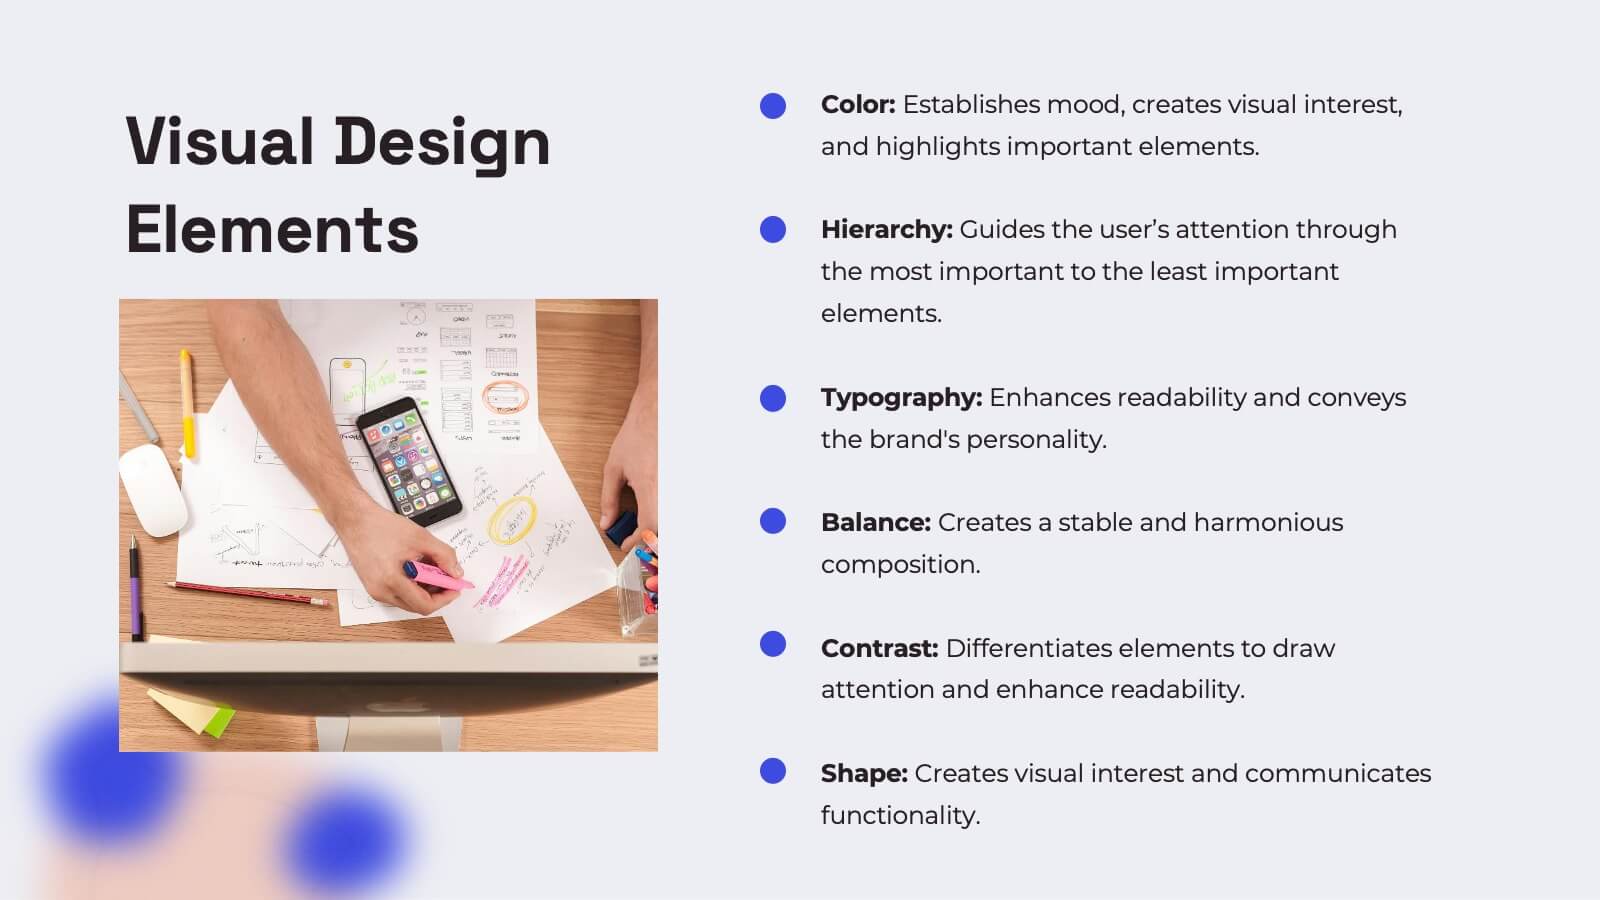
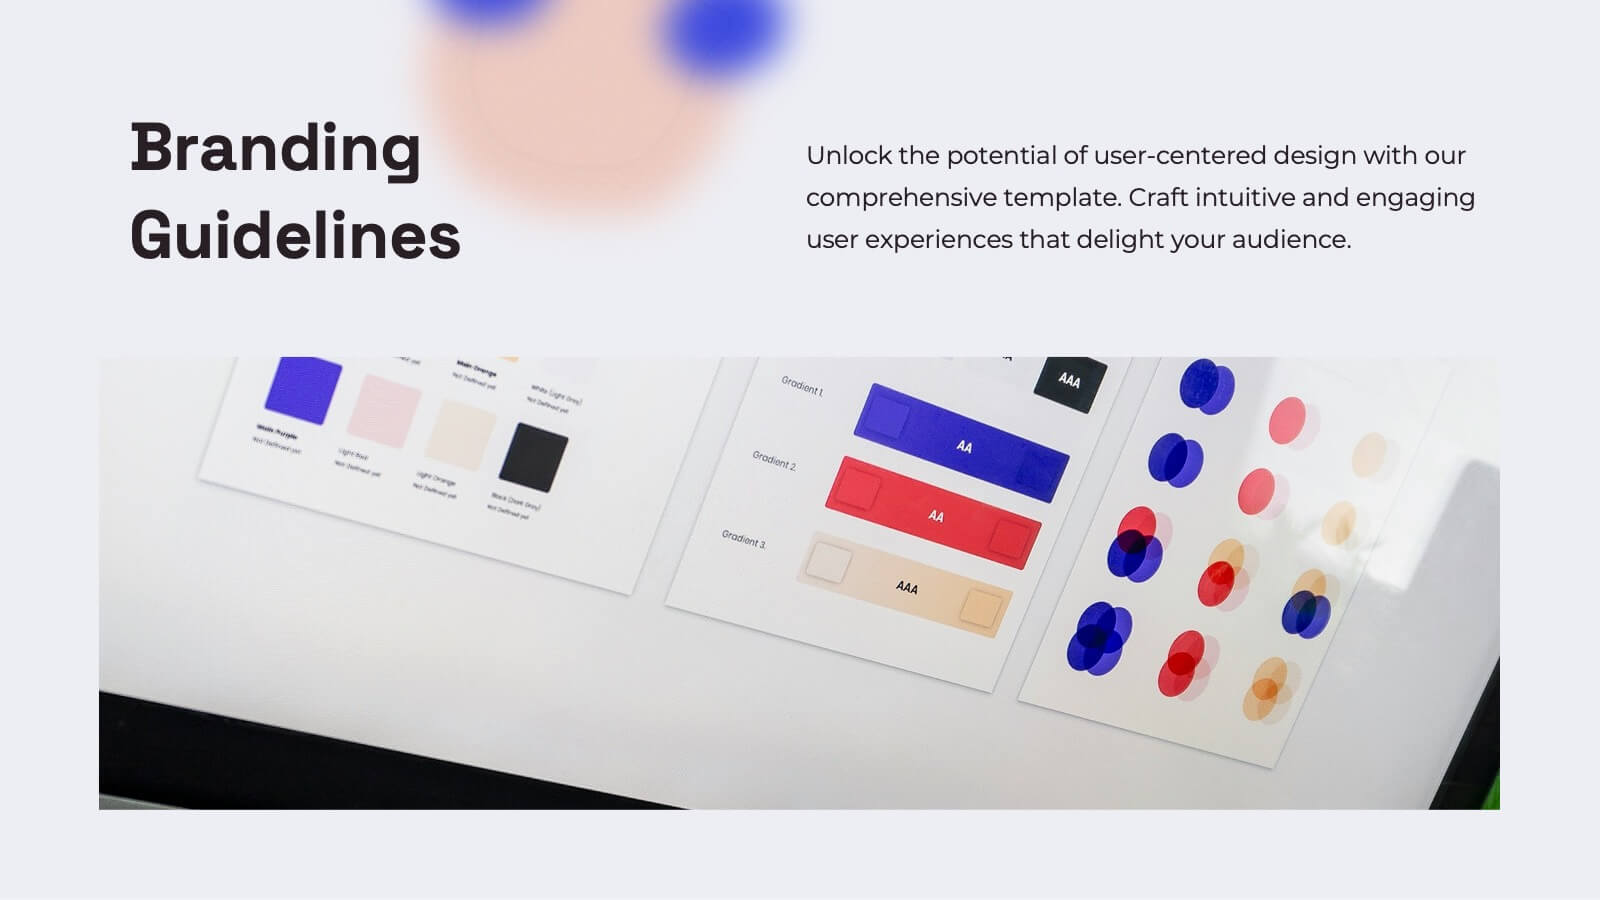
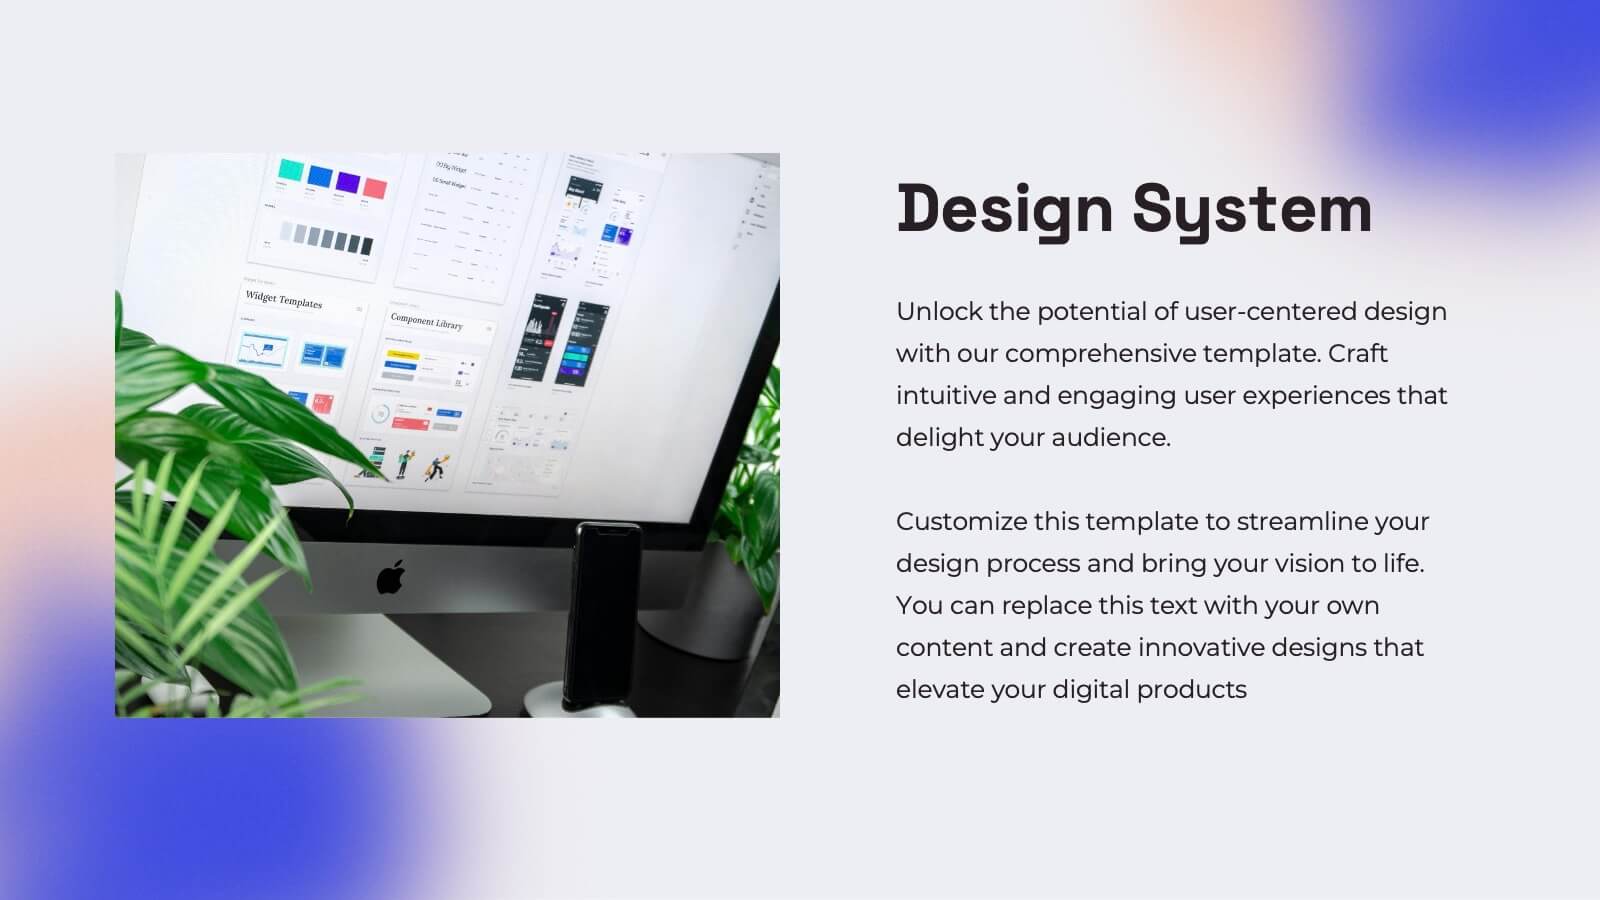
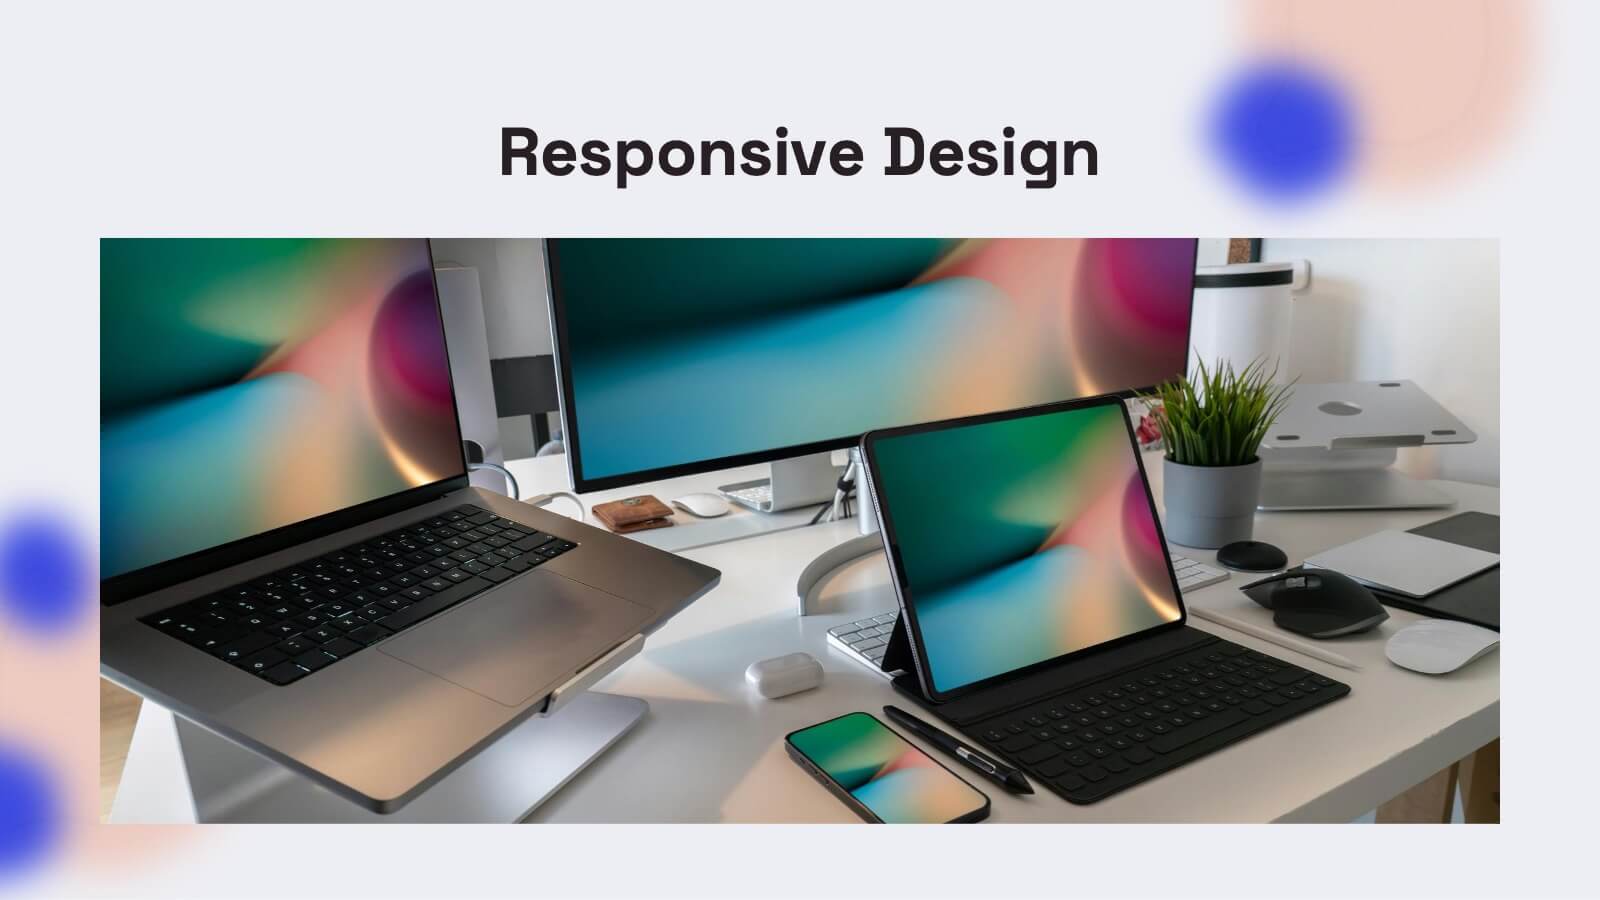
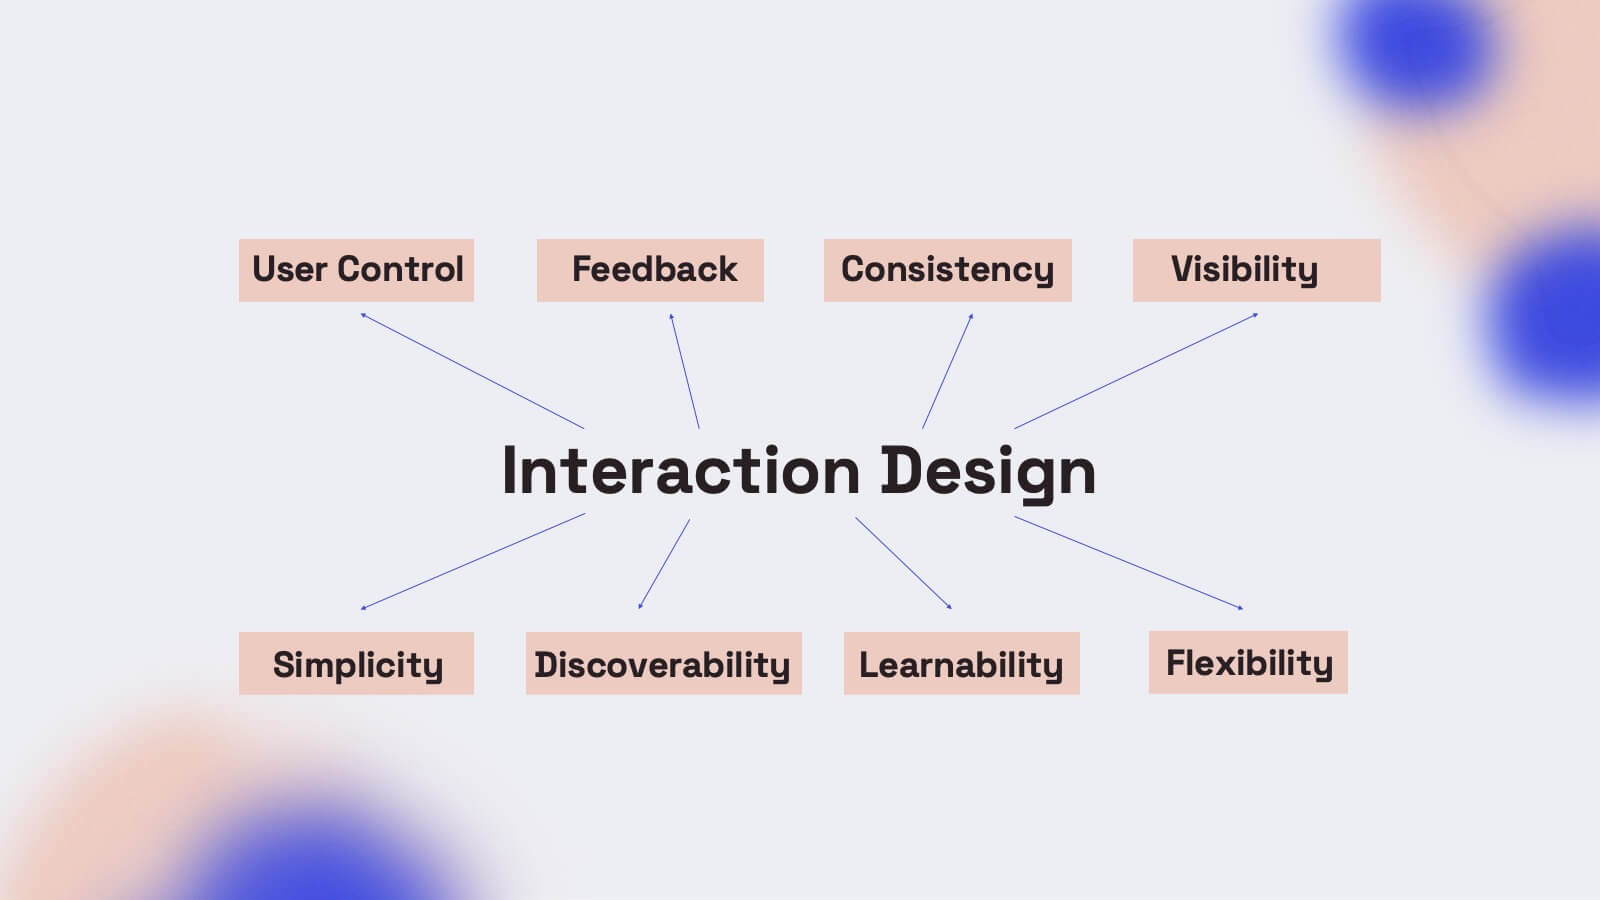
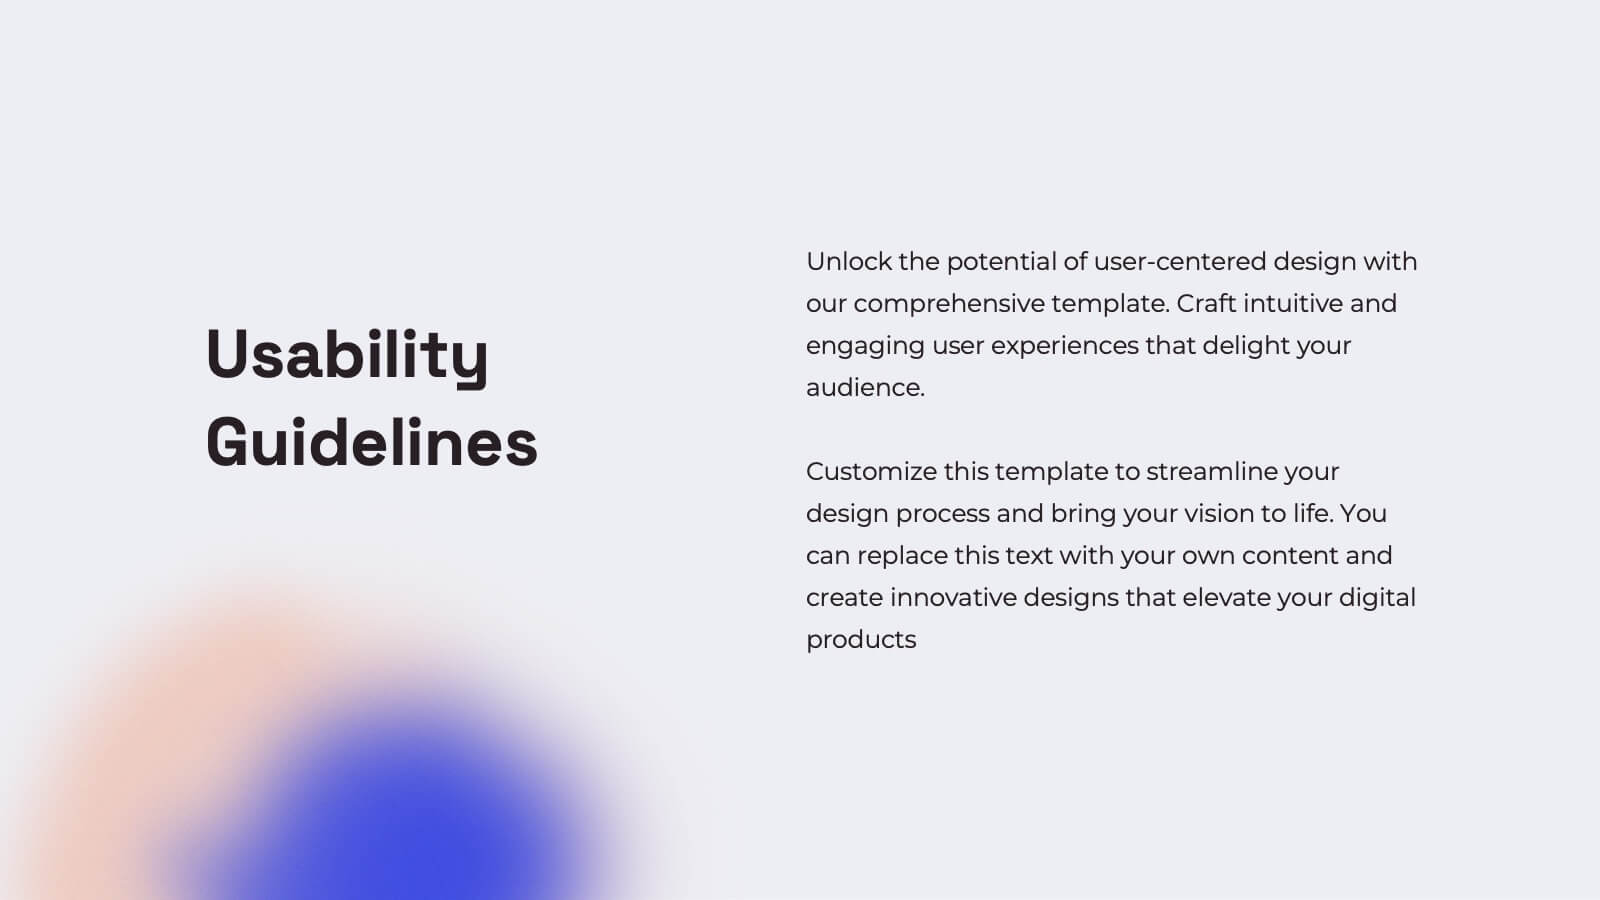
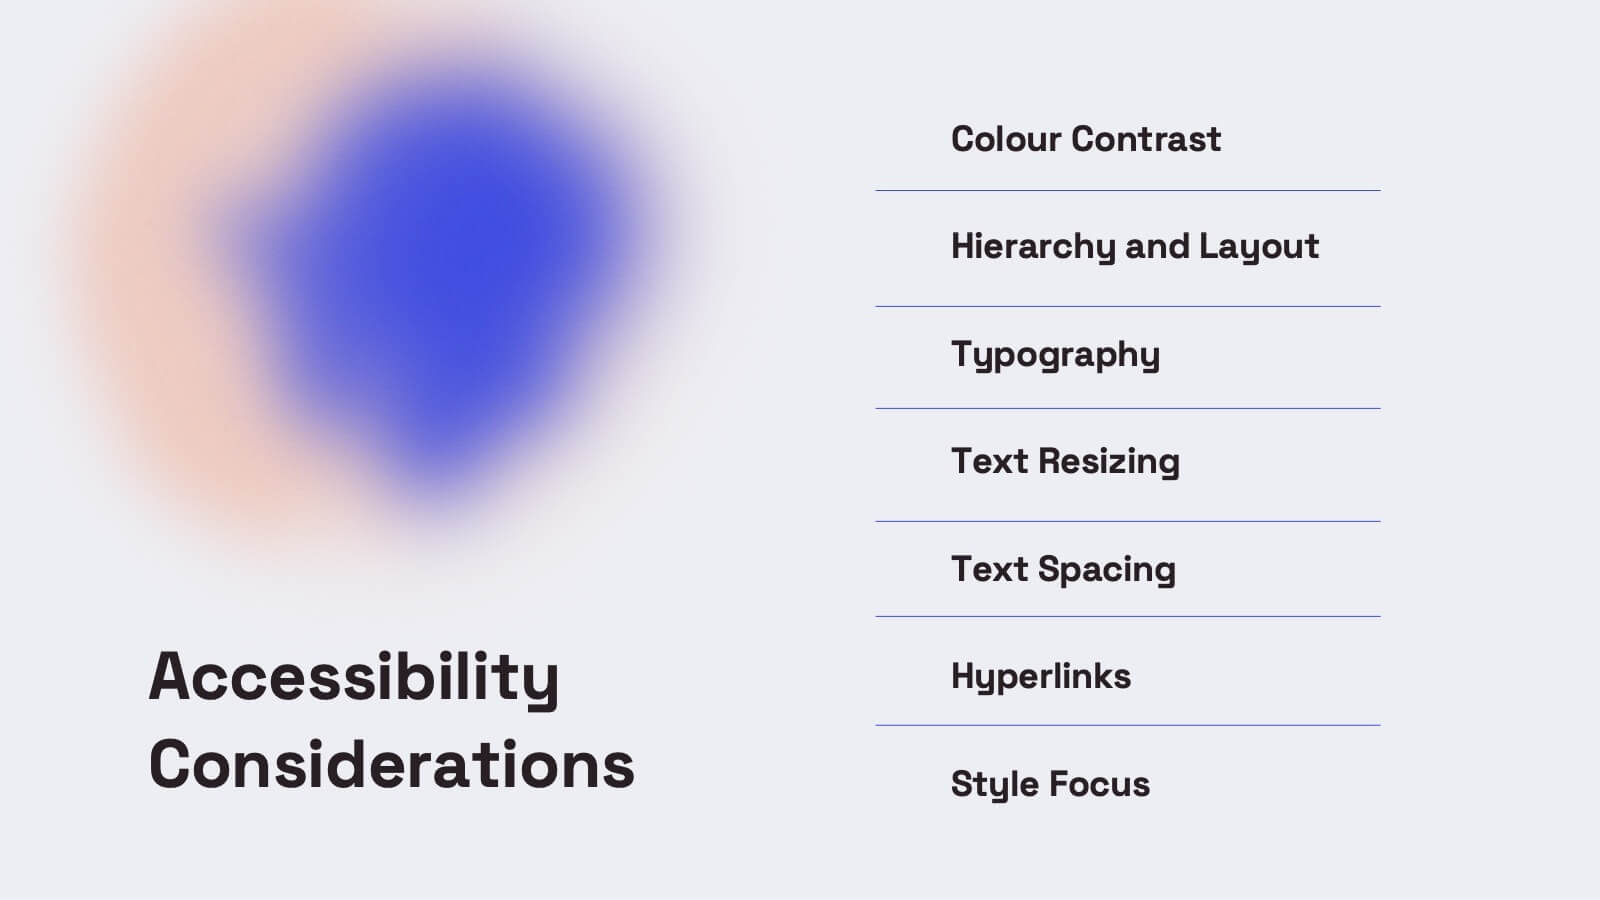
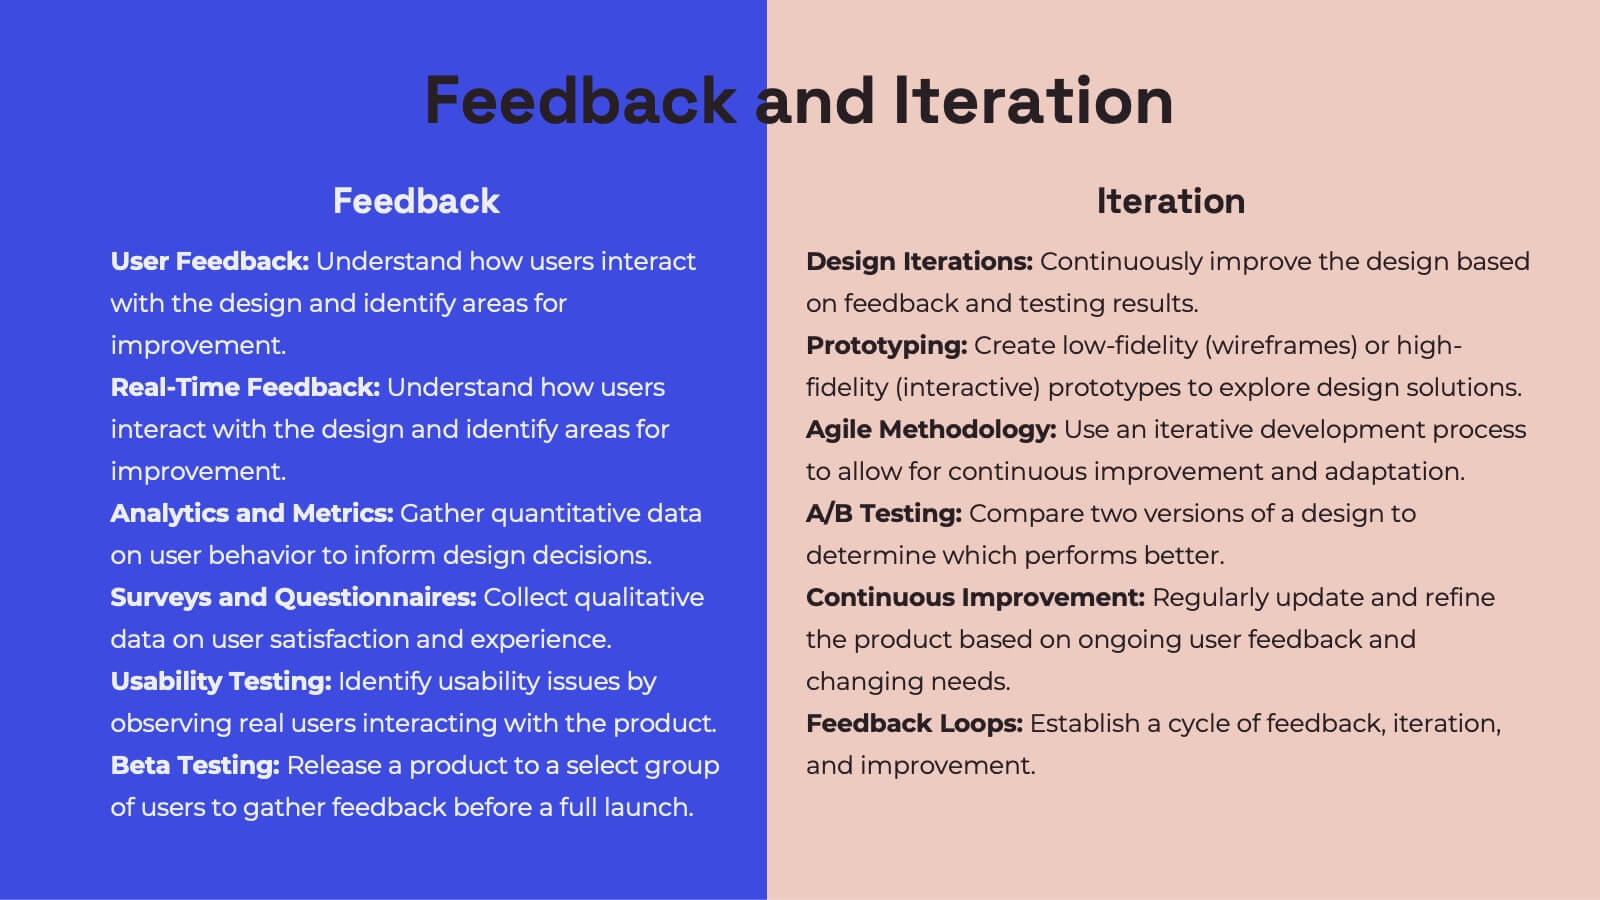
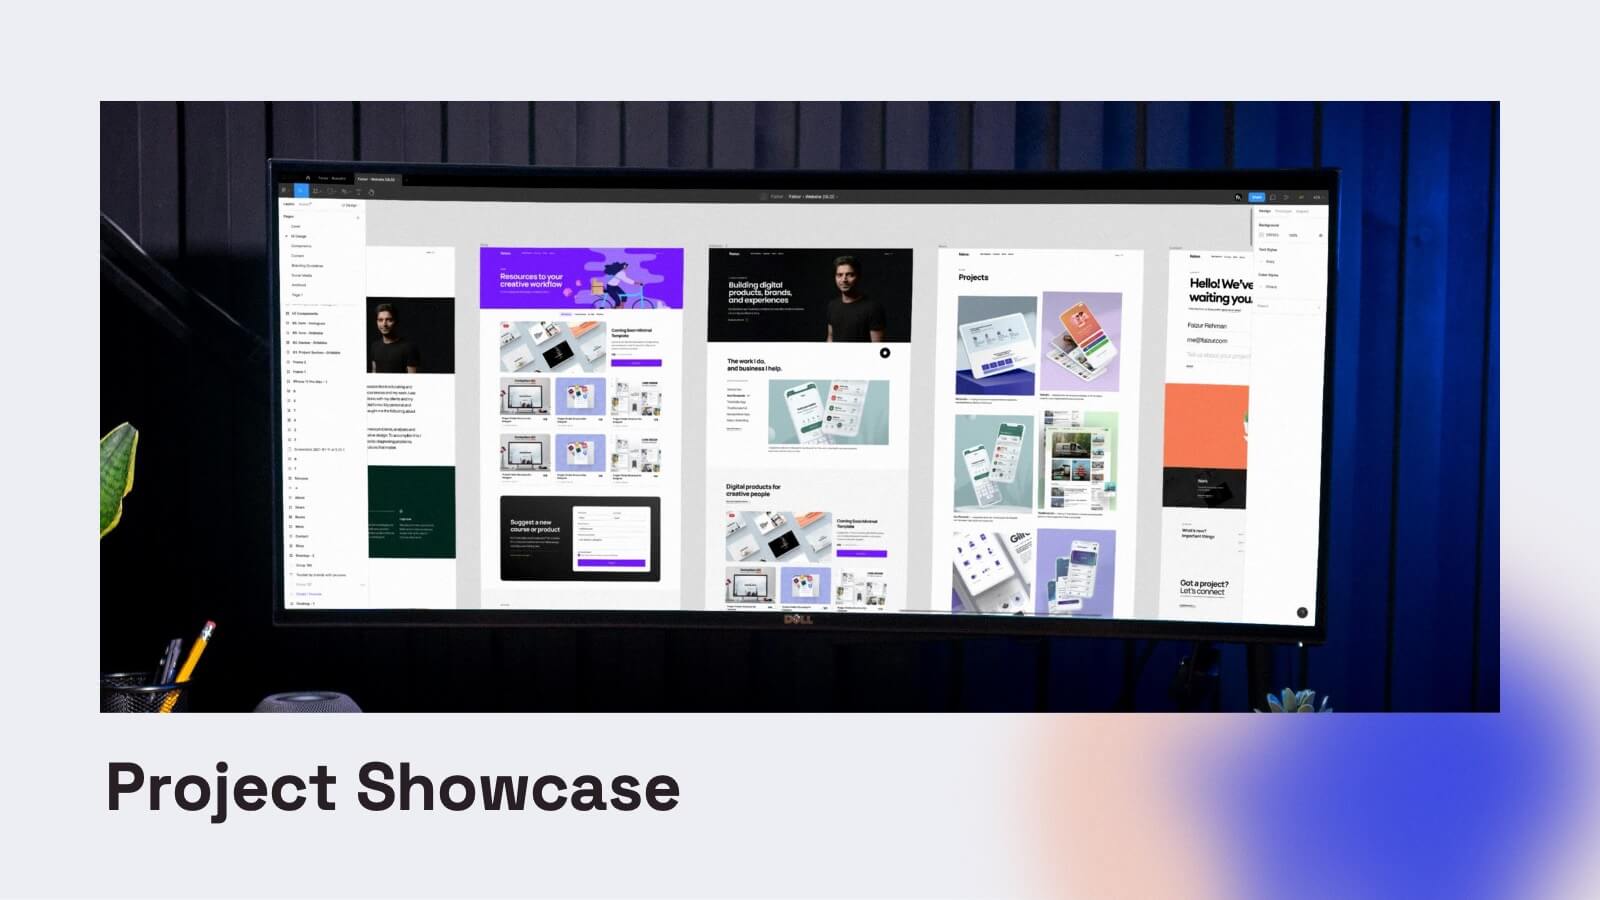
Gemini UX Design Presentation
Enhance your UX presentations with this vibrant and user-friendly template. Designed to cover every aspect of UX design, from user research and personas to wireframes and prototyping, this template ensures a comprehensive and engaging delivery. Its modern design and structured layout make your insights clear and impactful. Compatible with PowerPoint, Keynote, and Google Slides, it's perfect for any platform.


5 diapositivas
Human Body Anatomy Diagram Presentation
Bring your content to life with a clean, modern visual that makes learning feel surprisingly engaging. This presentation breaks down key body systems in a simple, approachable way, helping you explain functions, processes, or health concepts with clarity. Perfect for medical training, wellness education, or anatomy lessons. Fully compatible with PowerPoint, Keynote, and Google Slides.


8 diapositivas
Product Pricing Table Comparison Presentation
Showcase your product pricing options clearly with our 'Product Pricing Table Comparison' presentation template. This straightforward and efficient layout helps you display different price points and features across multiple packages, making it easy for your audience to compare and make informed choices. Ideal for sales presentations and marketing meetings, this template is compatible with PowerPoint, Keynote, and Google Slides.


3 diapositivas
Time Management Techniques and Tips Presentation
Start your day like a pro—with structure, focus, and tools that work. This presentation template is designed to help you showcase effective time management strategies, productivity tips, and calendar planning methods with clean, modern visuals. Fully compatible with PowerPoint, Keynote, and Google Slides for effortless customization and professional results.


6 diapositivas
Aviation Center Infographic
An aviation center refers to a facility or institution that is dedicated to activities related to aviation, which includes the design, development, manufacturing, maintenance, operation, and training associated with aircraft and aerospace technology. This engaging infographic template provides a concise and visually appealing overview of an aviation center's facilities, services, and offerings. This infographic plays a vital role in advancing the aviation industry, conducting research, offering training, and providing resources for aviation professionals and enthusiasts. This is the perfect template to encourage potential pilots and aviation enthusiasts.


7 diapositivas
Matrix Sales Infographic
Steer through the intricacies of sales data with our matrix sales infographic. Set upon a pristine white backdrop, the design pulses with the analytical depth of blue, the urgency of red, and the vibrancy of orange. With meticulously crafted infographics, relevant icons, and adaptable image placeholders, this template delivers a systematic representation of the sales matrix, from product positioning to market segmentation. Exquisitely designed for Powerpoint, Keynote, or Google Slides. A pivotal tool for sales managers, market analysts, strategists, or any business professional aiming to dissect sales data and drive decisions.


22 diapositivas
Starlit Agency Portfolio Presentation
The Starlit Agency Portfolio template is a sophisticated way to highlight your agency's expertise, achievements, and creative vision! Perfect for presenting to potential clients or partners, this template starts with a polished introduction and an "About Us" section that clearly defines your agency's mission and vision. Showcase your team's skills and services in an organized manner, making it easy for clients to understand what you offer. With slides dedicated to client success stories, case studies, and market analysis, you can build trust by displaying your proven track record. Highlight industry trends and your agency's approach to creative processes to demonstrate your strategic thinking. The template also includes sections for strategy development, campaign execution, and measurement analytics, ensuring you cover all aspects of your services. Close with client testimonials, partnership opportunities, and a future outlook, leaving your audience impressed. This template is fully compatible with PowerPoint, Keynote, and Google Slides, making it versatile and easy to use for any presentation.


5 diapositivas
5 Whys Analysis Slide Presentation
Unlock problem-solving clarity with a vibrant, puzzle-style layout that helps teams dig deeper and uncover the true reason behind any challenge. This presentation guides viewers through each “why” step in a simple, structured flow, making root-cause insights easy to communicate. Fully compatible with PowerPoint, Keynote, and Google Slides.


6 diapositivas
Circle Schedule Infographic
A circle schedule, also known as a radial schedule, is a visual representation of time management that organizes tasks or activities in a circular format. This visually engaging infographic allows you to create a dynamic and intuitive schedule using a circular design. The template offers a creative way to showcase time-based information, such as daily routines, event schedules, project timelines, or weekly agendas. This can be used in various contexts where schedules or timelines need to be visually presented. Fully customizable and compatible with Powerpoint, Keynote, and Google Slides.


7 diapositivas
Matrix Diagram Infographic Presentation Template
A matrix diagram, also known as a matrix chart or matrix plot, is a type of chart that is used to compare and contrast different elements or variables. It is typically represented as a grid or table with rows and columns. This template will help show you how different things are related to each other. Use this template to compare and contrast things like products or tasks. It includes grids and tables that you can fill in with your own information. Add your own pictures and colors to make it look more appealing. This template is perfect for your school projects or work presentations.