


Características


¿Tienes alguna pregunta?
Recomendar


7 diapositivas
Bowtie Risk Management Diagram Presentation
Visualize cause and consequence with a clean, symmetrical flow that simplifies complex risk scenarios. This presentation helps you illustrate threats, controls, and outcomes in one cohesive framework, making decision-making clear and impactful. Fully customizable and compatible with PowerPoint, Keynote, and Google Slides for professional risk analysis presentations.


7 diapositivas
PESTEL Analysis Marketing Infographic
PESTEL Analysis, often referred to as PESTLE Analysis, is a strategic management tool used to analyze and evaluate external macro-environmental factors that can impact an organization. This infographic template is a comprehensive and visually captivating template that unravels the strategic insights derived from the PESTEL analysis in the realm of marketing. Explore the critical external factors that influence your marketing strategy and steer your business towards success. Compatible with Powerpoint, Keynote, and Google Slides. Empower your marketing strategies with our PESTEL Analysis Marketing Infographic!


5 diapositivas
Growth and Expansion Scale Model Presentation
Visualize your business growth with the Growth and Expansion Scale Model presentation. This template is designed to illustrate strategic progress, scaling efforts, and key milestones in business development. Ideal for executives, entrepreneurs, and business strategists, it offers customizable elements to align with your objectives. Fully compatible with PowerPoint, Keynote, and Google Slides.


7 diapositivas
Responsibility Assignment Matrix Diagram Presentation
A Responsibility Assignment Matrix is a tool used to define and communicate project roles and responsibilities. This template can be used as a valuable tool for any project team. By representing the various assignments and roles, the (RAM) helps to ensure that projects are completed on time, within budget, and to the expected quality standards. Use the tips provided to create a clear and effective matrix for your next project. This template includes helpful illustrations and allows you to add tips and additional details related with the roles and responsibilities in context with the task.


34 diapositivas
Unicorn Startup
A Pitch Deck is a visual presentation typically used by startups or entrepreneurs to convey their business idea, product, or service to potential investors, partners, or other stakeholders. This template slide deck is designed to provide a compelling overview of the key elements of a business, and is designed to captivate your audience's attention and generate interest in your venture. This template is designed with a trendy and modern pink color palette, perfect for businesses with a feminine or youthful brand identity. It features a variety of customizable slides that can be tailored to showcase your startup's key information and unique value proposition.


4 diapositivas
Virtual Collaboration and WFH Tools Presentation
Supercharge your workflow with a clean visual that brings your digital workspace to life! This presentation template focuses on streamlining communication and productivity through key virtual collaboration tools and remote work essentials. It’s perfect for outlining platforms, strategies, or tools that boost efficiency. Fully compatible with PowerPoint, Keynote, and Google Slides.


5 diapositivas
Freight and Shipping Optimization Presentation
Streamline your logistics narrative with this world map–inspired layout designed for international freight strategies. This infographic-style slide features four customizable location markers with icons and descriptive text, perfect for mapping routes, warehouses, or shipping hubs. Ideal for global supply chain teams, logistics consultants, and shipping analysts. Fully editable in PowerPoint, Keynote, and Google Slides.


6 diapositivas
Harvey Ball Comparison Chart Presentation
Turn data into insight with this clean and colorful presentation design. Ideal for visualizing comparisons, progress levels, or product evaluations, it makes complex information easy to read and interpret. Fully editable and compatible with PowerPoint, Keynote, and Google Slides, this layout ensures clarity and impact in every presentation.


12 diapositivas
Creative Alphabet Infographic
Add a bold twist to your data with this Creative Alphabet Infographic slide, featuring a stylized letter “B” puzzle layout. Ideal for branding breakdowns, step-by-step processes, or topic segmentation, each puzzle piece aligns with a customizable title and description. Fully editable in PowerPoint, Keynote, and Google Slides.


7 diapositivas
Agile Methodology Infographic Presentation Template
Agile methodology is a project management approach that emphasizes flexibility, collaboration, and customer satisfaction. It is often used in software development and IT projects, but can also be applied to other fields. This template is perfect for showing how to get things done quickly and efficiently. This template includes many different cool diagrams and charts that you can customize to show how Agile Methodology works. This Agile methodology template will break down your project into smaller chunks and deliver them in stages, allowing for adjustments and improvement along the way.


7 diapositivas
Bowtie Chart for Threat Mitigation Presentation
Visualize and mitigate threats with precision using the Bowtie Chart for Threat Mitigation Presentation. This structured layout highlights risks, controls, and consequences in a mirrored bowtie format—perfect for safety planning, compliance, and risk assessment. Fully customizable in Canva, PowerPoint, Google Slides, and Keynote for seamless integration into your workflow.


6 diapositivas
Financial Credit Card Analysis Presentation
The Financial Credit Card Analysis presentation template offers a comprehensive visual tool for comparing different aspects of credit card features. Designed for clarity and impact, this template showcases key data points like interest rates, reward programs, fees, and user benefits across multiple cards in a color-coded format. Each segment is clearly labeled for easy understanding, making it an excellent choice for financial analysts, advisors, or anyone presenting credit card options to clients or within financial education workshops. The modular design allows for customizable sections to adapt to specific needs or to highlight particular cards or features effectively.


23 diapositivas
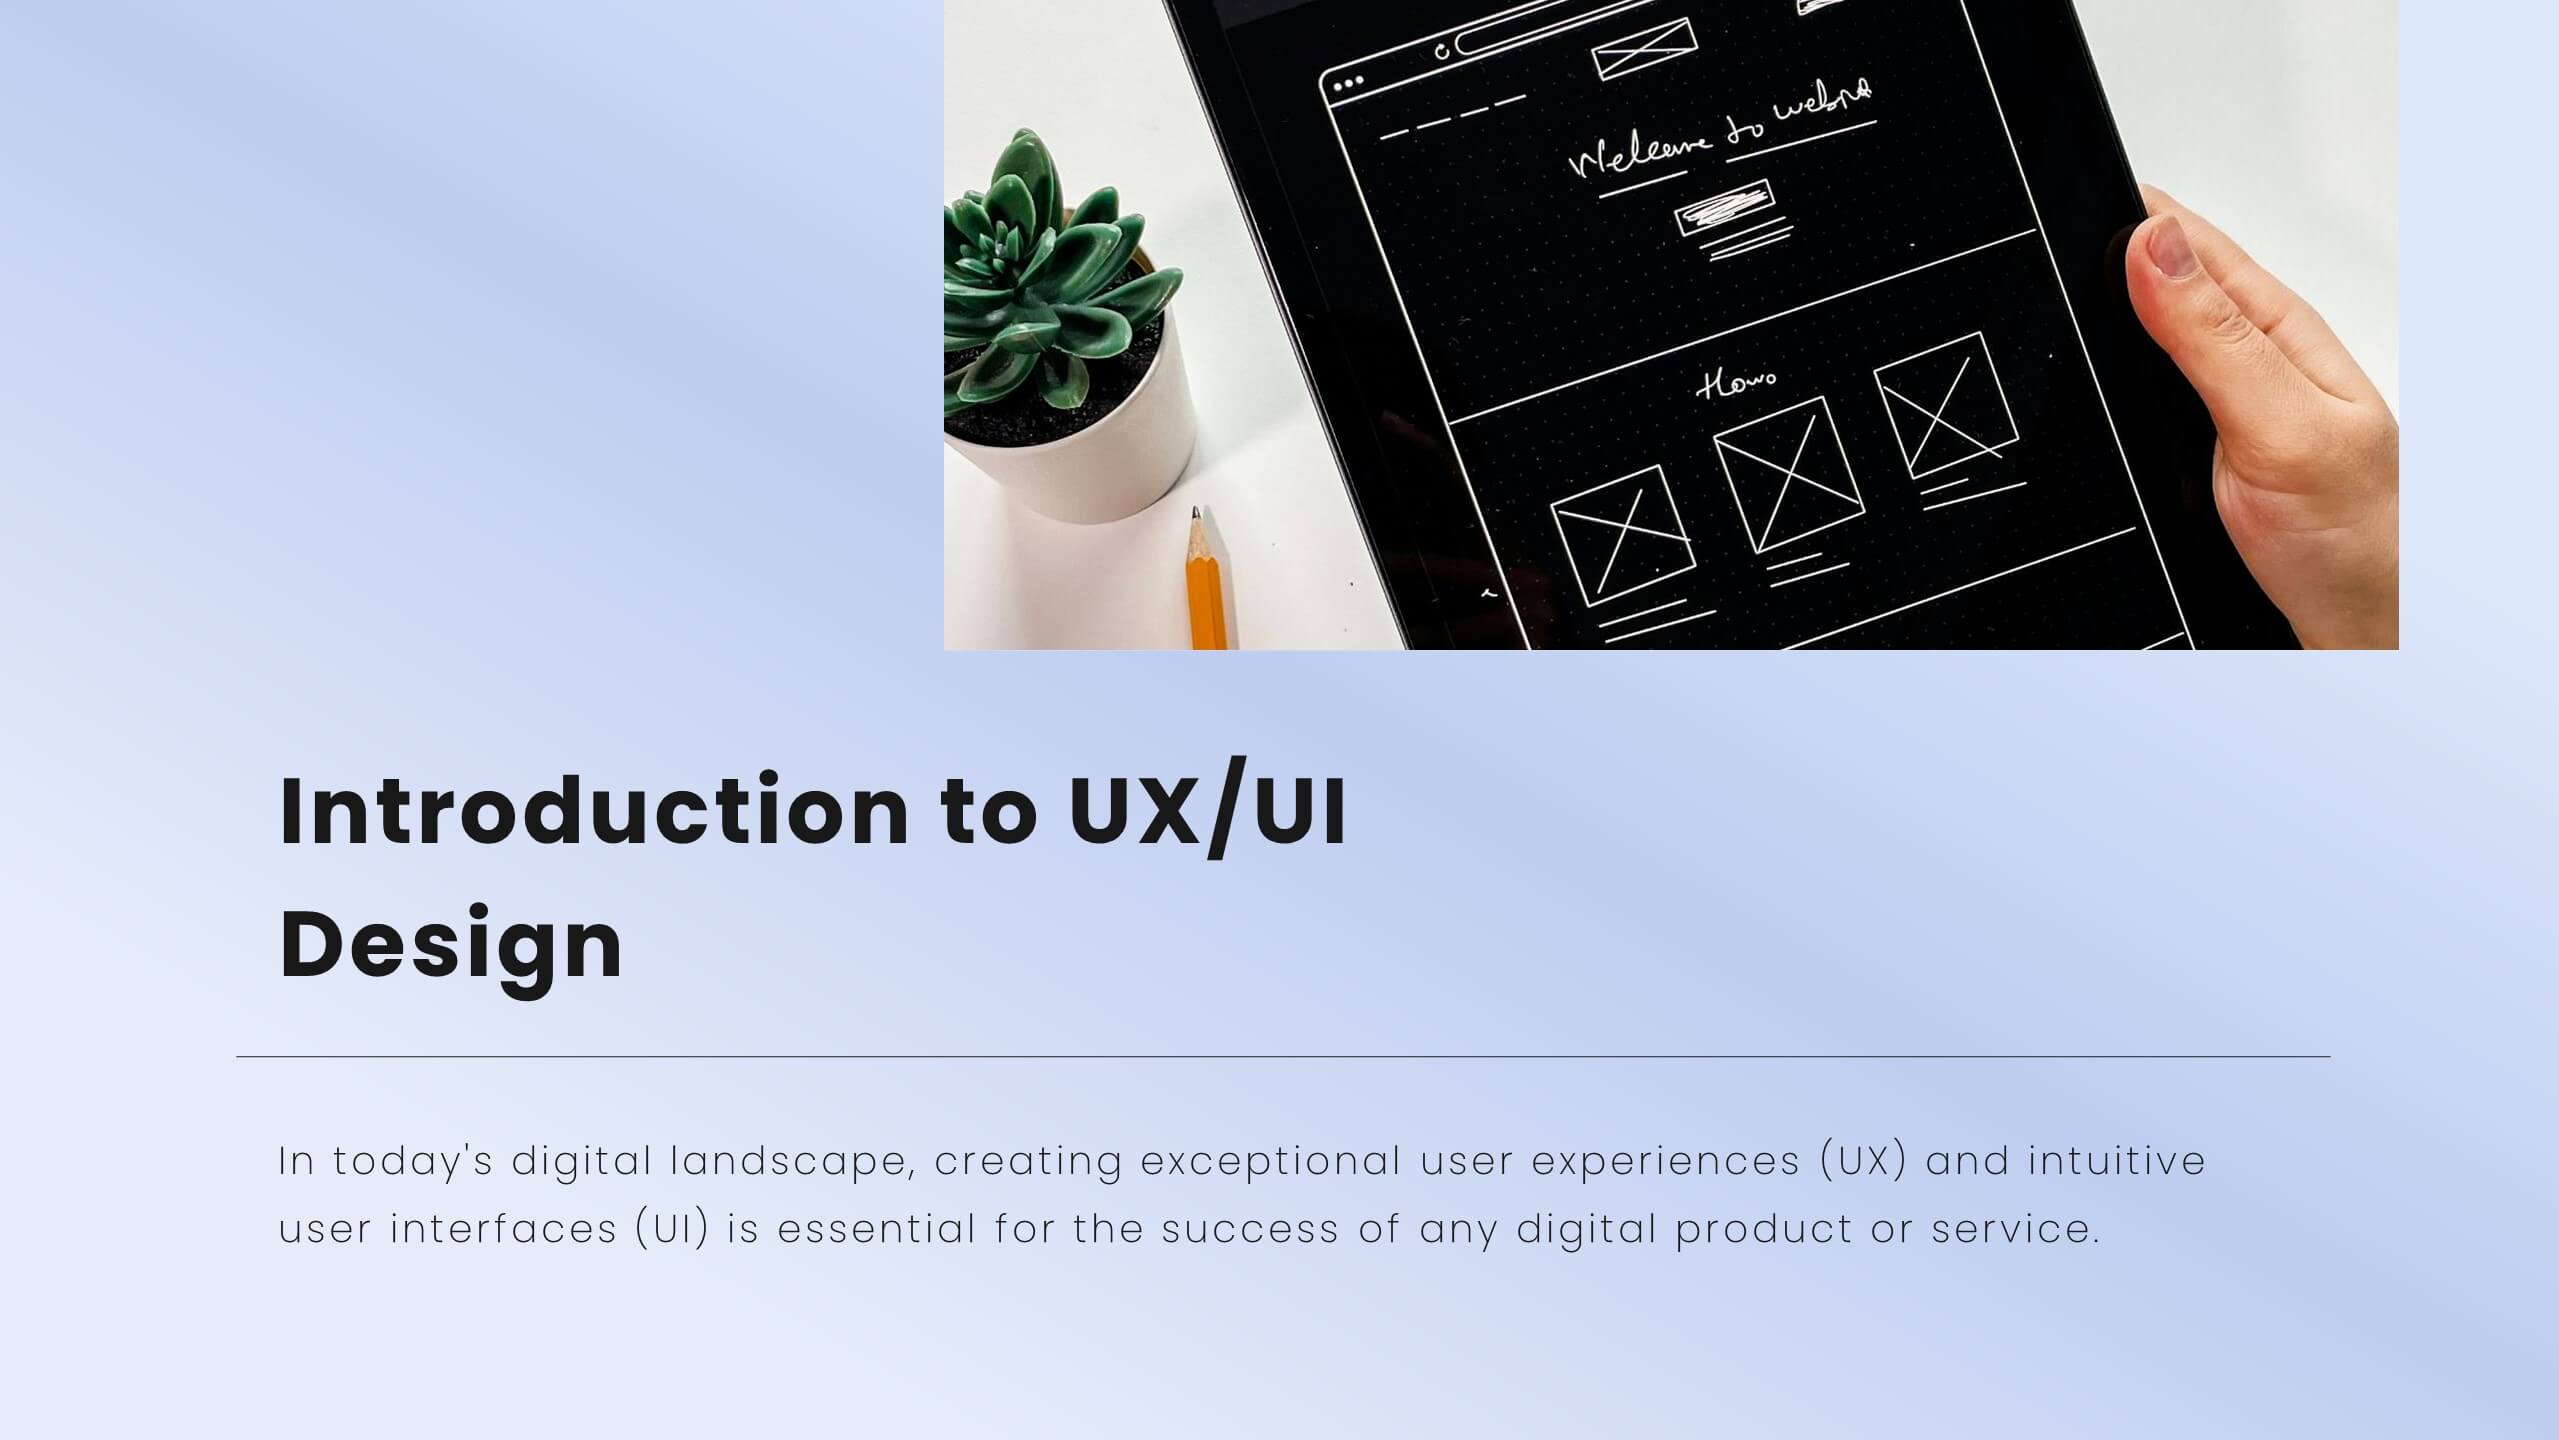
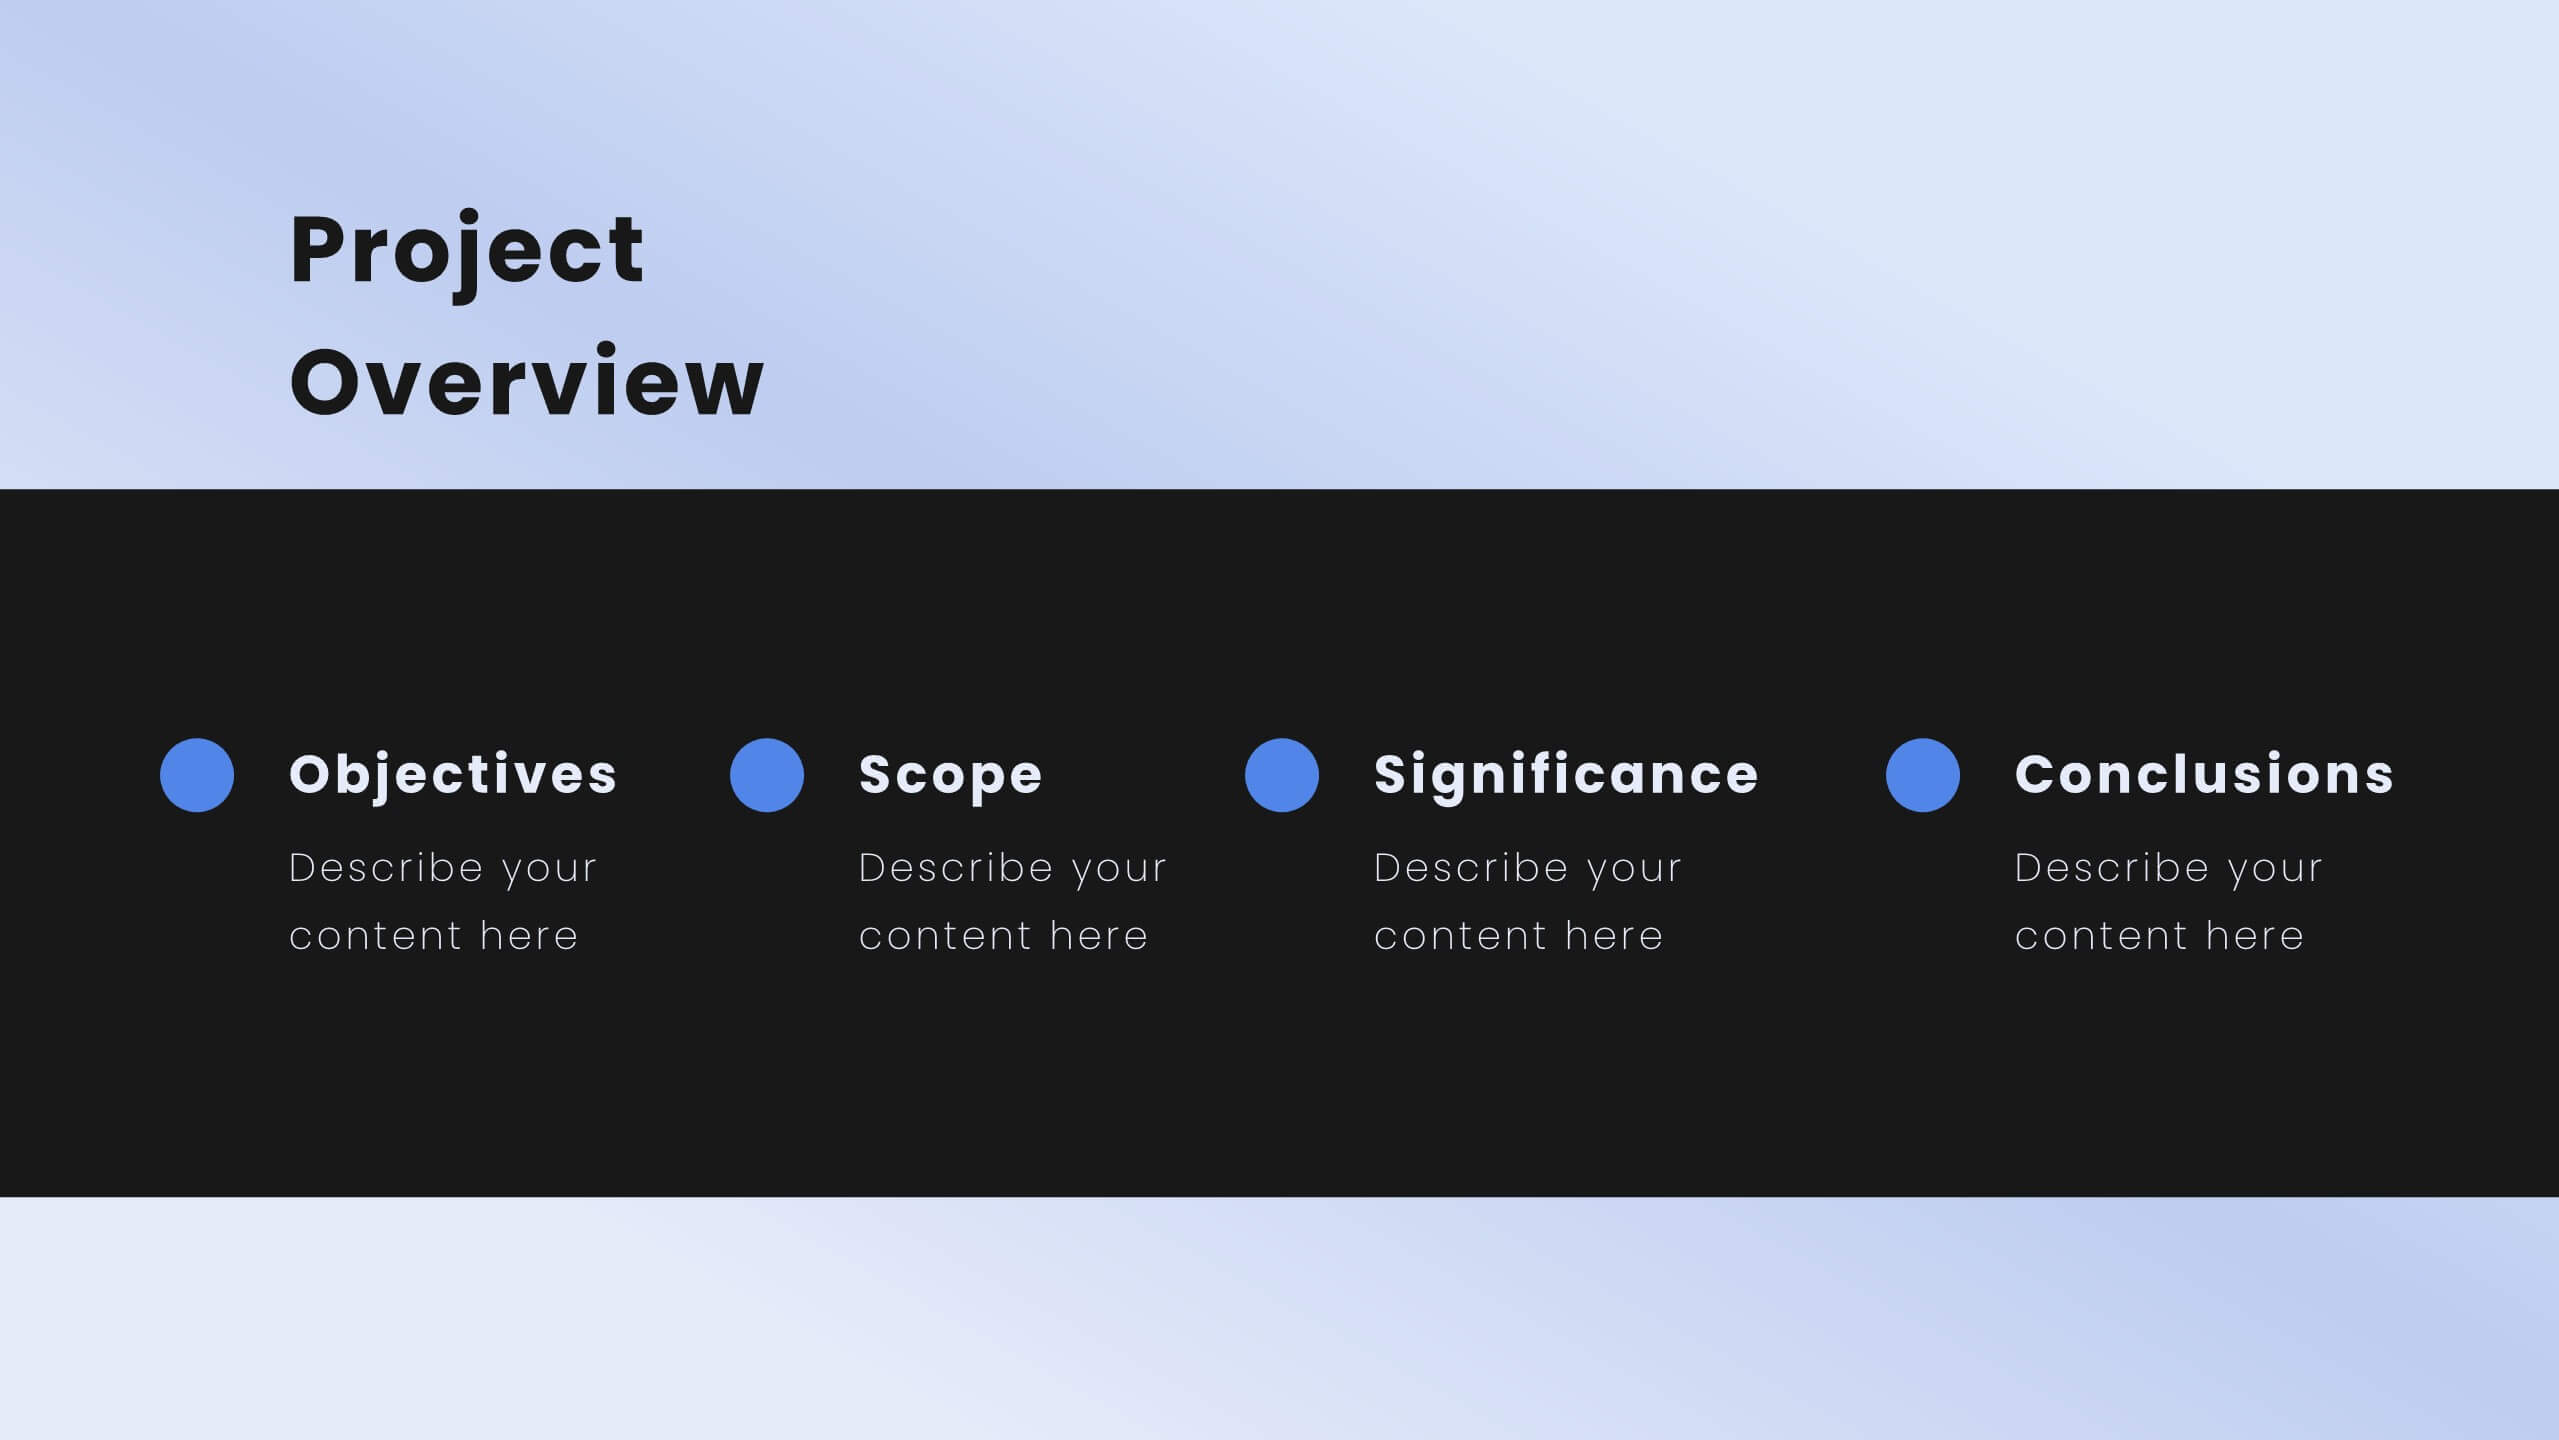
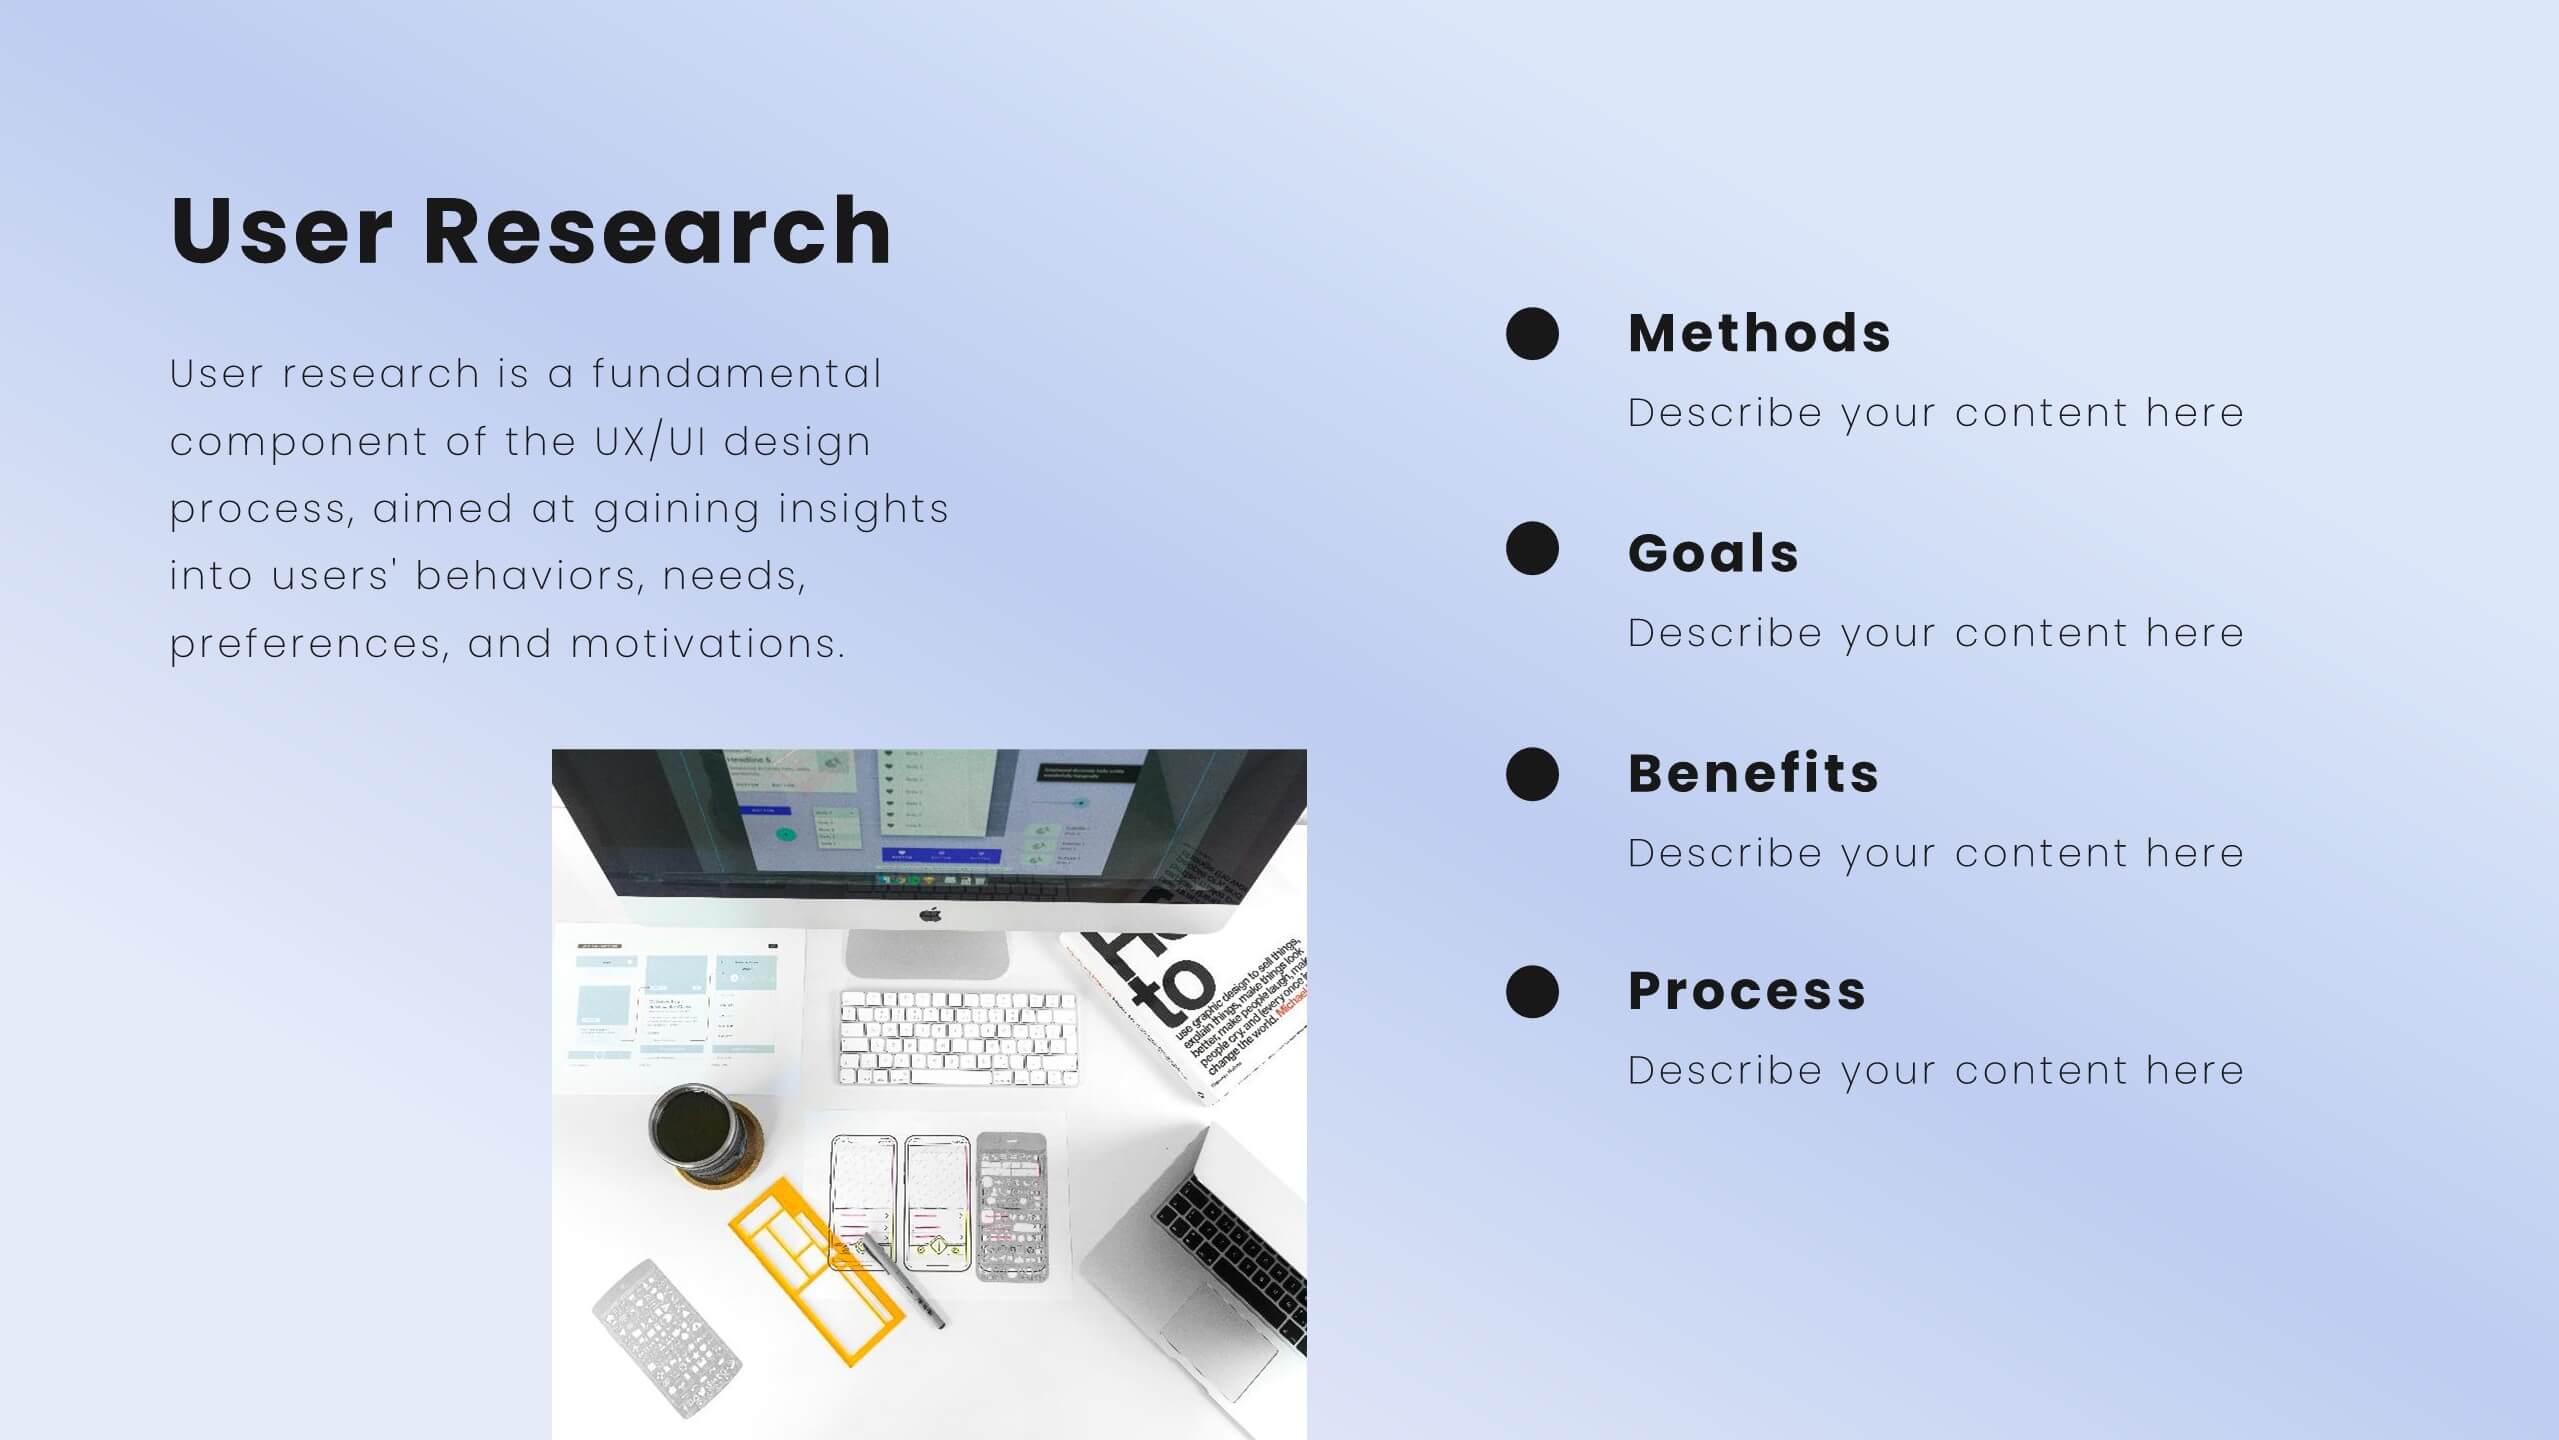
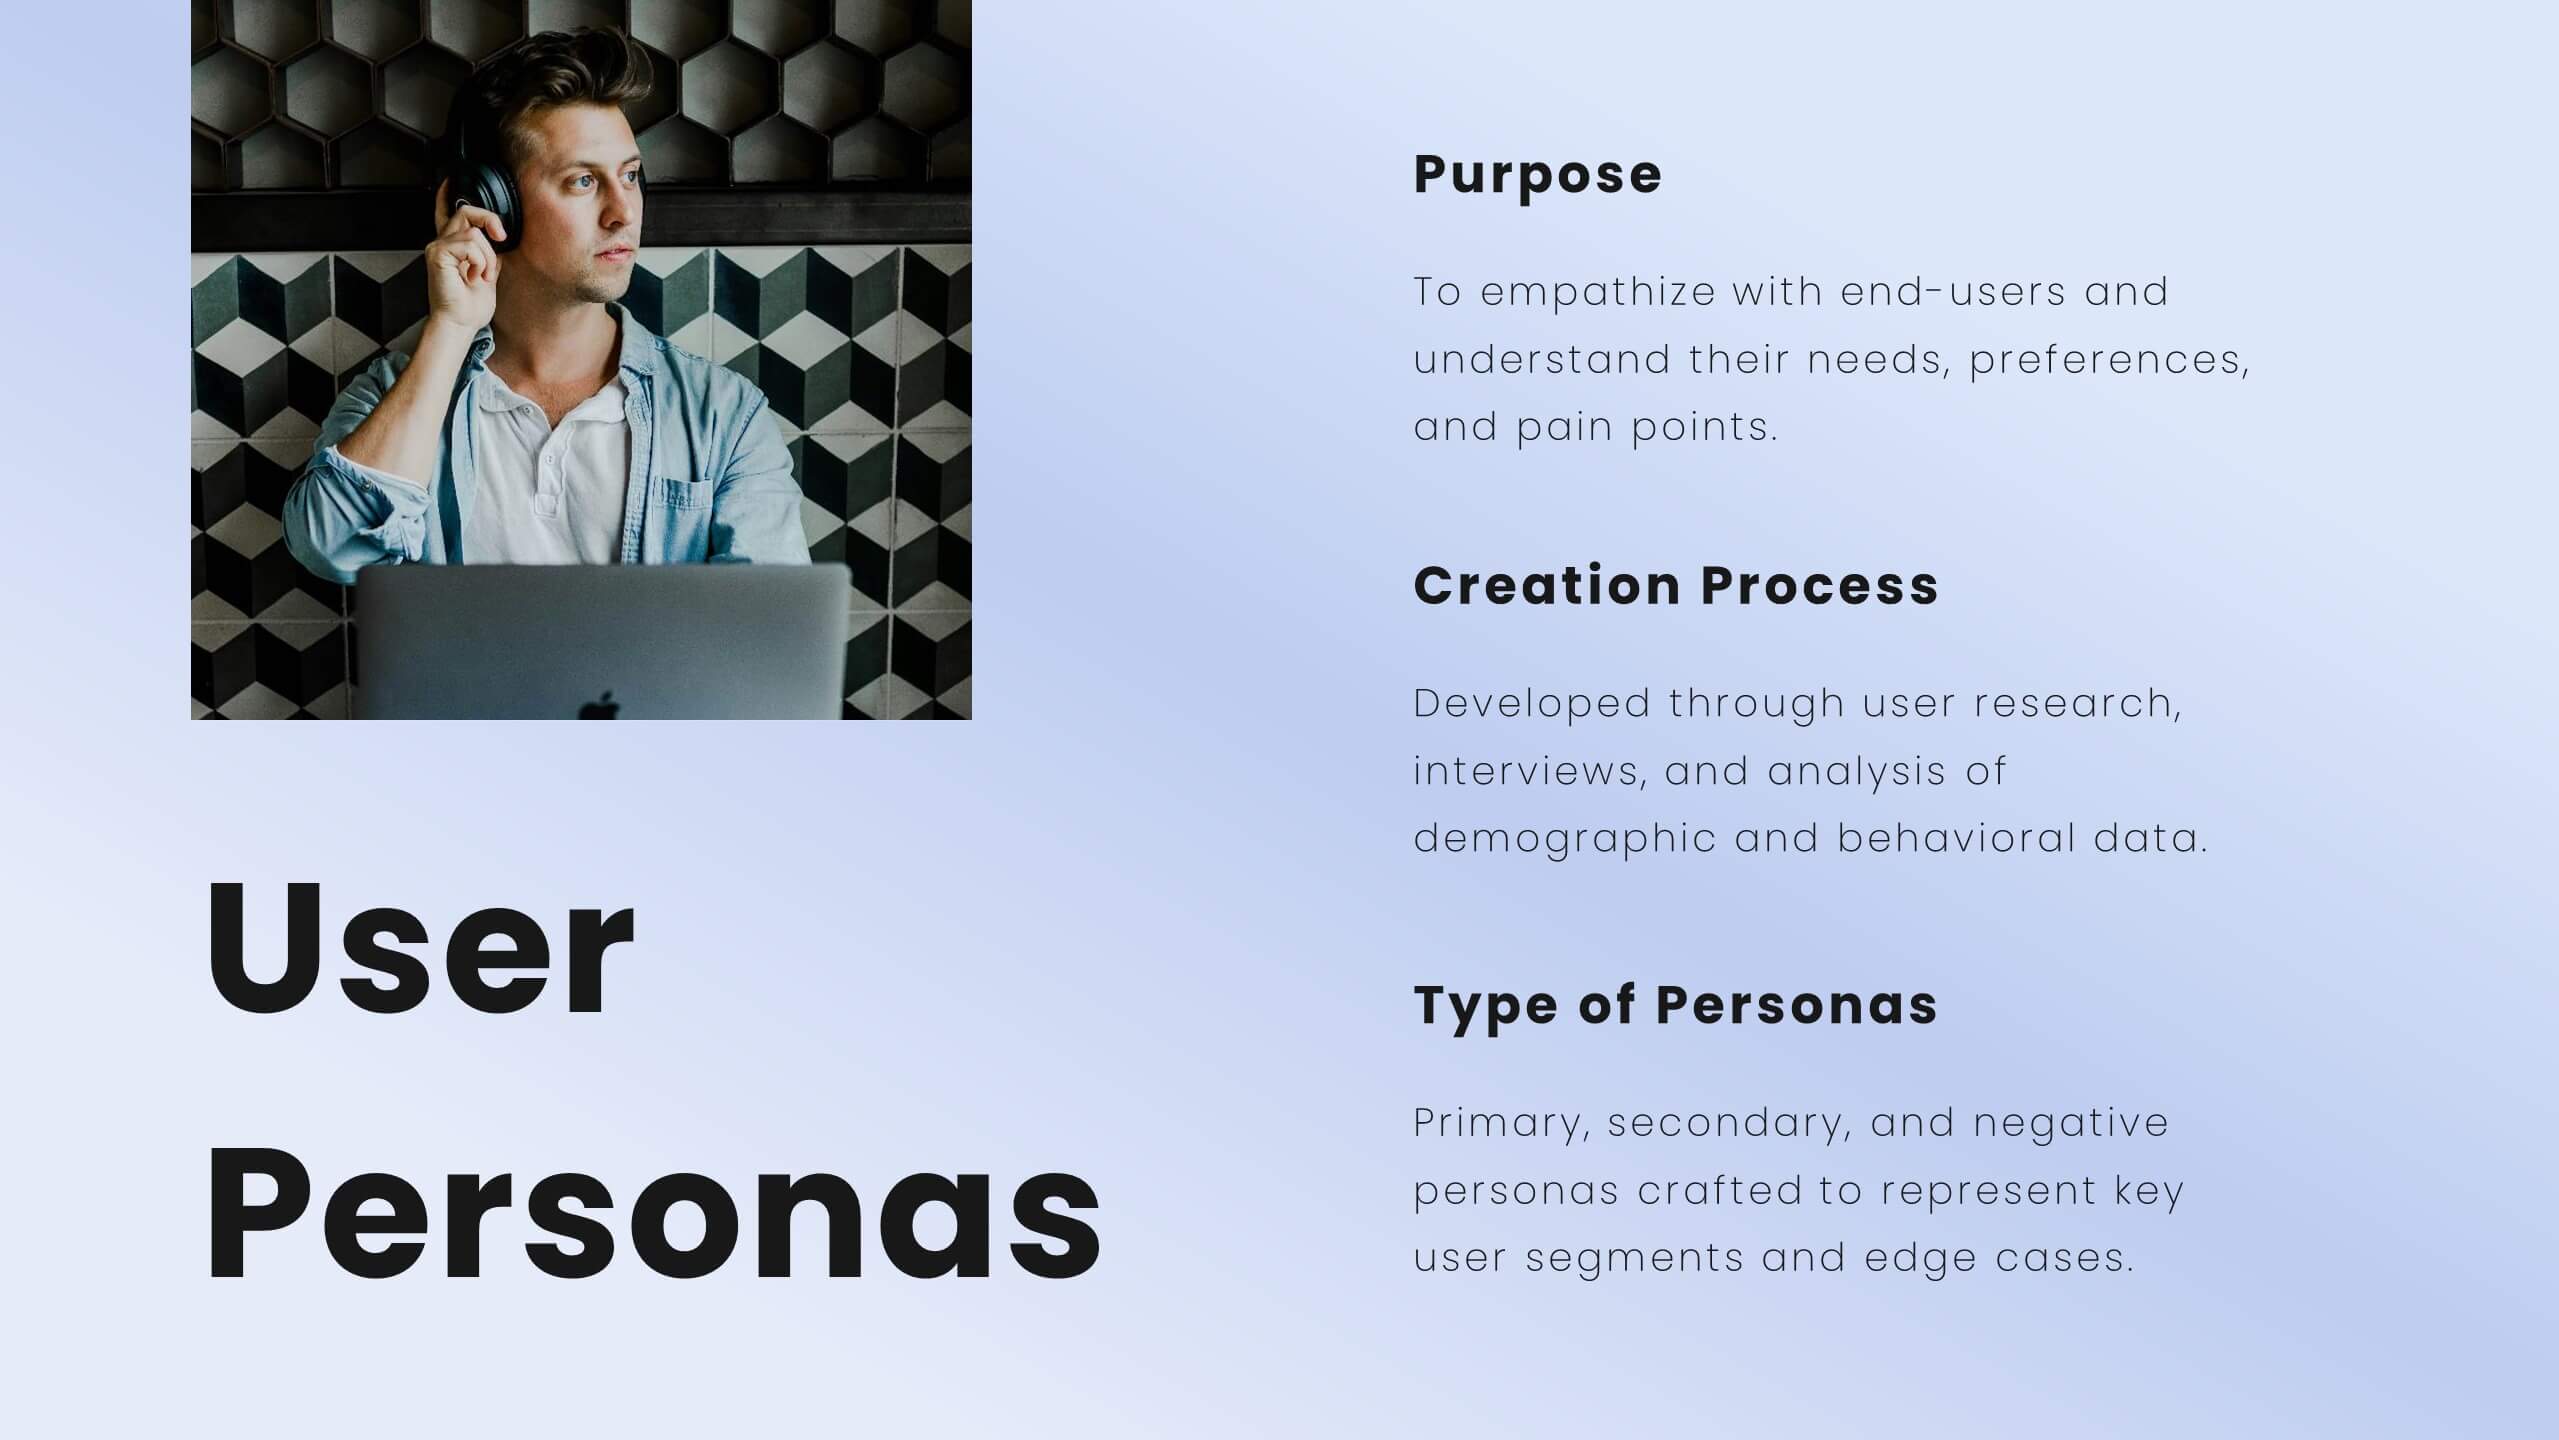
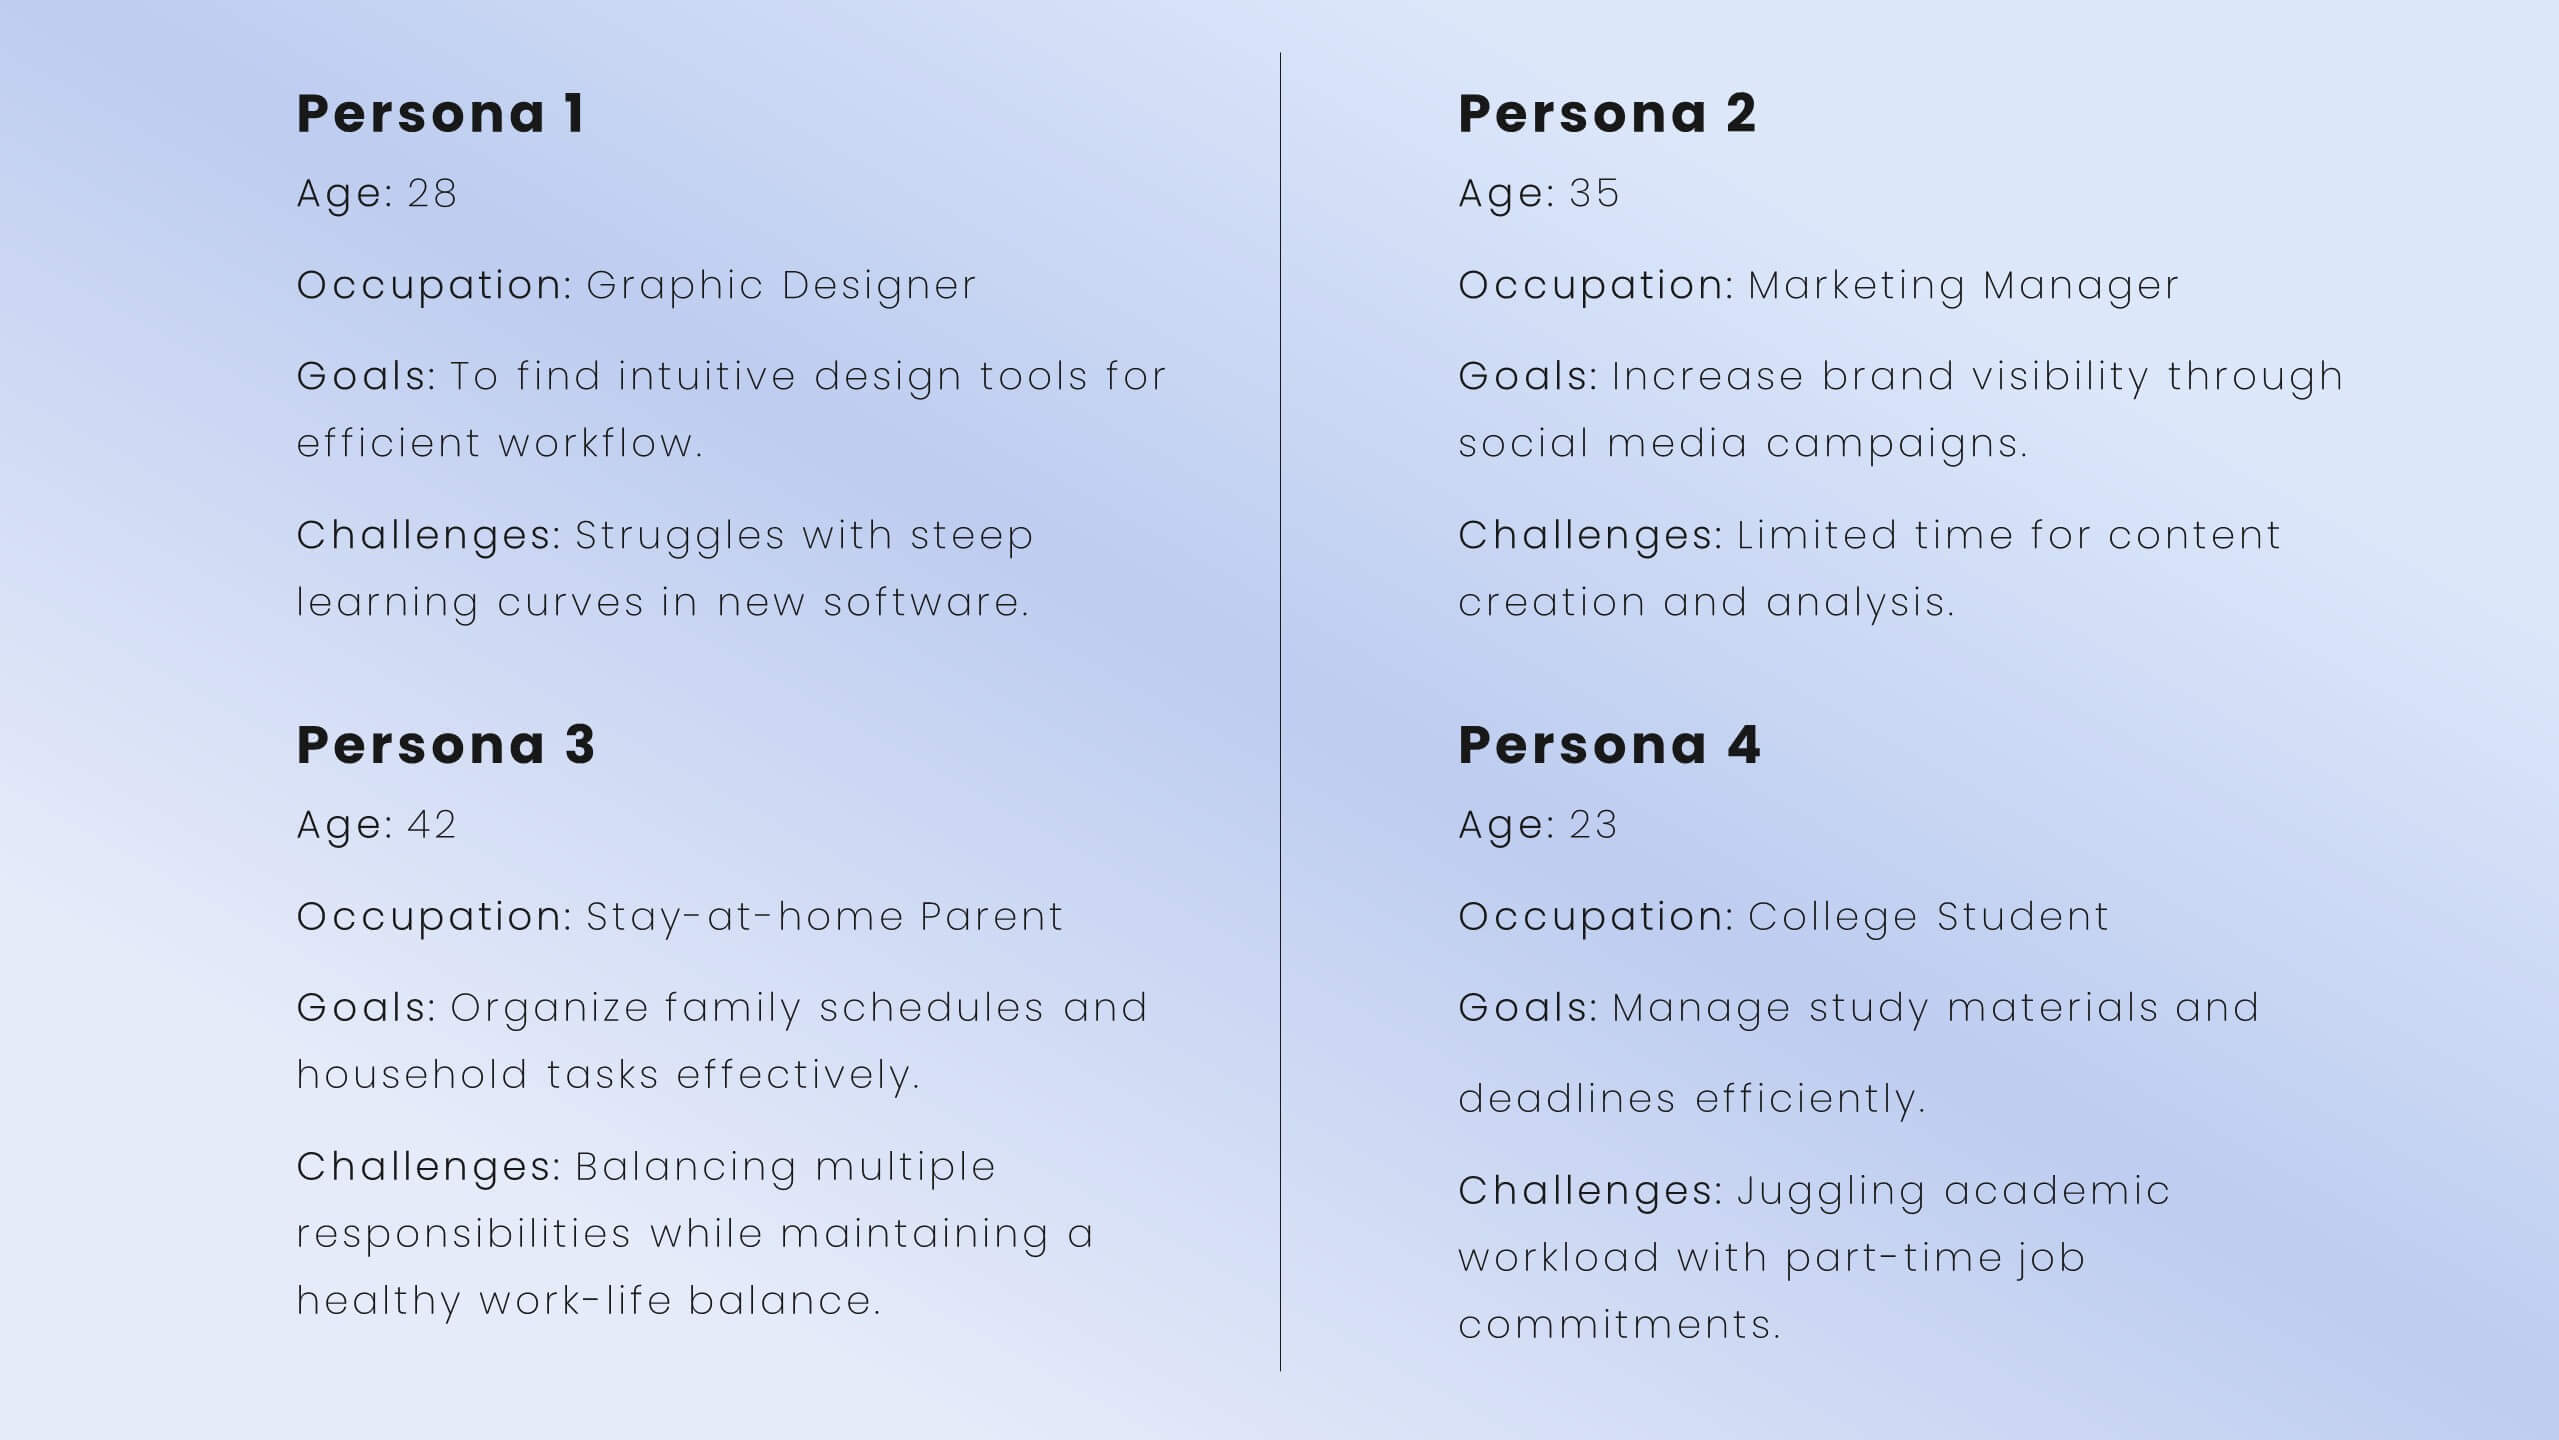
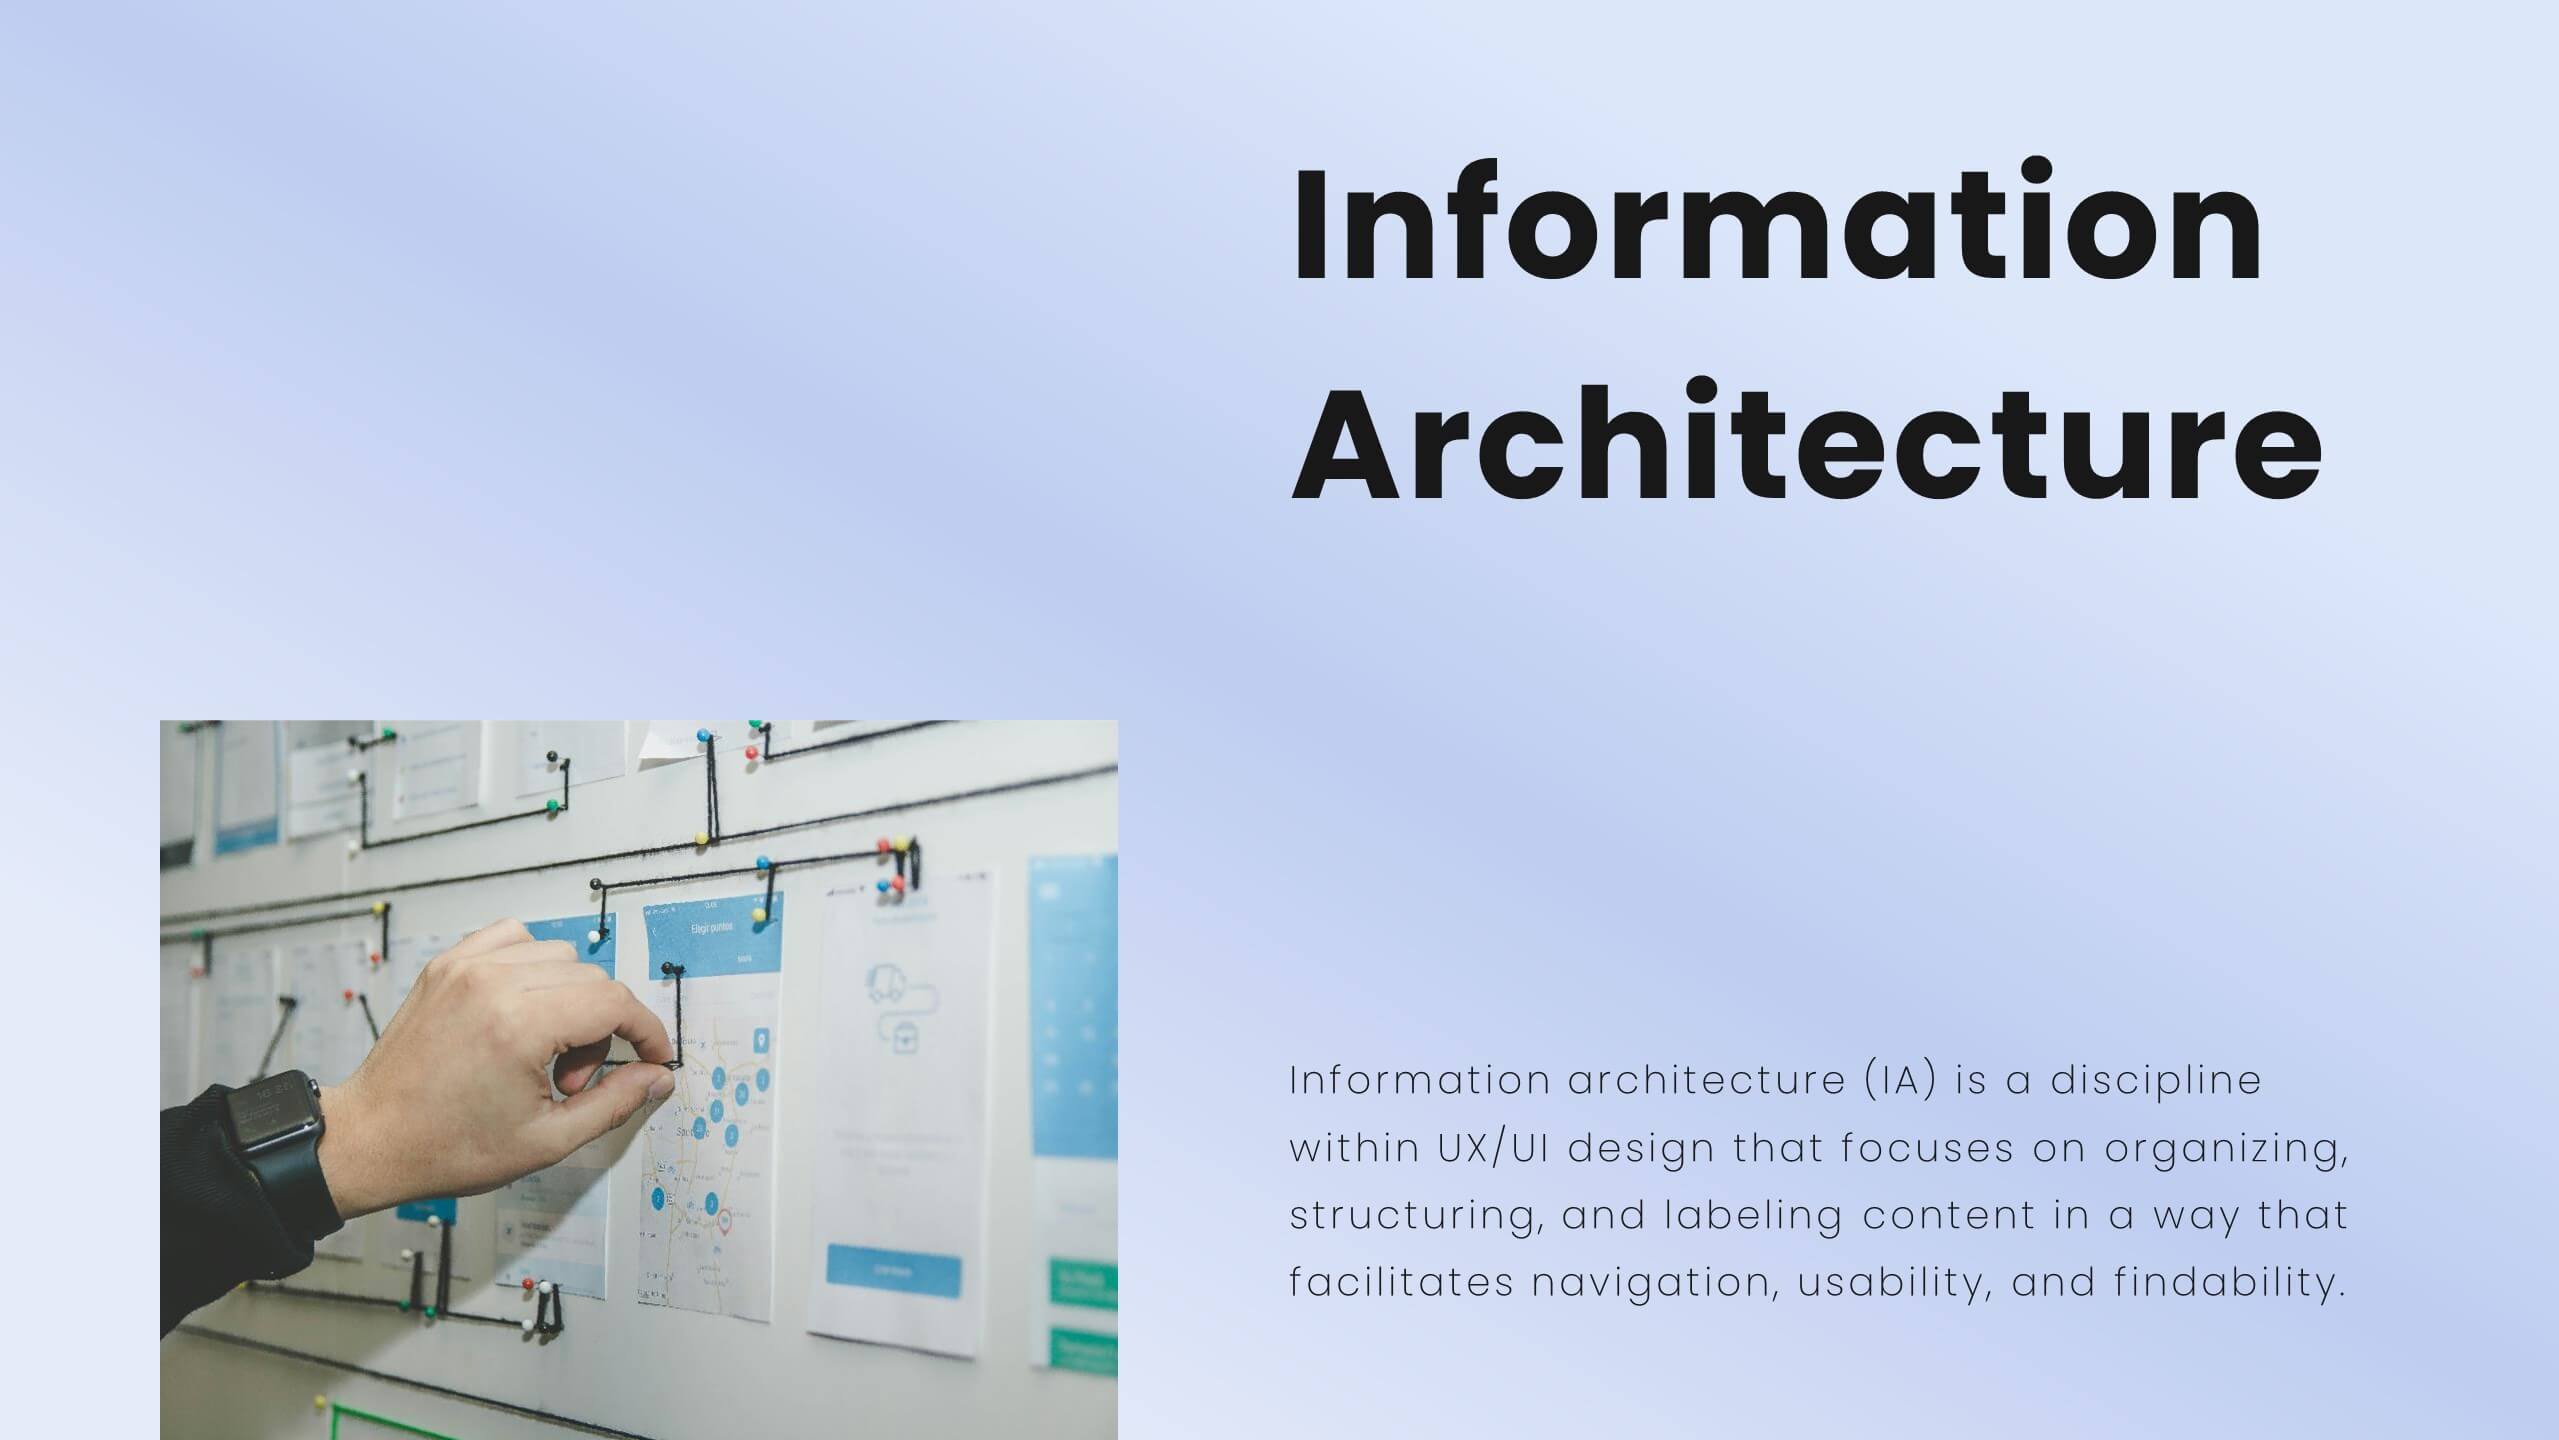
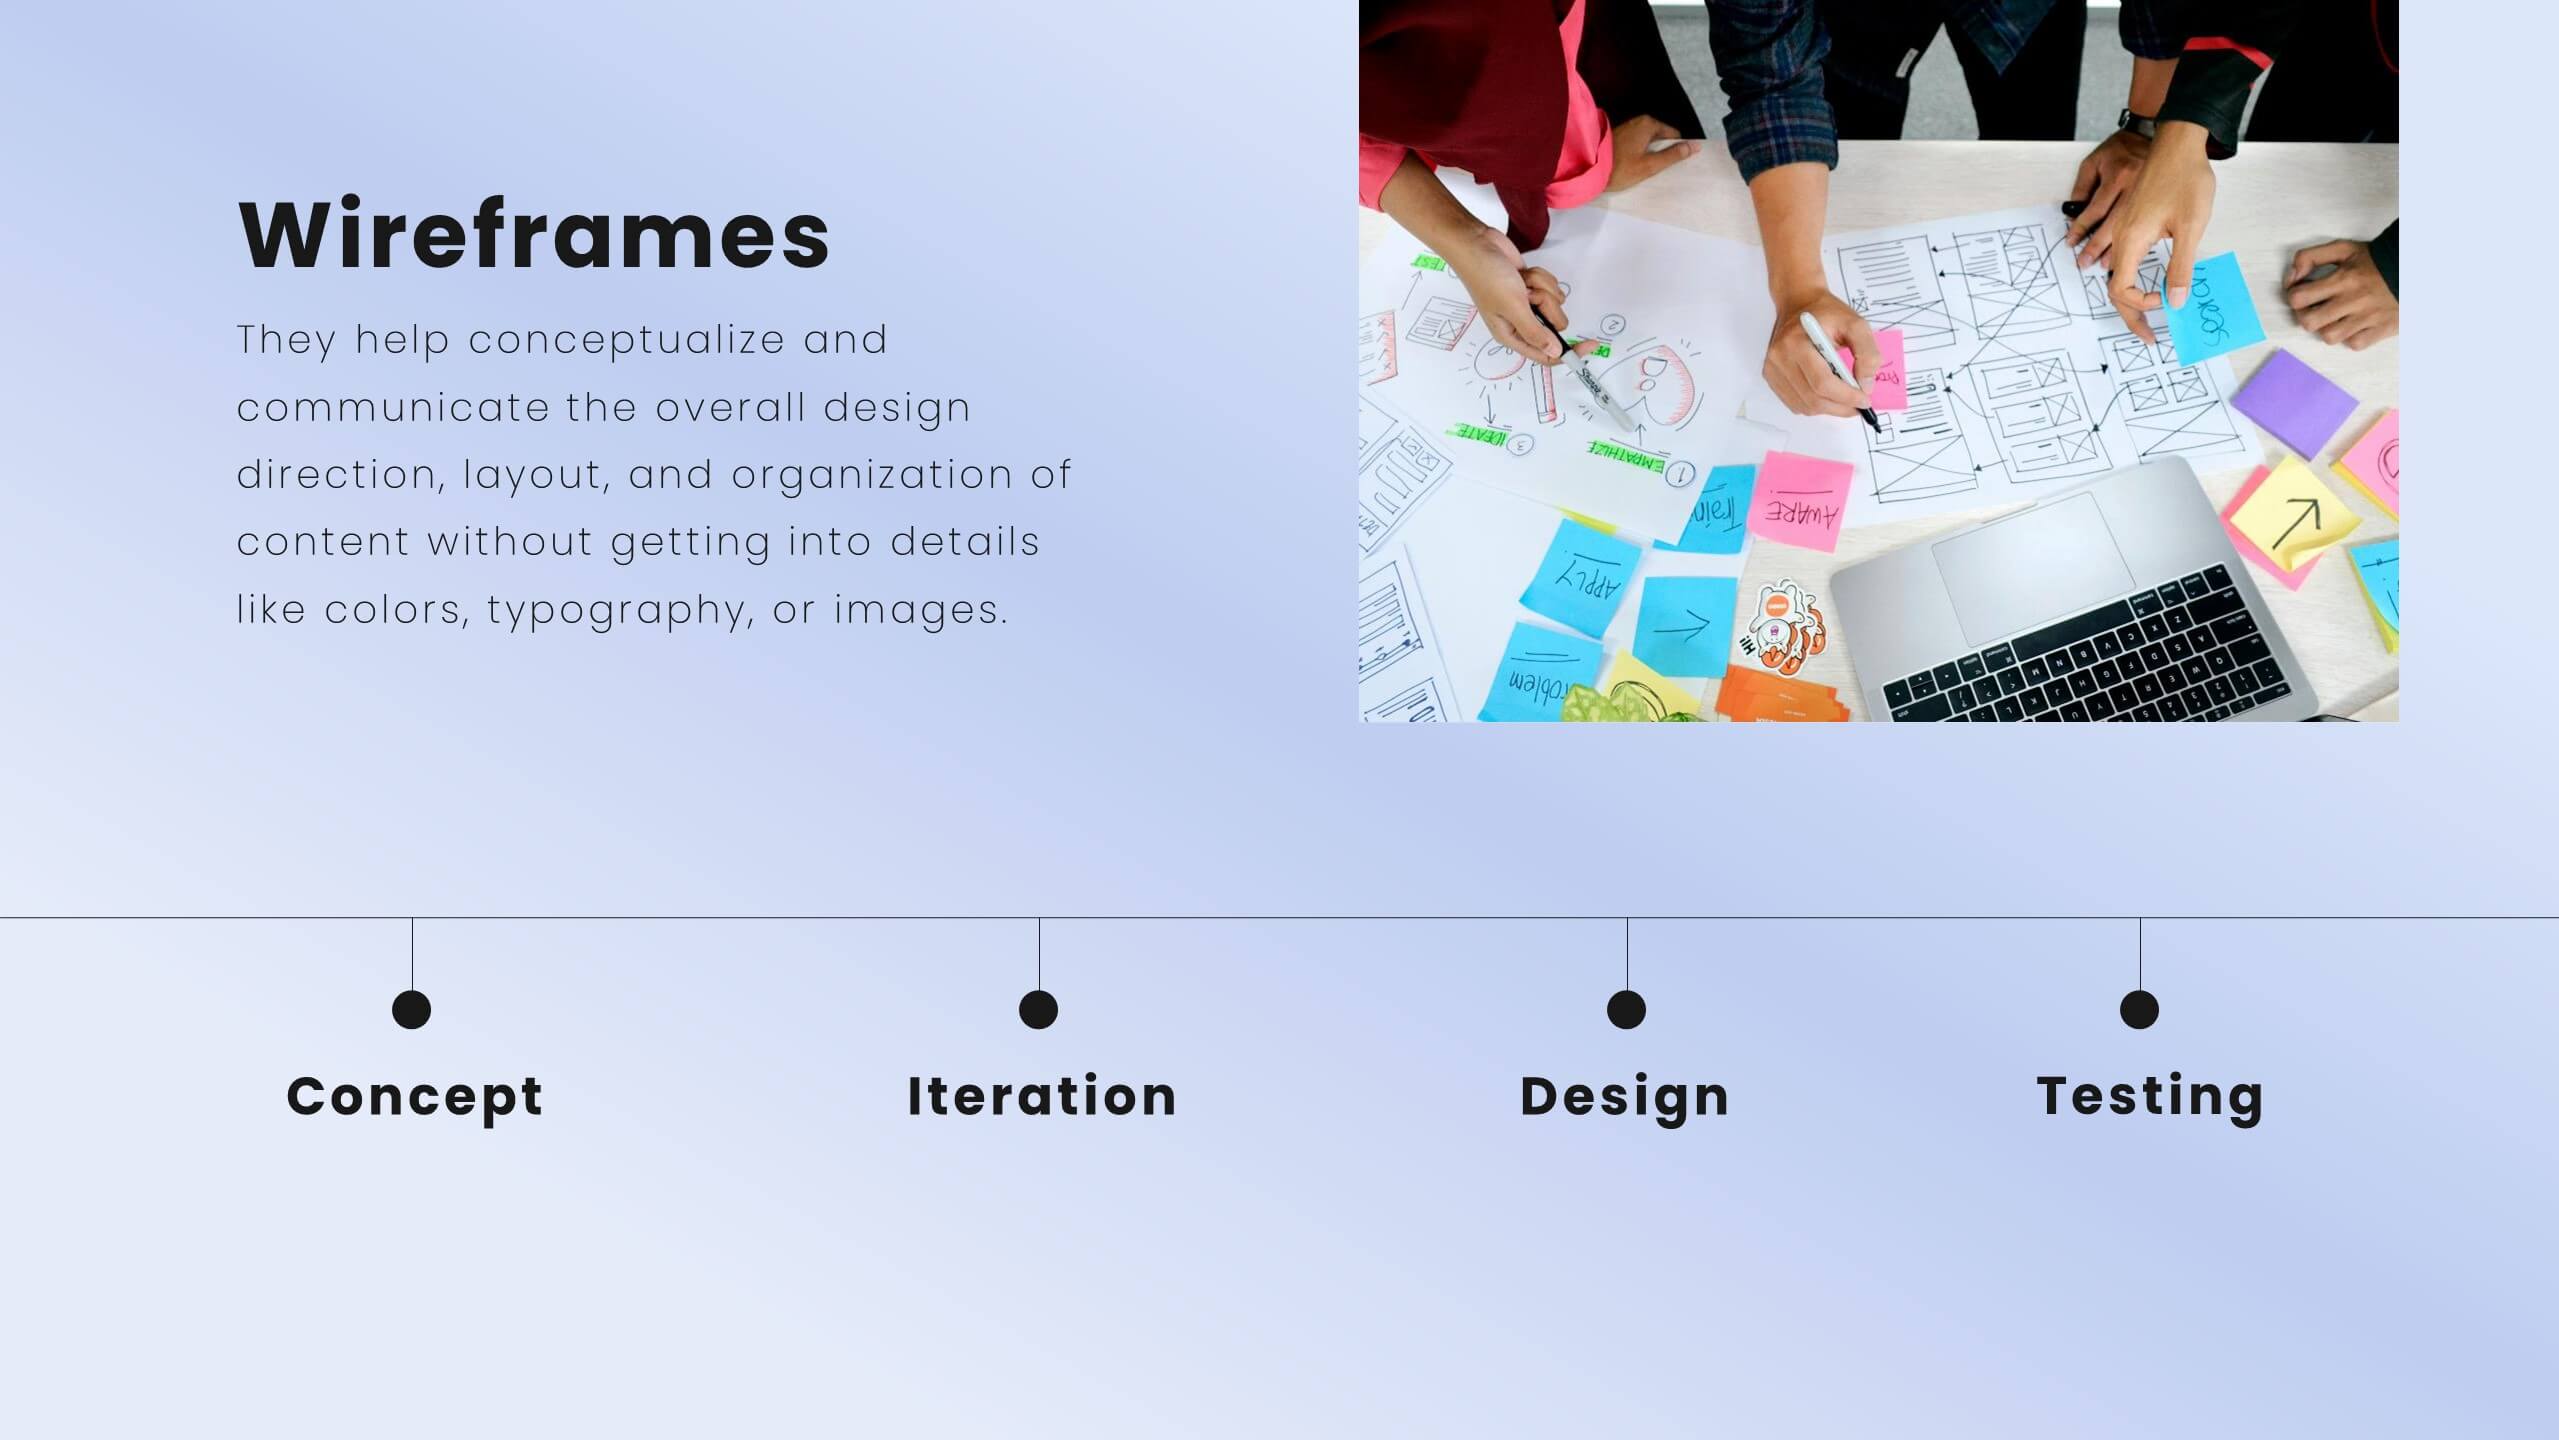
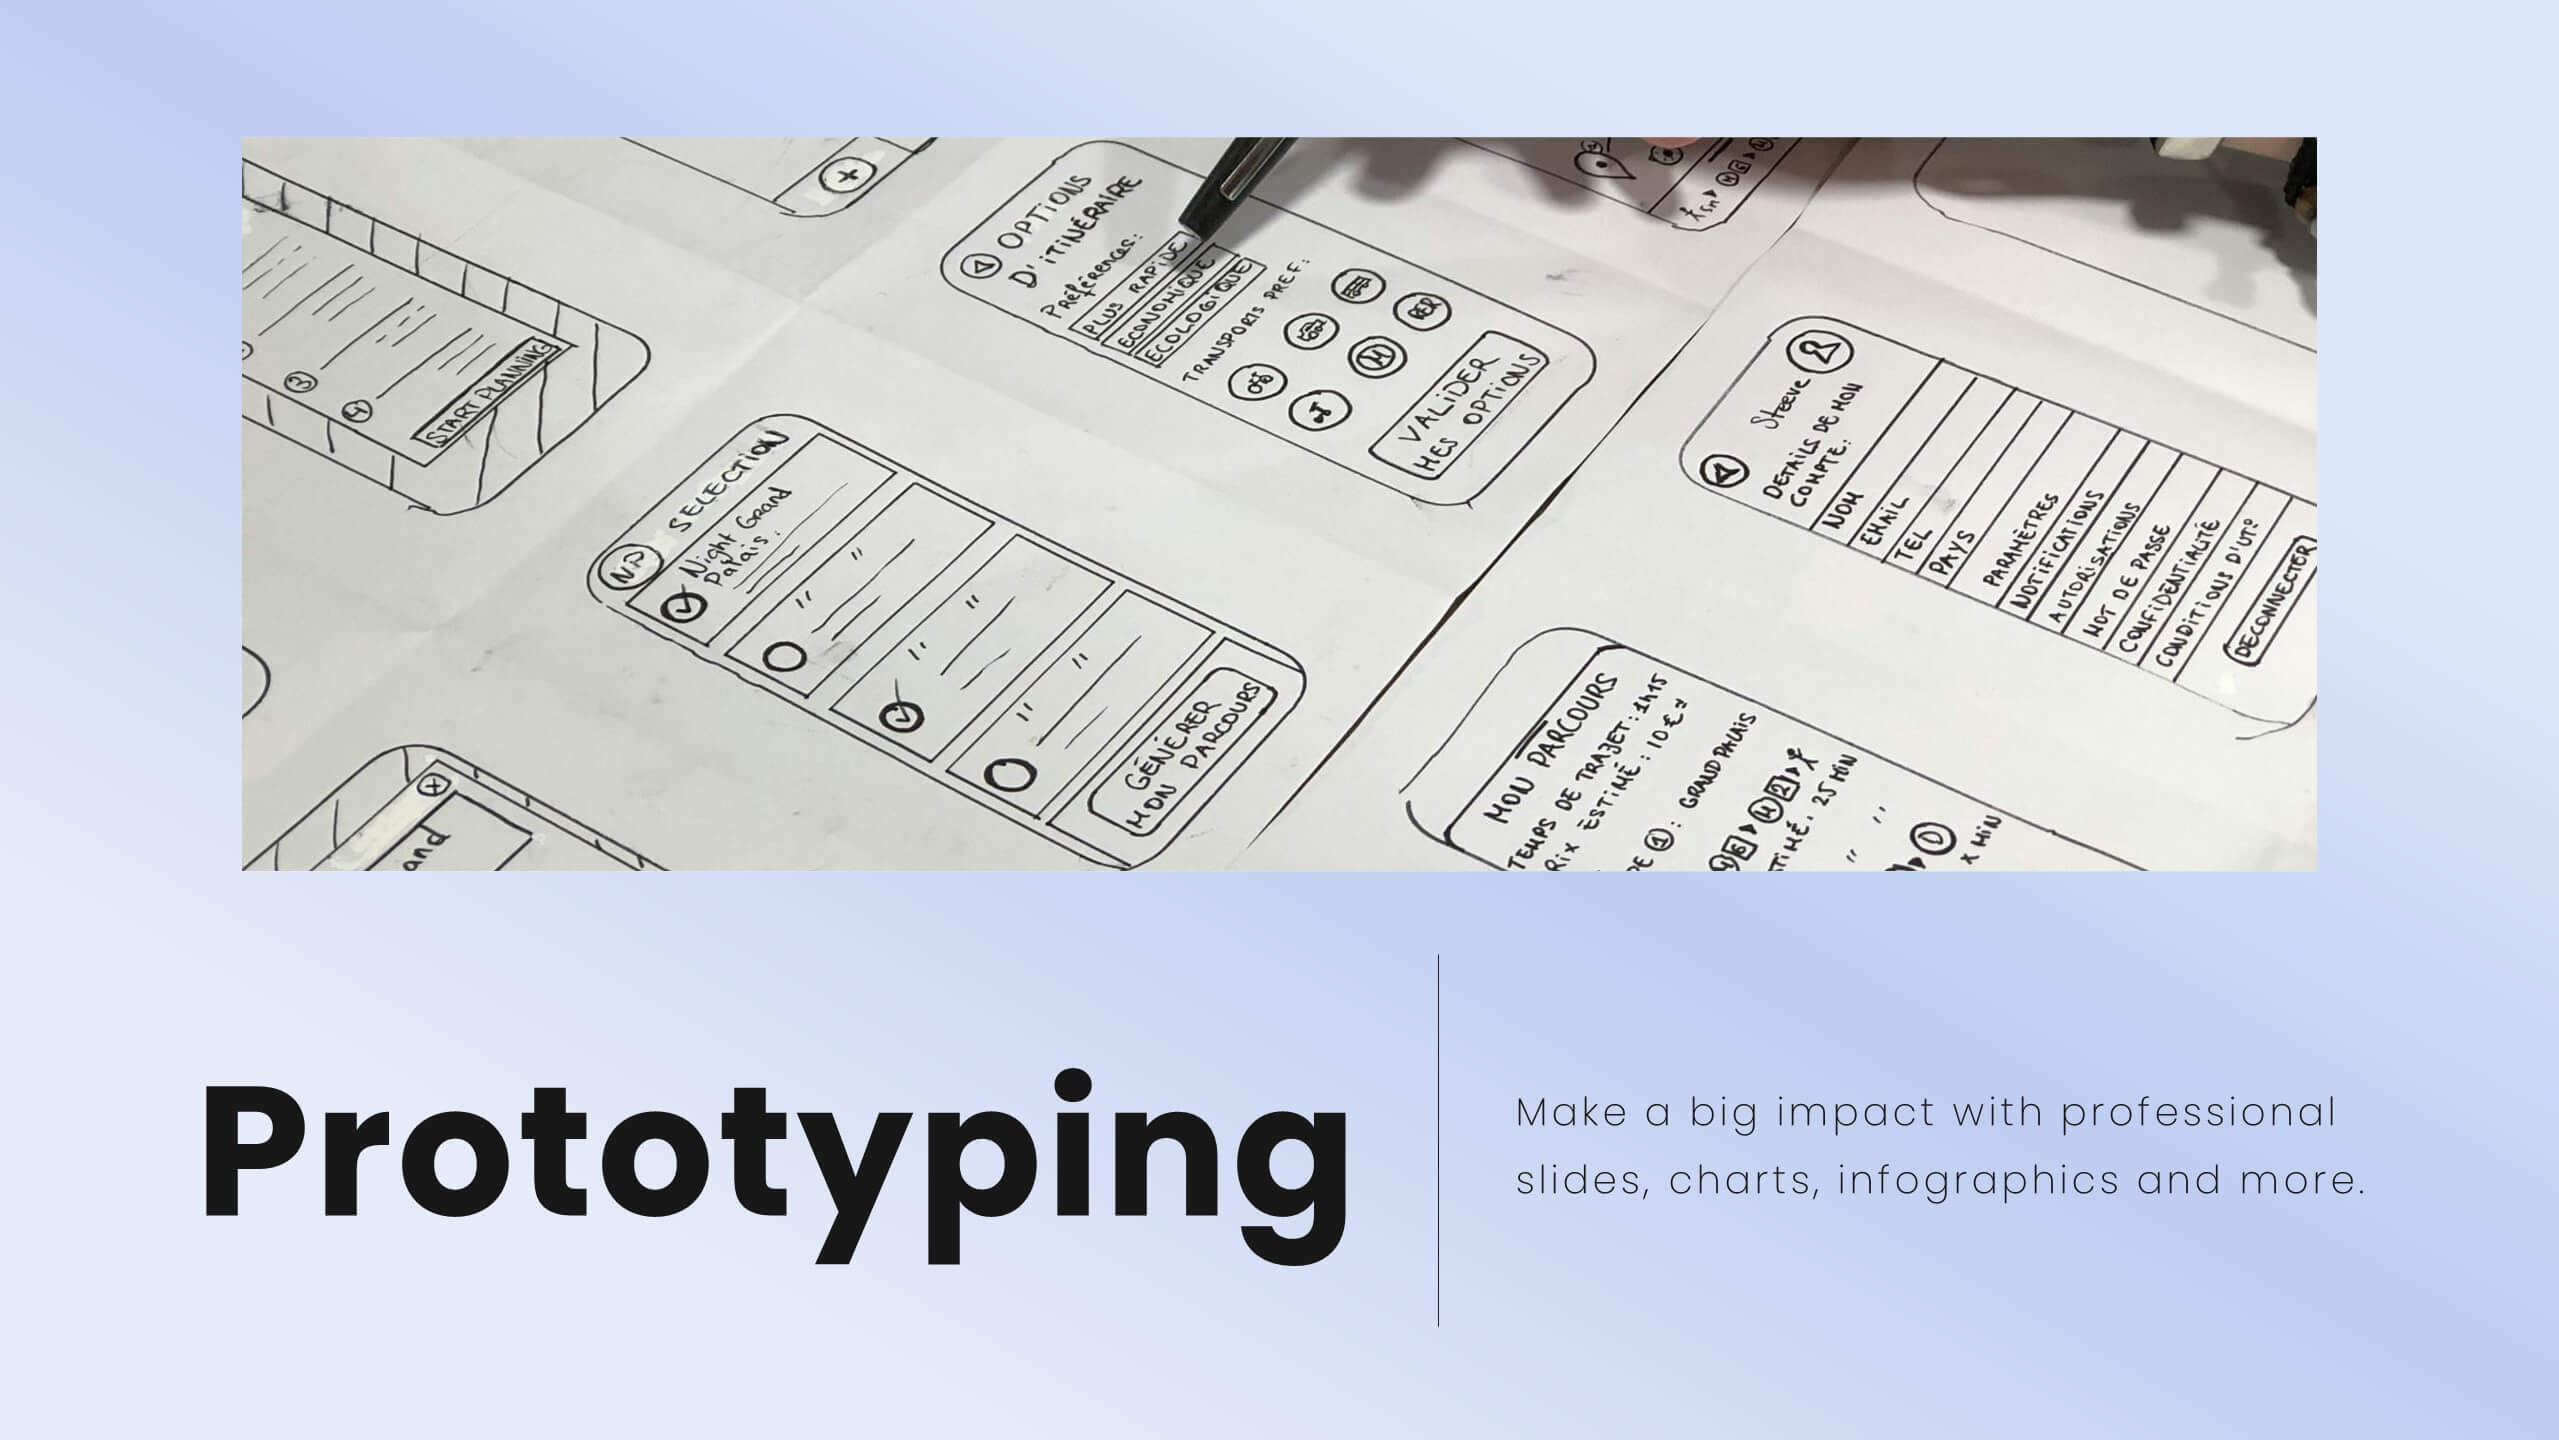
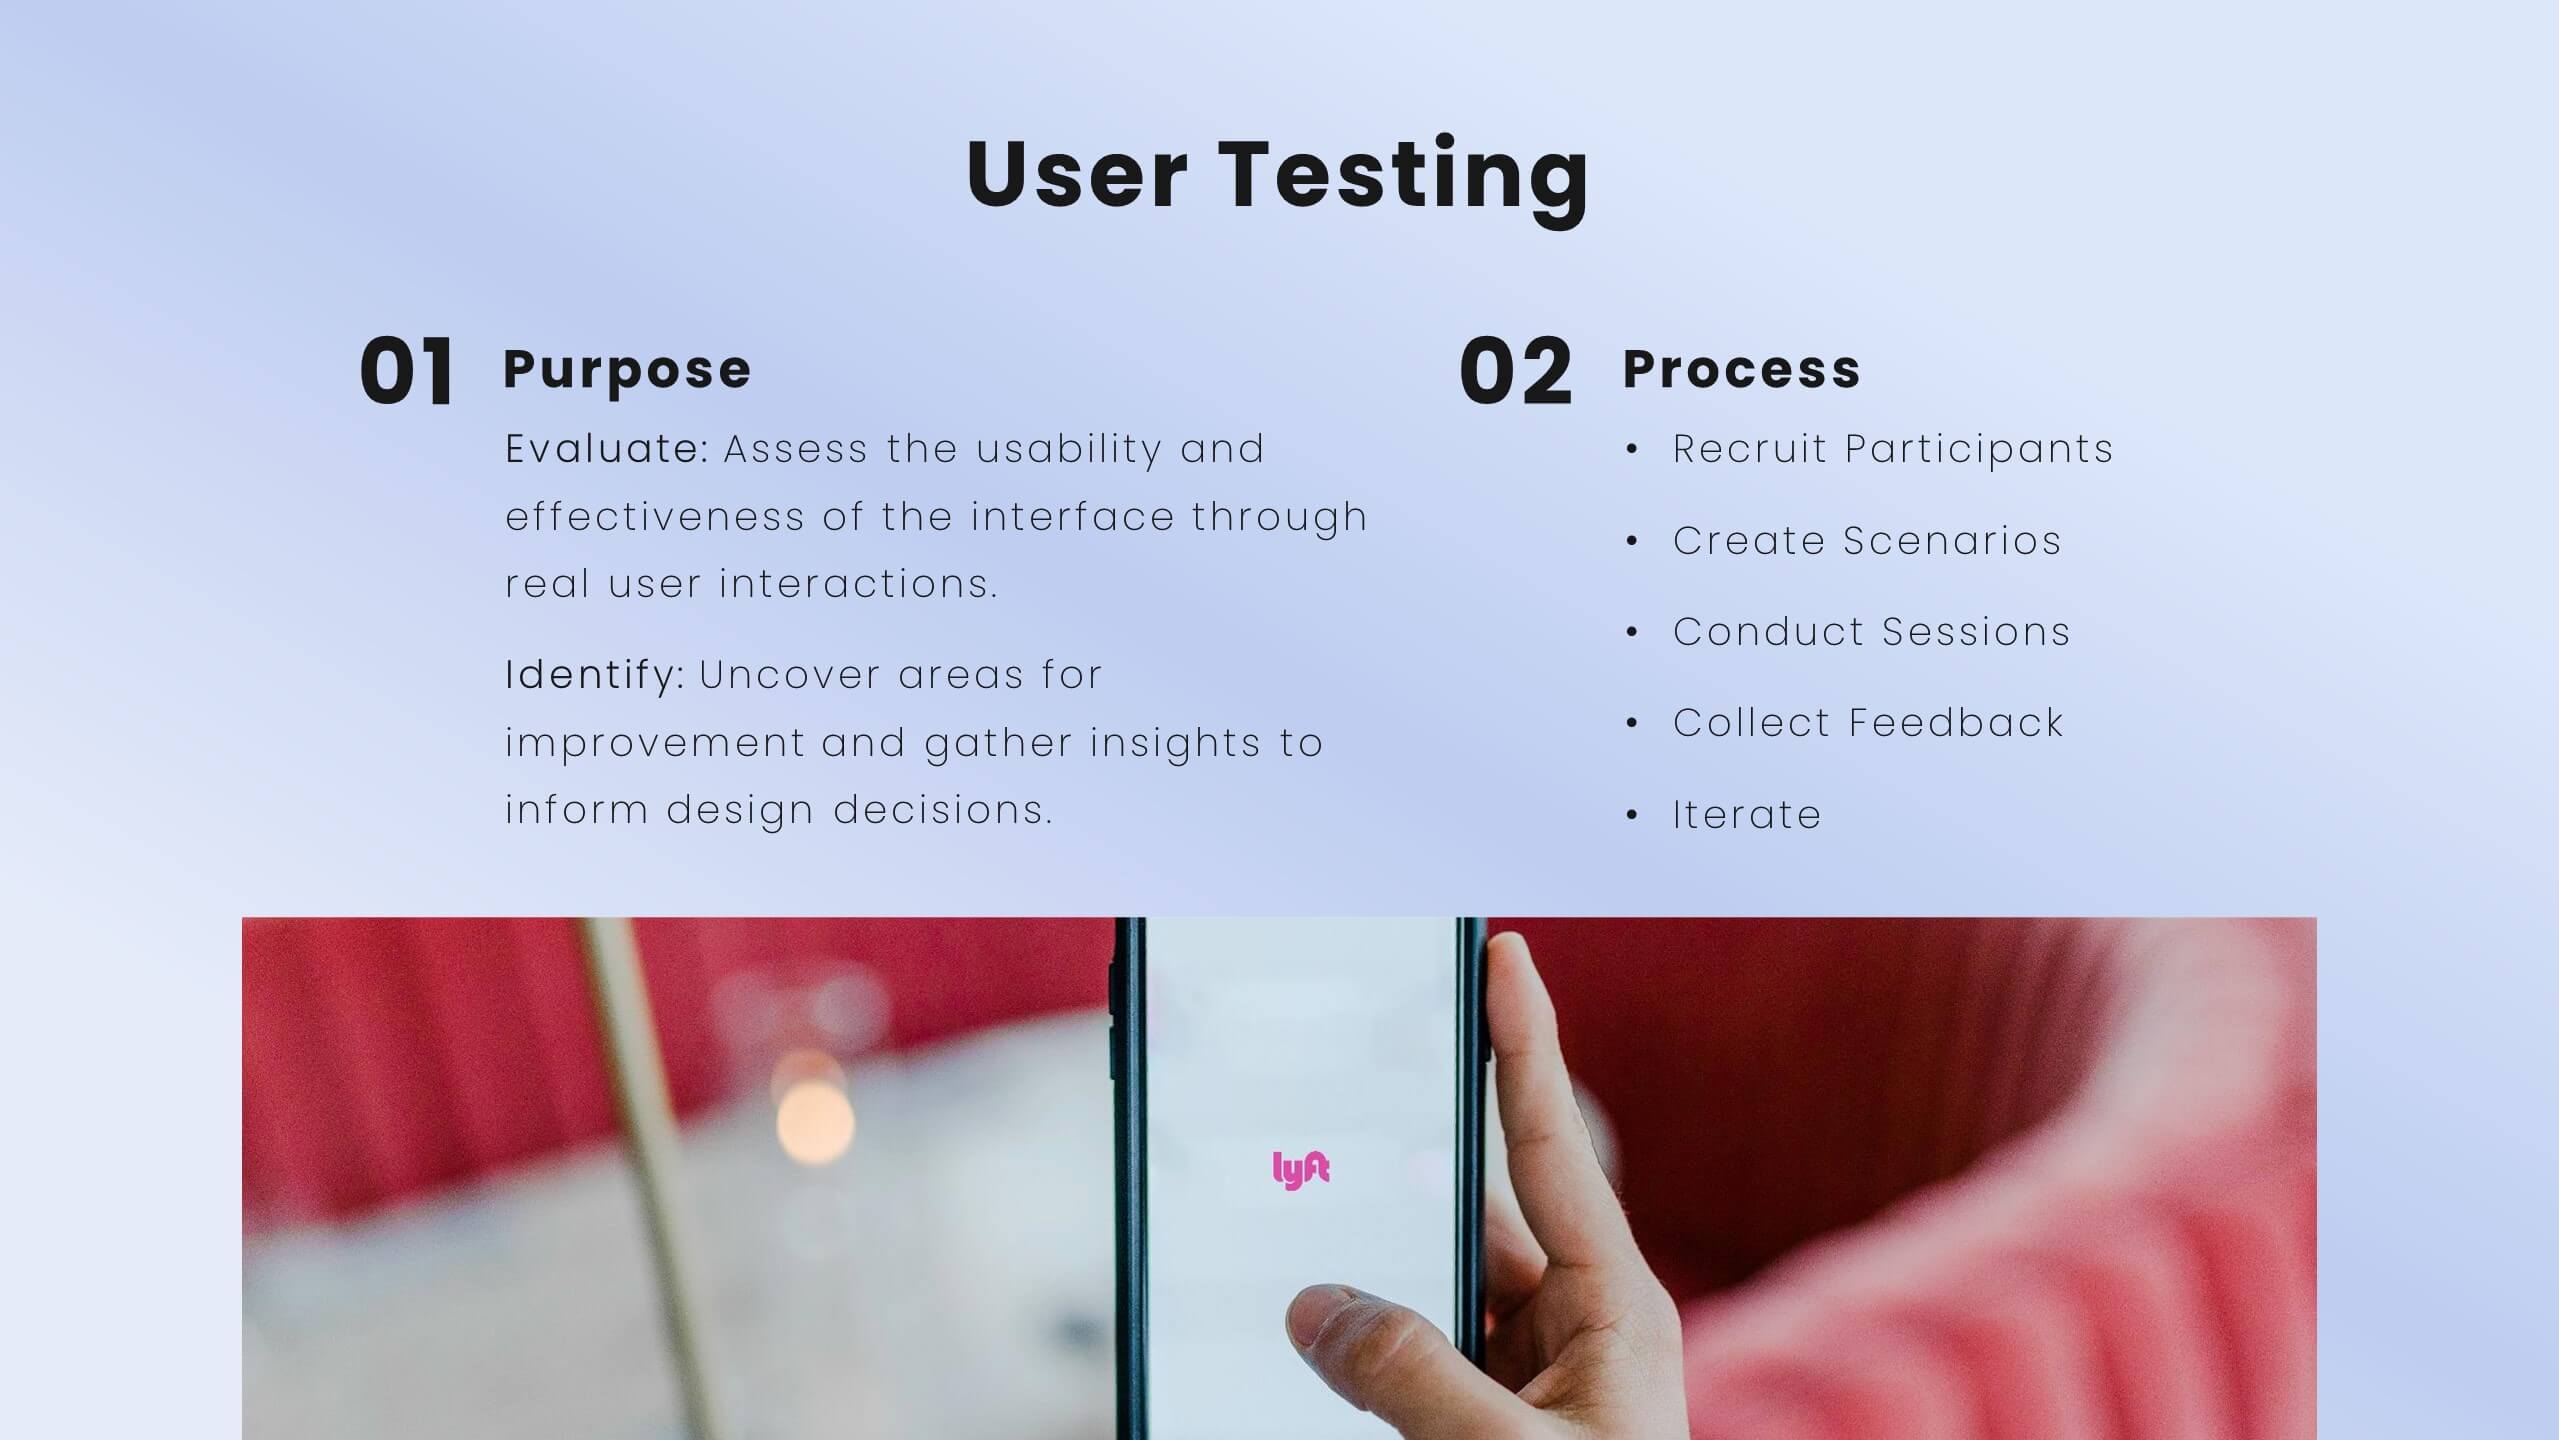
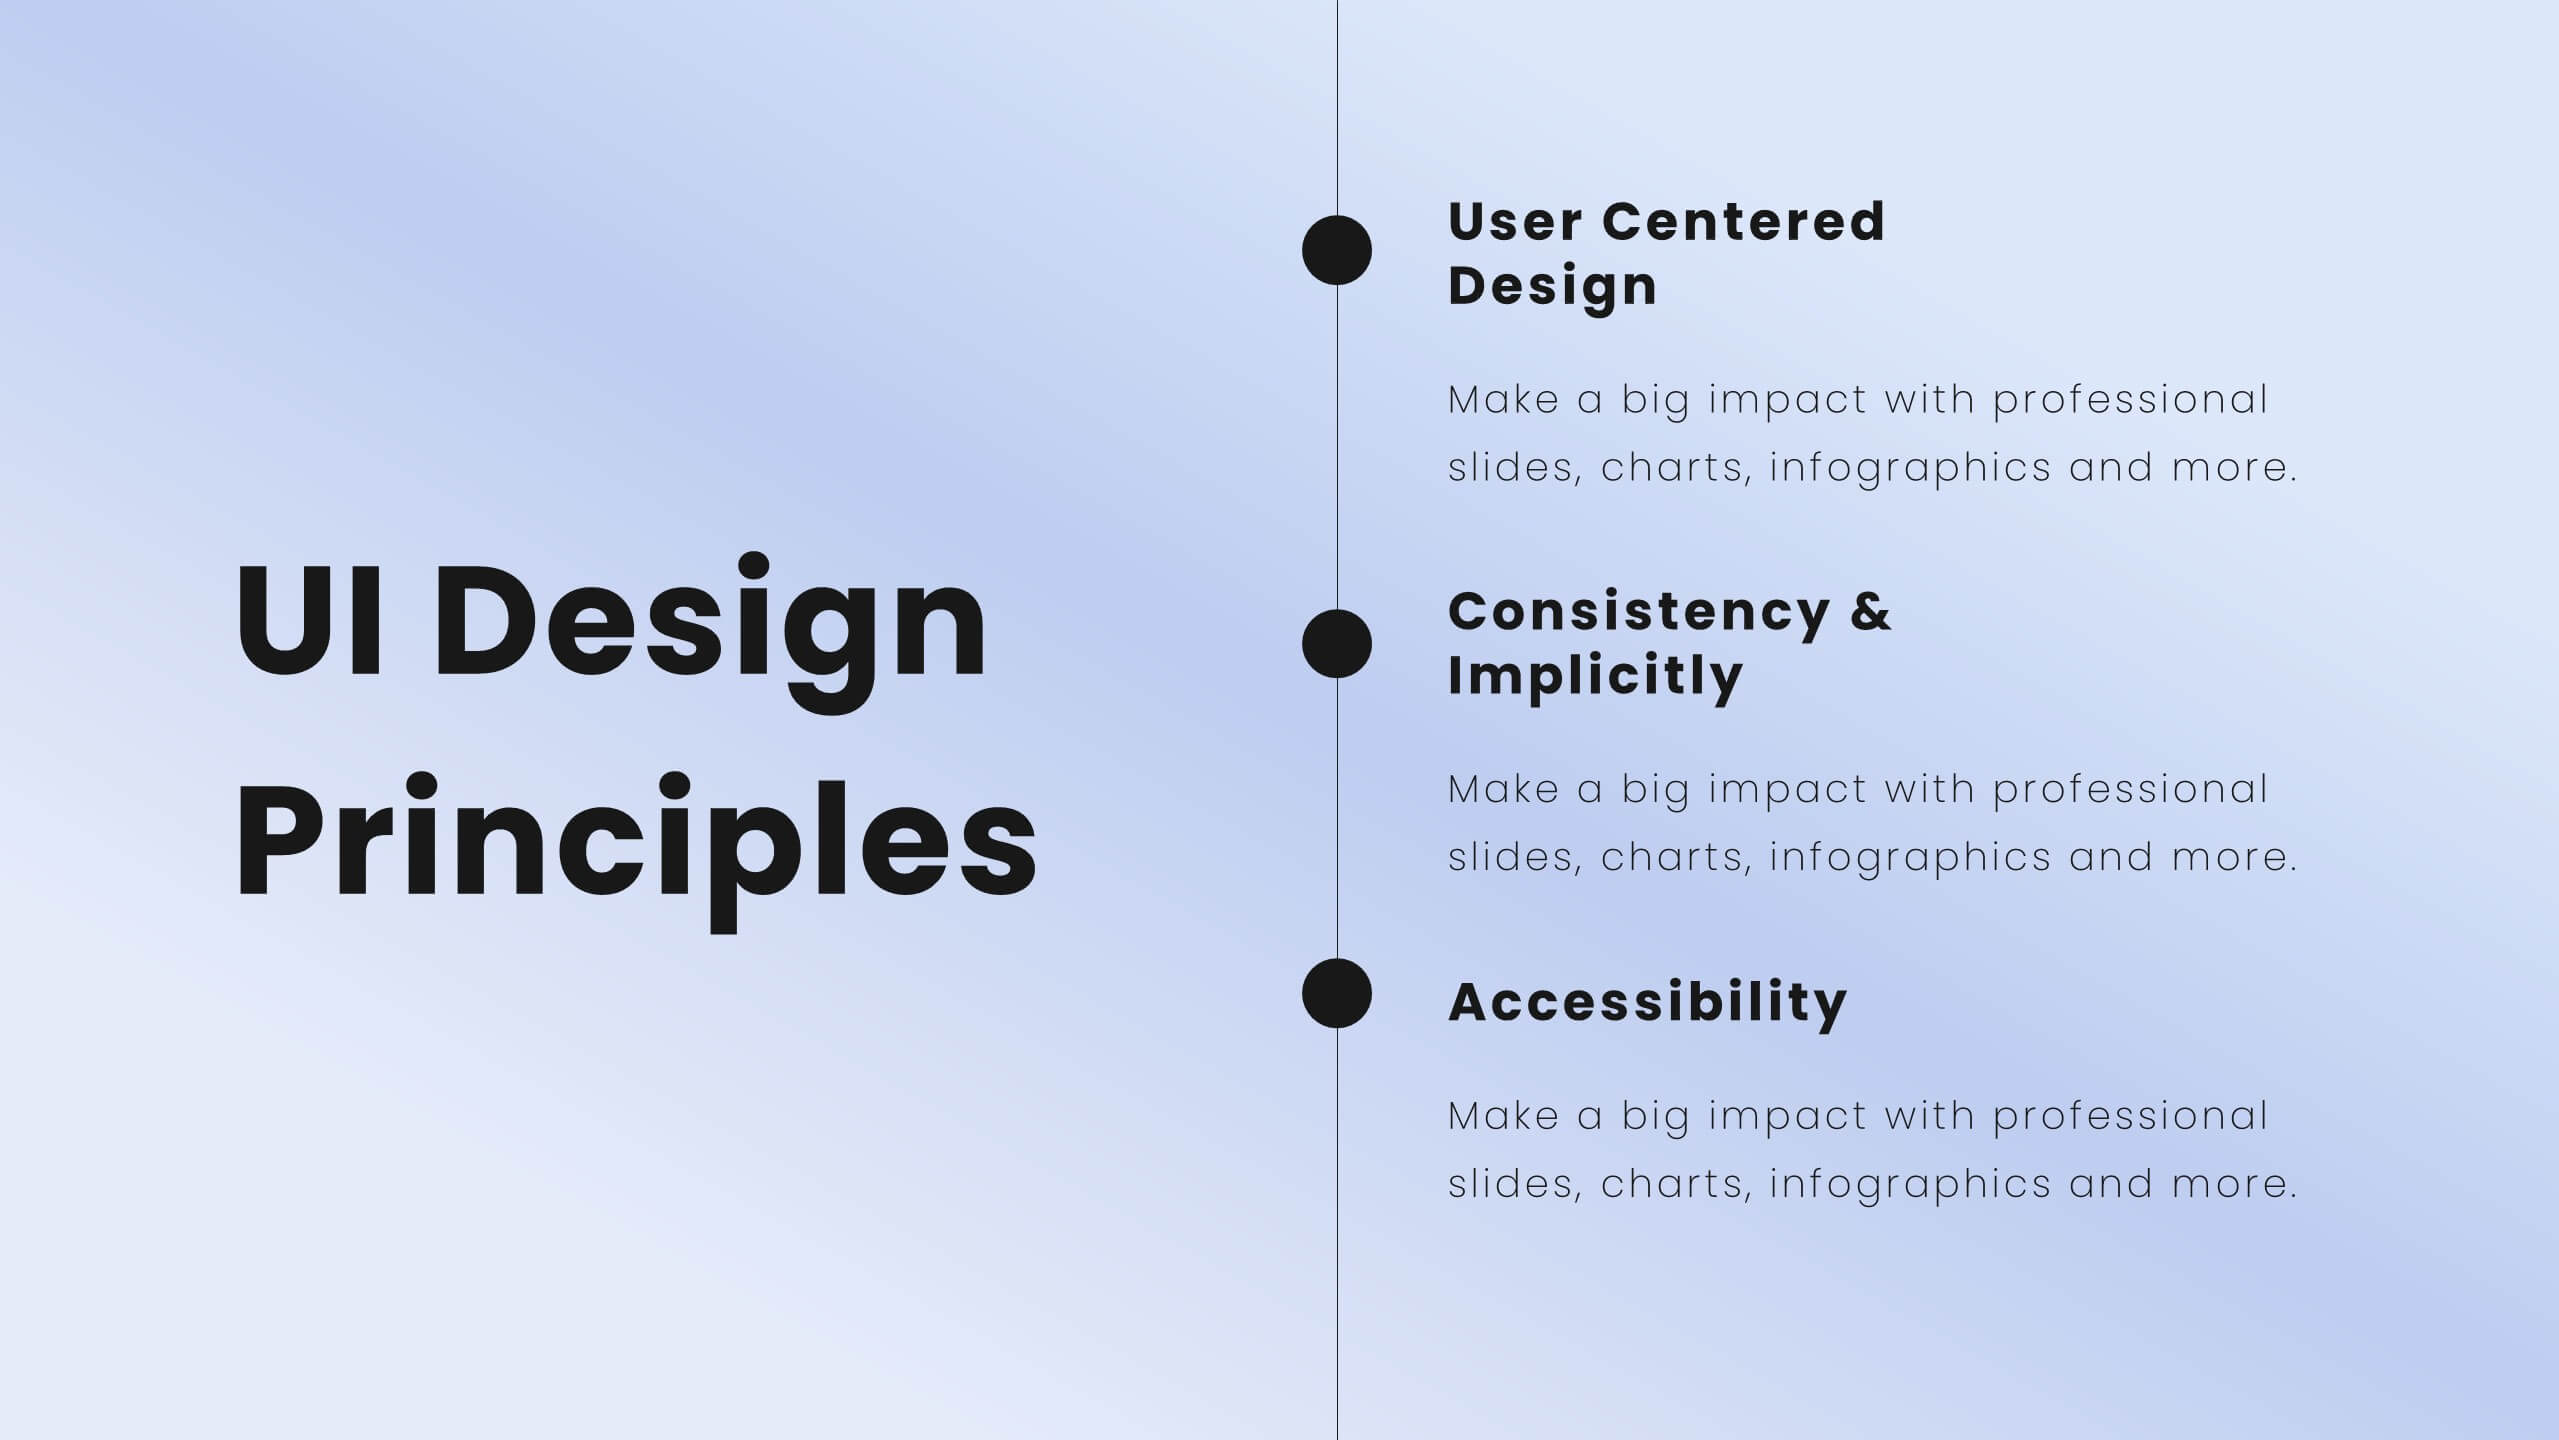
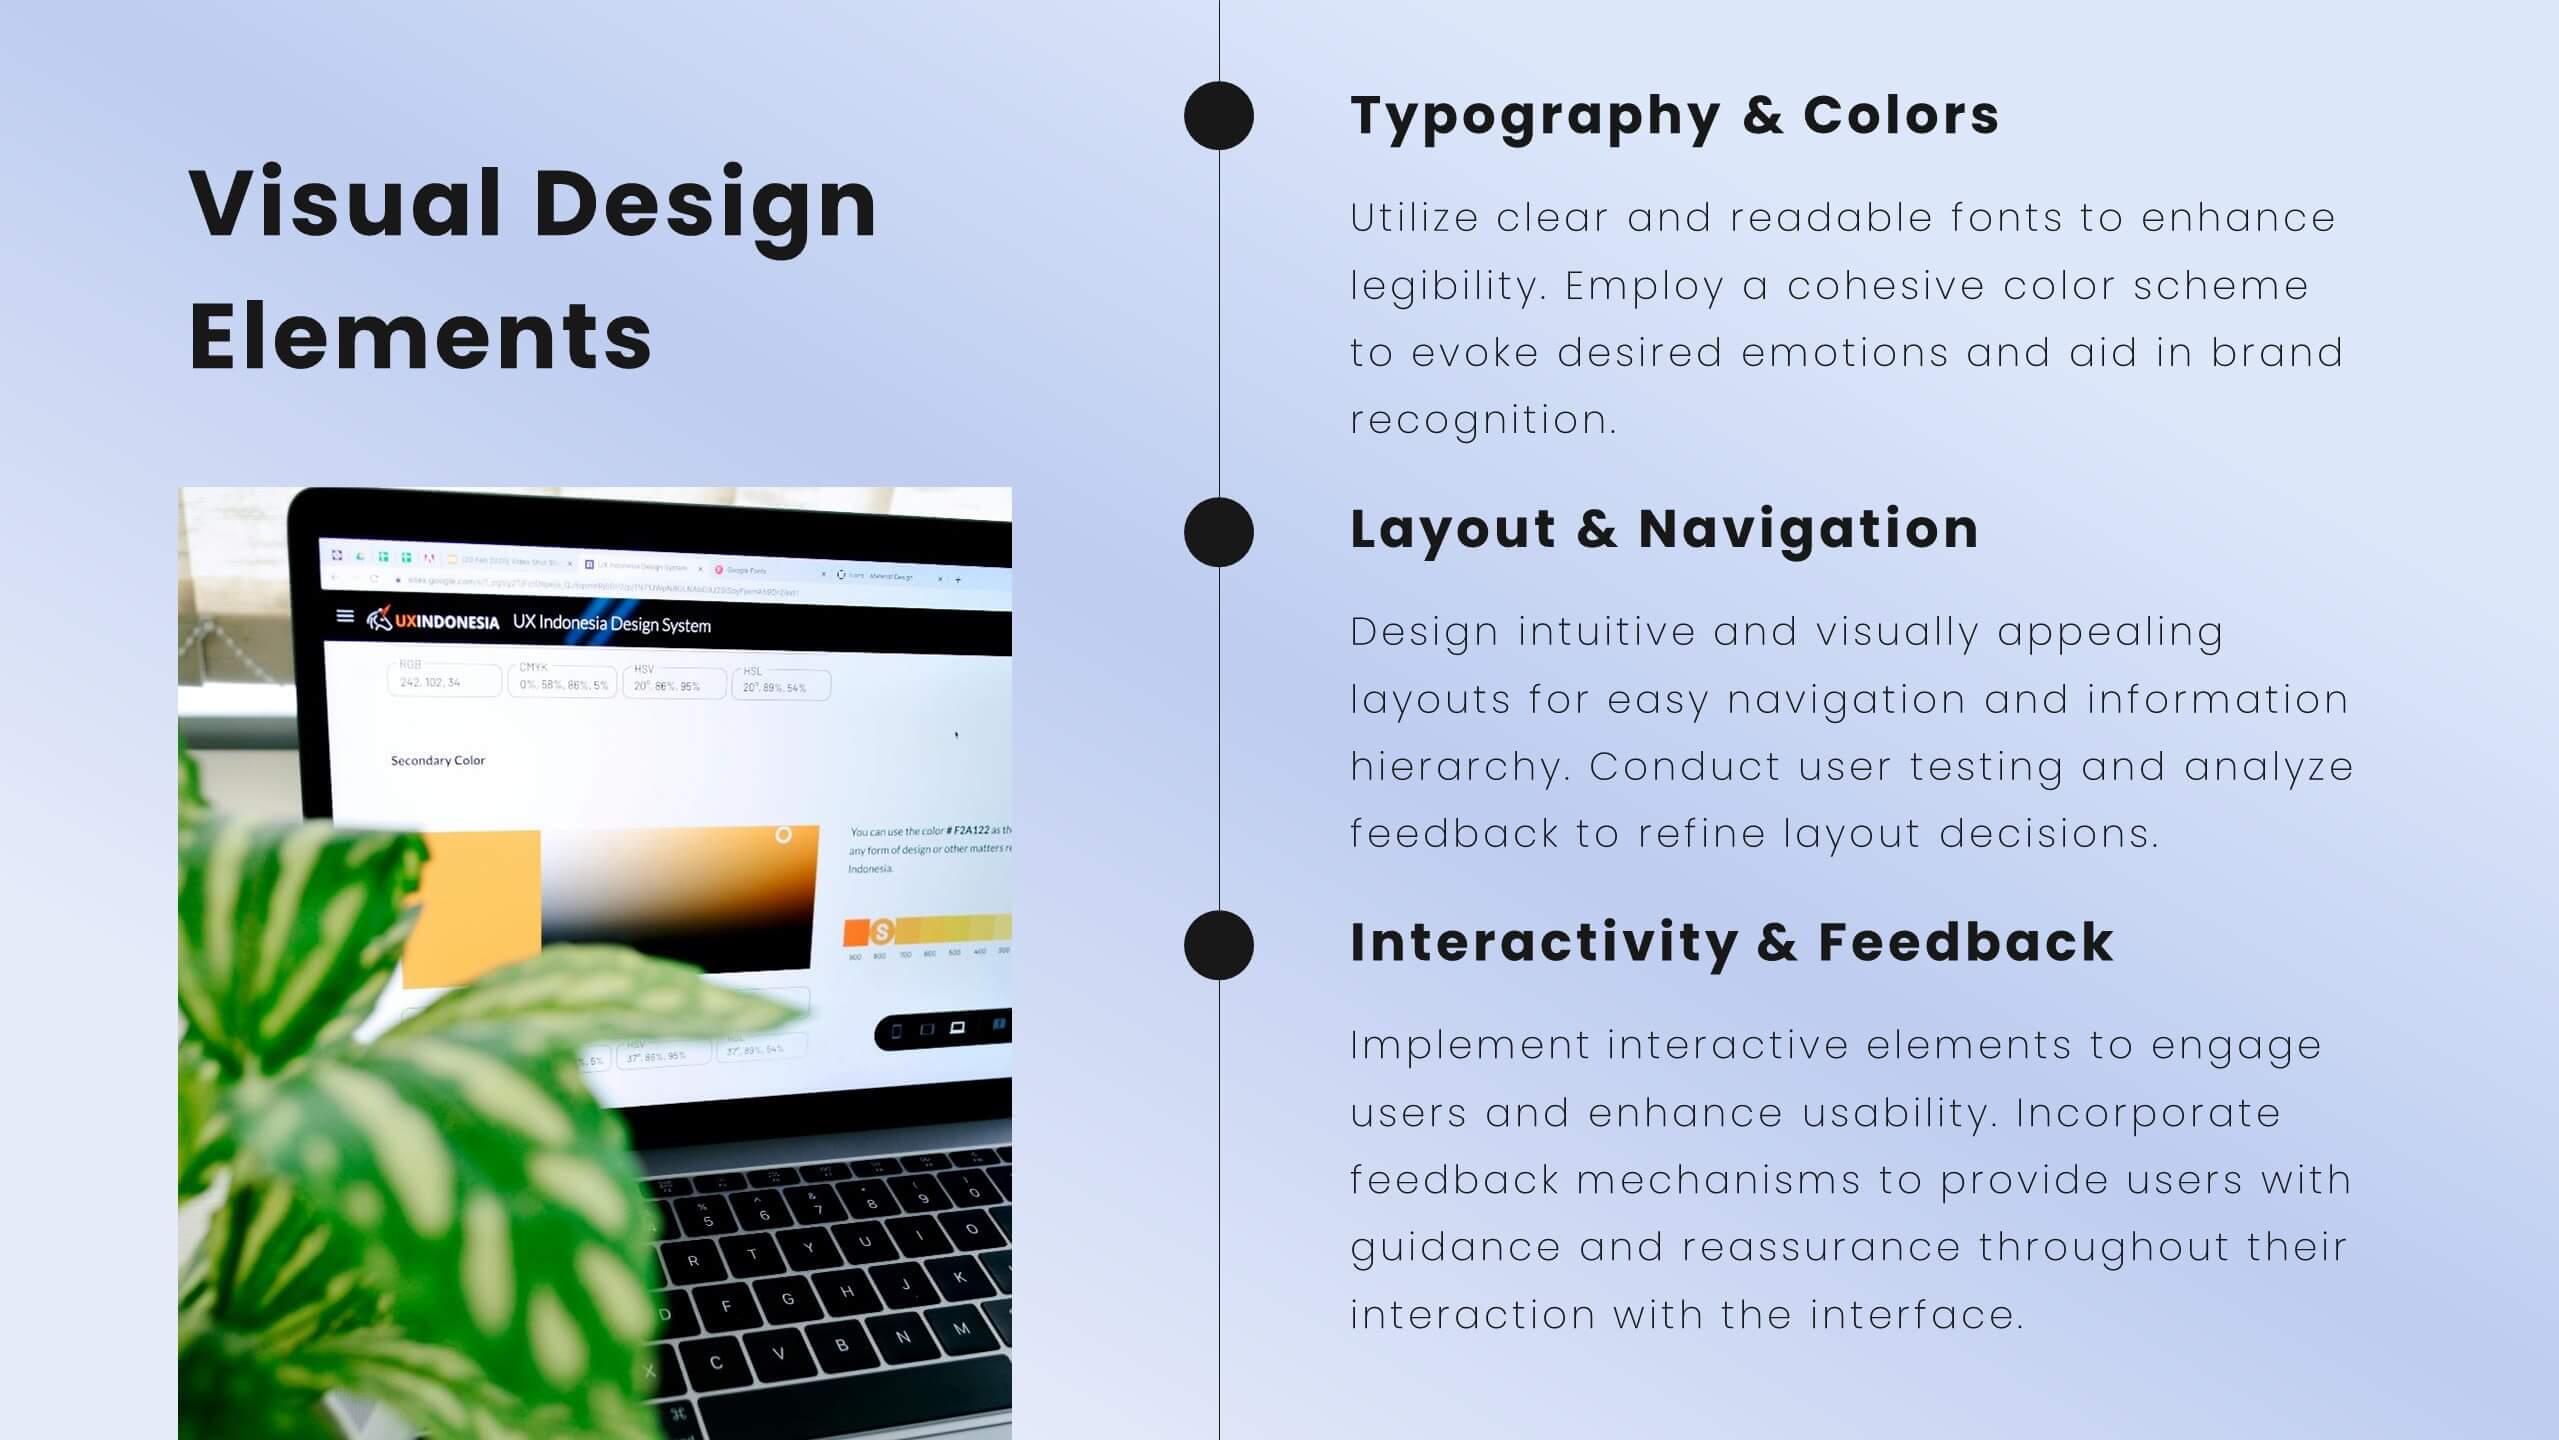
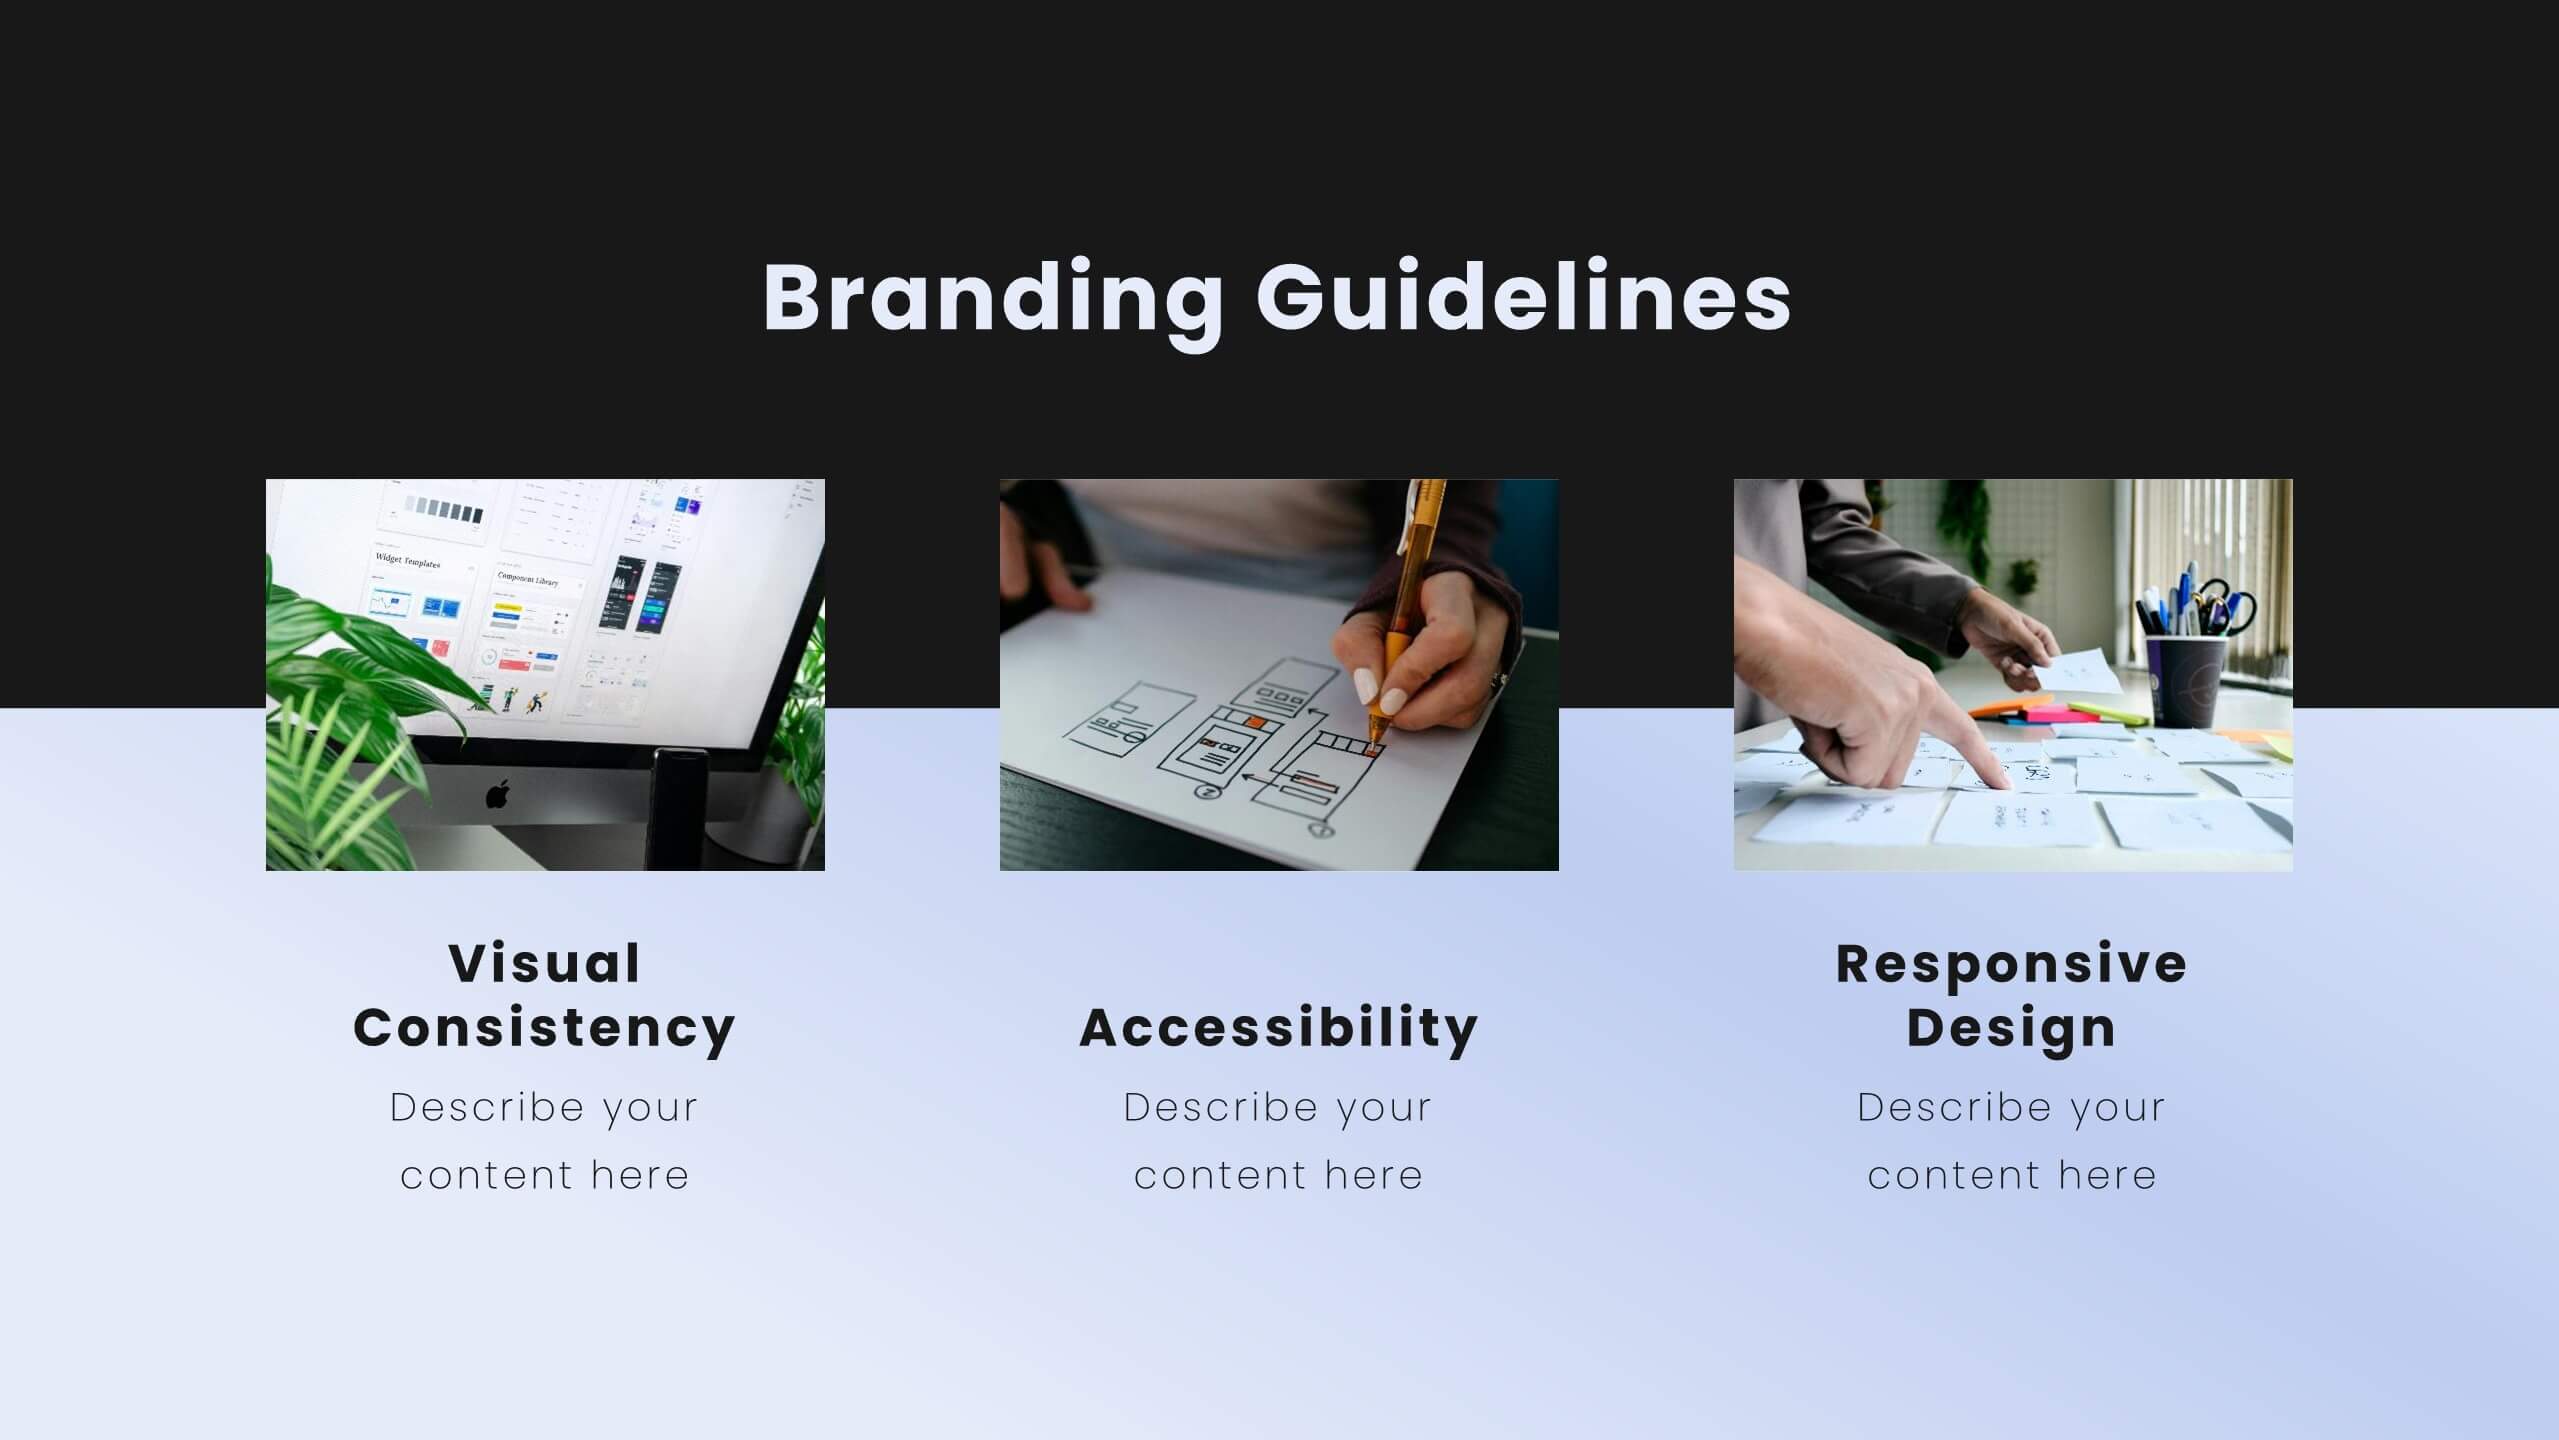
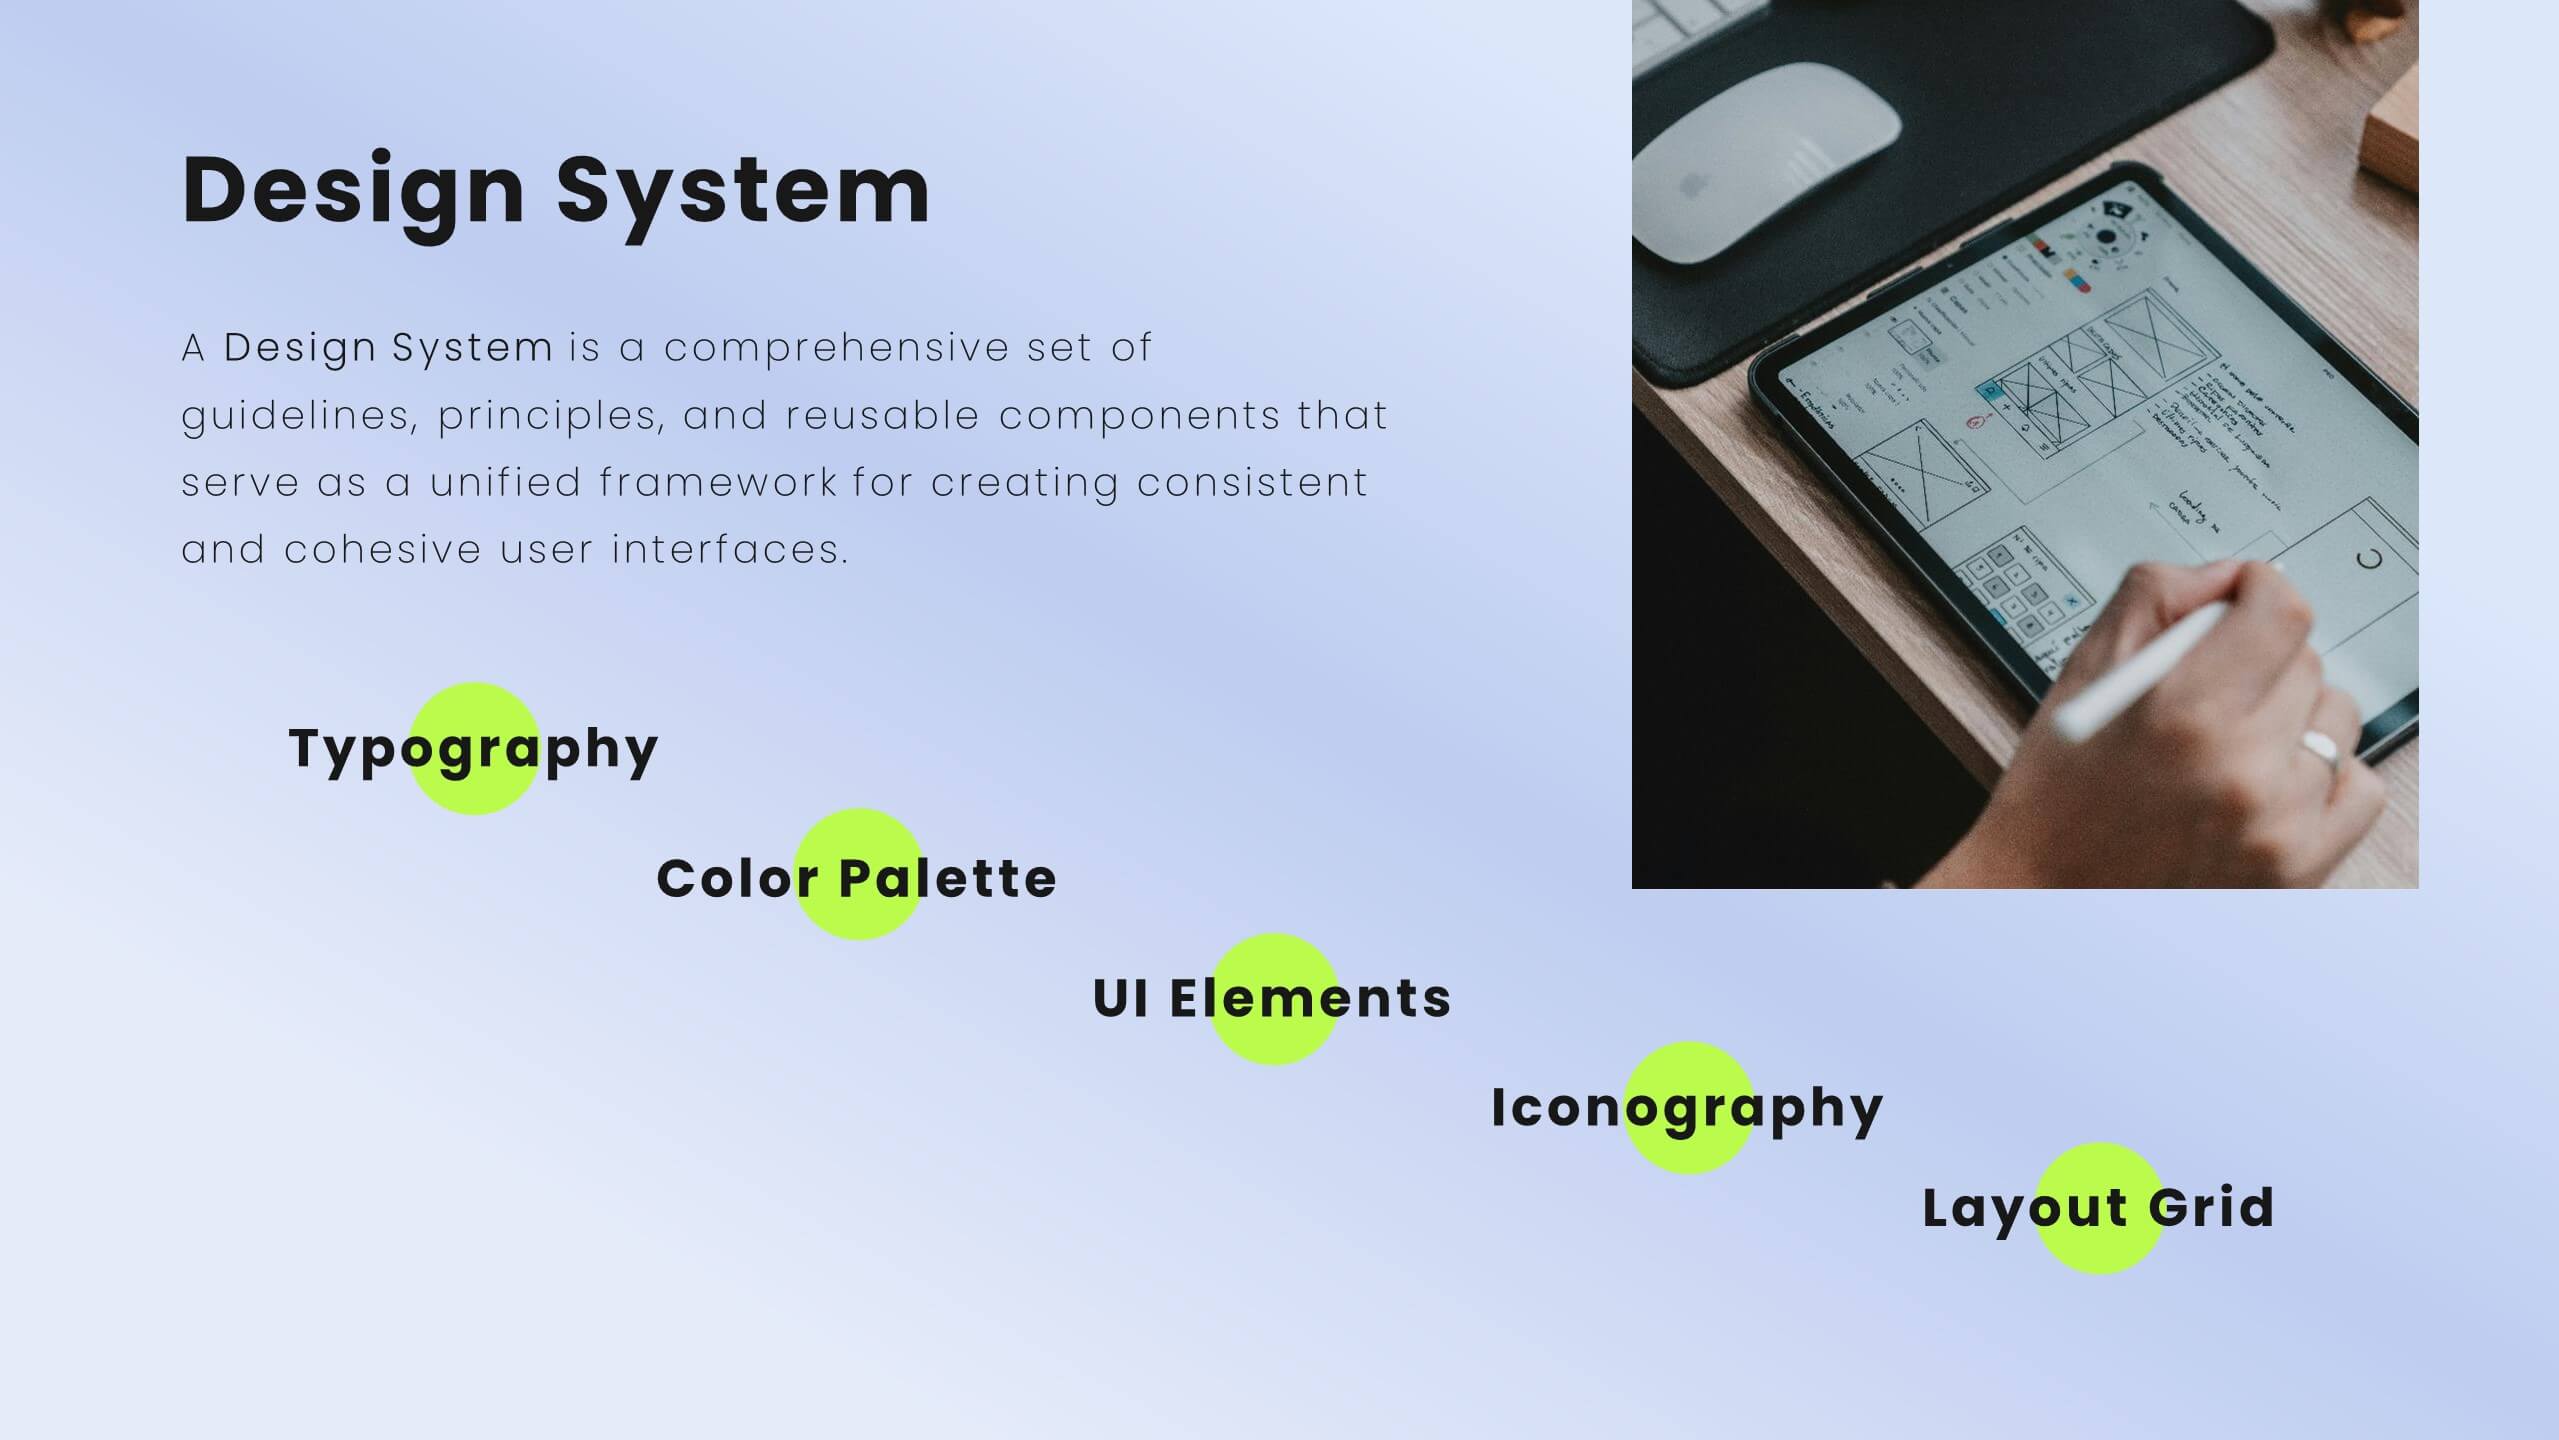
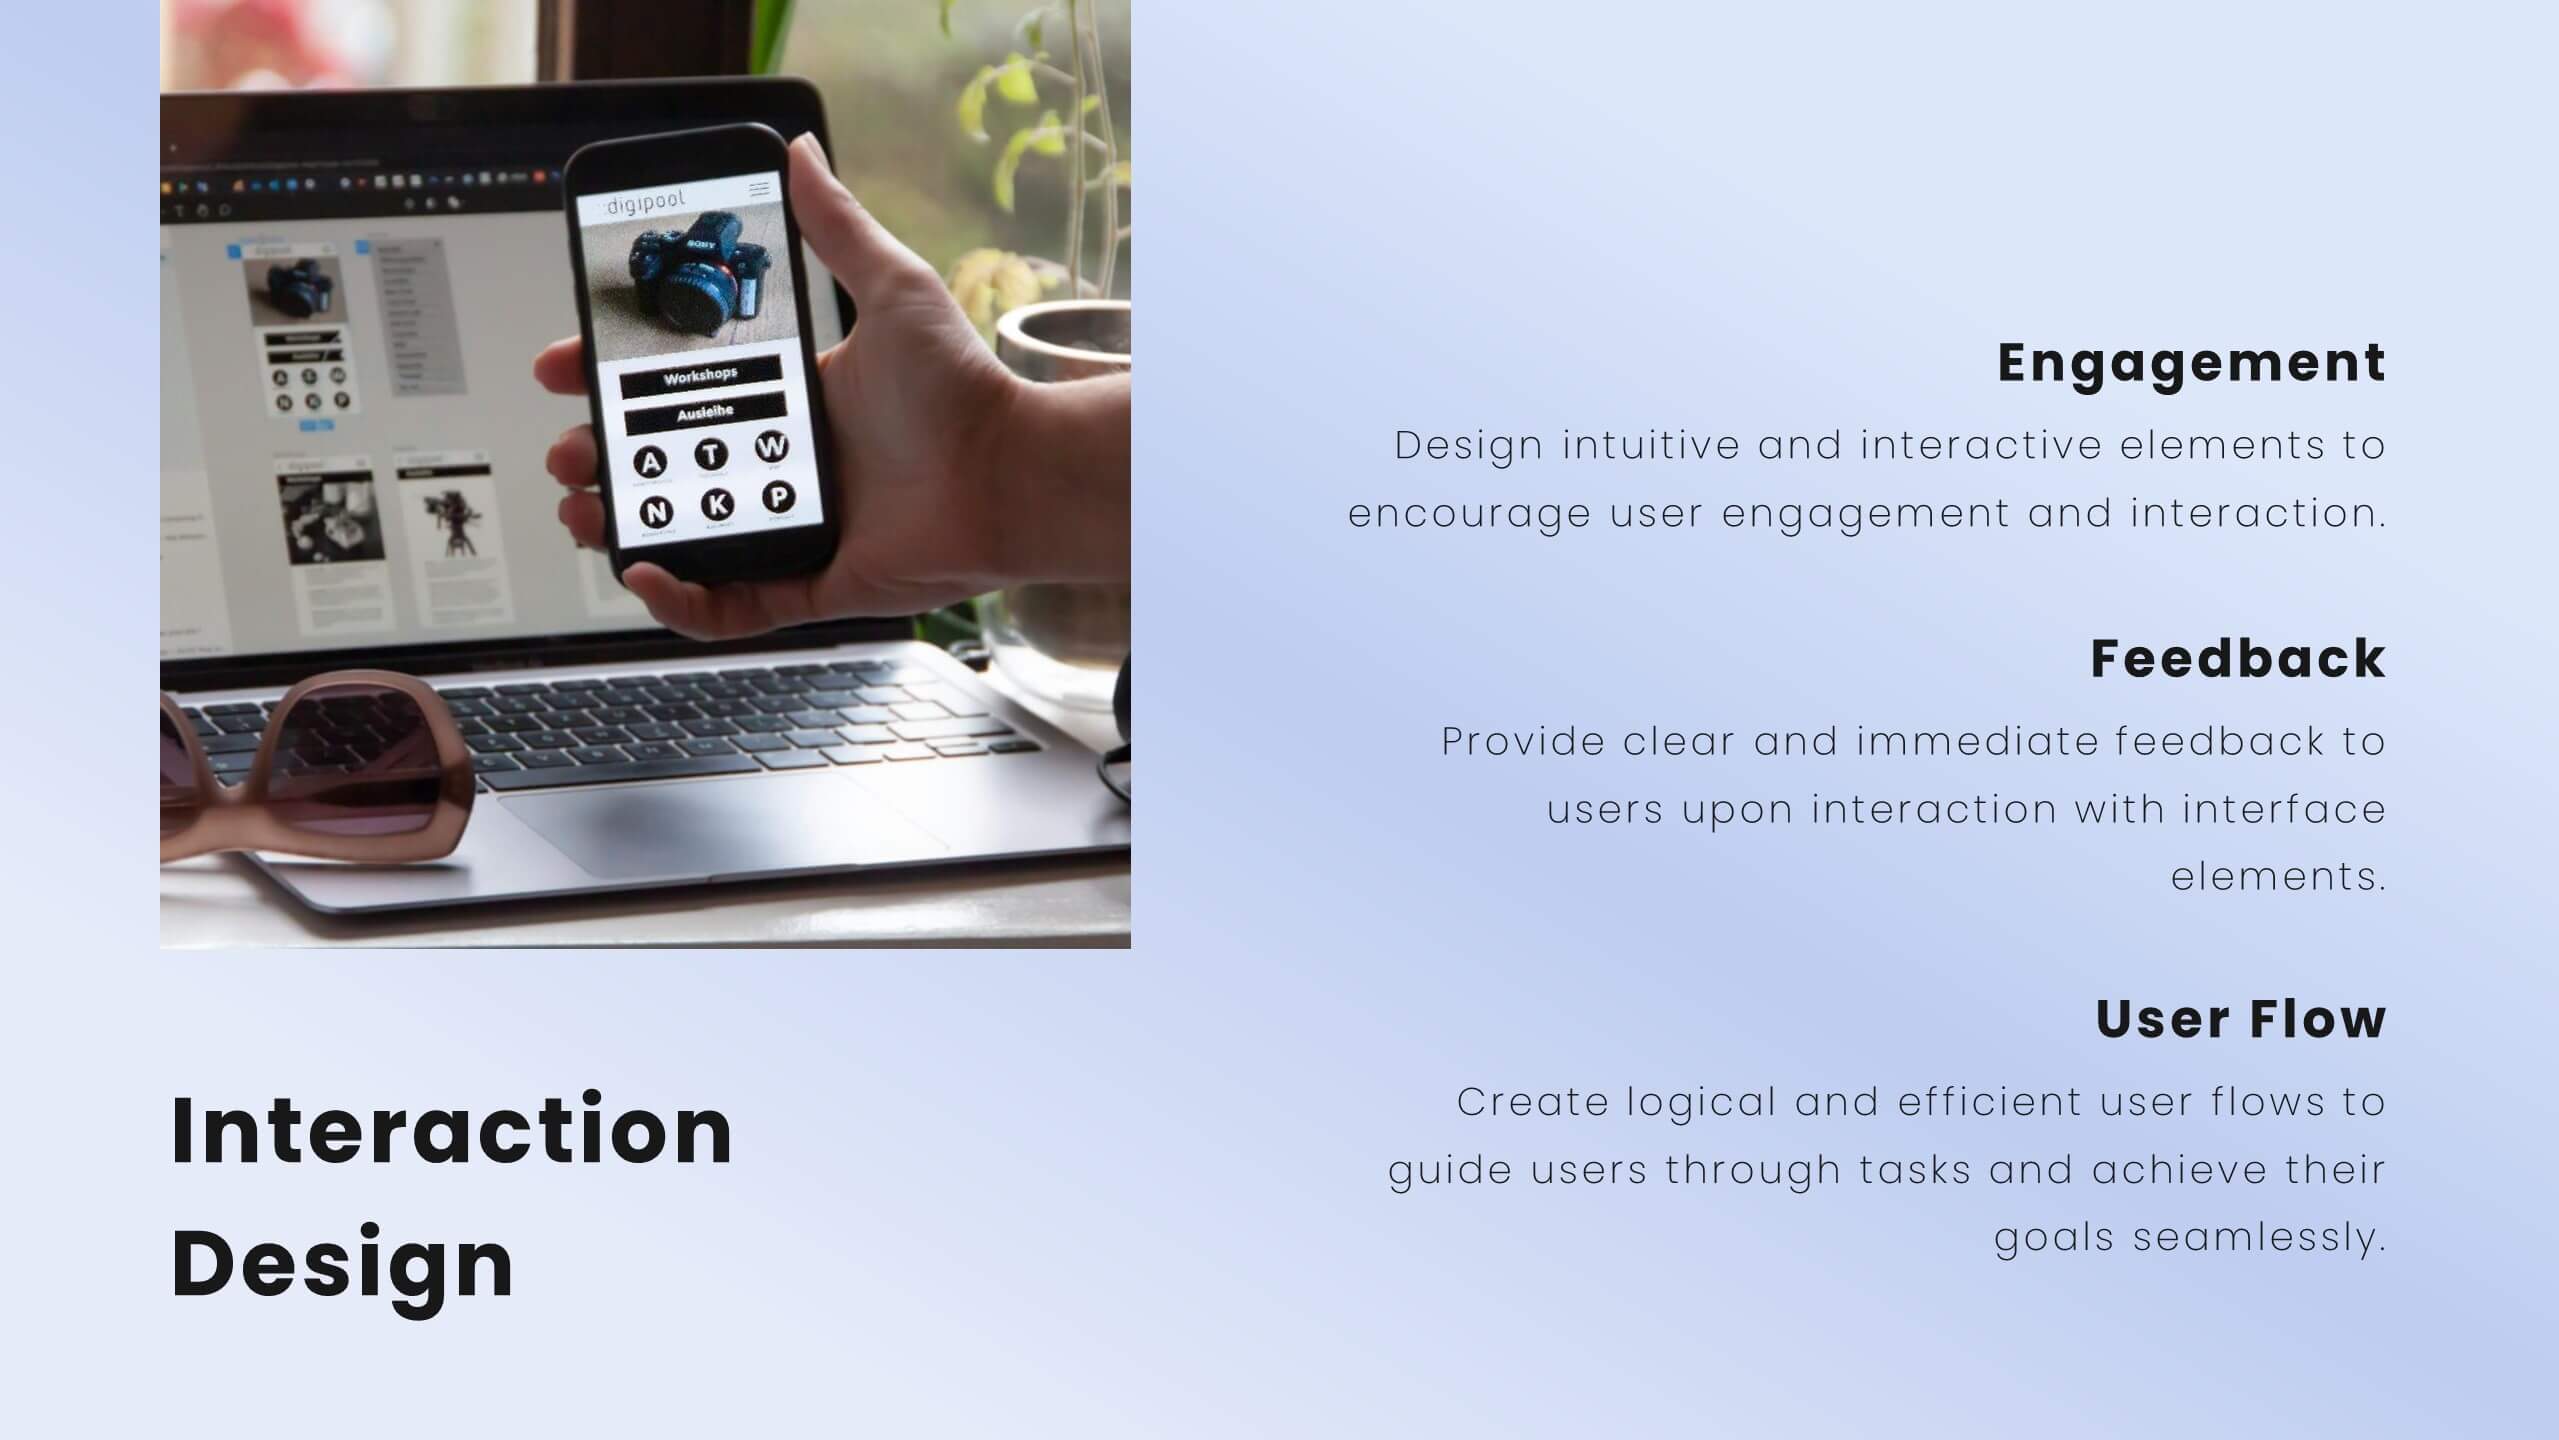
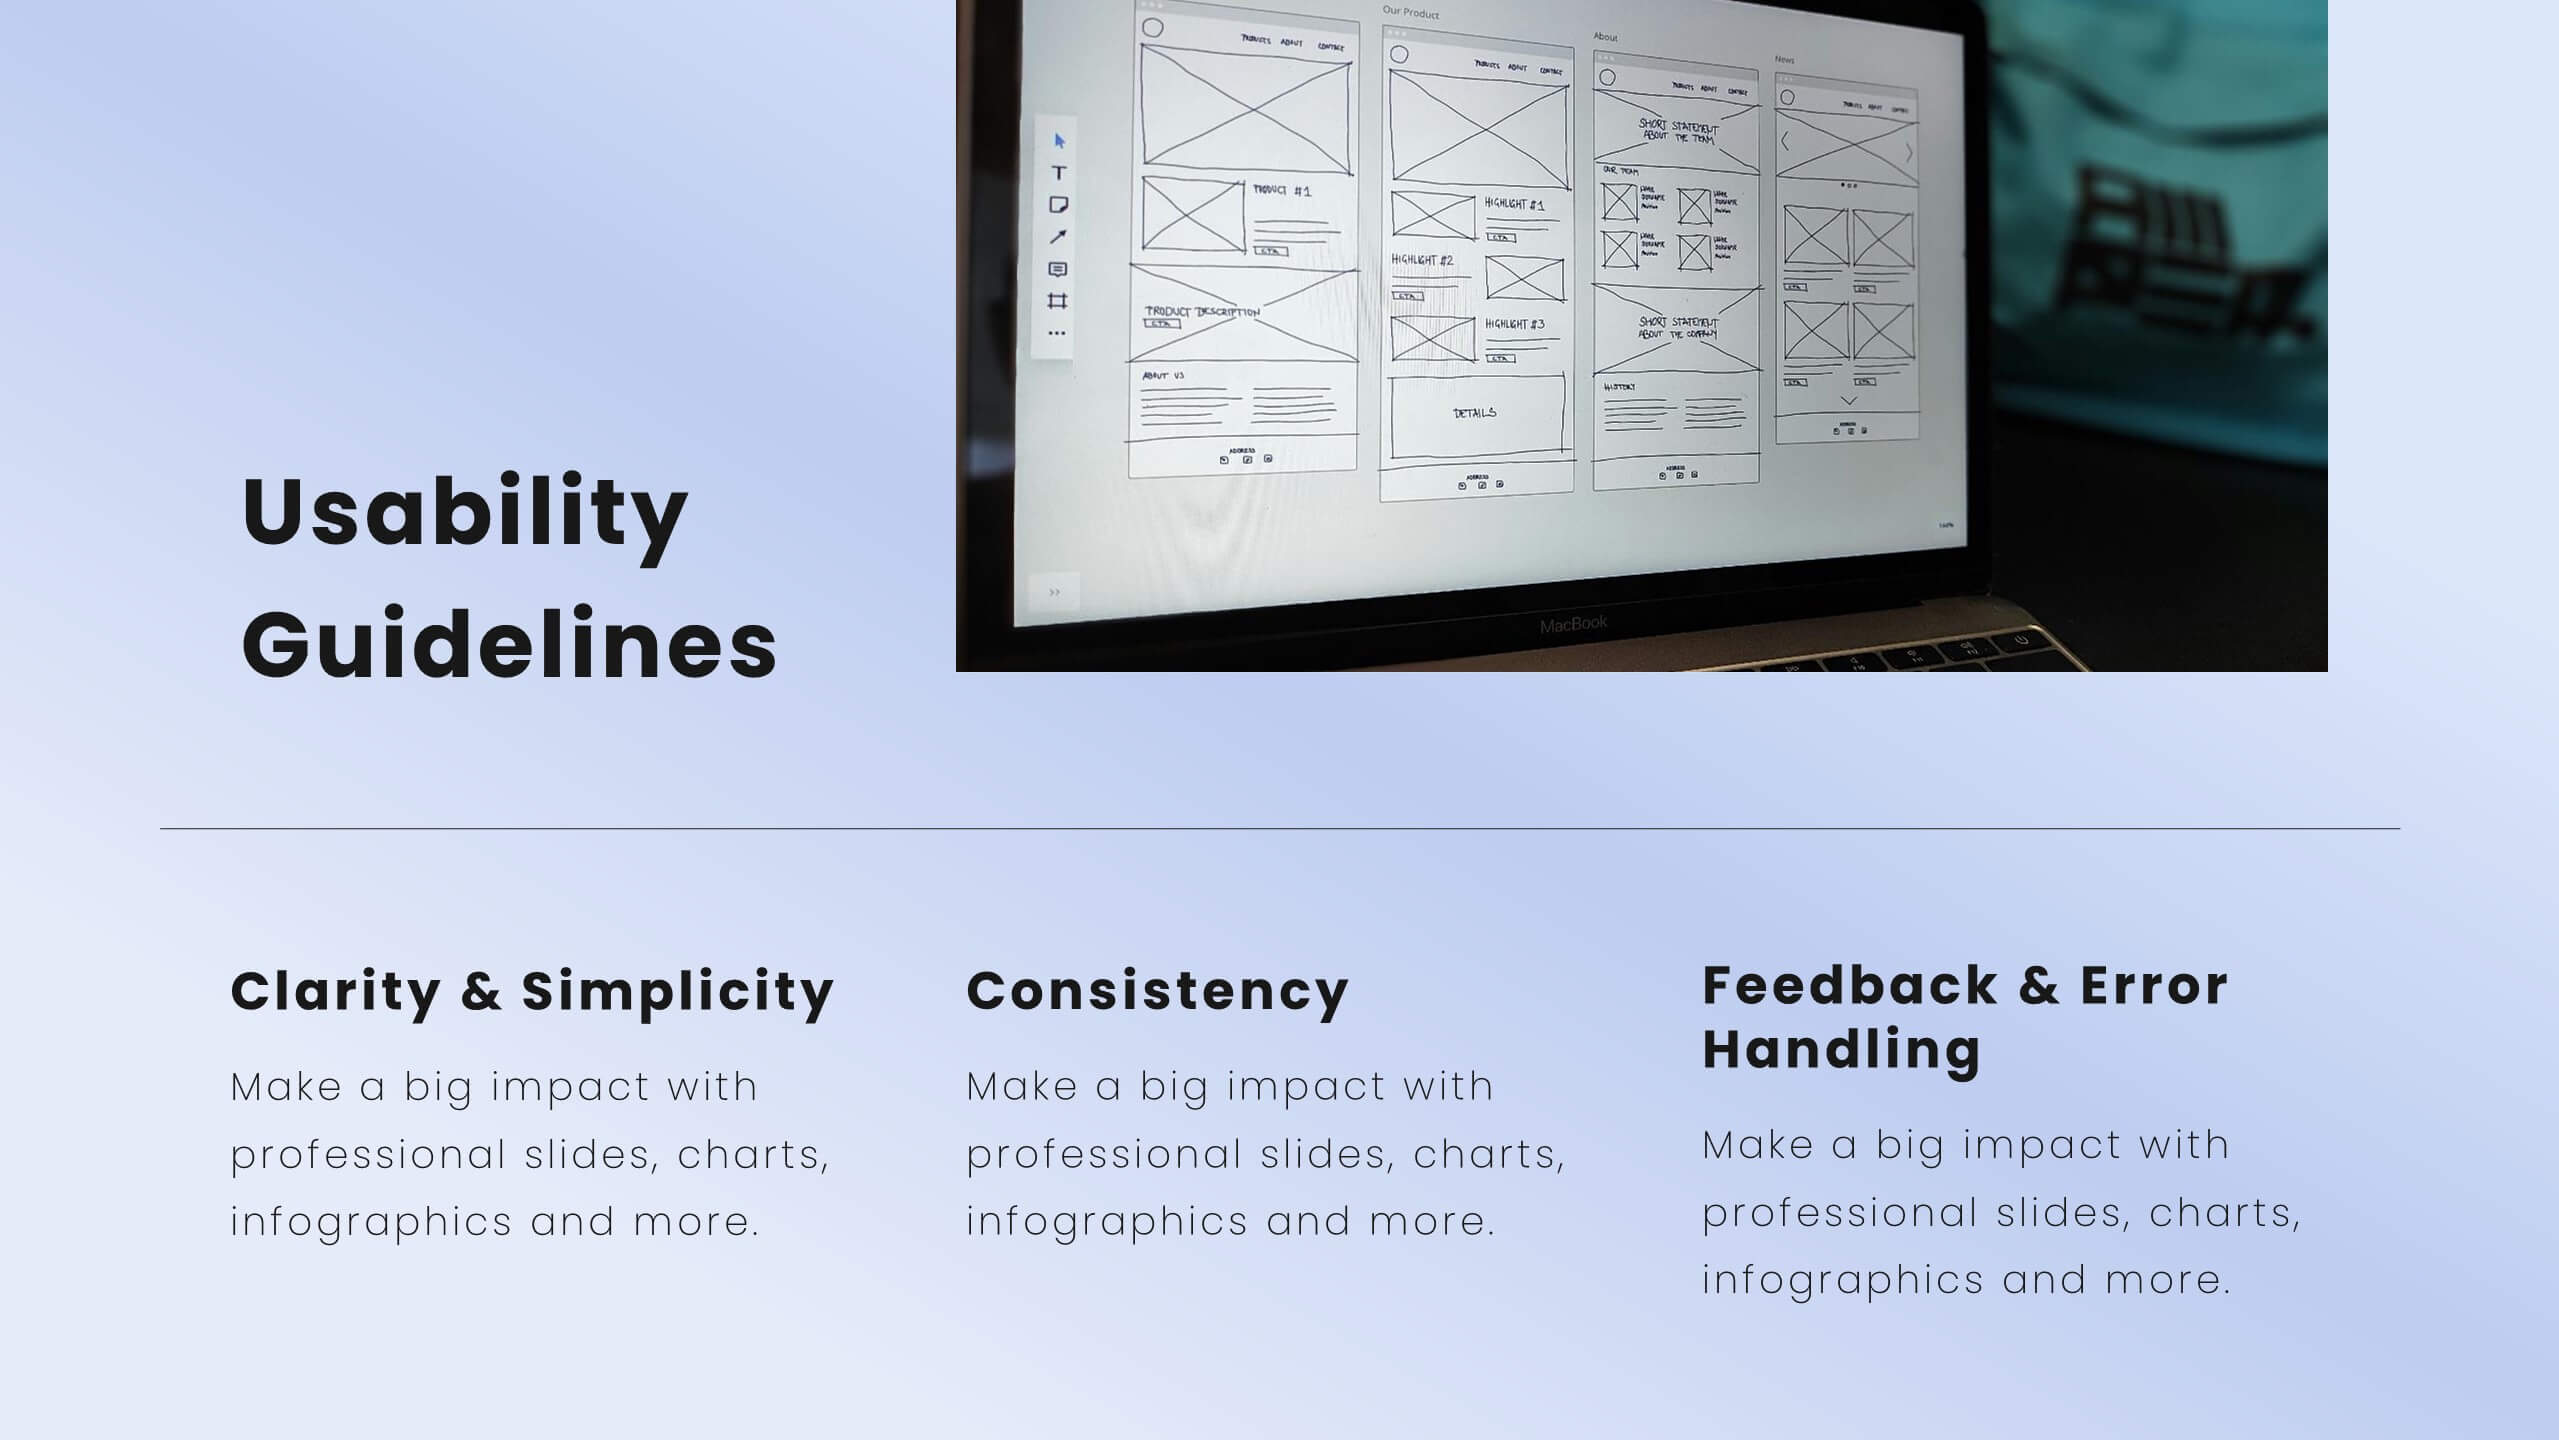
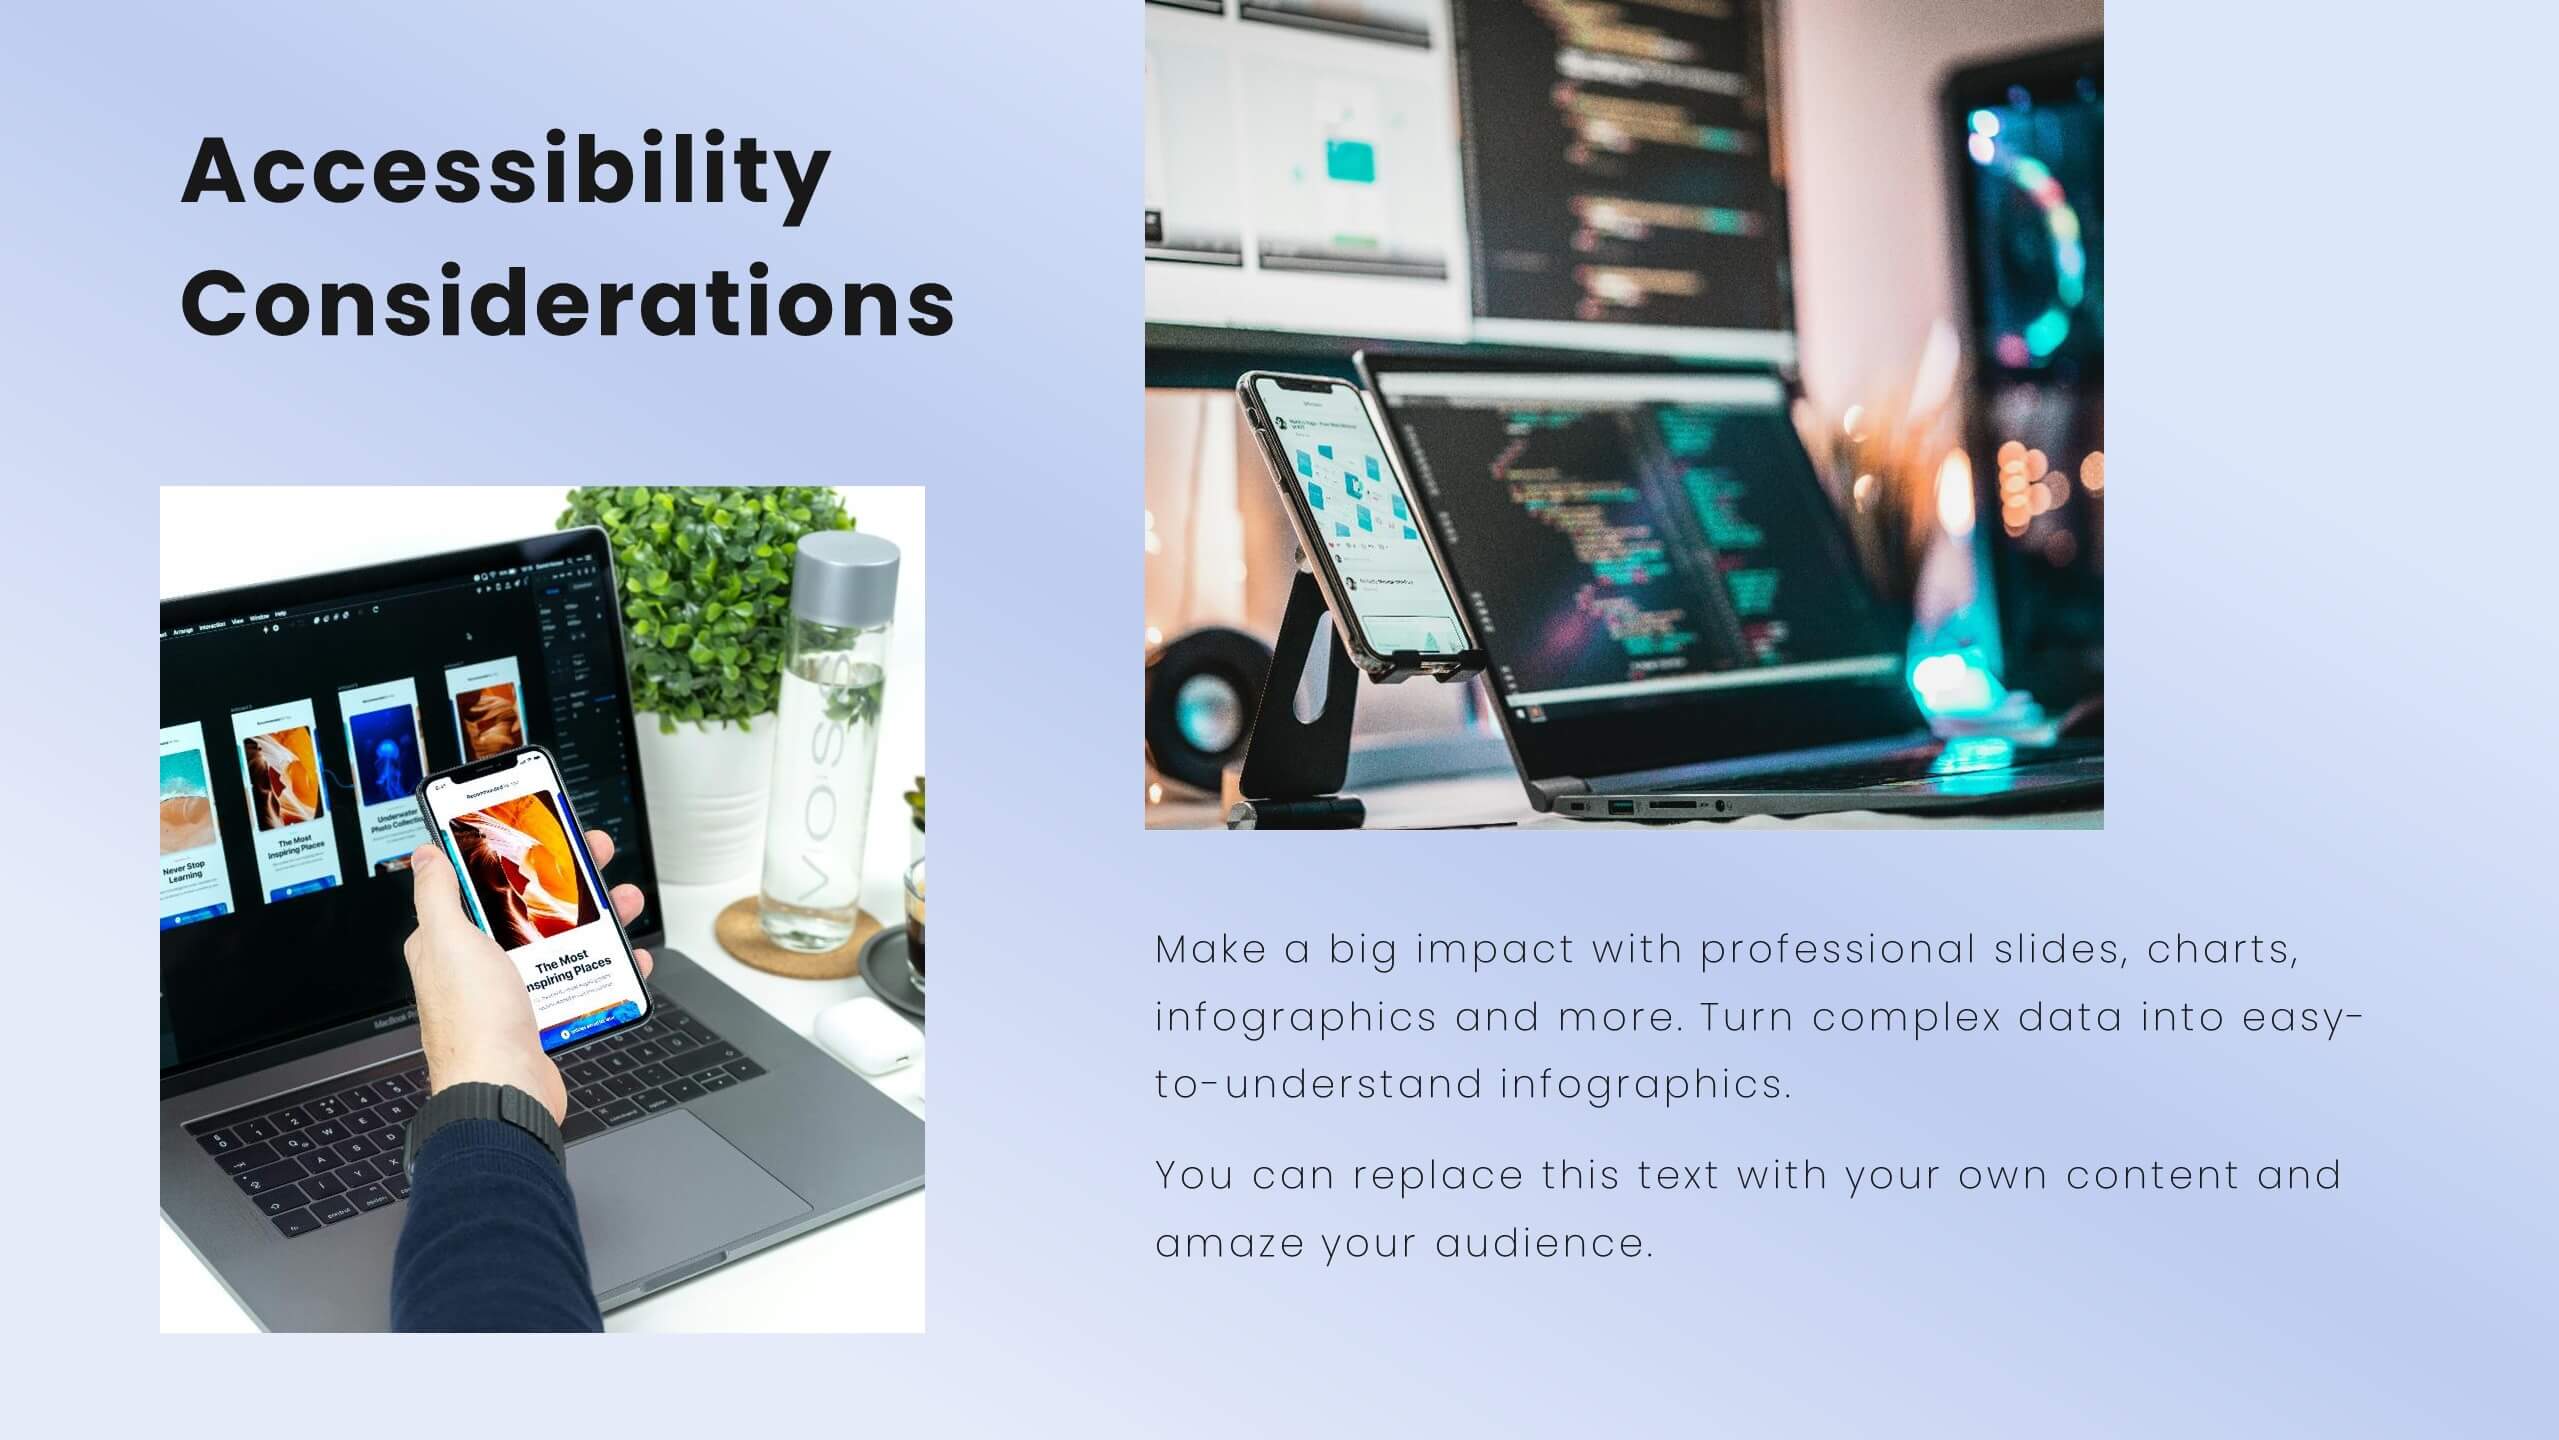
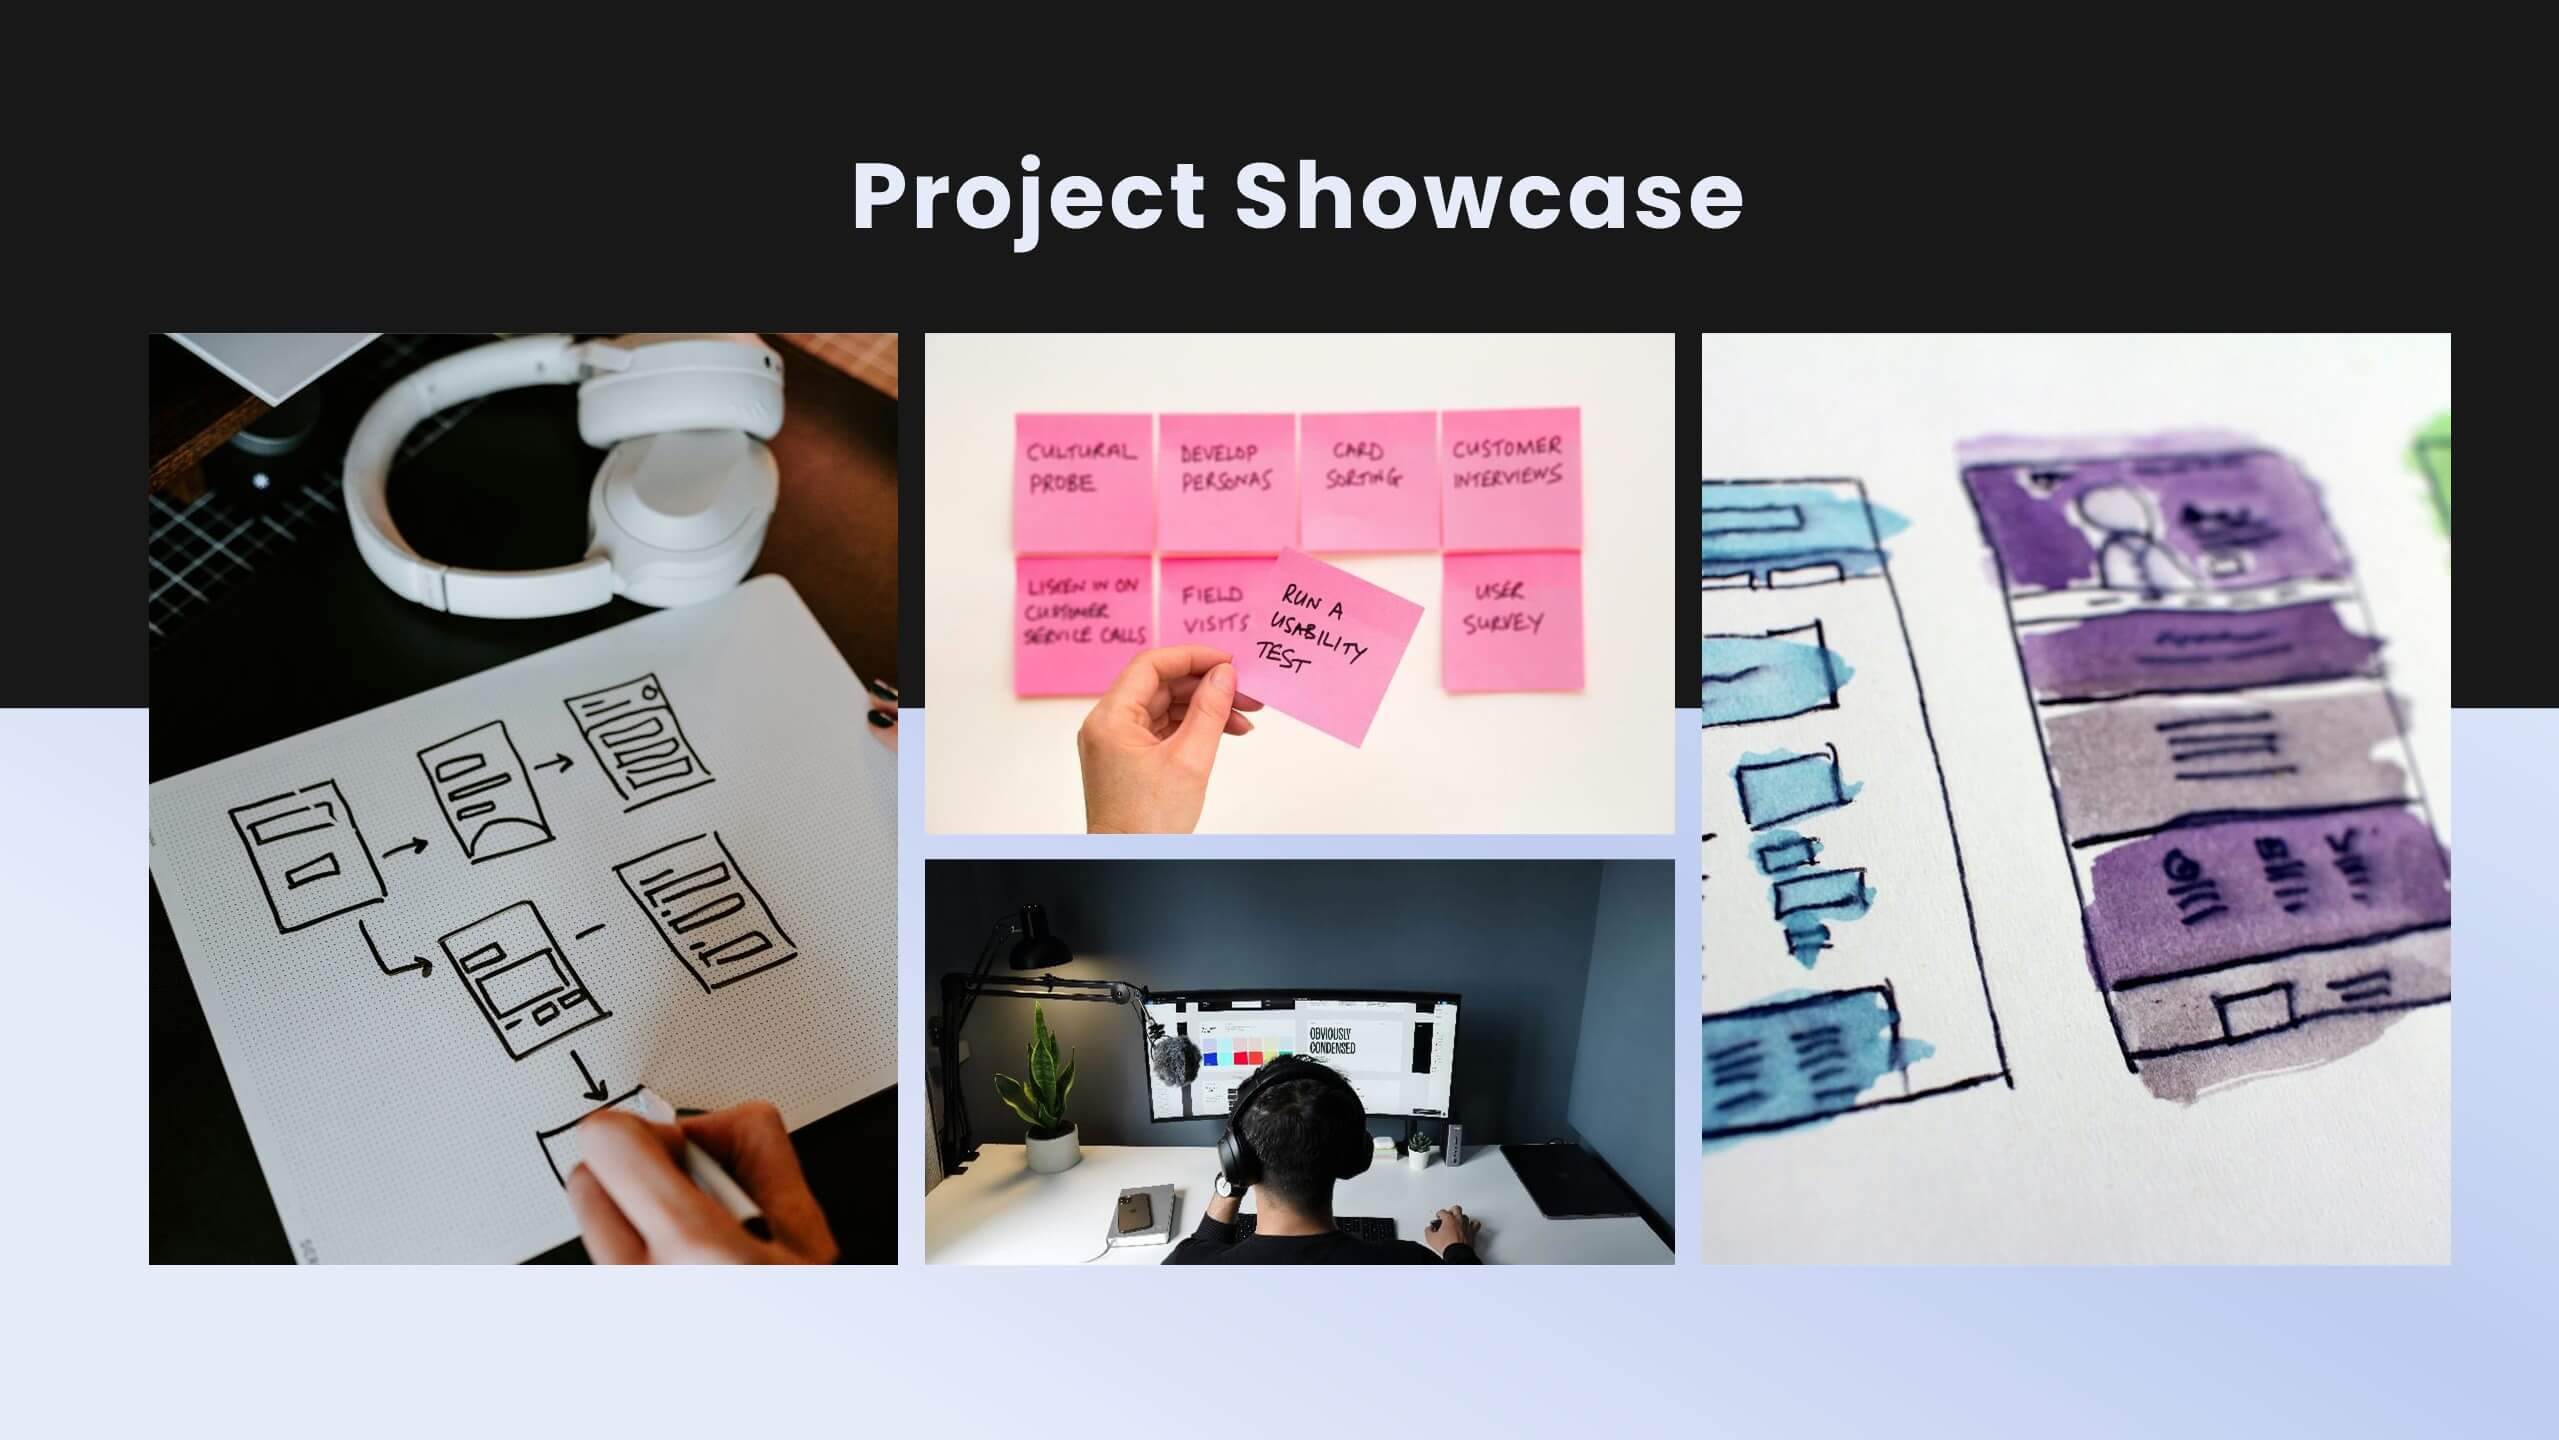
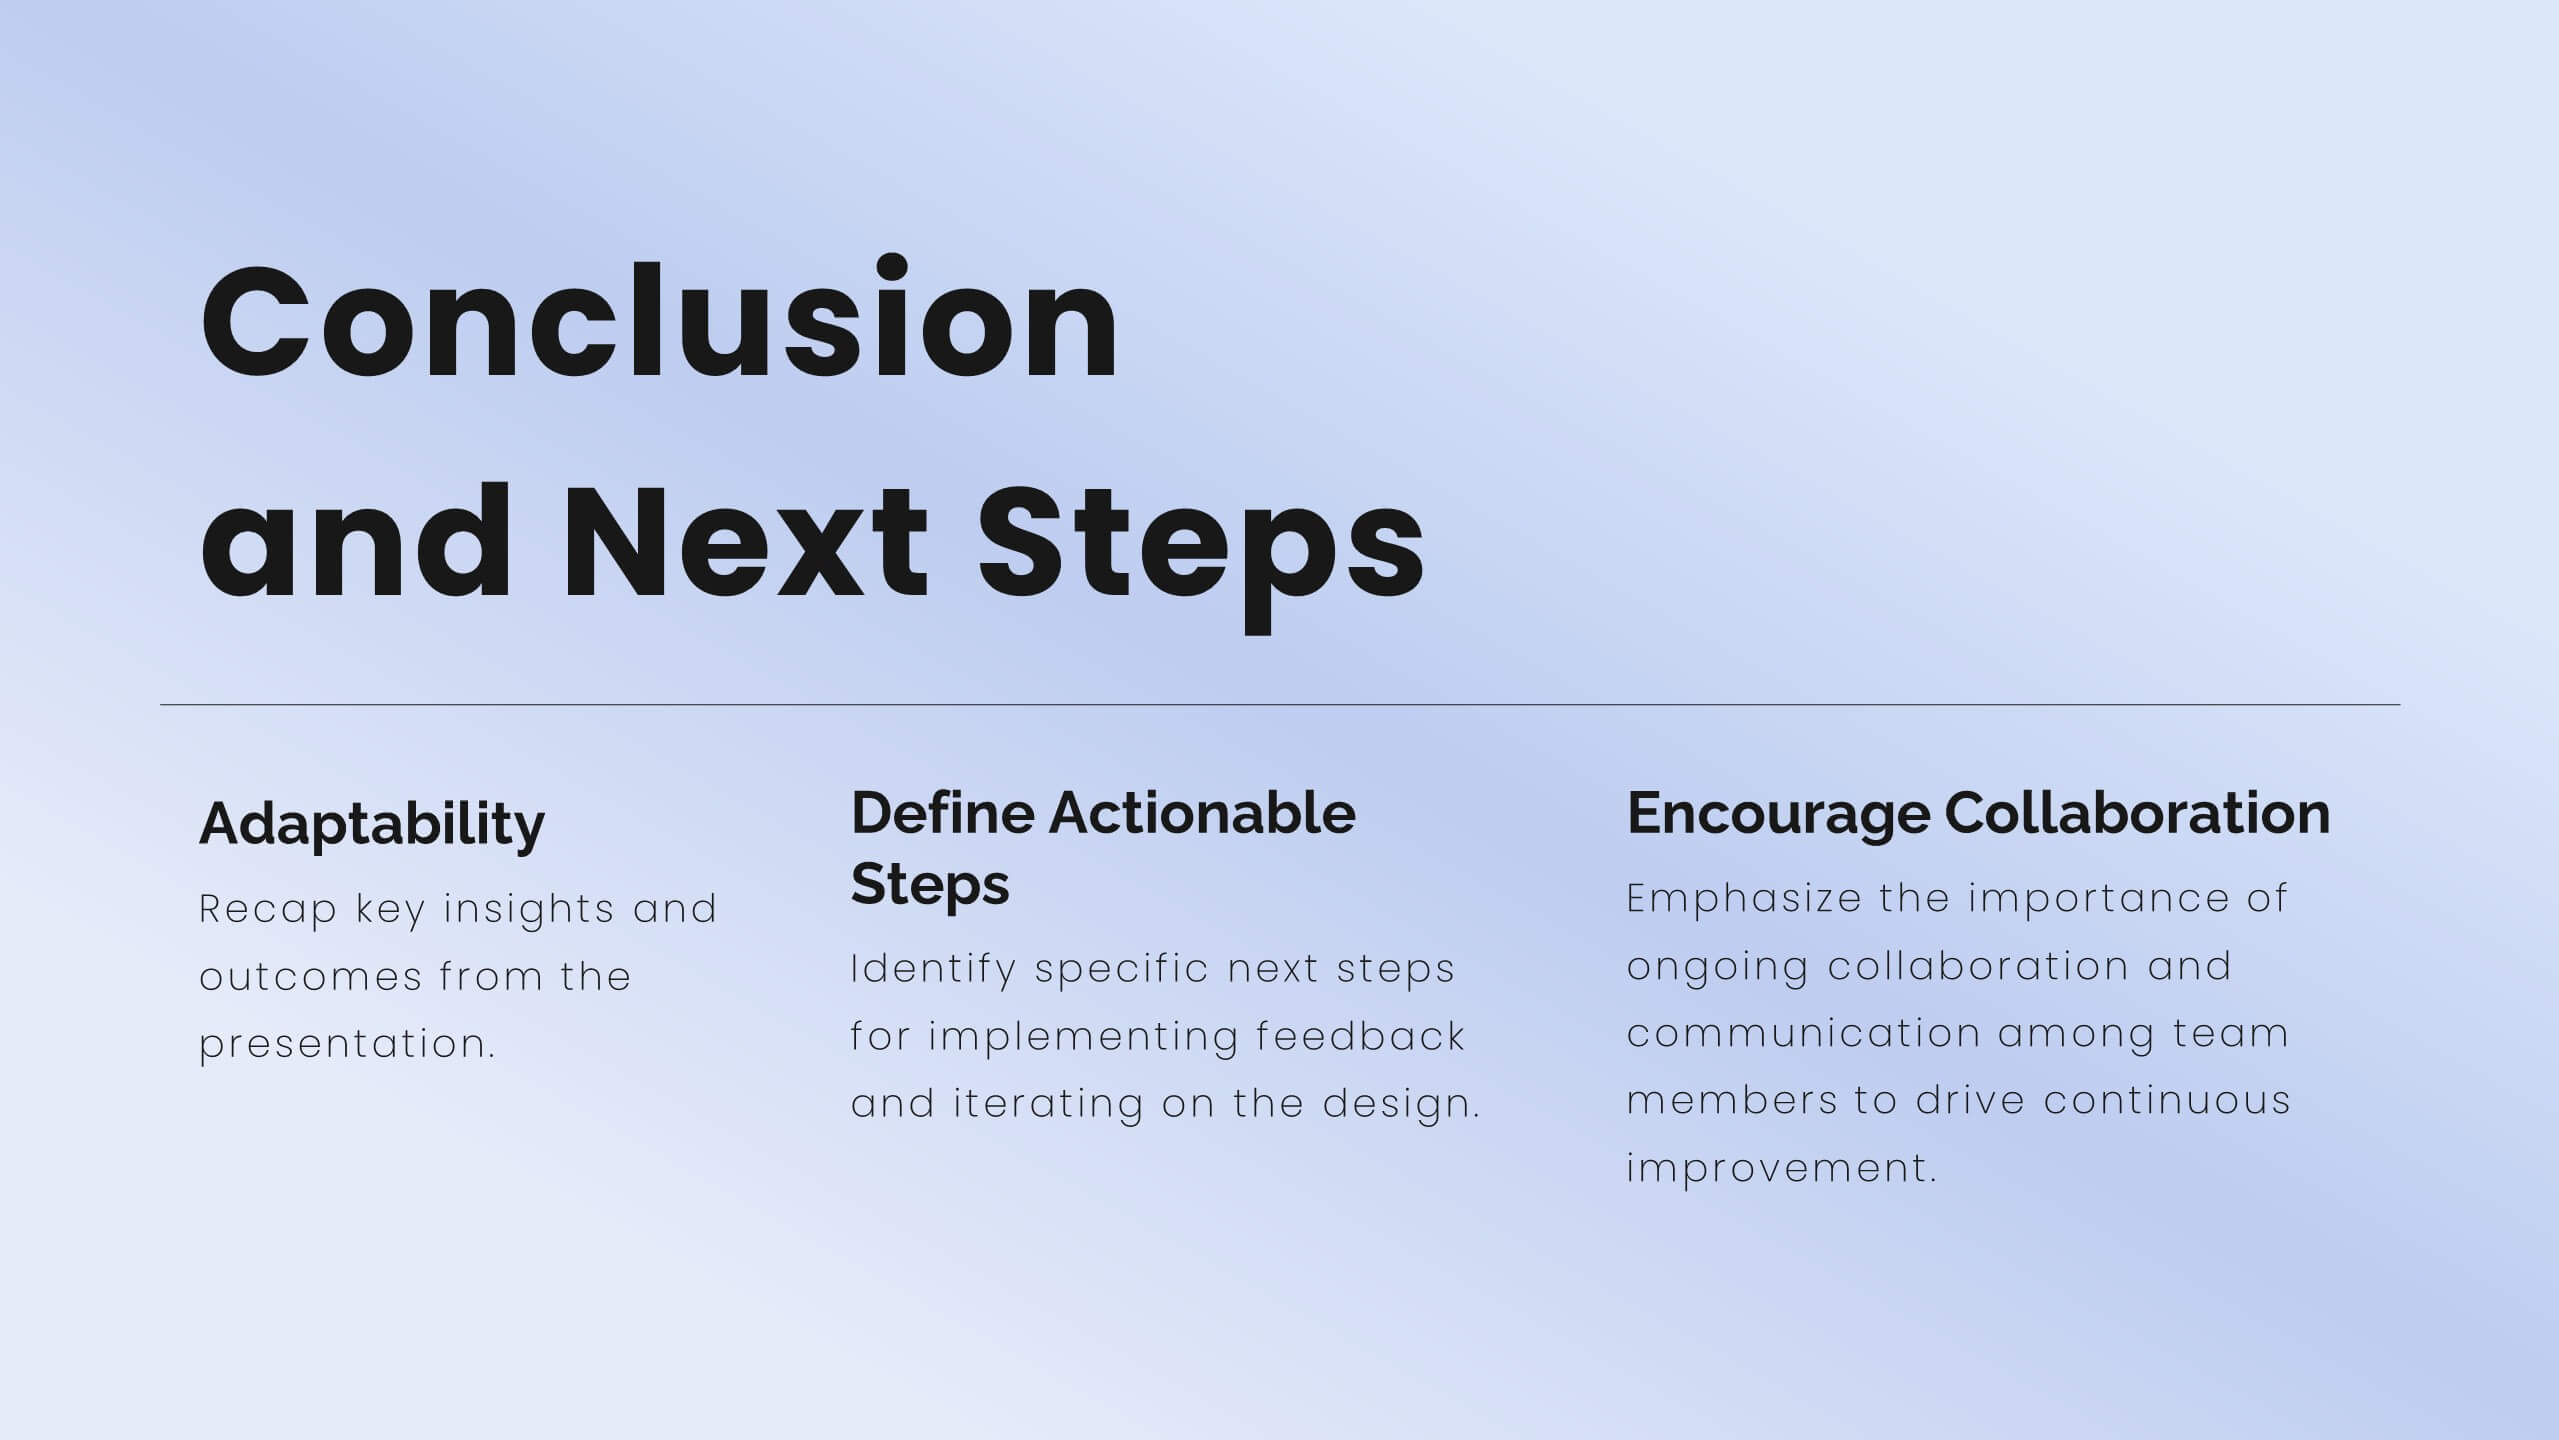
Jigsaw User Experience Proposal Presentation
Enhance user experience with this comprehensive UX proposal template! Perfect for outlining user research, personas, and design principles. Ideal for UX/UI designers aiming to present their strategies and solutions. Compatible with PowerPoint, Keynote, and Google Slides, this template ensures your UX proposals are clear, professional, and impactful. Create exceptional user experiences today!


7 diapositivas
Modern Food Menu Presentation
Bring your ideas to the table with a clean and modern layout that turns any food-related content into an easy, visually appealing story. This presentation helps you showcase dishes, categories, or menu insights with clarity and style, making information simple to follow. Fully compatible with PowerPoint, Keynote, and Google Slides.


4 diapositivas
HR Policies and Employee Management Presentation
Clearly outline your workplace strategies with this HR Policies and Employee Management slide. Featuring four color-coded segments alongside an illustration of employee analysis, this layout is ideal for presenting onboarding steps, employee benefits, internal policies, or training procedures. Fully editable and compatible with PowerPoint, Keynote, and Google Slides for seamless customization.


5 diapositivas
Strategic Budget Planning Forecasting
Tired of messy spreadsheets? This clean and creative template makes budget forecasting easier to visualize and share. Centered around a playful piggy bank illustration, it lets you outline strategic goals, savings plans, and key metrics in a format that’s easy to follow. Fully compatible with PowerPoint, Keynote, and Google Slides.


6 diapositivas
Business Strategy Pyramid Presentation
Outline your strategic priorities with clarity using the Business Strategy Pyramid Presentation. This template features a five-step 3D pyramid that highlights key business goals, initiatives, or stages. Each layer includes icons and numbered sections for easy interpretation. Ideal for strategy meetings, executive briefings, and growth plans. Fully editable in PowerPoint, Keynote, and Google Slides.