


Características


¿Tienes alguna pregunta?
Recomendar


7 diapositivas
Milestones Infographic Presentation Template
Our milestones infographic template includes a professional background and imagery to create a high-quality presentation that’s sure to grab your audience’s attention. This template is full of visual and engaging elements that will draw your audience in. It's a great starting point to make your own presentation, or to use as a template for future presentations. All slides are fully editable in PowerPoint so you can add and change text and images as desired, It's very easy to edit and customize the shapes and colors. Use this high-resolution template to present your topic in a professional way!


6 diapositivas
Business Sustainability Performance Report Presentation
Showcase your company’s sustainability efforts with this modern infinity-loop infographic. Perfect for environmental reports, CSR metrics, or circular economy overviews. Highlight key percentages and goals across three impact areas. Fully editable and compatible with PowerPoint, Keynote, and Google Slides—ideal for presenting performance results in a clear, engaging, and professional format.


5 diapositivas
Market Expansion Strategies in South America Map Presentation
Explore opportunities with the Market Expansion Strategies in South America Map template, showcasing key business insights across various regions in South America. This presentation is your gateway to understanding market dynamics and planning strategic moves. It features a customizable map with percentage indicators, ideal for displaying market growth and regional trends. Compatible with PowerPoint, Keynote and Google Slides.


7 diapositivas
Environment United States Map Infographic
An Environment United States Map refers to a map that displays various environmental aspects or features across the United States. This template is a powerful tool for visualizing sustainability initiatives and environmental data across the diverse landscapes of the United States. With a combination of insightful graphics, this template enables you to present a compelling narrative about the nation's environmental efforts. This Infographic is a call to action to protect and preserve our planet, highlighting the efforts that are shaping a more sustainable and harmonious coexistence with nature.


8 diapositivas
Health and Safety Training
Create impactful safety briefings with this visual slide designed around a caution-sign layout. Perfect for outlining training modules, compliance steps, or workplace hazard procedures, it presents four key points using icons and color-coded elements. Fully customizable in PowerPoint, Keynote, and Google Slides.


24 diapositivas
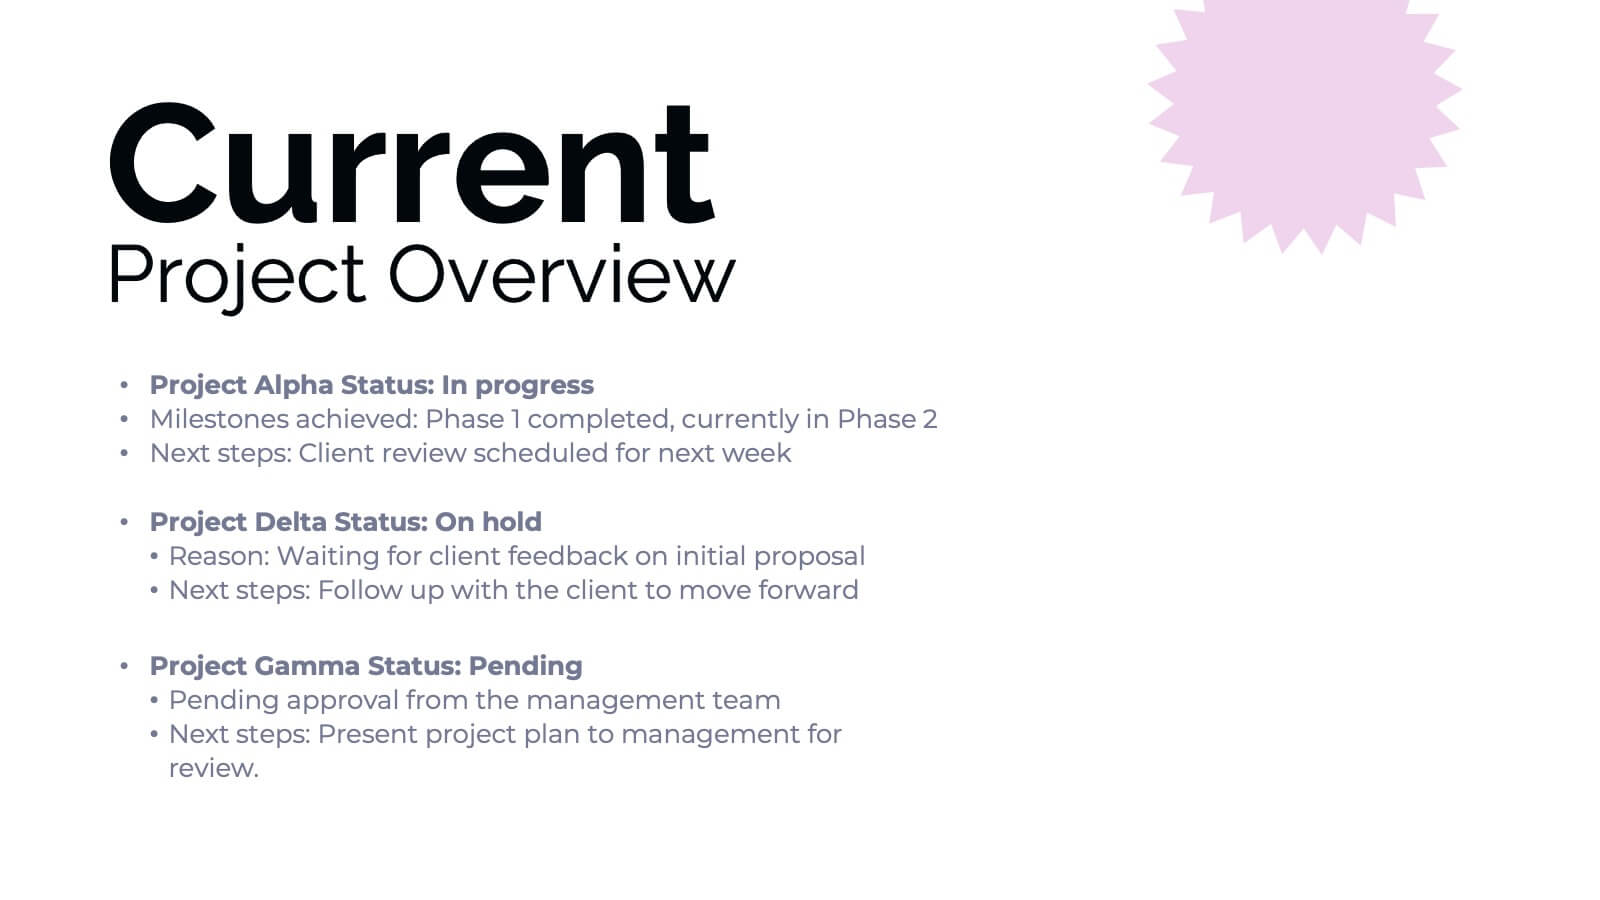
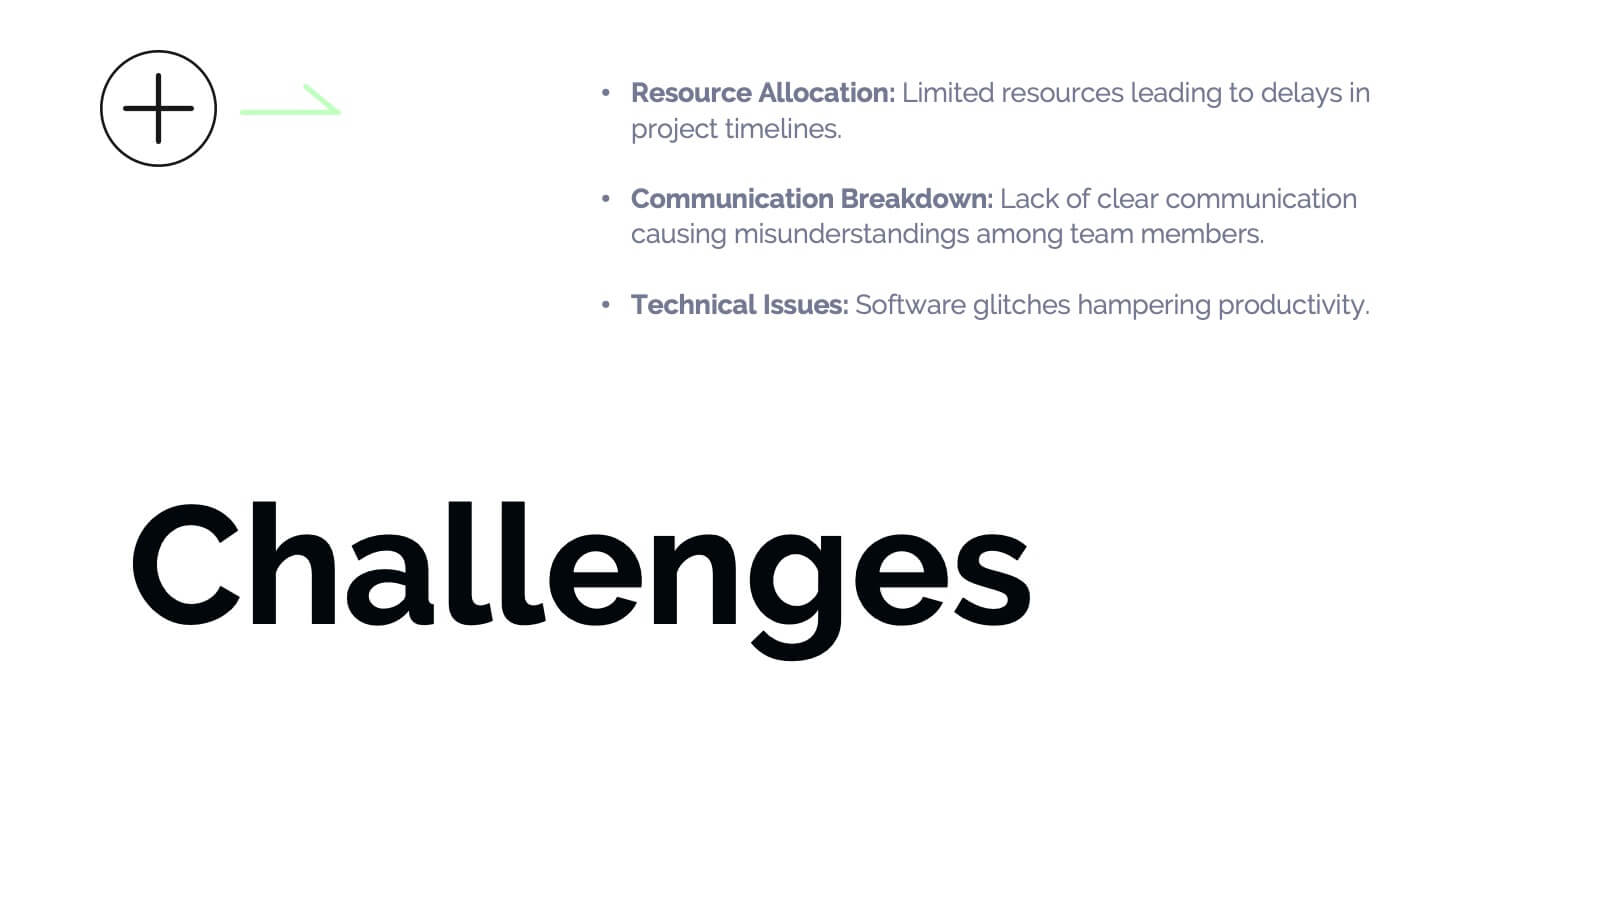
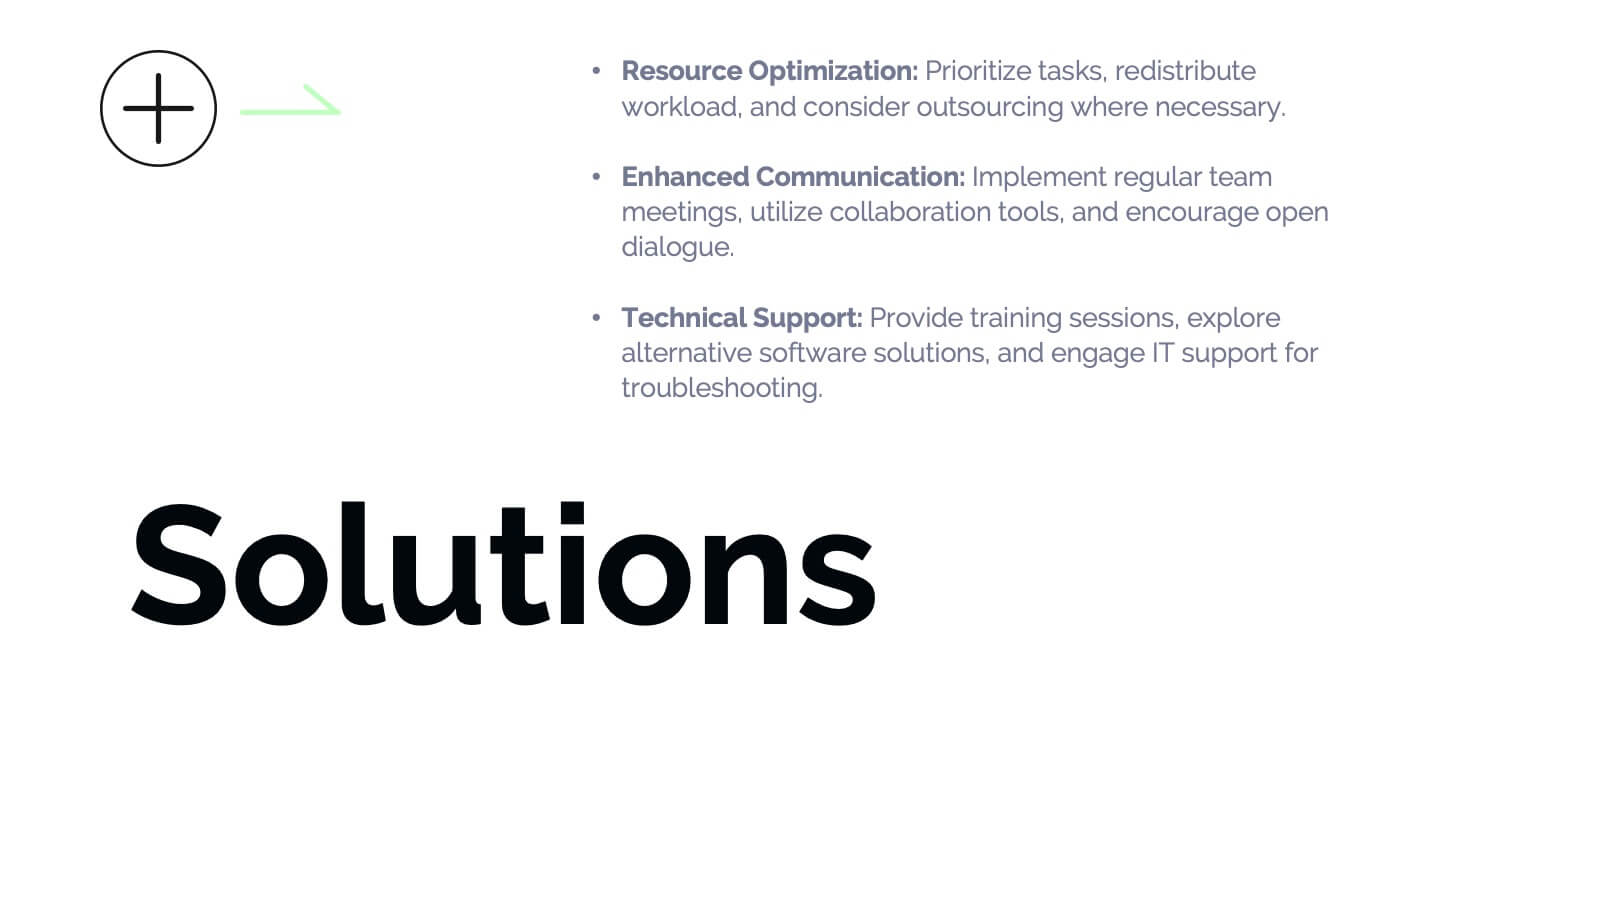
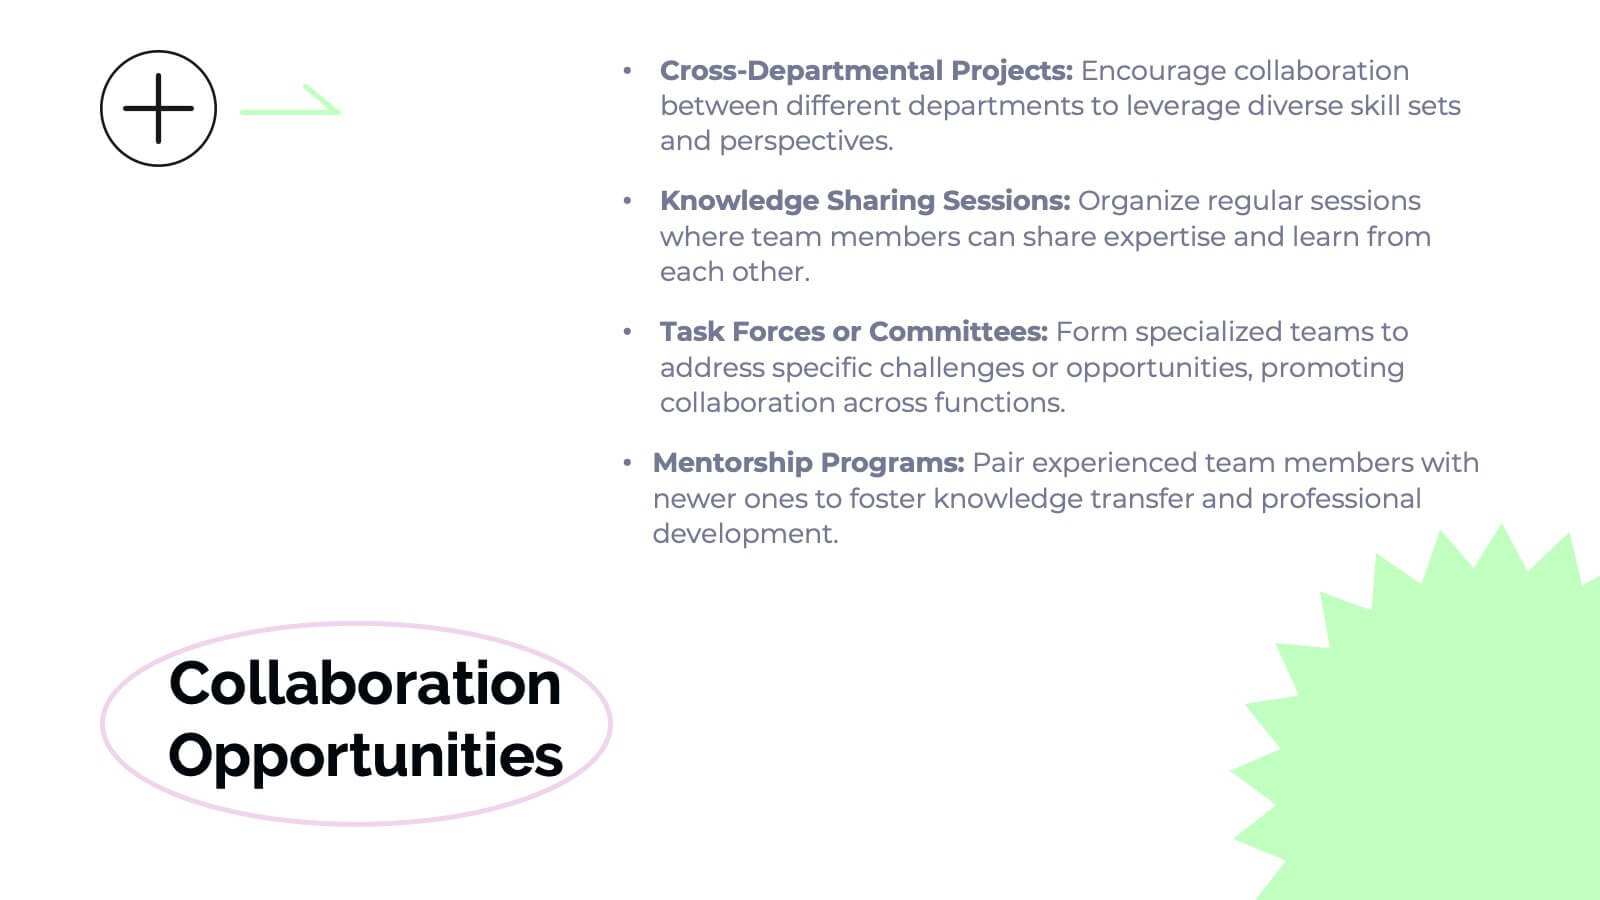
Banshee Business Operations Plan Presentation
Streamline your business operations with this comprehensive presentation template! From team updates and key achievements to challenges and solutions, every aspect of your business plan is covered. Ideal for tracking performance metrics, resource allocation, and upcoming events, this design keeps your operations organized and efficient. Compatible with PowerPoint, Keynote, and Google Slides for seamless integration.


6 diapositivas
Hexagonal Grid for Process Mapping Presentation
Visualize your workflow with structure using the Hexagonal Grid for Process Mapping Presentation. This clean, geometric layout guides viewers through each phase of your process with clarity and consistency. Ideal for outlining steps, stages, or interconnected tasks in a modern format. Fully editable in Canva, PowerPoint, Keynote, and Google Slides.


8 diapositivas
Green Business Sustainability Strategy Presentation
Promote eco-friendly business strategies with the Green Business Sustainability Strategy infographic. Featuring a circular flow diagram, this template highlights key sustainable initiatives, resource management, and environmental impact strategies. Fully editable and compatible with PowerPoint, Keynote, and Google Slides.


7 diapositivas
Construction Management Infographic Presentation
A Construction Infographic is a visual representation of data related to the construction industry and processes. This templates uses colorful construction illustrations to presents data, statistics, and other information in a visually appealing way. You can uses this to cover a wide range of topics, including project timelines, budget breakdowns, safety statistics, materials usage, sustainability practices, and more. This infographic uses illustrations, icons, text boxes and other visual elements to help convey your information. This can be easily edited in Powerpoint, Keynote and Google Slides.


4 diapositivas
Green Business and Climate Goals Presentation
Bring your sustainability message to life with a fresh and vibrant layout that guides viewers through key milestones. This template helps communicate eco-friendly initiatives and climate strategies in a simple timeline format. Ideal for showcasing goals, progress, and impact. Fully compatible with PowerPoint, Keynote, and Google Slides for easy editing.


28 diapositivas
Pitch Deck Entrepreneur's Canvas Presentation
Sharpen your business presentation with this Pitch Deck template. It covers essential areas such as market opportunity, business model, and competitive analysis, designed for startups and entrepreneurs. Fully customizable and compatible with PowerPoint, Keynote, and Google Slides, it's ideal for impressing investors and partners with your business vision.


21 diapositivas
Sol Photography Portfolio Template Presentation
Showcase your creative work with this vibrant photography portfolio presentation template. It features sections for introductions, project descriptions, and accolades, making it perfect for photographers looking to display their style and collaborations. Compatible with PowerPoint, Google Slides, and Keynote, this template is designed to impress viewers with its dynamic layout and bright color scheme.


23 diapositivas
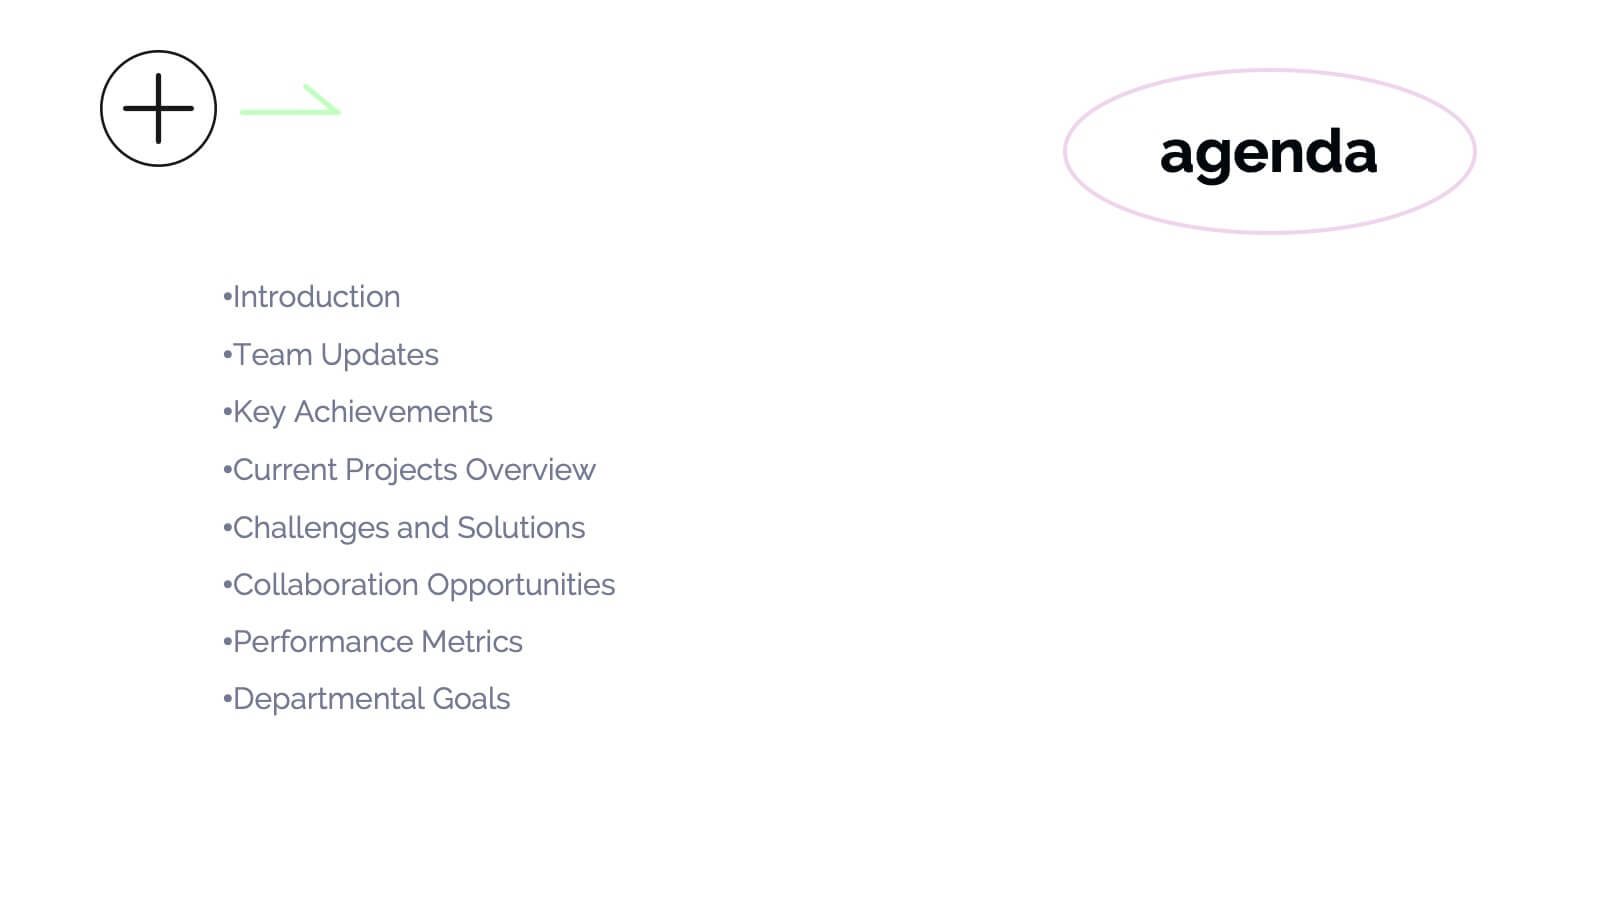
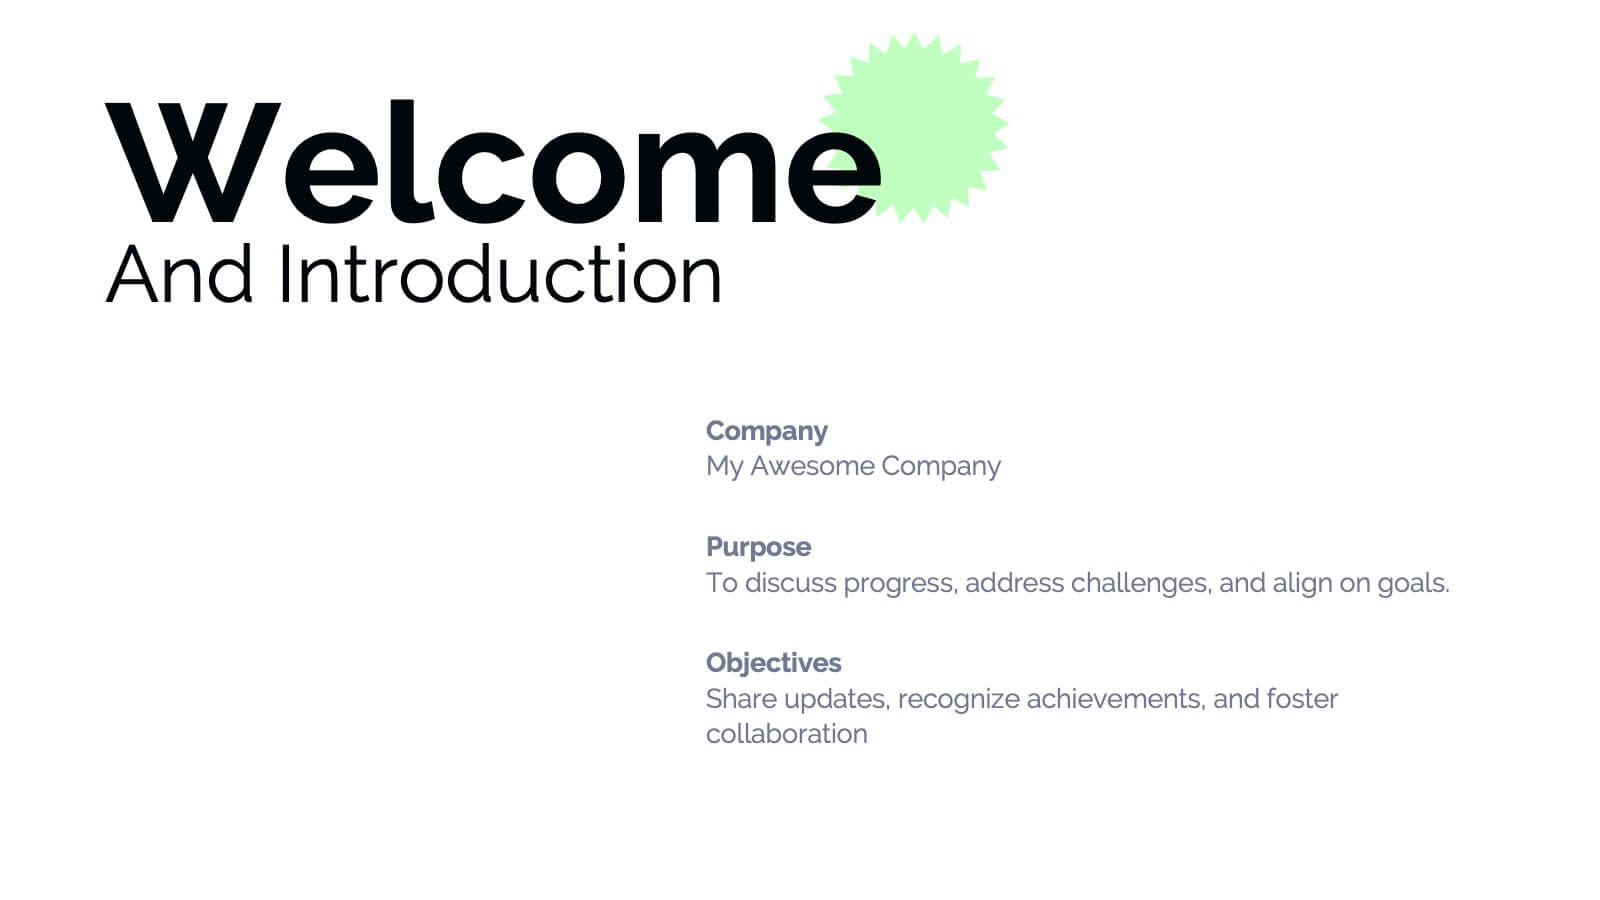
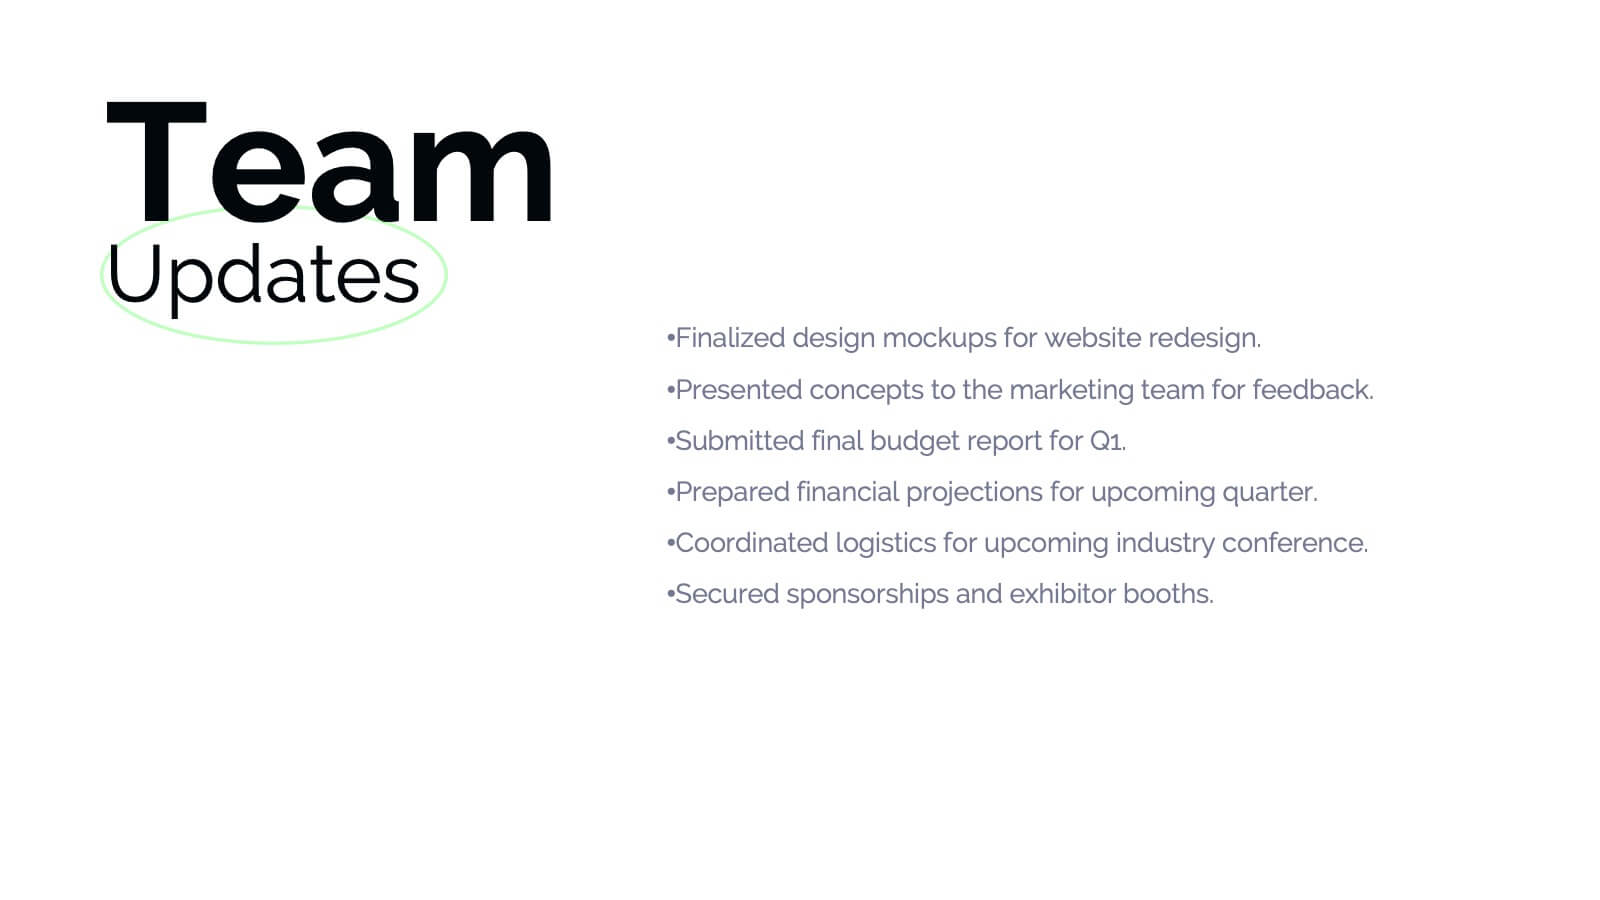
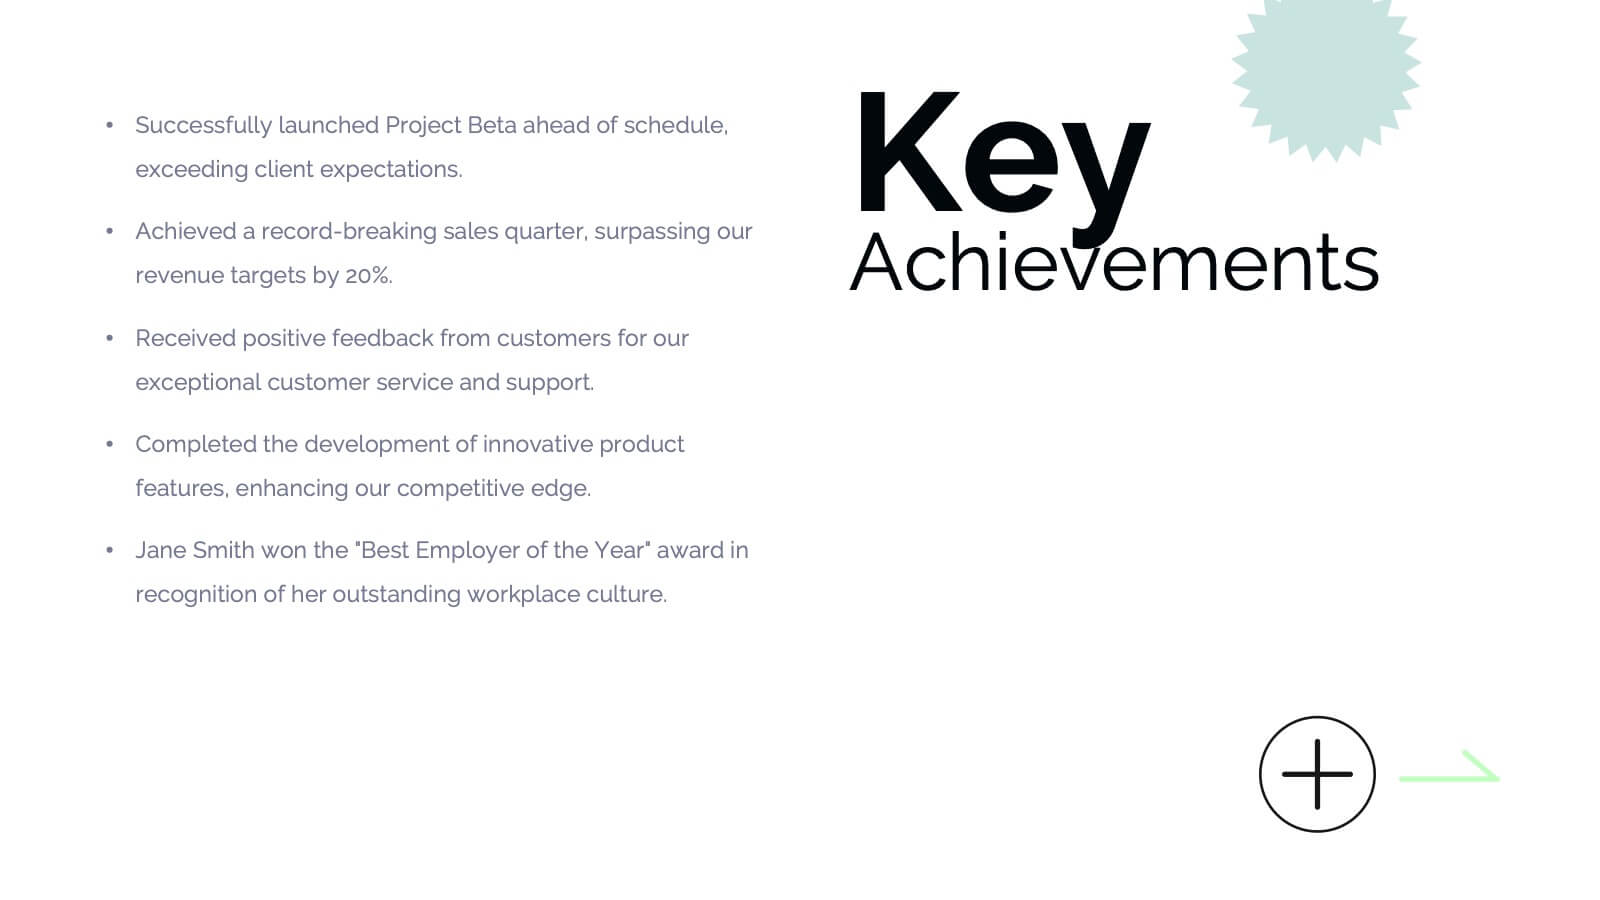
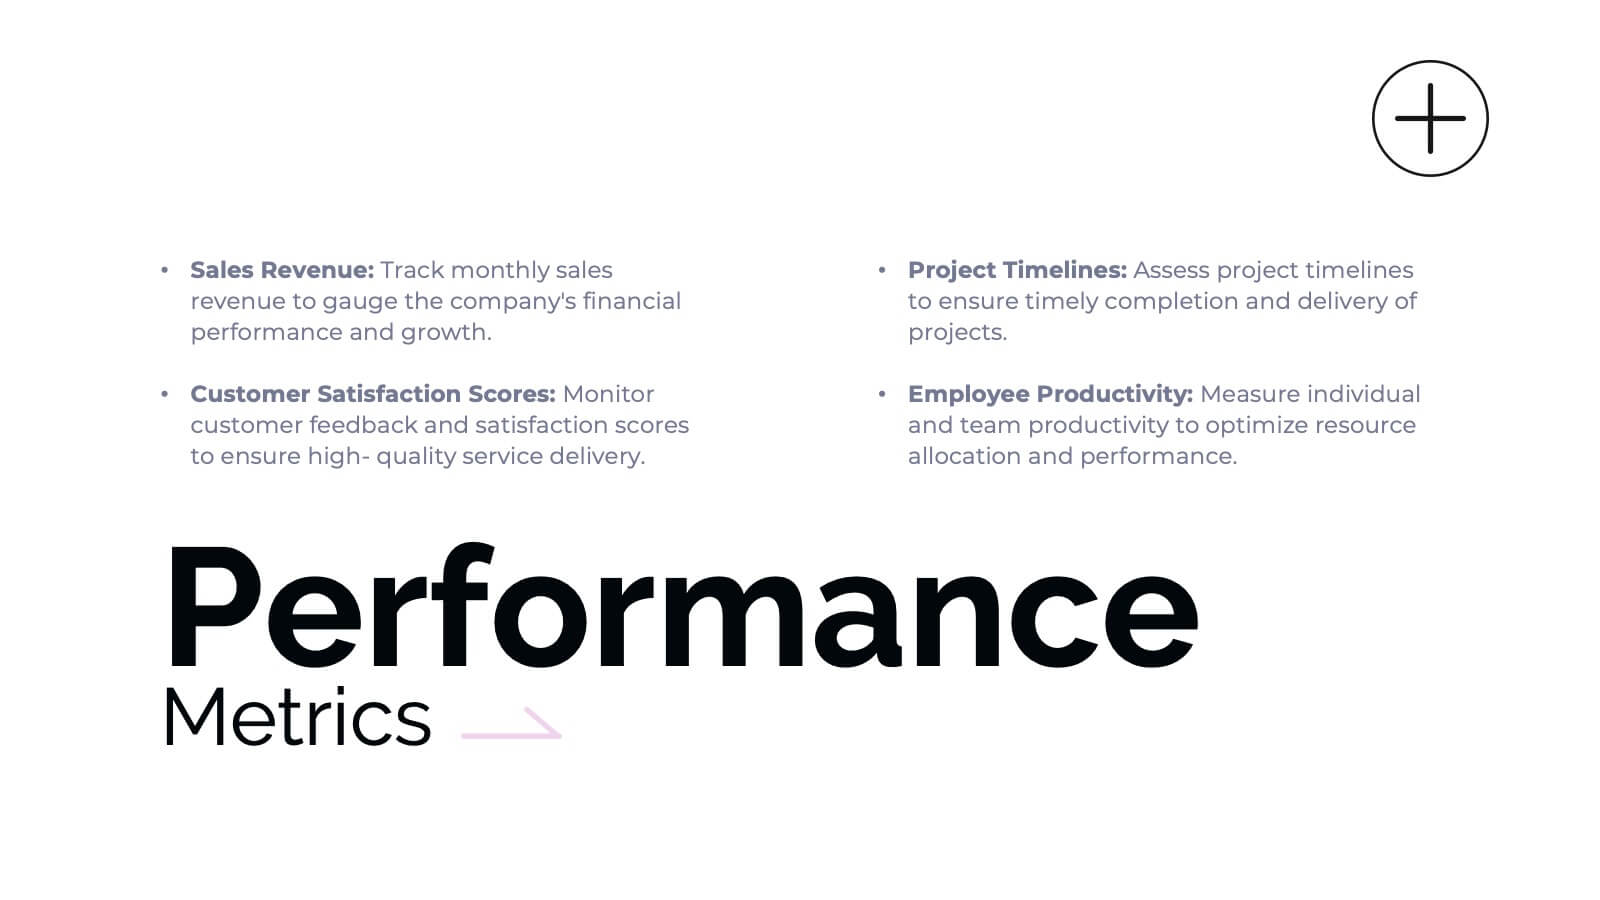
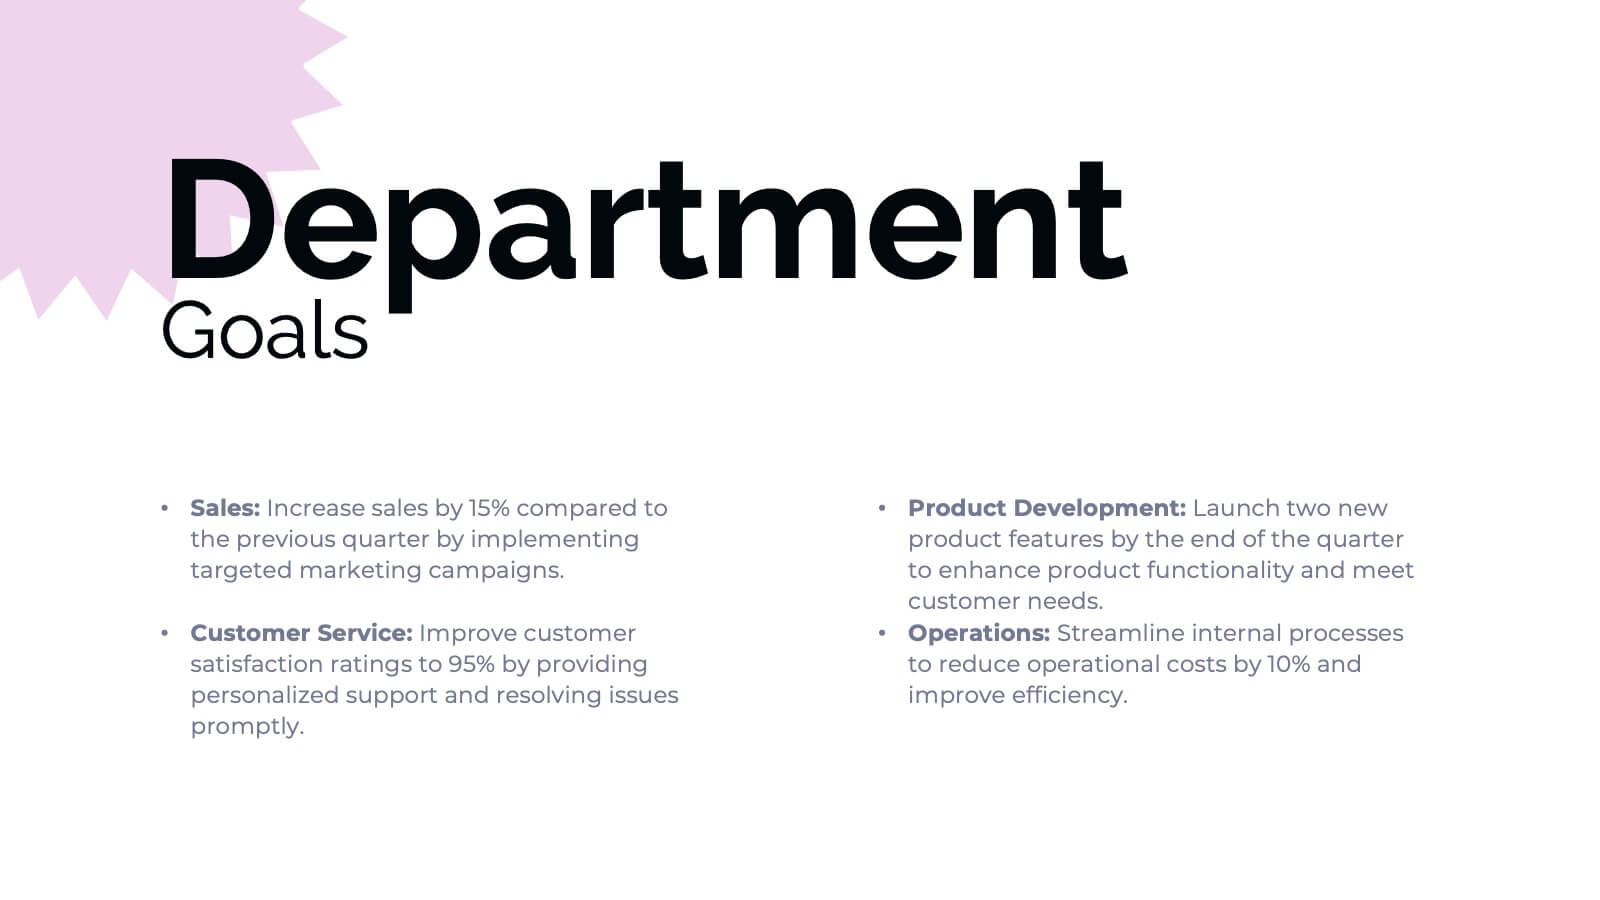
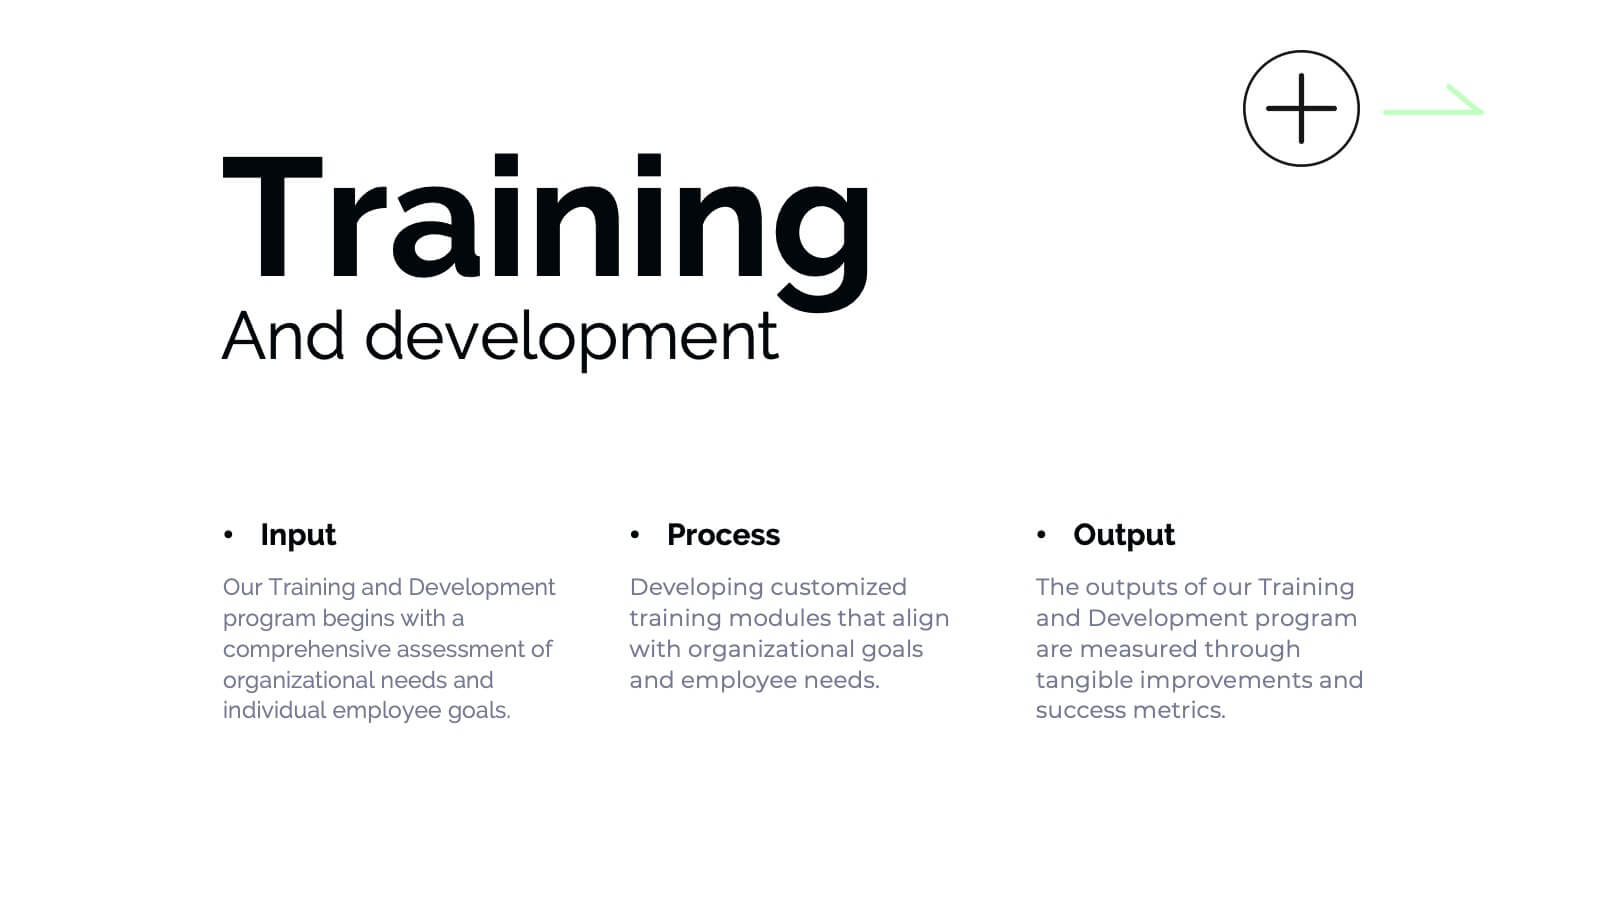
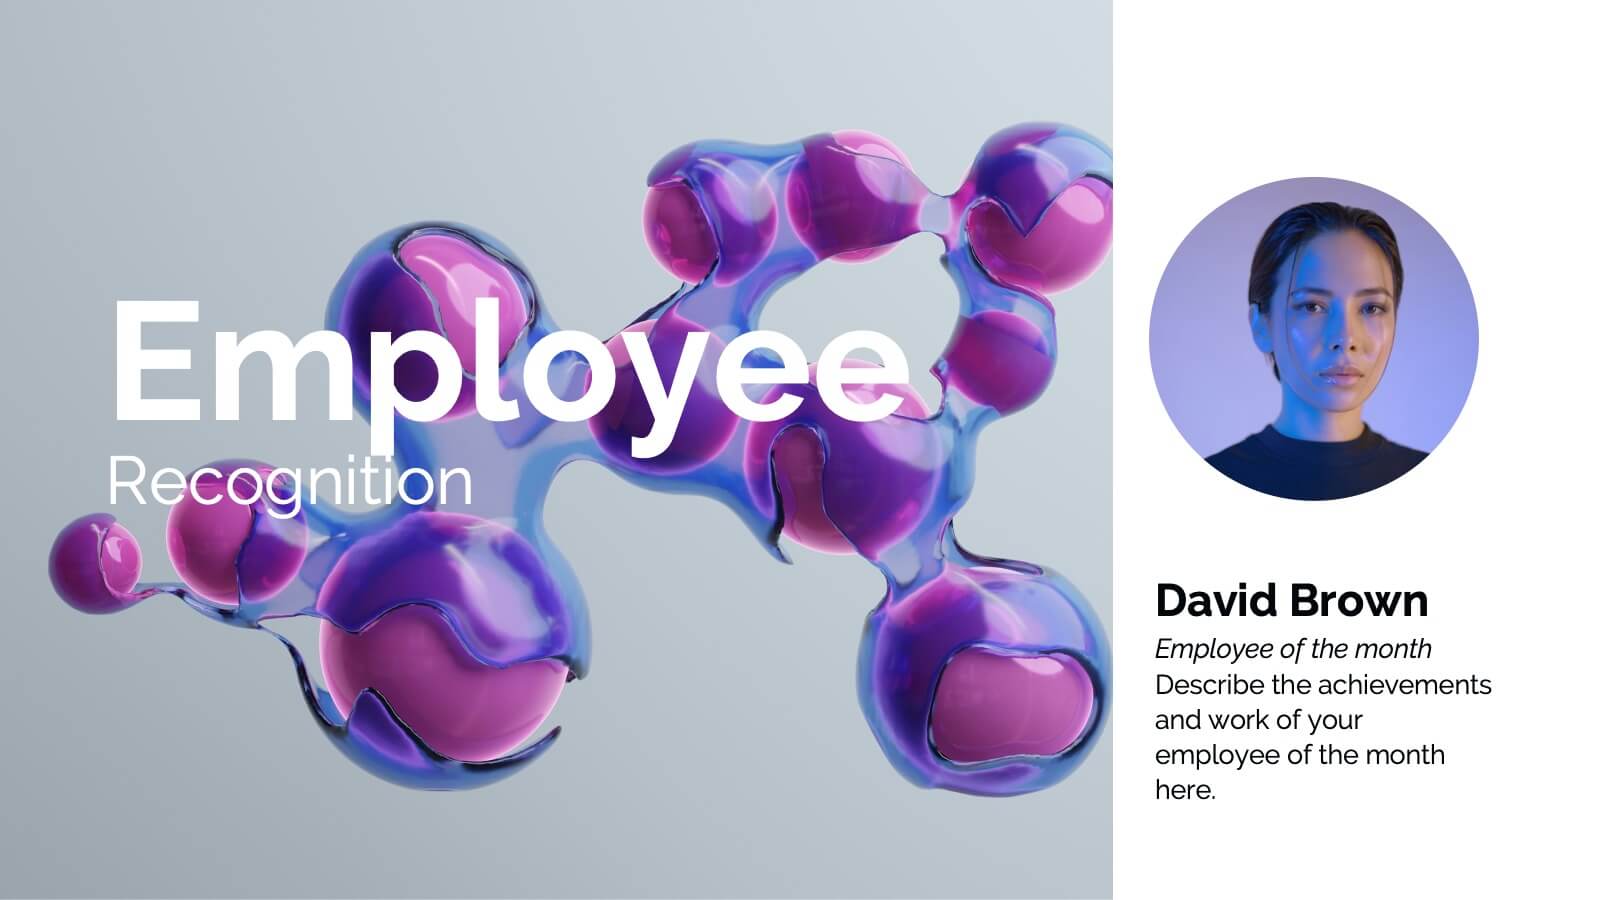
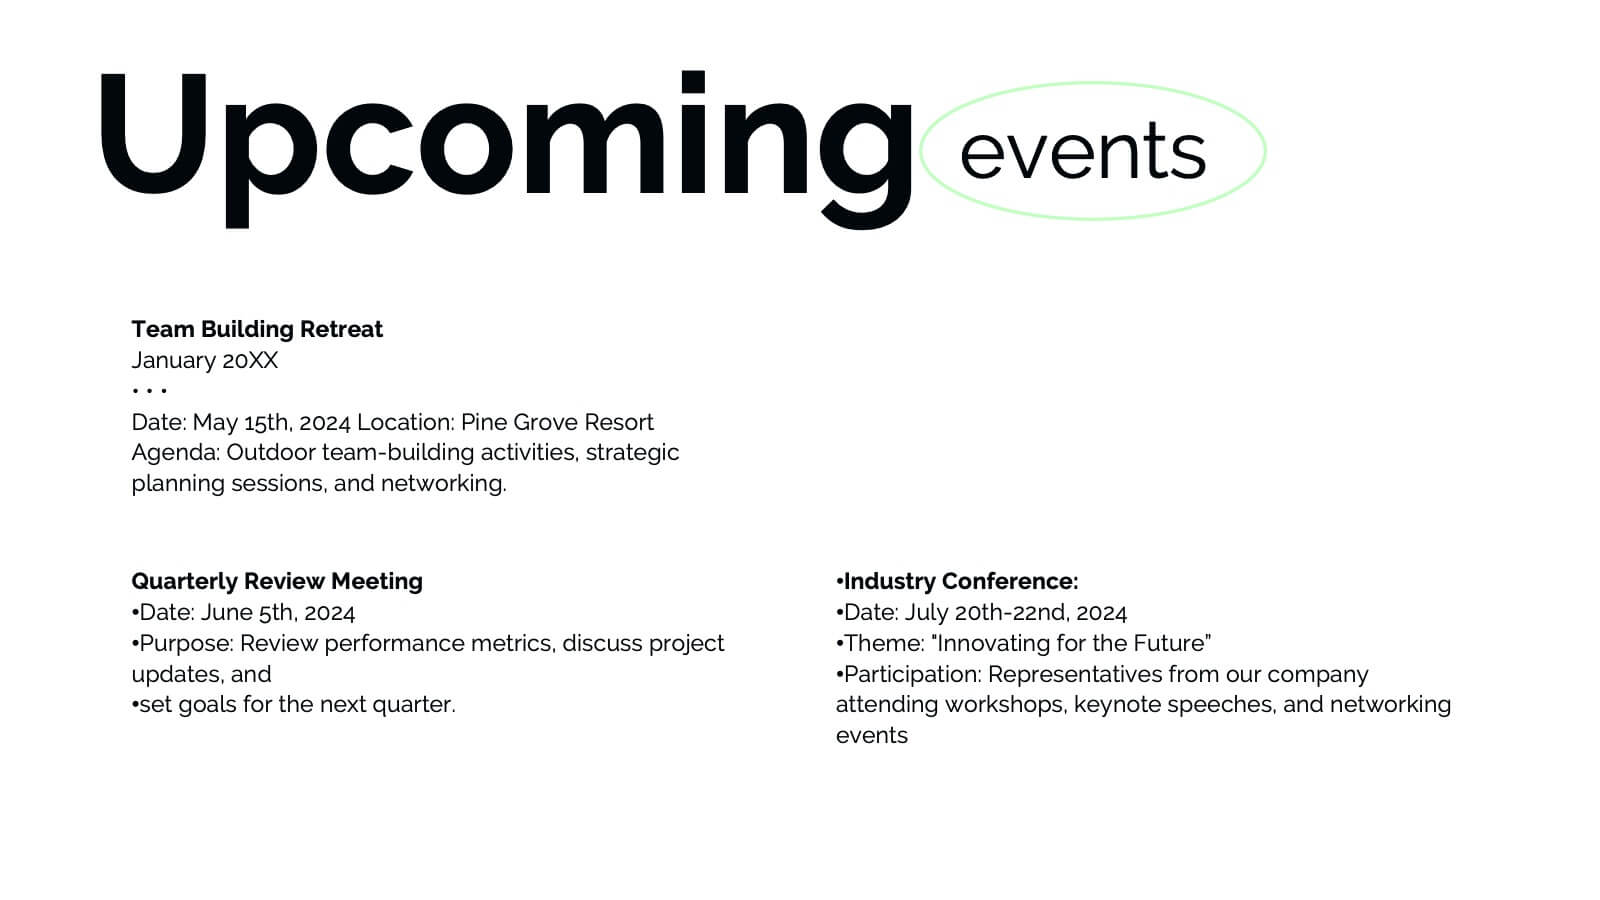
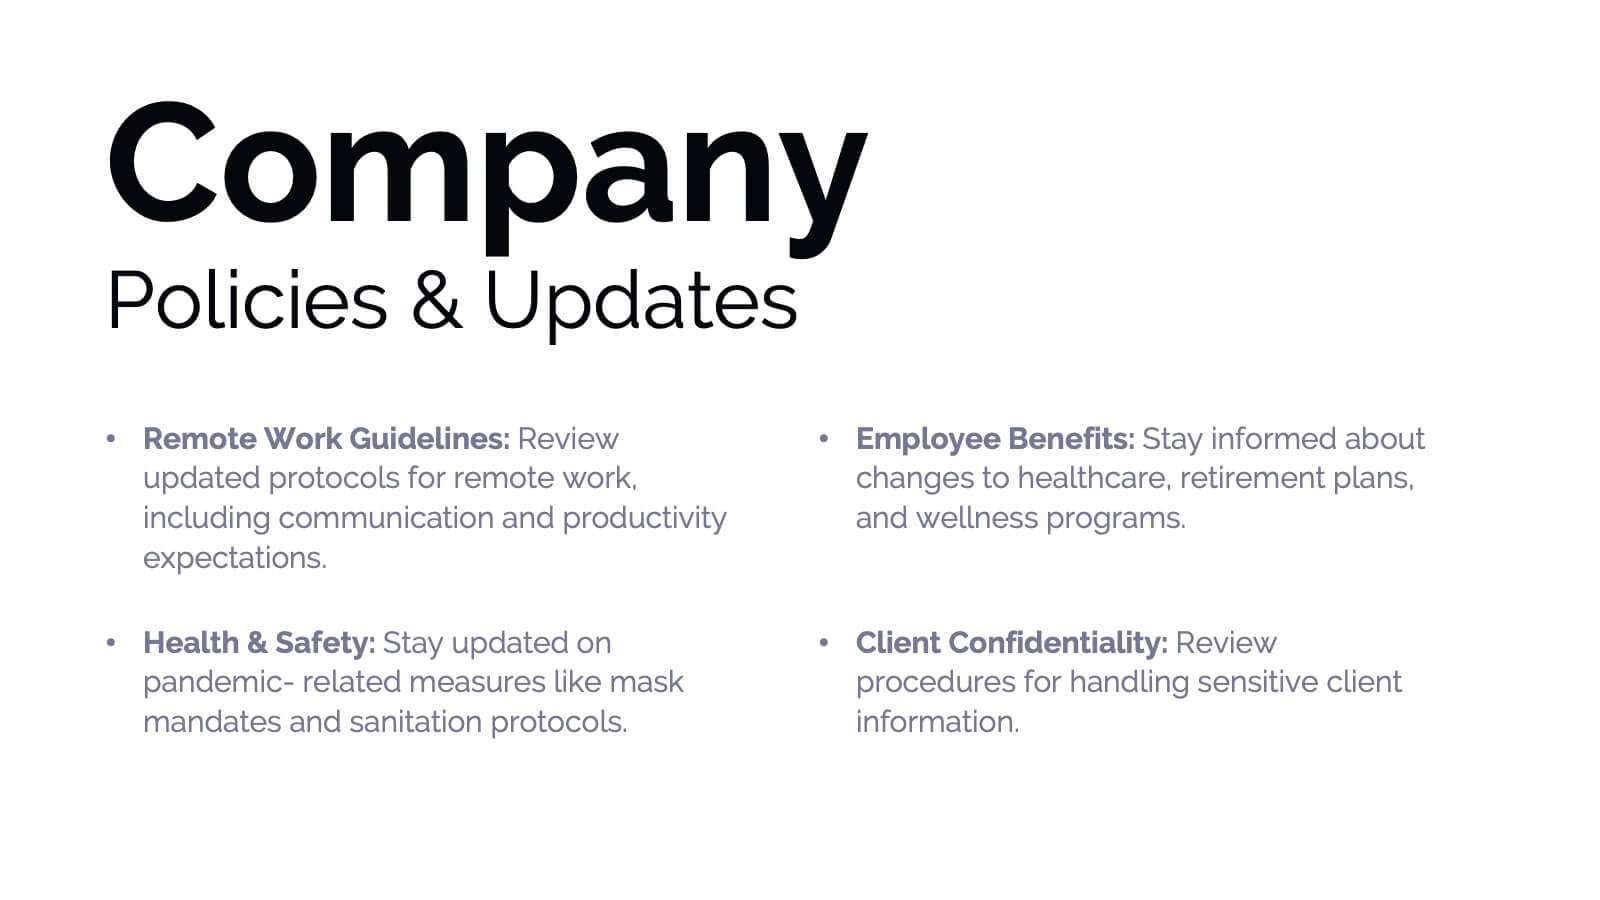
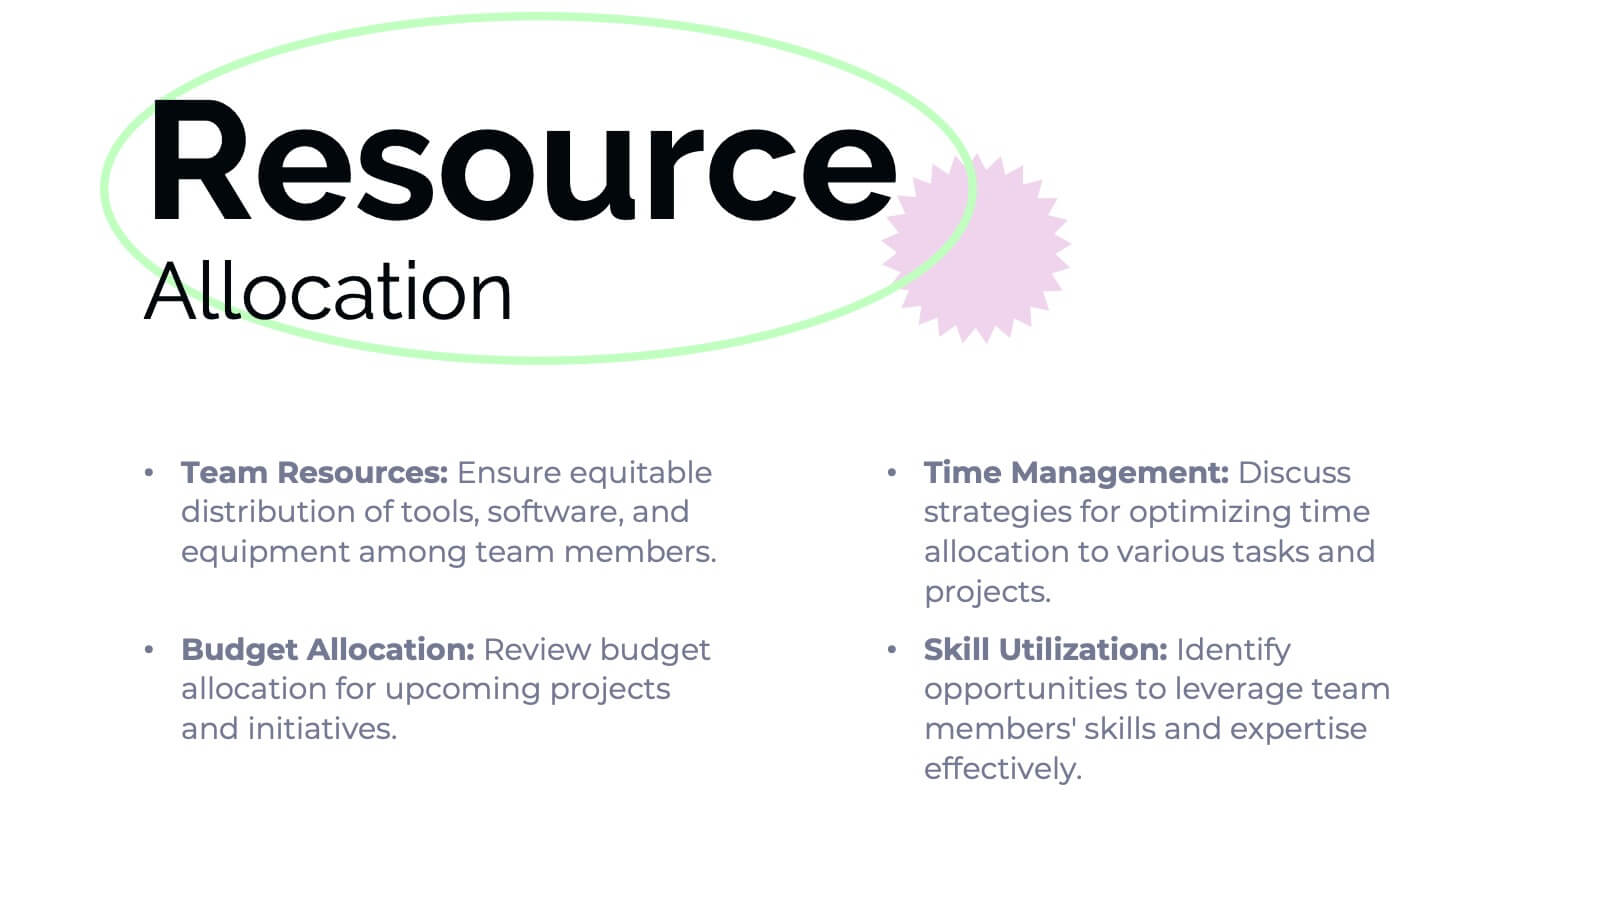
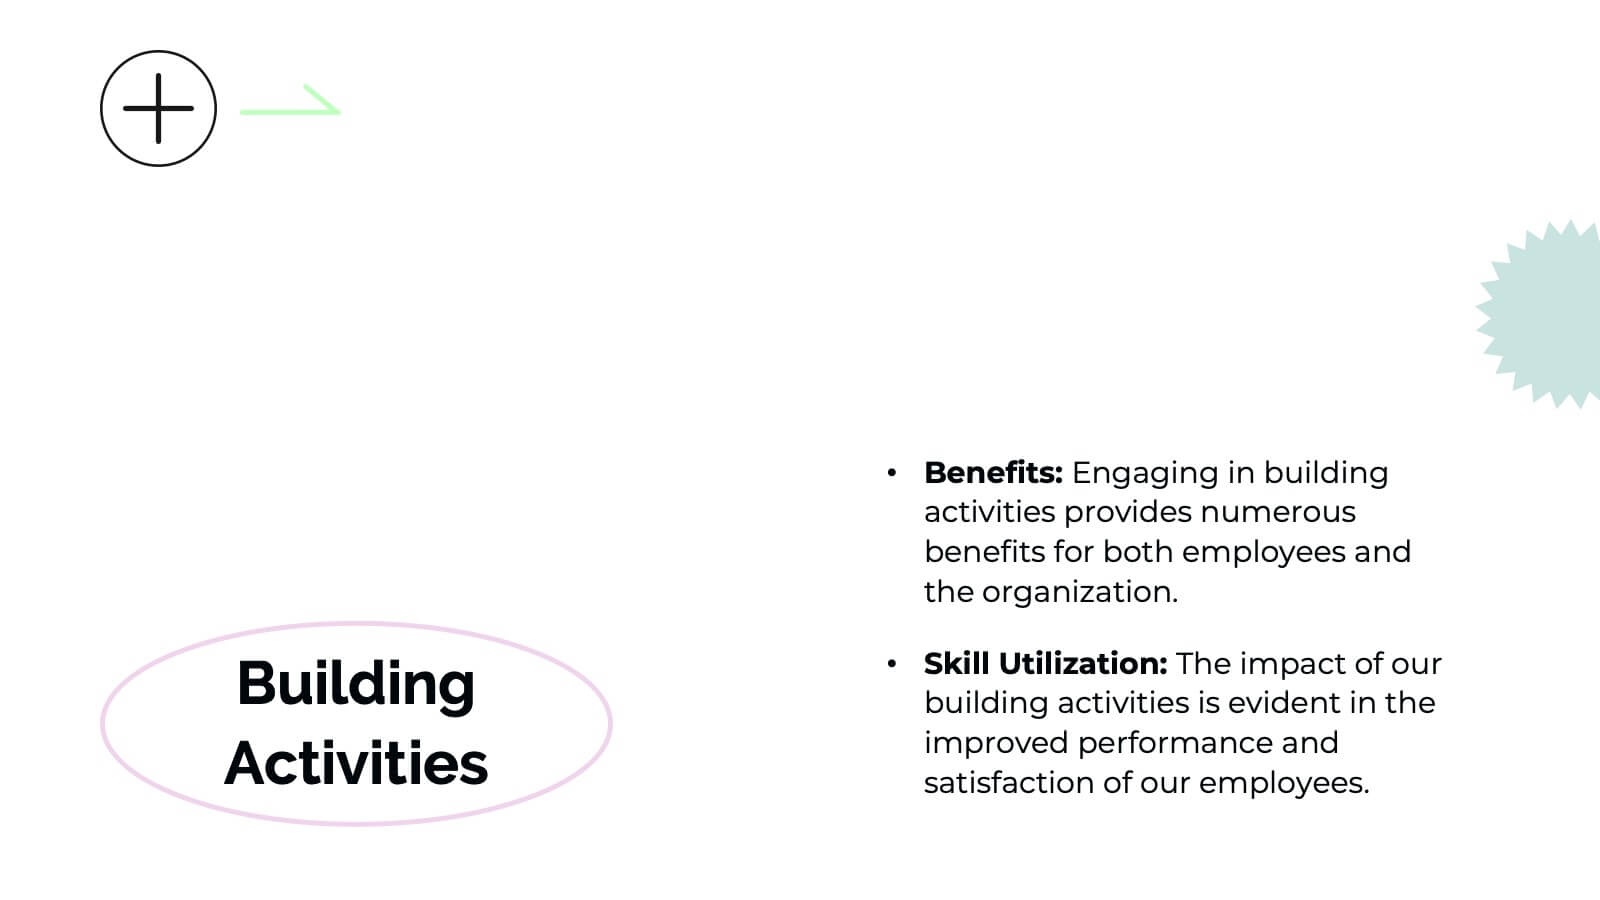
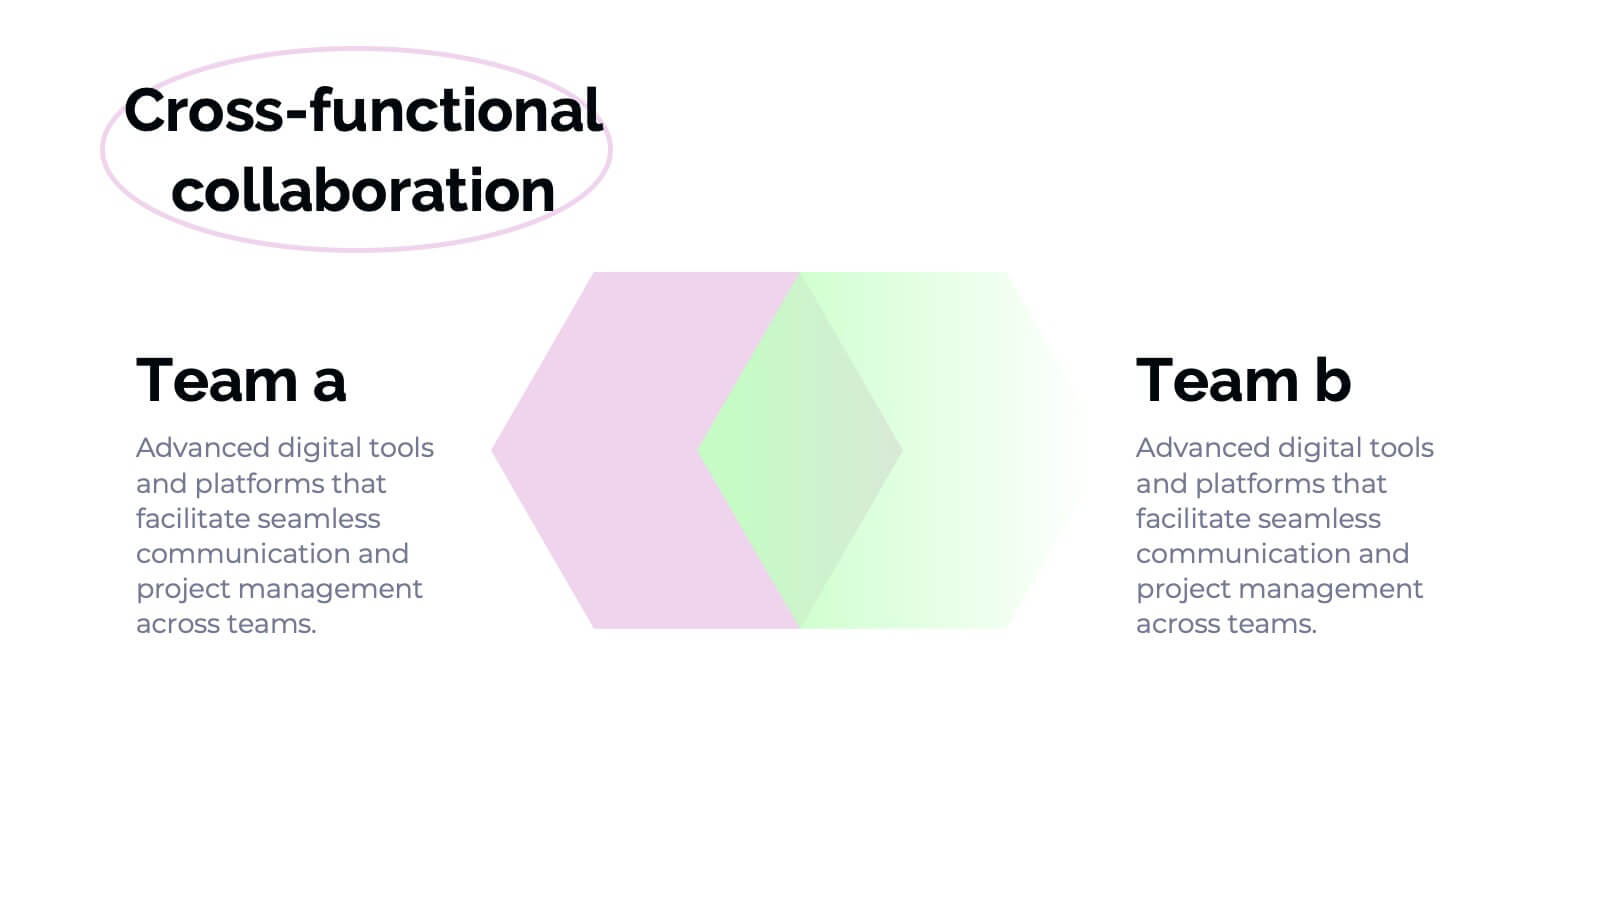
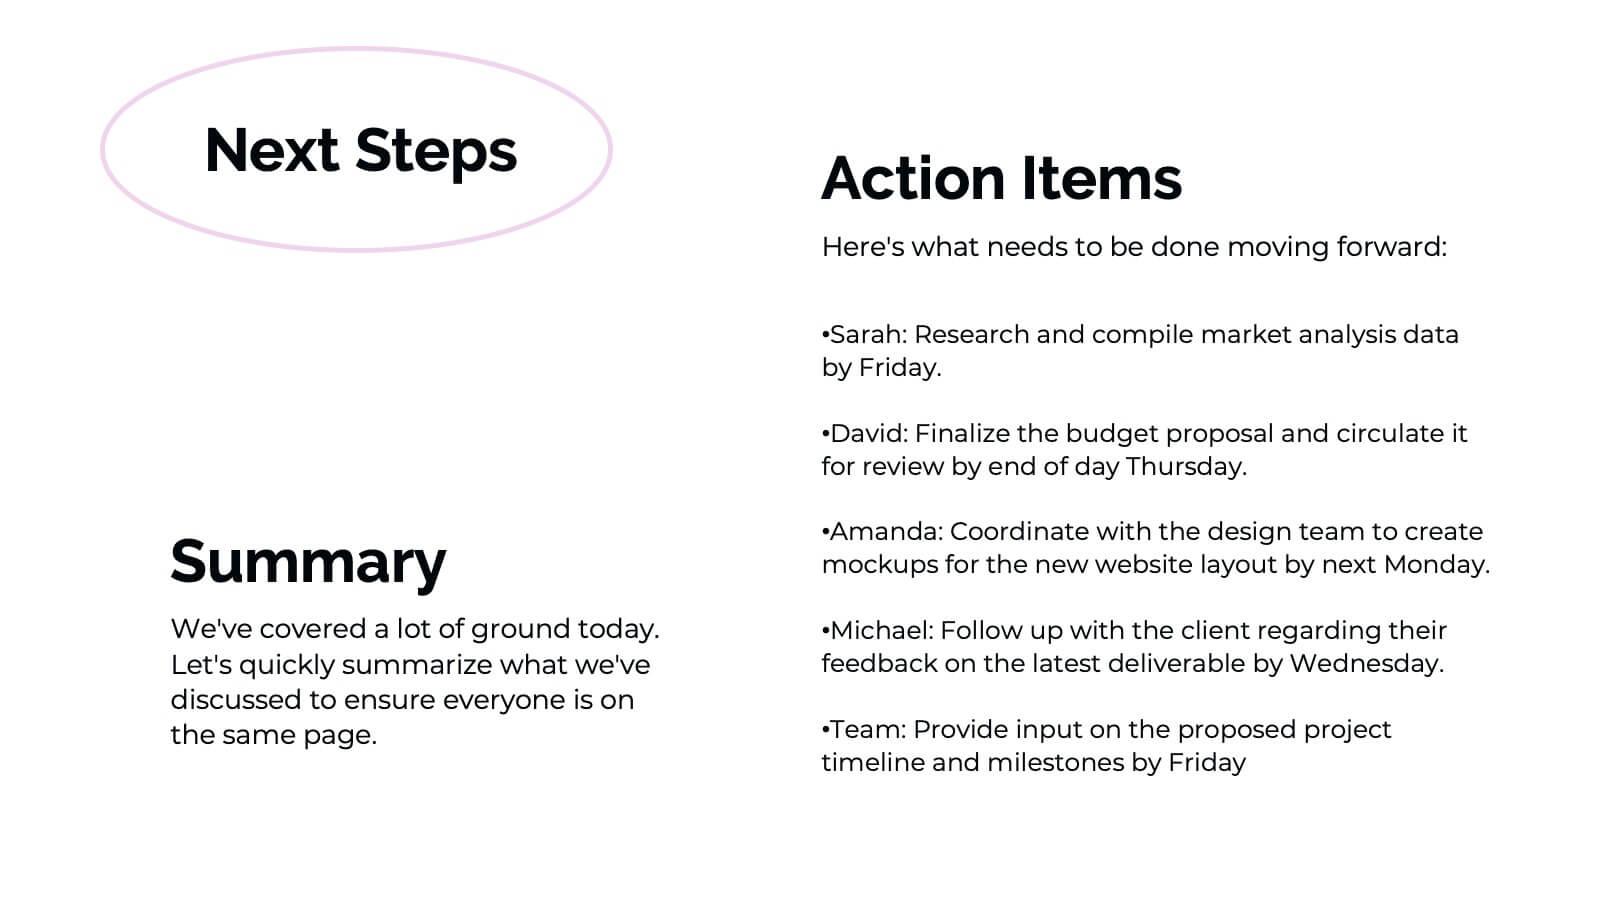
Orbit Corporate Strategy Report Presentation
Elevate your strategic planning and reporting with a sleek and dynamic template that exudes professionalism and clarity! This Strategy Report template is designed to empower your organization’s vision, highlighting the core elements that drive success. From a powerful agenda slide that sets the tone to a detailed team update, this template ensures every aspect of your business is showcased with precision. The design is streamlined yet impactful, perfect for conveying key achievements, current projects, and future goals. Performance metrics, departmental goals, and training & development sections are laid out to emphasize your organization’s strengths and areas of focus. The template also includes slides dedicated to employee recognition, process improvement, and cross-functional collaboration, ensuring all facets of your business are covered. With a clean, modern aesthetic, this template is perfect for executives and team leaders alike, and is compatible with PowerPoint, Keynote, and Google Slides. Get ready to make your strategy presentations unforgettable!


5 diapositivas
Closing Talent Gaps with Skills Data Presentation
Showcase a clear talent strategy with the Closing Talent Gaps with Skills Data Presentation. This infographic-style layout visualizes key workforce stages, helping teams align talent capabilities with organizational needs. Ideal for HR, L&D, and talent management discussions. Fully customizable in Canva, PowerPoint, Google Slides, and Keynote.


8 diapositivas
Business KPI Dashboard Presentation
Track performance at a glance with the Business KPI Dashboard Presentation. This clean, professional layout includes a speedometer-style gauge and monthly bar chart to showcase progress, goals, or metrics clearly. Ideal for reporting, analysis, or executive summaries. Fully editable and compatible with PowerPoint, Keynote, and Google Slides.


10 diapositivas
Business Relationship Management Presentation
Navigate the nuances of professional partnerships with the "Business Relationship Management" presentation templates. These layouts offer a structured approach to delineating the roles and interactions within business relationships, making them an essential tool for managers and team leaders. Designed to be compatible with PowerPoint, Keynote, and Google Slides, these templates provide a clear pathway for discussing and managing business relationships effectively.


7 diapositivas
PESTEL Framework for External Analysis Presentation
Evaluate external factors with ease using the PESTEL Framework for External Analysis Presentation. This structured layout helps you assess Political, Economic, Social, Technological, Environmental, and Legal influences on your business. Perfect for market research, risk assessment, and strategic planning. Fully customizable in PowerPoint, Canva, and Google Slides.