


Características


¿Tienes alguna pregunta?
Recomendar


26 diapositivas
Effective Communication Skills Presentation
Discover the key to successful interactions with our Effective Communication Skills presentation template. This all-in-one template is fully compatible with PowerPoint, Keynote, and Google Slides, making it the perfect addition to your toolkit, whether you're an educator, a corporate trainer, or a team leader. Our template is meticulously designed to help you convey the essence of effective communication, breaking down complex concepts into easily understandable segments. From active listening to clear articulation, it covers various aspects of communication that are crucial in both personal and professional environments. Each slide in the Effective Communication Skills template features a clean, engaging design, encouraging viewers to focus on the content. Editable charts, graphs, and models allow for a customized experience, ensuring that your message resonates with your specific audience. By using this template, you can confidently guide your audience through the intricacies of effective communication, making your presentation a reference point for those looking to improve their communication skills. Elevate your presentations and ensure your message is not just heard, but understood and acted upon.


4 diapositivas
Europe Market Expansion Visualization Presentation
Showcase your European growth strategy with the Europe Market Expansion Visualization Presentation. This map-based slide design allows you to clearly highlight regional opportunities, new market entries, and key expansion zones using icons and color-coded country markers. Ideal for strategic planning, investor updates, and sales overviews. Fully editable in PowerPoint, Keynote, Google Slides, and Canva.


10 diapositivas
Sustainable Farming Practices
Present eco-friendly agricultural strategies with this visually structured layout. Featuring a linear process flow and eco-themed icons, this slide is ideal for outlining key sustainability practices, steps, or phases. Use it for presentations on regenerative agriculture, organic farming, or environmental policy. Fully editable in PowerPoint, Keynote, and Google Slides.


8 diapositivas
Data Analytics Dashboard Slide Presentation
Turn raw data into visual insights with this clean and modern layout designed to simplify analytics reporting. Perfect for tracking performance metrics, KPIs, and progress updates, it helps make numbers easy to understand at a glance. Fully customizable and compatible with PowerPoint, Keynote, and Google Slides for effortless editing.


5 diapositivas
Rental Business Milestone Timeline Presentation
Showcase your company's growth journey with this clean Rental Business Milestone Timeline layout. Designed for tracking key achievements, it features a horizontal timeline with icons and customizable date markers. Perfect for business reviews or investor updates, it’s fully editable in PowerPoint, Keynote, and Google Slides for a professional presentation


6 diapositivas
Financial Forecasting and Numerical Analysis Presentation
Visualize your financial insights with clarity using this clean and modern bar chart template. Designed for presenting financial projections, budget analysis, and performance metrics, this slide breaks down six key categories for easy comparison. Ideal for financial reviews, business updates, or investment pitches. Fully editable in PowerPoint, Keynote, and Google Slides.


6 diapositivas
Commercial Agriculture Infographics
Explore the world of Commercial Agriculture with our customizable infographic template. This template is fully compatible with popular presentation software like PowerPoint, Keynote, and Google Slides, allowing you to easily customize it to illustrate and communicate various aspects of commercial agriculture. The Commercial Agriculture infographic template offers a visually engaging platform to explore and explain the practices, trends, and challenges in modern agriculture for commercial purposes. Whether you're a farmer, agricultural professional, student, or simply interested in food production and sustainability, this template provides a user-friendly canvas to create informative presentations and educational materials. Deepen your understanding of Commercial Agriculture with this SEO-optimized infographic template, thoughtfully designed for clarity and ease of use. Customize it to highlight key agricultural practices, technologies, crop management, and the importance of sustainable farming, ensuring that your audience gains valuable insights into this vital industry. Start crafting your personalized infographic today to explore the world of Commercial Agriculture.


6 diapositivas
Leadership and Business Teamwork Presentation
Drive results through synergy with this dynamic Leadership and Business Teamwork presentation slide. Designed with a six-part segmented pie chart, this layout helps visualize collaborative frameworks, team roles, or leadership models in an engaging way. Ideal for team workshops, leadership development, or strategic planning meetings. Easy to personalize in PowerPoint, Keynote, or Google Slides.


5 diapositivas
Customer Inquiry and Response Strategy Presentation
Streamline your communication flow with this step-by-step layout ideal for showcasing inquiry handling processes, customer service touchpoints, or lead response timelines. The linear design includes five fully editable stages with icons and text areas to clarify each phase of your strategy. Perfect for CRM teams, sales ops, and client support leaders. Fully customizable in PowerPoint, Keynote, and Google Slides.


20 diapositivas
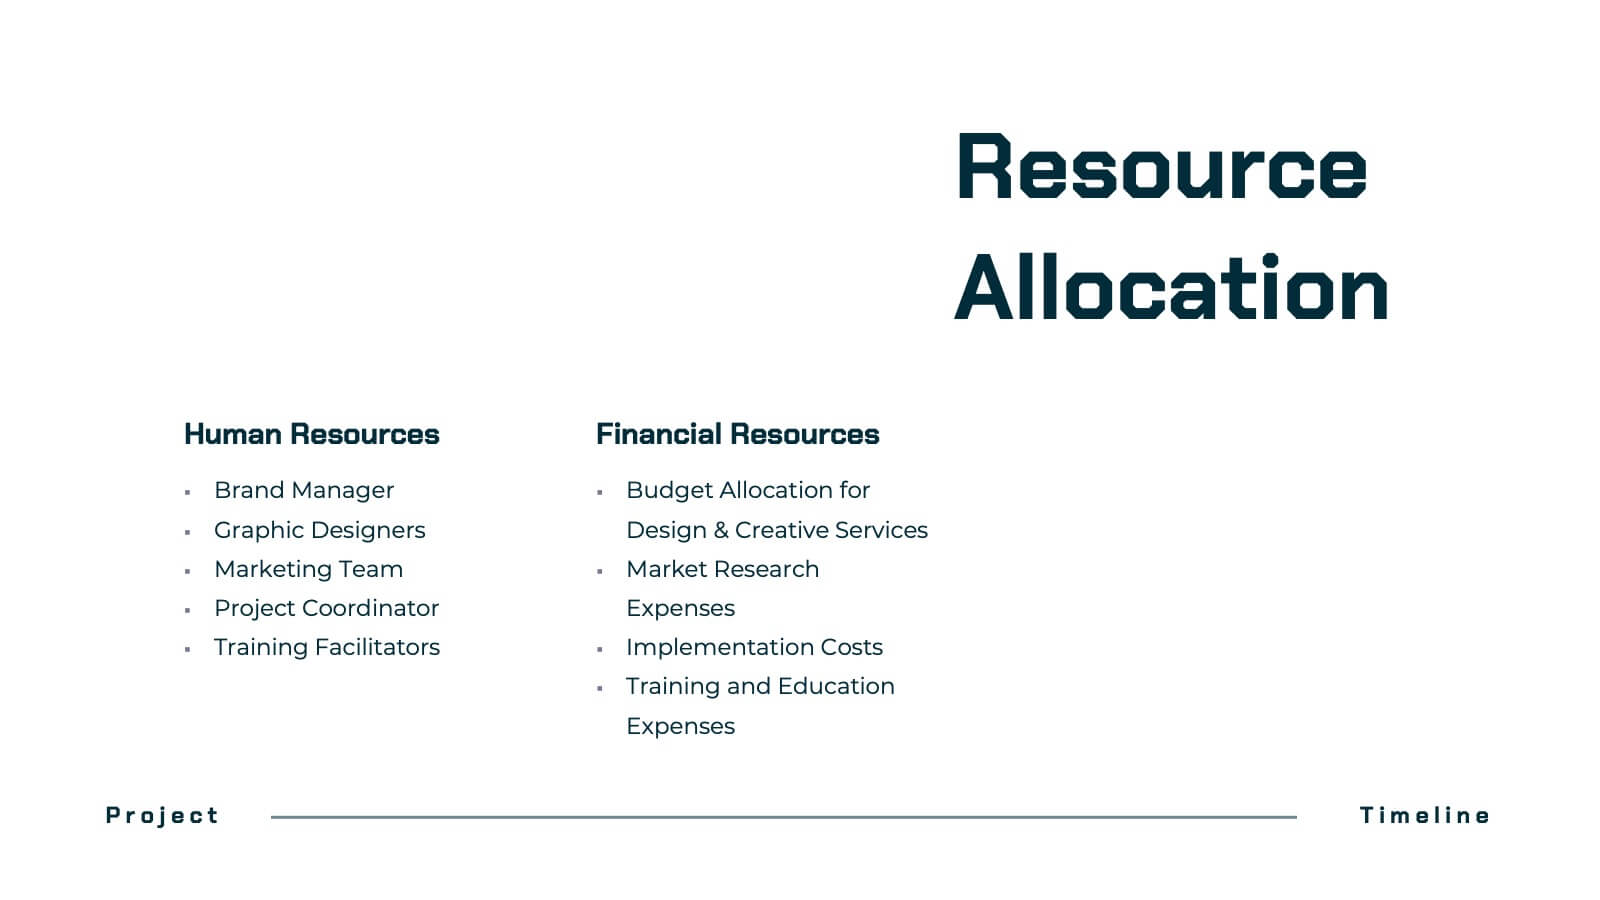
Dynastream Project Timeline Presentation
Stay on track with this detailed and well-organized project plan presentation designed for success! Covering essential areas like scope, objectives, timeline, budget breakdown, and risk management, it ensures every aspect of your project is clear and actionable. Perfect for team meetings or stakeholder updates, this template is fully compatible with PowerPoint, Keynote, and Google Slides.


21 diapositivas
Manticore Financial Report Presentation
This financial report template features a sleek, modern design for presenting key highlights, performance metrics, and financial summaries. It includes sections for market trends, competitor insights, and strategic initiatives. Fully customizable and compatible with PowerPoint, Keynote, and Google Slides, it's perfect for delivering impactful financial presentations with clarity and style.


24 diapositivas
Djinn Brand Identity Presentation
Unleash the power of your brand with this sleek and modern presentation template! From brand identity components to target audience personas, this template covers everything you need to craft a cohesive and compelling brand strategy. Whether showcasing brand guidelines or success stories, it’s designed for maximum clarity and impact. Compatible with PowerPoint, Keynote, and Google Slides for effortless presentations.


26 diapositivas
Quantum Computing Presentation
Step into the future of technology with this fascinating presentation on quantum computing. Covering key concepts like quantum bits, superposition, entanglement, and real-world applications, this template helps simplify complex ideas for any audience. Fully customizable and compatible with PowerPoint, Keynote, and Google Slides for a seamless and insightful presentation experience.


5 diapositivas
Revenue Streams & Expense Management Layout Presentation
Visualize your income and costs with the Revenue Streams & Expense Management Layout Presentation. This slide layout uses a vertical arrow chart to display four data categories, ideal for comparing sources of income and related expenditures. Great for financial reports, budgeting reviews, and strategy discussions. Compatible with Canva, PowerPoint, Google Slides, and Keynote.


5 diapositivas
Linear Business Process Flowchart Presentation
Visualize sequential processes with this clean linear flowchart layout. Ideal for workflows, decision-making steps, or procedural overviews. Featuring directional connectors and labeled shapes, this design keeps your message structured and easy to follow. Fully editable in PowerPoint, Keynote, or Google Slides—perfect for business processes, planning, and operations presentations.


5 diapositivas
Strategic Business Case Presentation
Make every proposal stand out with a clear, goal-focused design that simplifies your strategic narrative. Ideal for presenting initiatives, project justifications, or decision-making insights, this layout balances visual clarity with professionalism. Fully compatible with PowerPoint, Keynote, and Google Slides for effortless editing and polished presentations.


7 diapositivas
PESTEL Analysis Marketing Infographic
PESTEL Analysis, often referred to as PESTLE Analysis, is a strategic management tool used to analyze and evaluate external macro-environmental factors that can impact an organization. This infographic template is a comprehensive and visually captivating template that unravels the strategic insights derived from the PESTEL analysis in the realm of marketing. Explore the critical external factors that influence your marketing strategy and steer your business towards success. Compatible with Powerpoint, Keynote, and Google Slides. Empower your marketing strategies with our PESTEL Analysis Marketing Infographic!