


Características


¿Tienes alguna pregunta?
Recomendar


5 diapositivas
Cyber Security Risk Management Presentation
Effectively visualize your digital defense strategy with this cyber security-themed presentation layout. Featuring a sleek laptop illustration and circular infographic design, this template helps you outline five critical areas of risk management with matching icons and editable text sections. Ideal for IT teams, consultants, or training sessions. Fully customizable and compatible with PowerPoint, Keynote, and Google Slides.


8 diapositivas
Green Business Sustainability Strategy Presentation
Promote eco-friendly business strategies with the Green Business Sustainability Strategy infographic. Featuring a circular flow diagram, this template highlights key sustainable initiatives, resource management, and environmental impact strategies. Fully editable and compatible with PowerPoint, Keynote, and Google Slides.


4 diapositivas
Governance Policy Overview Presentation
Set the foundation for transparency and accountability with this visually engaging presentation design. Perfect for outlining organizational rules, compliance standards, and policy frameworks, it turns complex governance details into clear, structured visuals. Fully customizable and compatible with PowerPoint, Keynote, and Google Slides for effortless professional presentations.


4 diapositivas
Governance Practices for Risk Mitigation Presentation
Break down your risk strategy with the Governance Practices for Risk Mitigation Presentation. This slide features a step-stair 3D block visual, ideal for illustrating layered compliance initiatives, control measures, and escalation paths. Perfect for corporate governance teams, compliance officers, and strategic risk planners. Fully editable in PowerPoint, Keynote, and Google Slides.


7 diapositivas
Clean Bullet Point List Presentation
Make every idea stand out with this clean, minimal layout built to organize information clearly and stylishly. Perfect for listing strategies, processes, or project highlights, it helps you communicate with confidence and precision. Fully customizable and compatible with PowerPoint, Keynote, and Google Slides for a seamless presentation experience.


7 diapositivas
Company Profile Structure Infographic
This series of templates is meticulously crafted to represent a company’s structure in a detailed and organized manner. Each template varies in design and layout, ensuring that there is a style to suit different business needs and preferences. From straightforward, clean layouts to more dynamic, visually engaging designs, these templates provide an excellent basis for companies to present their organizational structure, core team members, departmental divisions, and key business areas effectively. Key information such as company values, mission statements, and strategic objectives can be clearly highlighted, allowing companies to communicate their business essence and operational ethos to stakeholders. Each template also accommodates data visualization through charts, graphs, and infographics, which are instrumental in depicting growth trajectories, performance metrics, or demographic breakdowns. With customization options, these templates can be tailored to reflect a company's unique brand identity, including color schemes, typography, and corporate logos, making each presentation not only informative but also reflective of the company's image. This collection is ideal for corporate introductions, stakeholder meetings, and internal presentations aimed at fostering a clear understanding of the company’s operational framework and strategic direction.


8 diapositivas
Cost Analysis and Budgeting Presentation
Easily assess financial performance with the Cost Analysis and Budgeting Presentation template. This visually engaging slide helps break down cost structures, budget allocation, and financial comparisons in a clear and professional manner. Ideal for financial analysts, business strategists, and project managers presenting financial data. Fully editable in PowerPoint, Keynote, and Google Slides for effortless customization.


6 diapositivas
South America Biome Map Infographics
Explore our adaptable South America Biome Map infographic template, a powerful resource for visualizing the diverse ecosystems found across the South American continent. This template is fully compatible with popular presentation software such as PowerPoint, Keynote, and Google Slides, enabling you to easily customize it to suit your specific needs. The South America Biome Map infographic template serves as a flexible canvas for illustrating information about various biomes, including rainforests, grasslands, deserts, and more. Whether you're an educator, environmental enthusiast, or simply intrigued by South America's ecology, this template offers an intuitive platform to create informative presentations and educational materials. Impress your audience with this SEO-optimized South America Biome Map infographic template, expertly designed for clarity and user-friendliness. Customize it to showcase the unique features and biodiversity of South America's biomes, making it an invaluable tool for your projects and presentations. Get started on crafting your personalized infographic today!

20 diapositivas
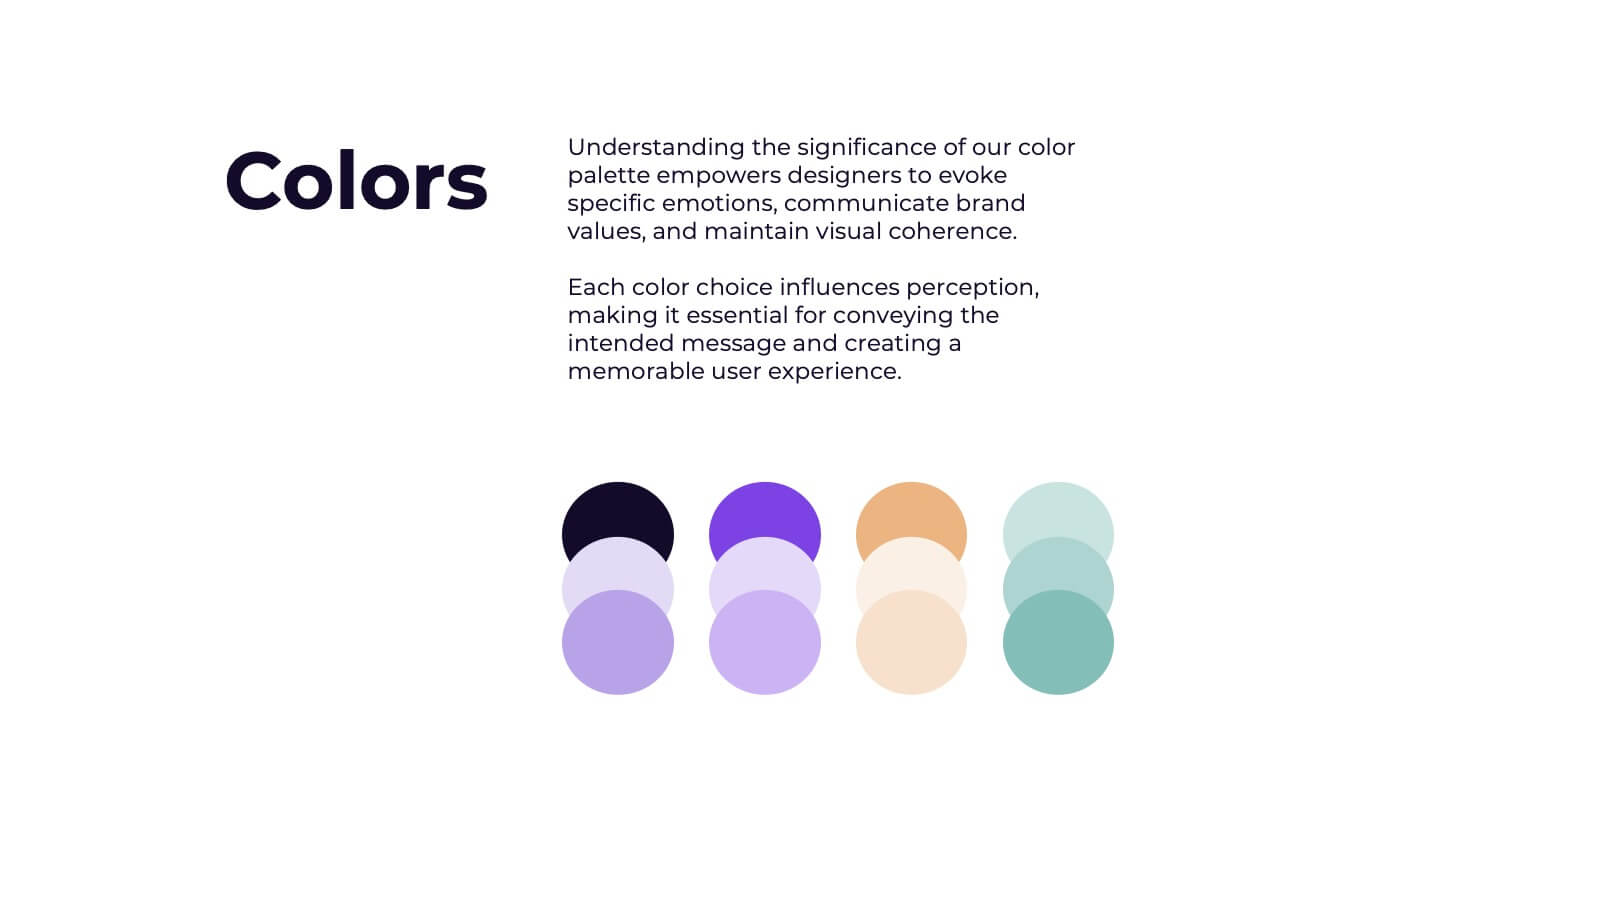
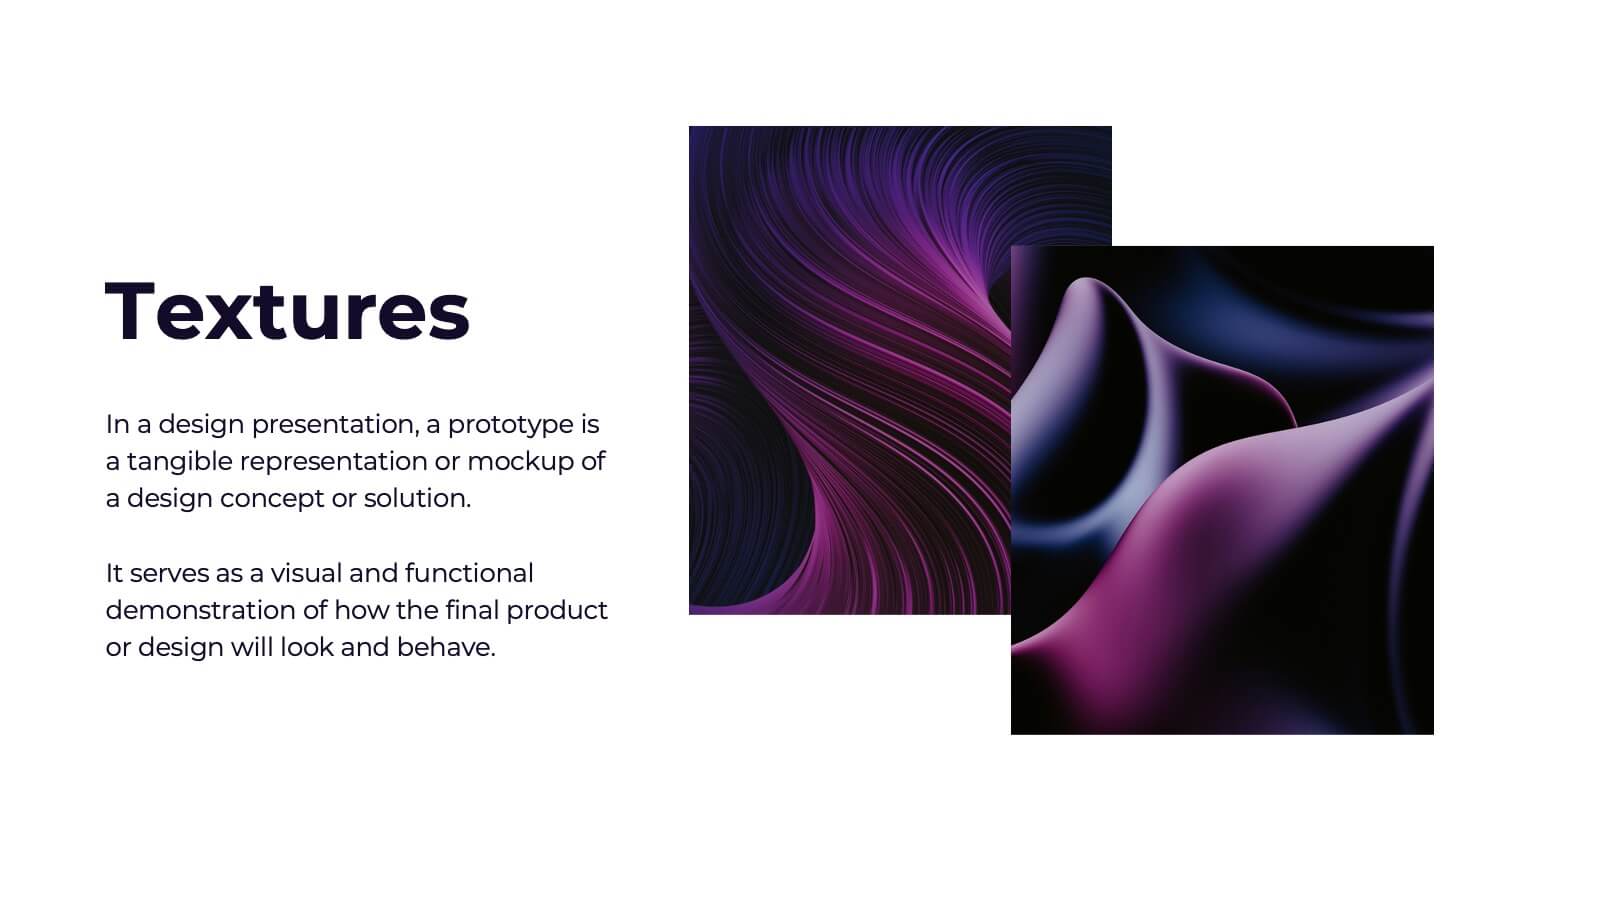
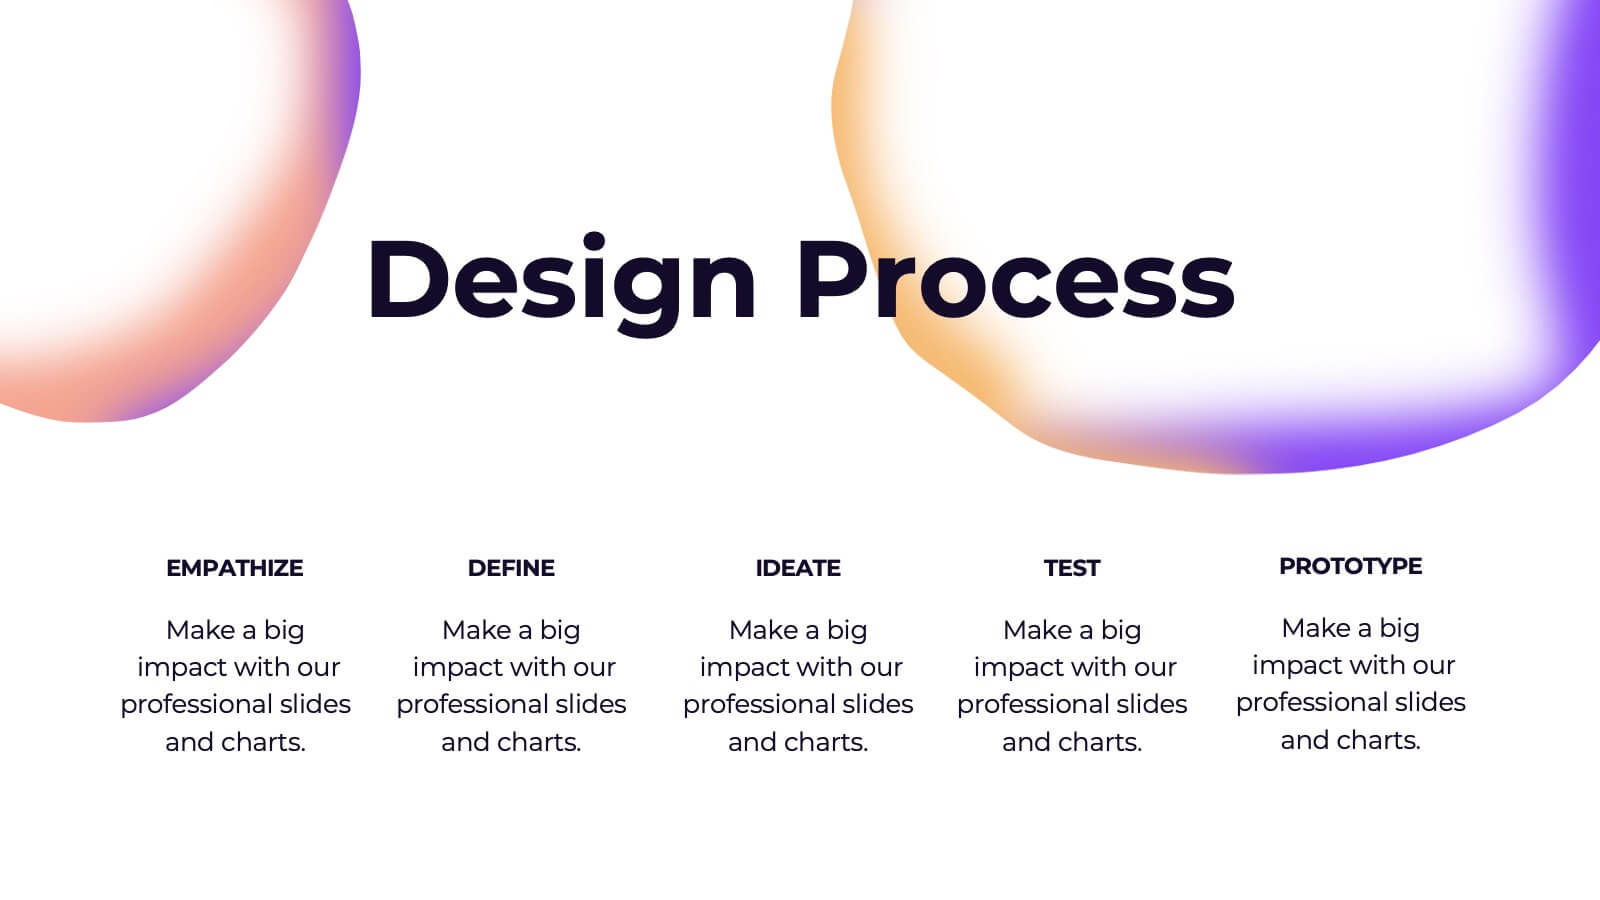
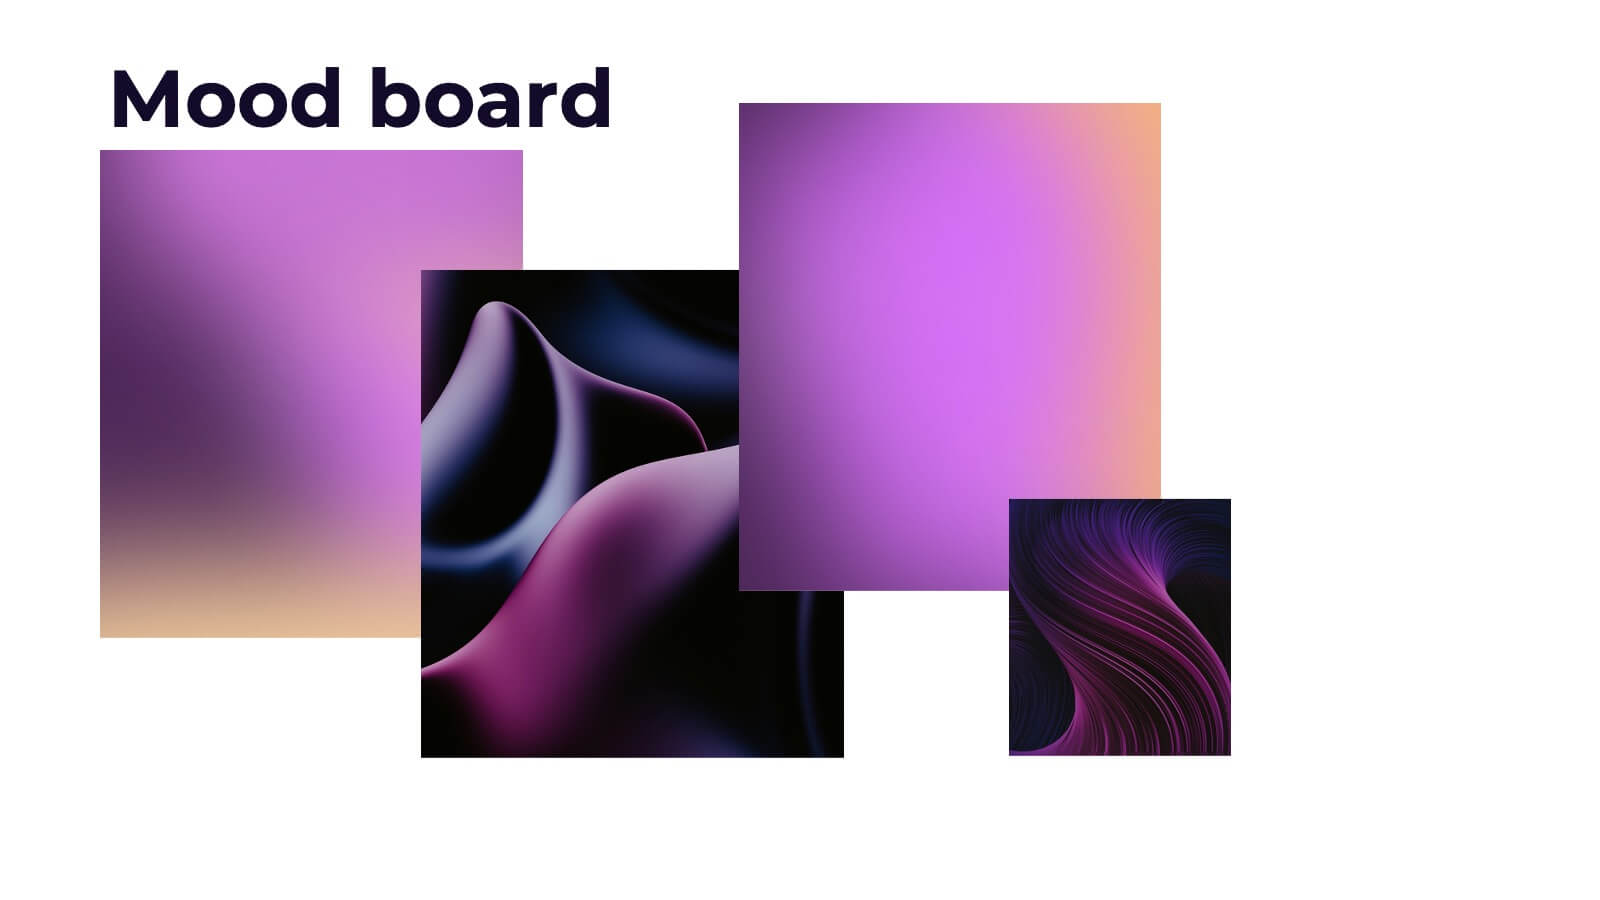
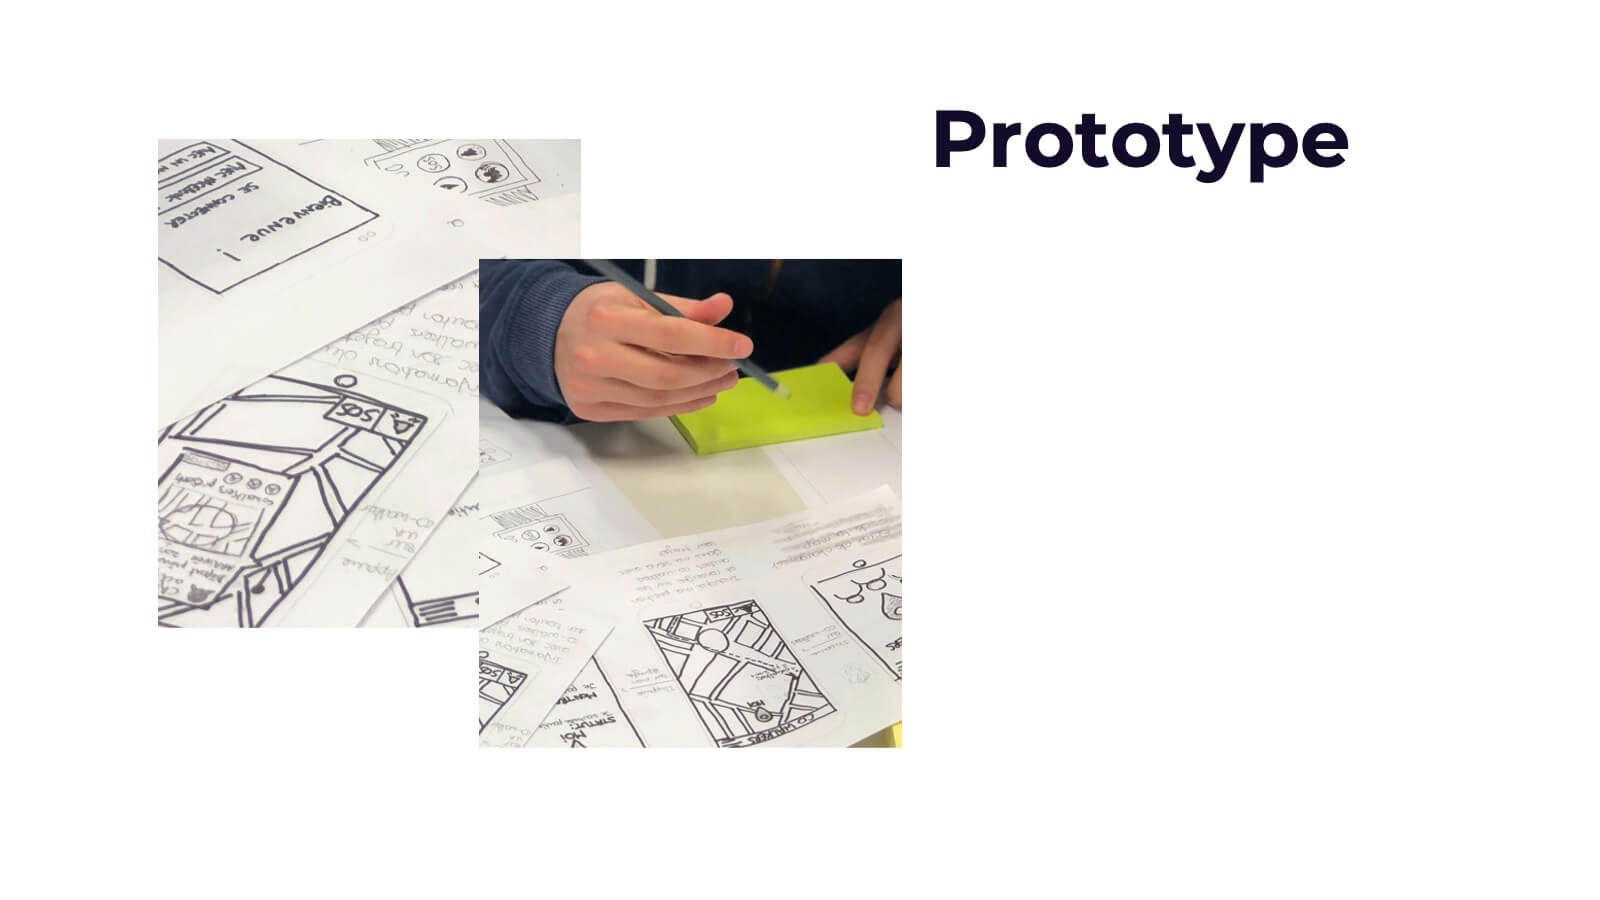
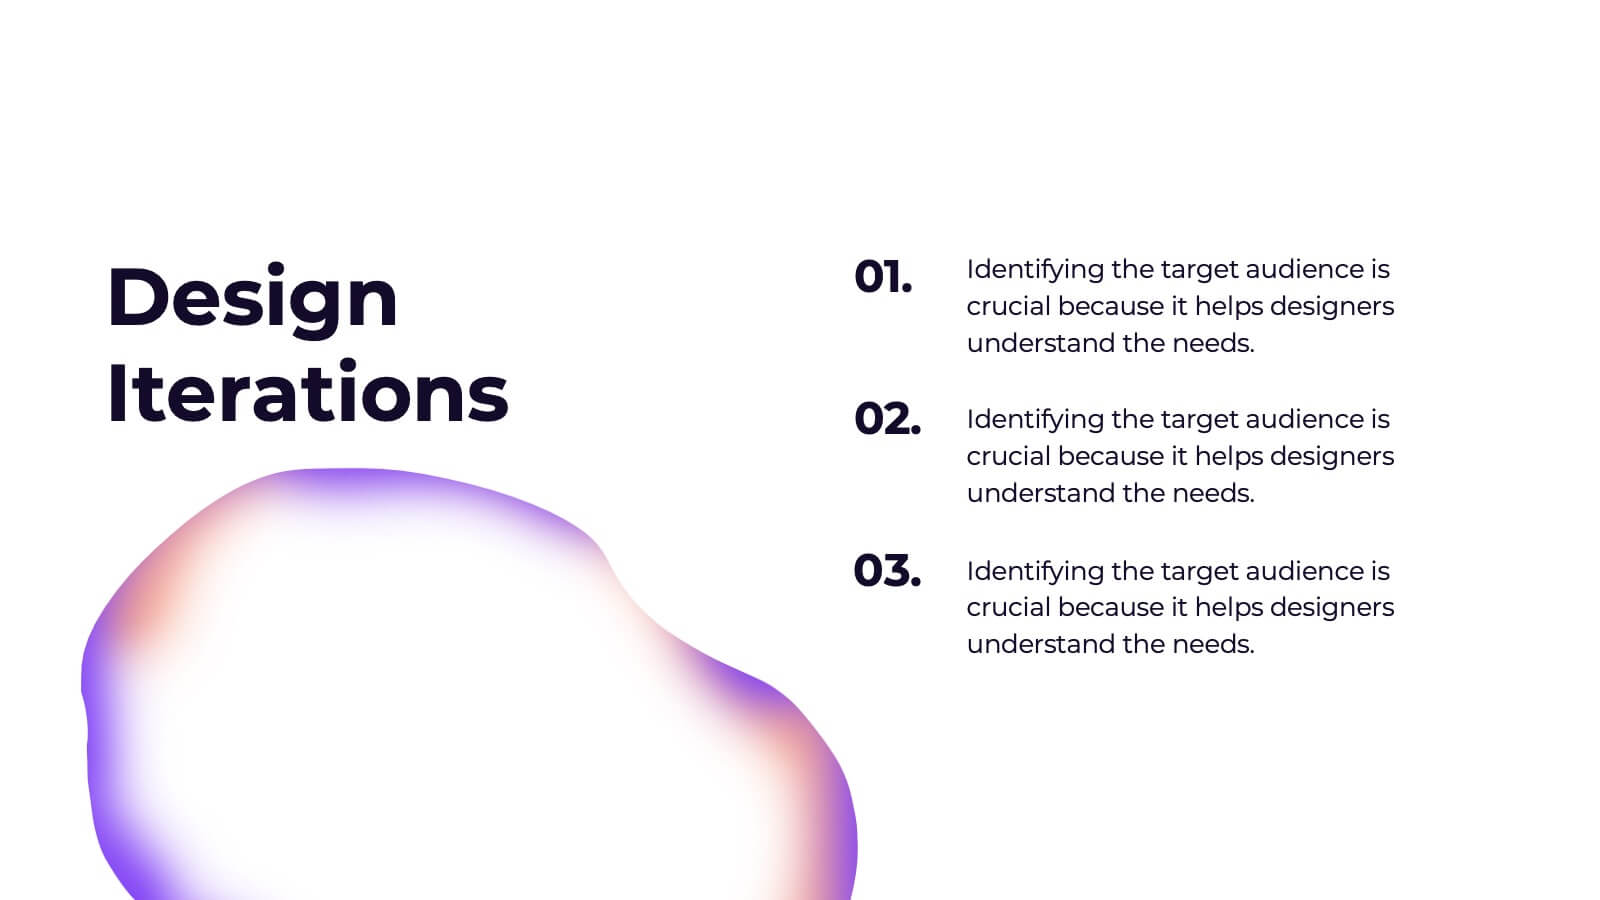
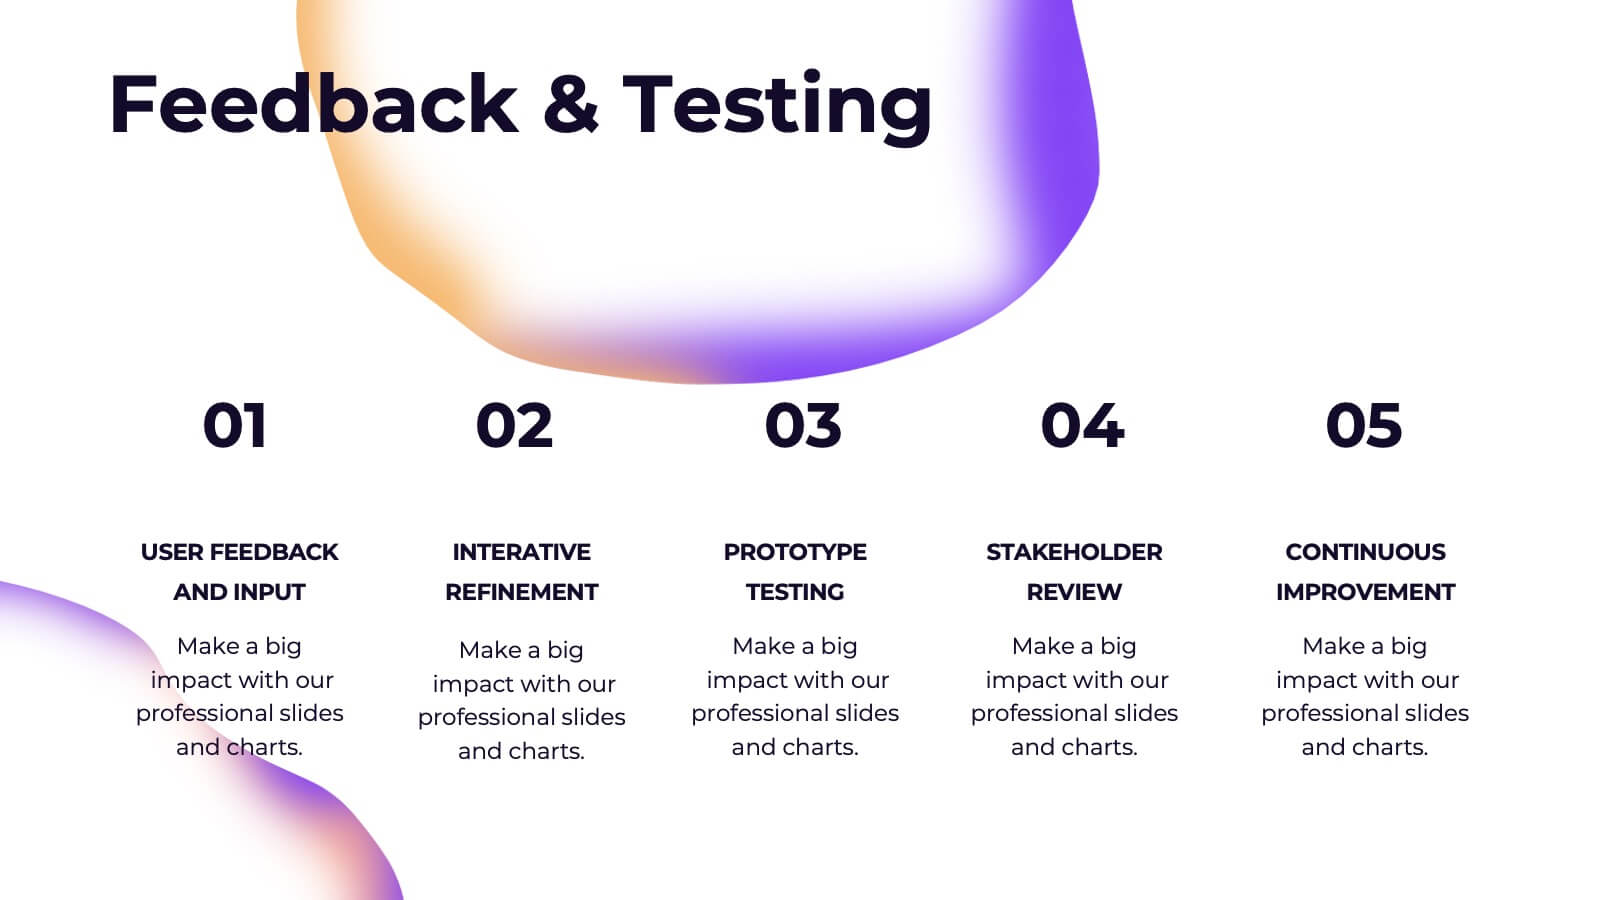
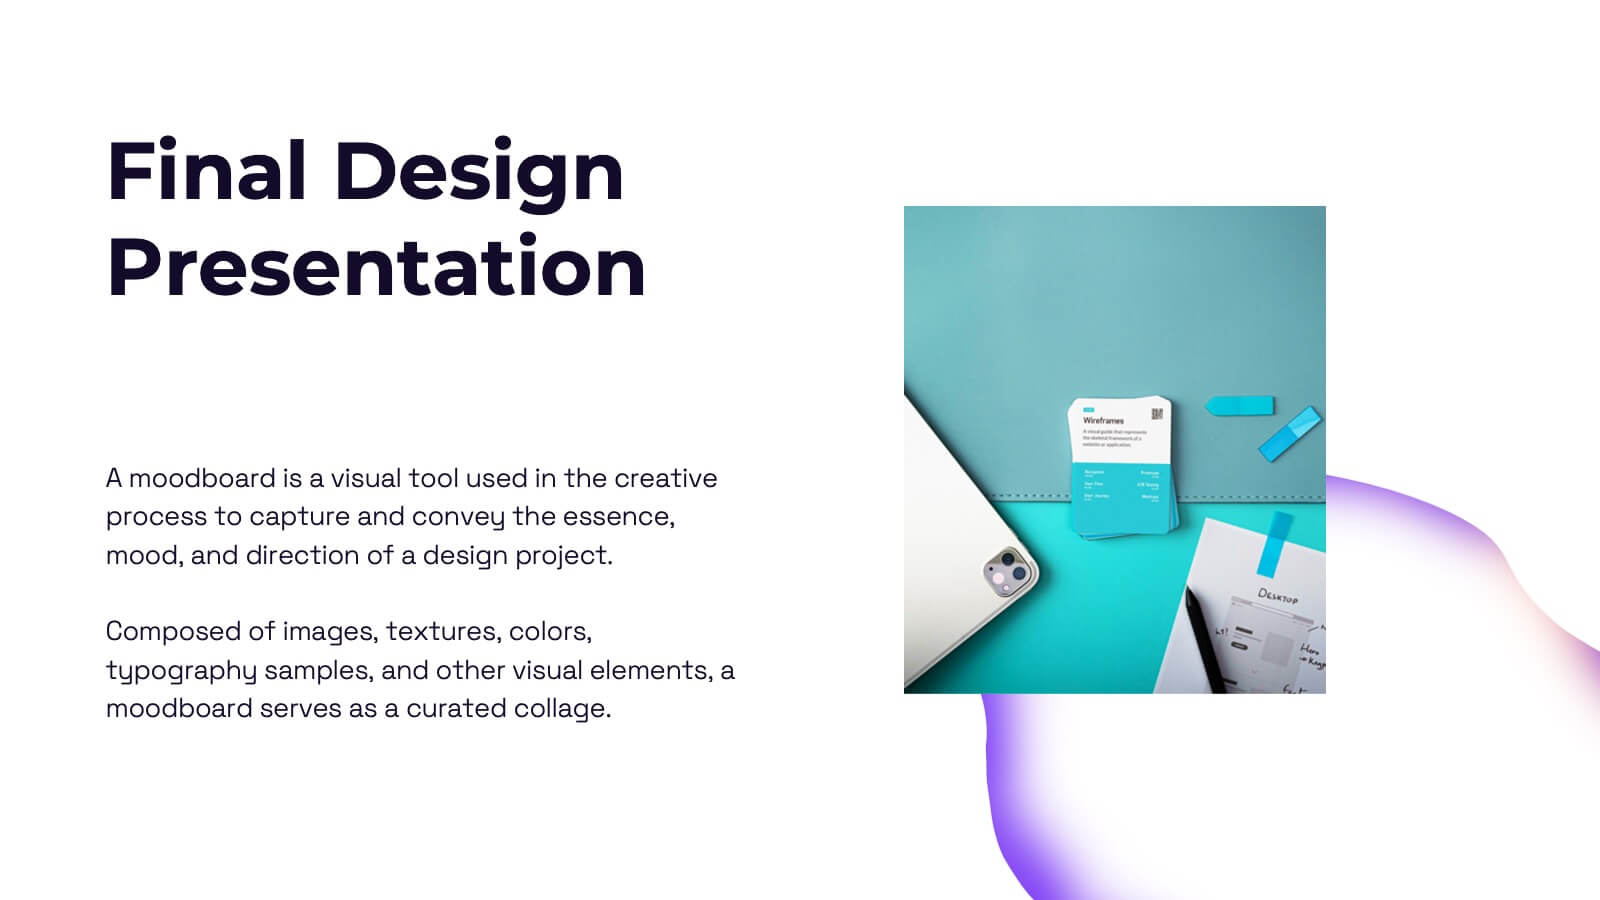
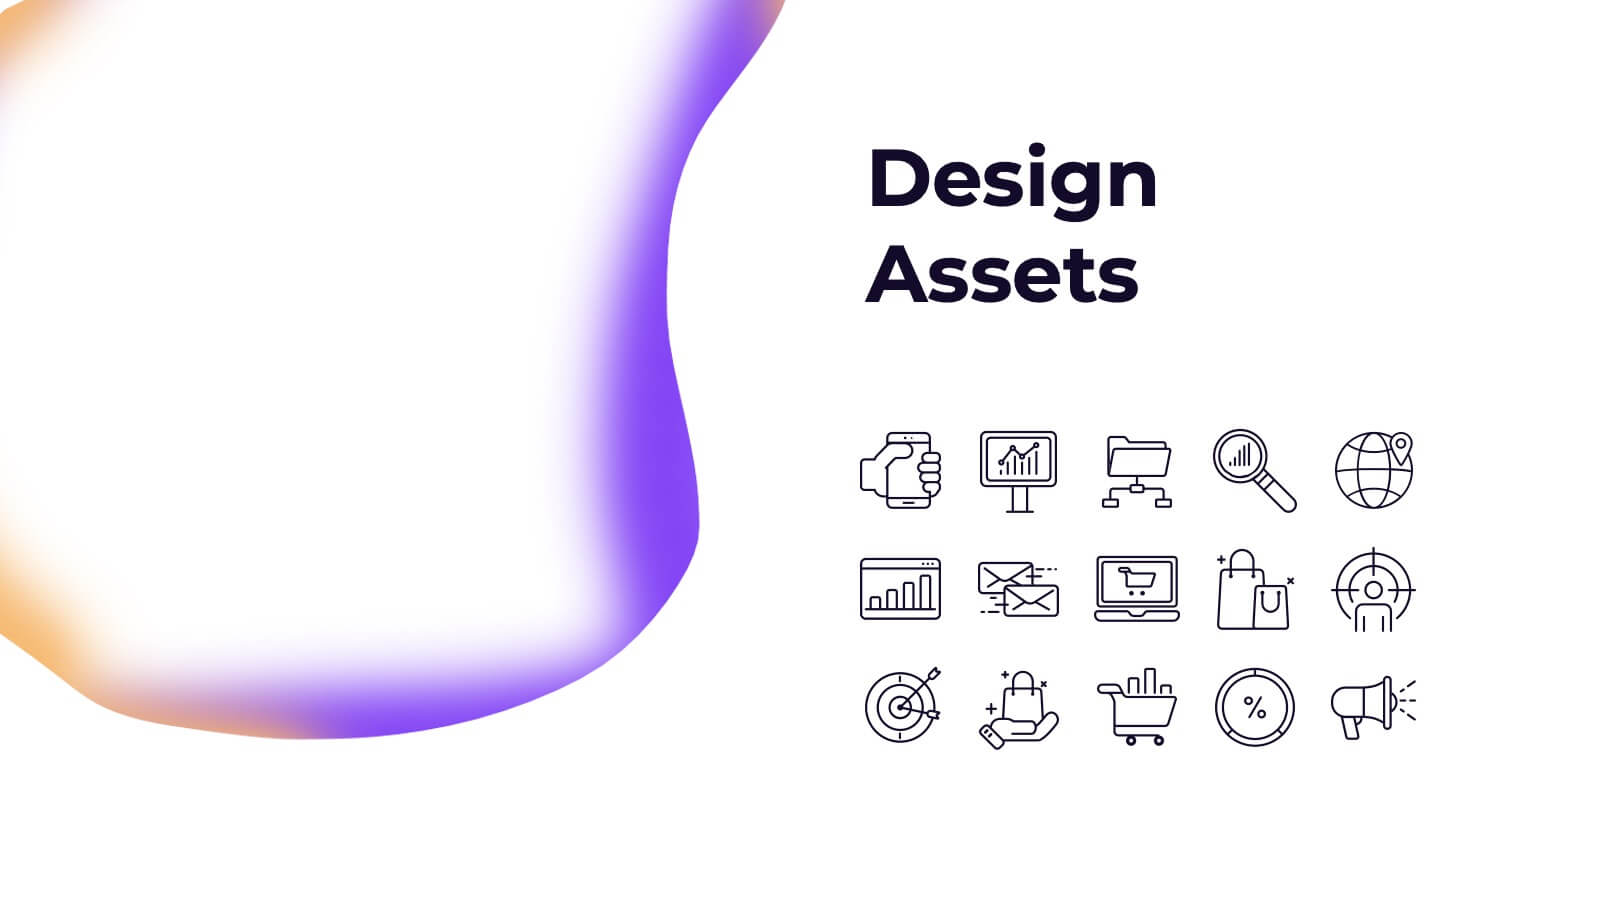
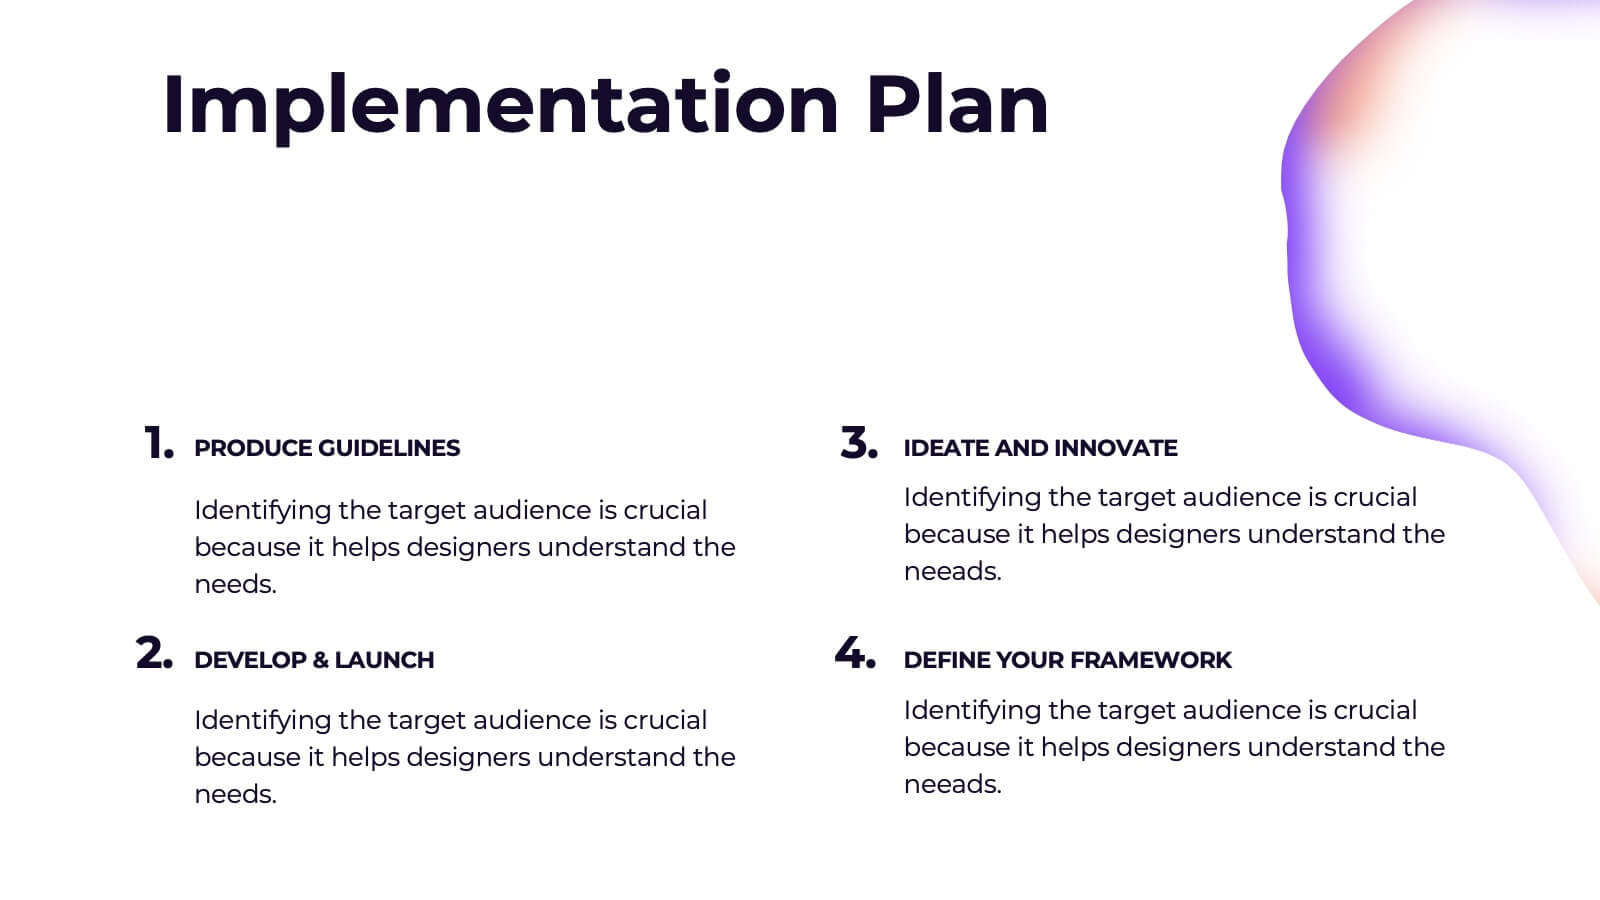
Valkyrie Design Strategy Proposal Presentation
Elevate your design strategy presentations with this visually captivating and modern template! It covers every step of the design process, from concept development and mood boards to prototype iterations and feedback. Ideal for showcasing design elements, textures, and assets, this template is perfect for creative professionals. Compatible with PowerPoint, Keynote, and Google Slides for easy, polished presentations.


4 diapositivas
Workplace Collaboration and Team Scenes Presentation
Bring your teamwork story to life with this vibrant, arrow-based layout that guides the viewer through four clear steps. Perfect for visualizing collaboration strategies, team roles, or task flow, this template balances clean design with helpful icons. Easily customize it in PowerPoint, Keynote, or Google Slides for a polished presentation.


20 diapositivas
Symphonix Marketing Campaign Presentation
The Marketing Campaign Presentation Template is designed for impactful storytelling and strategy. With 20 vibrant, customizable slides, it covers key topics like consumer behavior, emerging trends, data-driven strategies, and sustainability. Perfect for marketers and agencies, it’s fully compatible with PowerPoint, Keynote, and Google Slides for seamless presentations.


5 diapositivas
Project Summary and Executive Highlights Presentation
Summarize key milestones with this Project Summary and Executive Highlights slide. Featuring a clean horizontal layout with icons and numbered steps, it’s perfect for spotlighting major achievements, phases, or metrics. Use it to present updates with clarity and professionalism. Fully editable in PowerPoint, Google Slides, or Canva.


7 diapositivas
Matrix Structure Diagram
A matrix diagram is a management planning tool that enables you to analyze and display the relationship between data sets. This is a visual way to display information that you can quickly and easily analyze. With this template, you can create awesome Matrix Diagrams that will help you group and analyze information in a clear and organized way. This template is the perfect tool If you want to impress your teacher or boss with Infographic presentations. Arrange your information in a way that makes sense to you. Get started by downloading and editing in Powerpoint, Keynote, or Google Slides.


6 diapositivas
Competitor Benchmark Analysis Table Presentation
Visually compare competitors with this structured benchmark analysis template. Perfect for business strategy, market research, or product comparison presentations. Features colorful indicators and editable labels to showcase performance, differentiation, or KPIs. Fully customizable in PowerPoint, Keynote, and Google Slides—ideal for marketing teams, consultants, or competitive landscape reviews.


5 diapositivas
Project Milestone Timeline Presentation
Bring your project’s journey to life with this vibrant and organized presentation layout. Designed to showcase milestones, releases, and key phases clearly, it helps teams stay aligned and focused on goals. Fully editable and compatible with PowerPoint, Keynote, and Google Slides for smooth, professional presentations every time.


8 diapositivas
Corporate Risk Assessment and Planning Presentation
Navigate business uncertainties with the Corporate Risk Assessment and Planning template, offering a vivid and structured layout designed for professionals to meticulously detail and analyze potential risks in various business scenarios. It uses hexagonal and circular elements to emphasize the interconnectedness of various risk factors, supporting clear visualization and effective strategic planning. This template is compatible with PowerPoint, Keynote, and Google Slides, making it a versatile tool for comprehensive risk management presentations.


10 diapositivas
Competitive Advantage Blue Ocean Strategy Presentation
Gain a competitive edge with this Blue Ocean Strategy presentation template! Designed to help businesses identify new market opportunities, this layout focuses on the four key actions: eliminate, reduce, raise, and create. Perfect for strategic planning, innovation workshops, and business growth discussions. Fully customizable and compatible with PowerPoint, Keynote, and Google Slides.