


Características


¿Tienes alguna pregunta?
Recomendar


6 diapositivas
Target Market Breakdown Presentation
Turn audience data into a visual story with a clean, layered design that highlights market potential and audience segmentation. Perfect for startups and marketing teams, this layout simplifies complex data for impactful communication. Fully compatible with PowerPoint, Keynote, and Google Slides for seamless editing and professional presentation results.


5 diapositivas
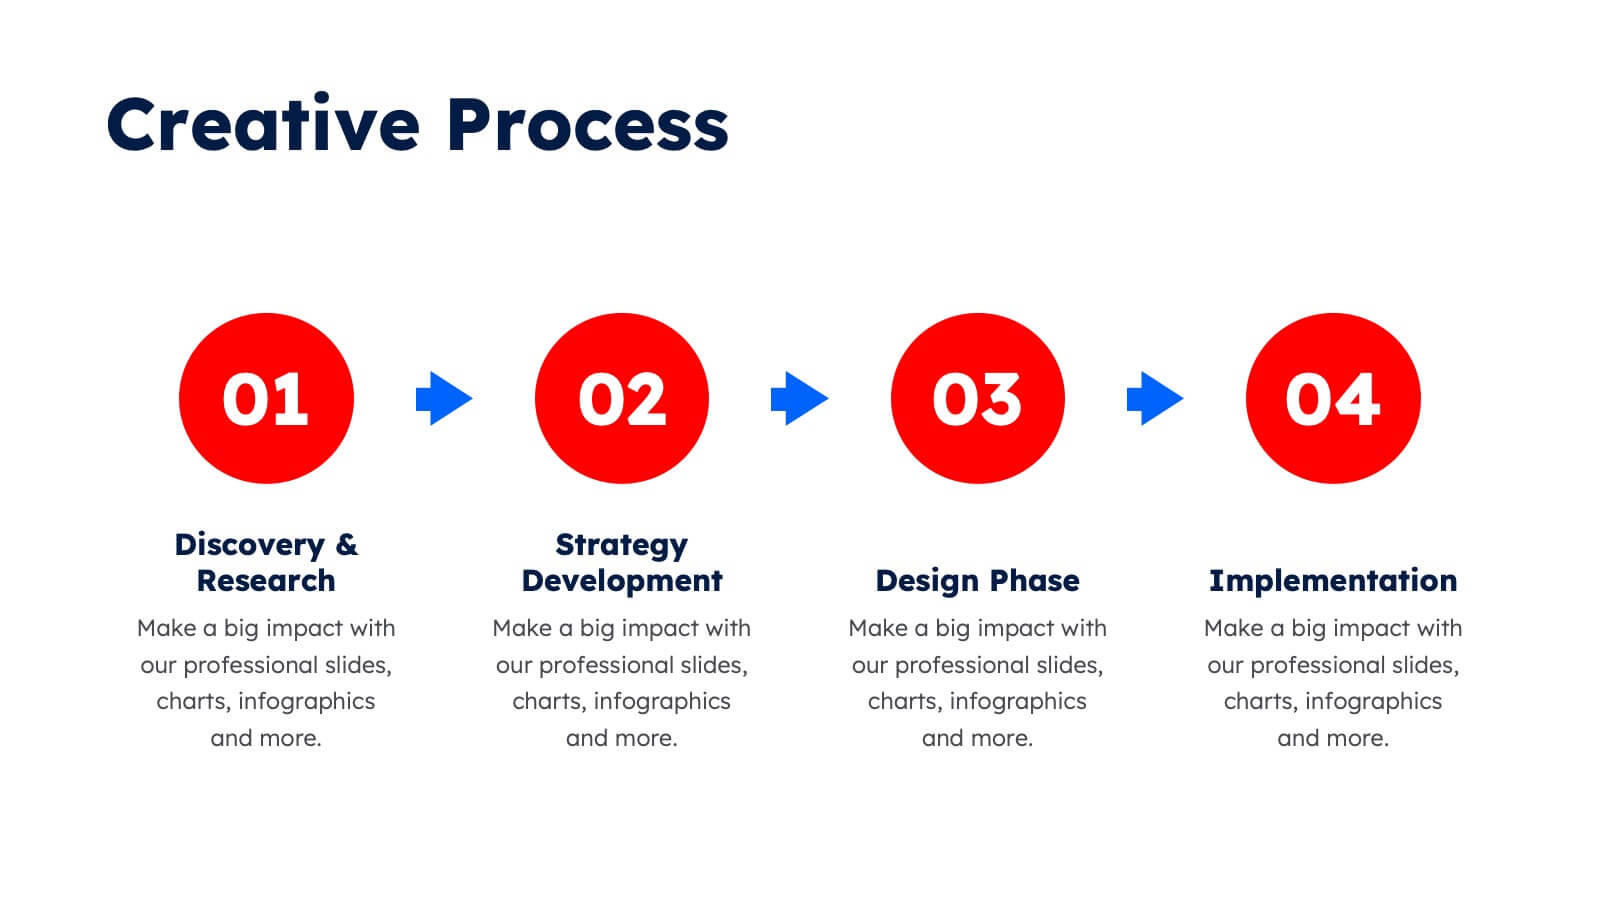
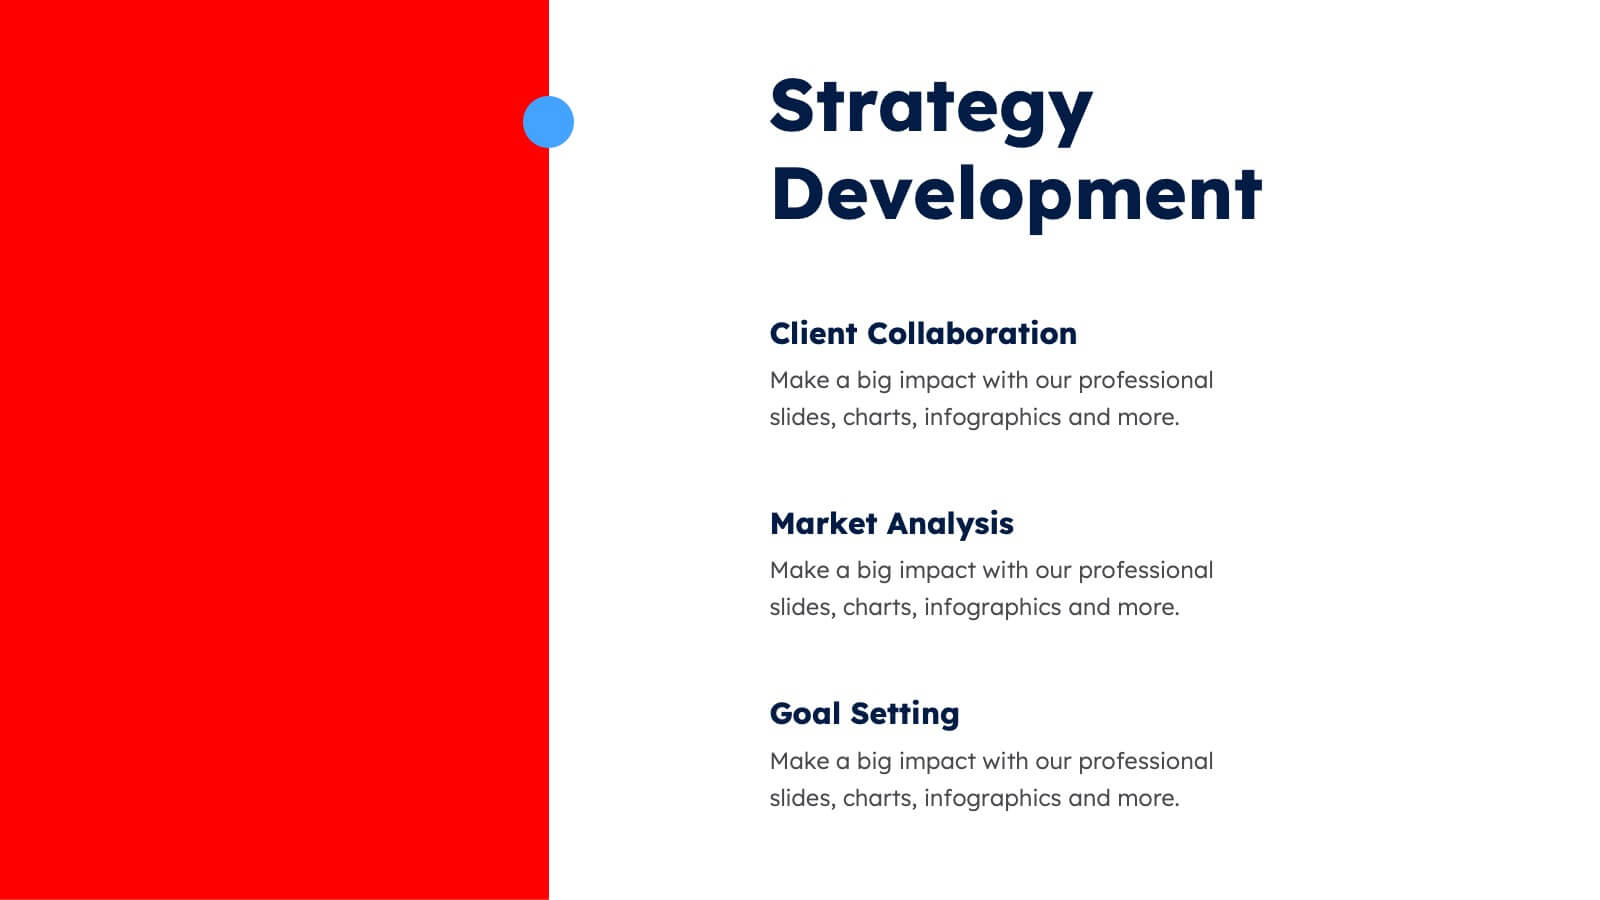
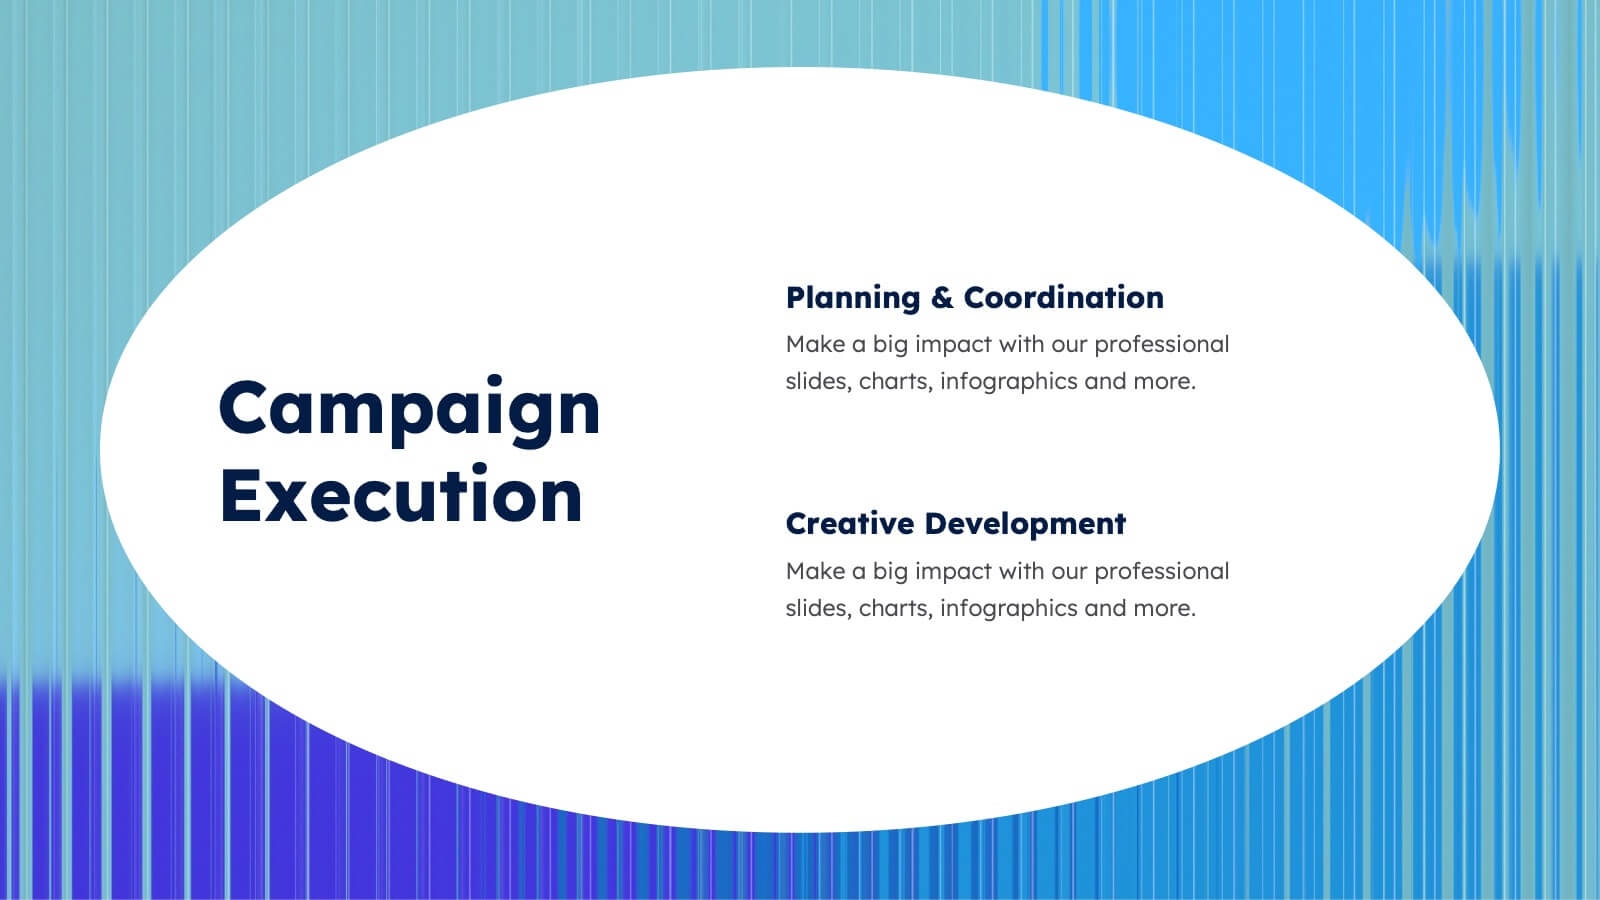
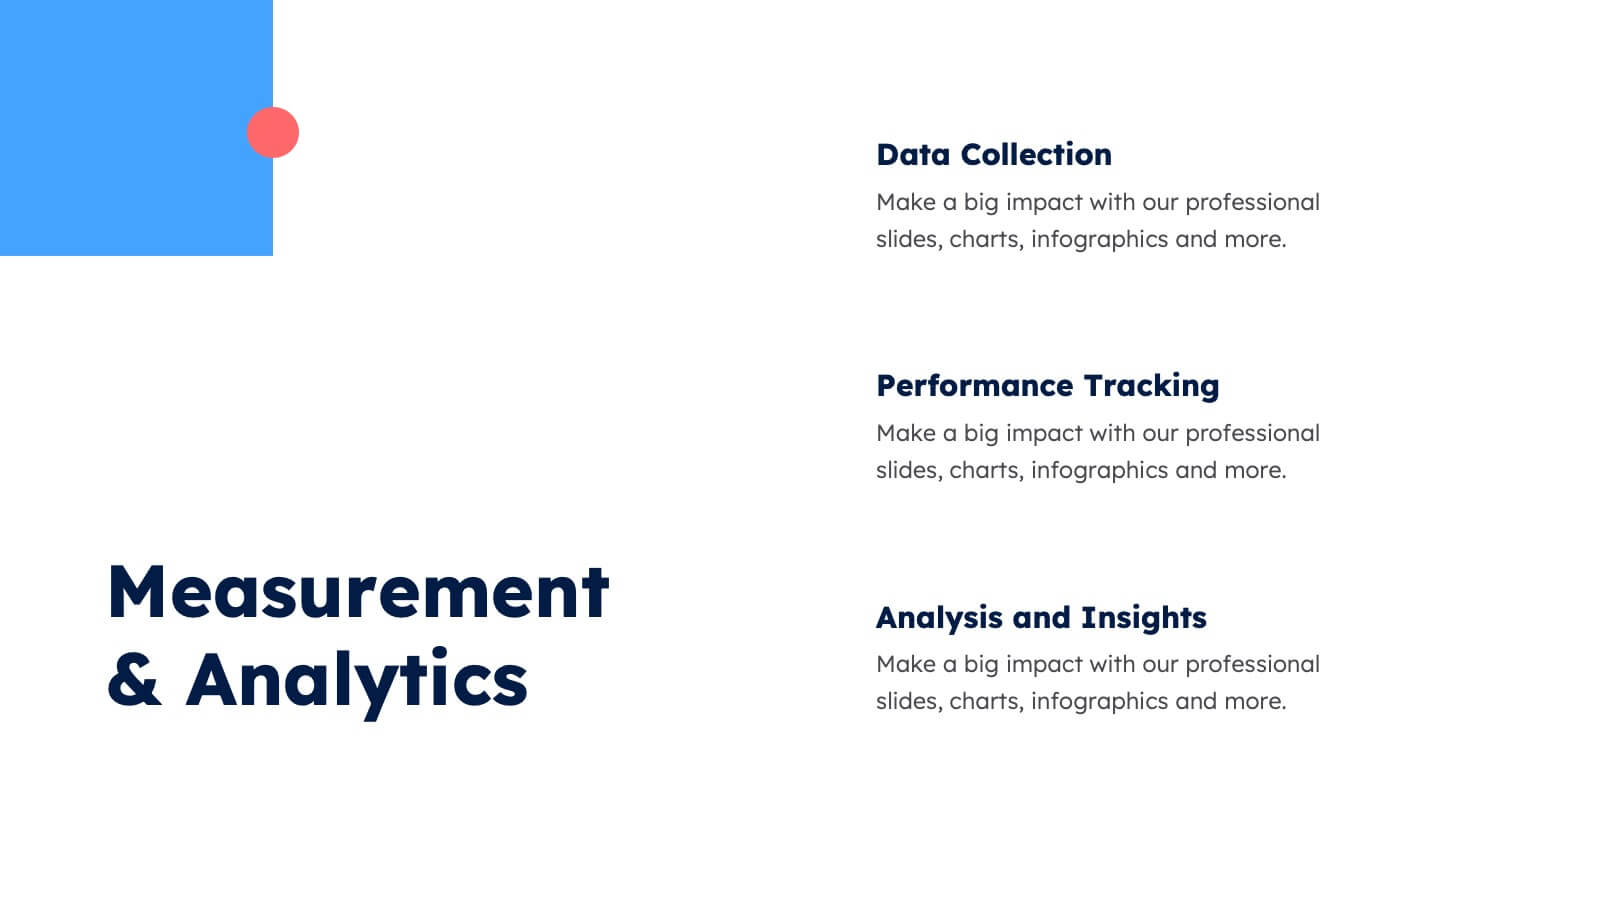
Modern Design with Geometric Elements Presentation
Elevate your message with this clean, modern layout featuring four-leaf geometric icons and subtle color accents. Perfect for showcasing strategic concepts or business pillars in a stylish, easy-to-read format. Ideal for proposals, updates, or team presentations. Fully editable in PowerPoint, Google Slides, Keynote, and Canva. Professional and versatile.


8 diapositivas
Business Value Proposition
Clearly communicate your brand’s core value with this quadrant-style slide, ideal for pitching key benefits, market differentiators, or service pillars. Designed for product managers, marketers, and business consultants. Fully editable in PowerPoint, Keynote, and Google Slides—customize icons, titles, and layout with ease.


7 diapositivas
Money Value Infographic
The value of money refers to its purchasing power or what it can buy in goods, services, or investments. Creating an infographic about the value of money can help people understand various aspects of finance, investment, and wealth. This template is compatible with Powerpoint, Keynote, and Google Slides. Customize the content, design, and visuals to create an engaging and informative infographic that helps people better understand the value of money and how to manage it wisely. Financial literacy is a valuable skill, and your infographic can empower individuals to make sound financial decisions.


6 diapositivas
Multiple Choice Options Slide Presentation
Make your ideas stand out with a bold, interactive design that organizes multiple options clearly and visually. Ideal for showcasing comparisons, scenarios, or decision pathways, this presentation keeps audiences engaged and informed. Fully compatible with PowerPoint, Keynote, and Google Slides for seamless customization and professional results.
21 diapositivas
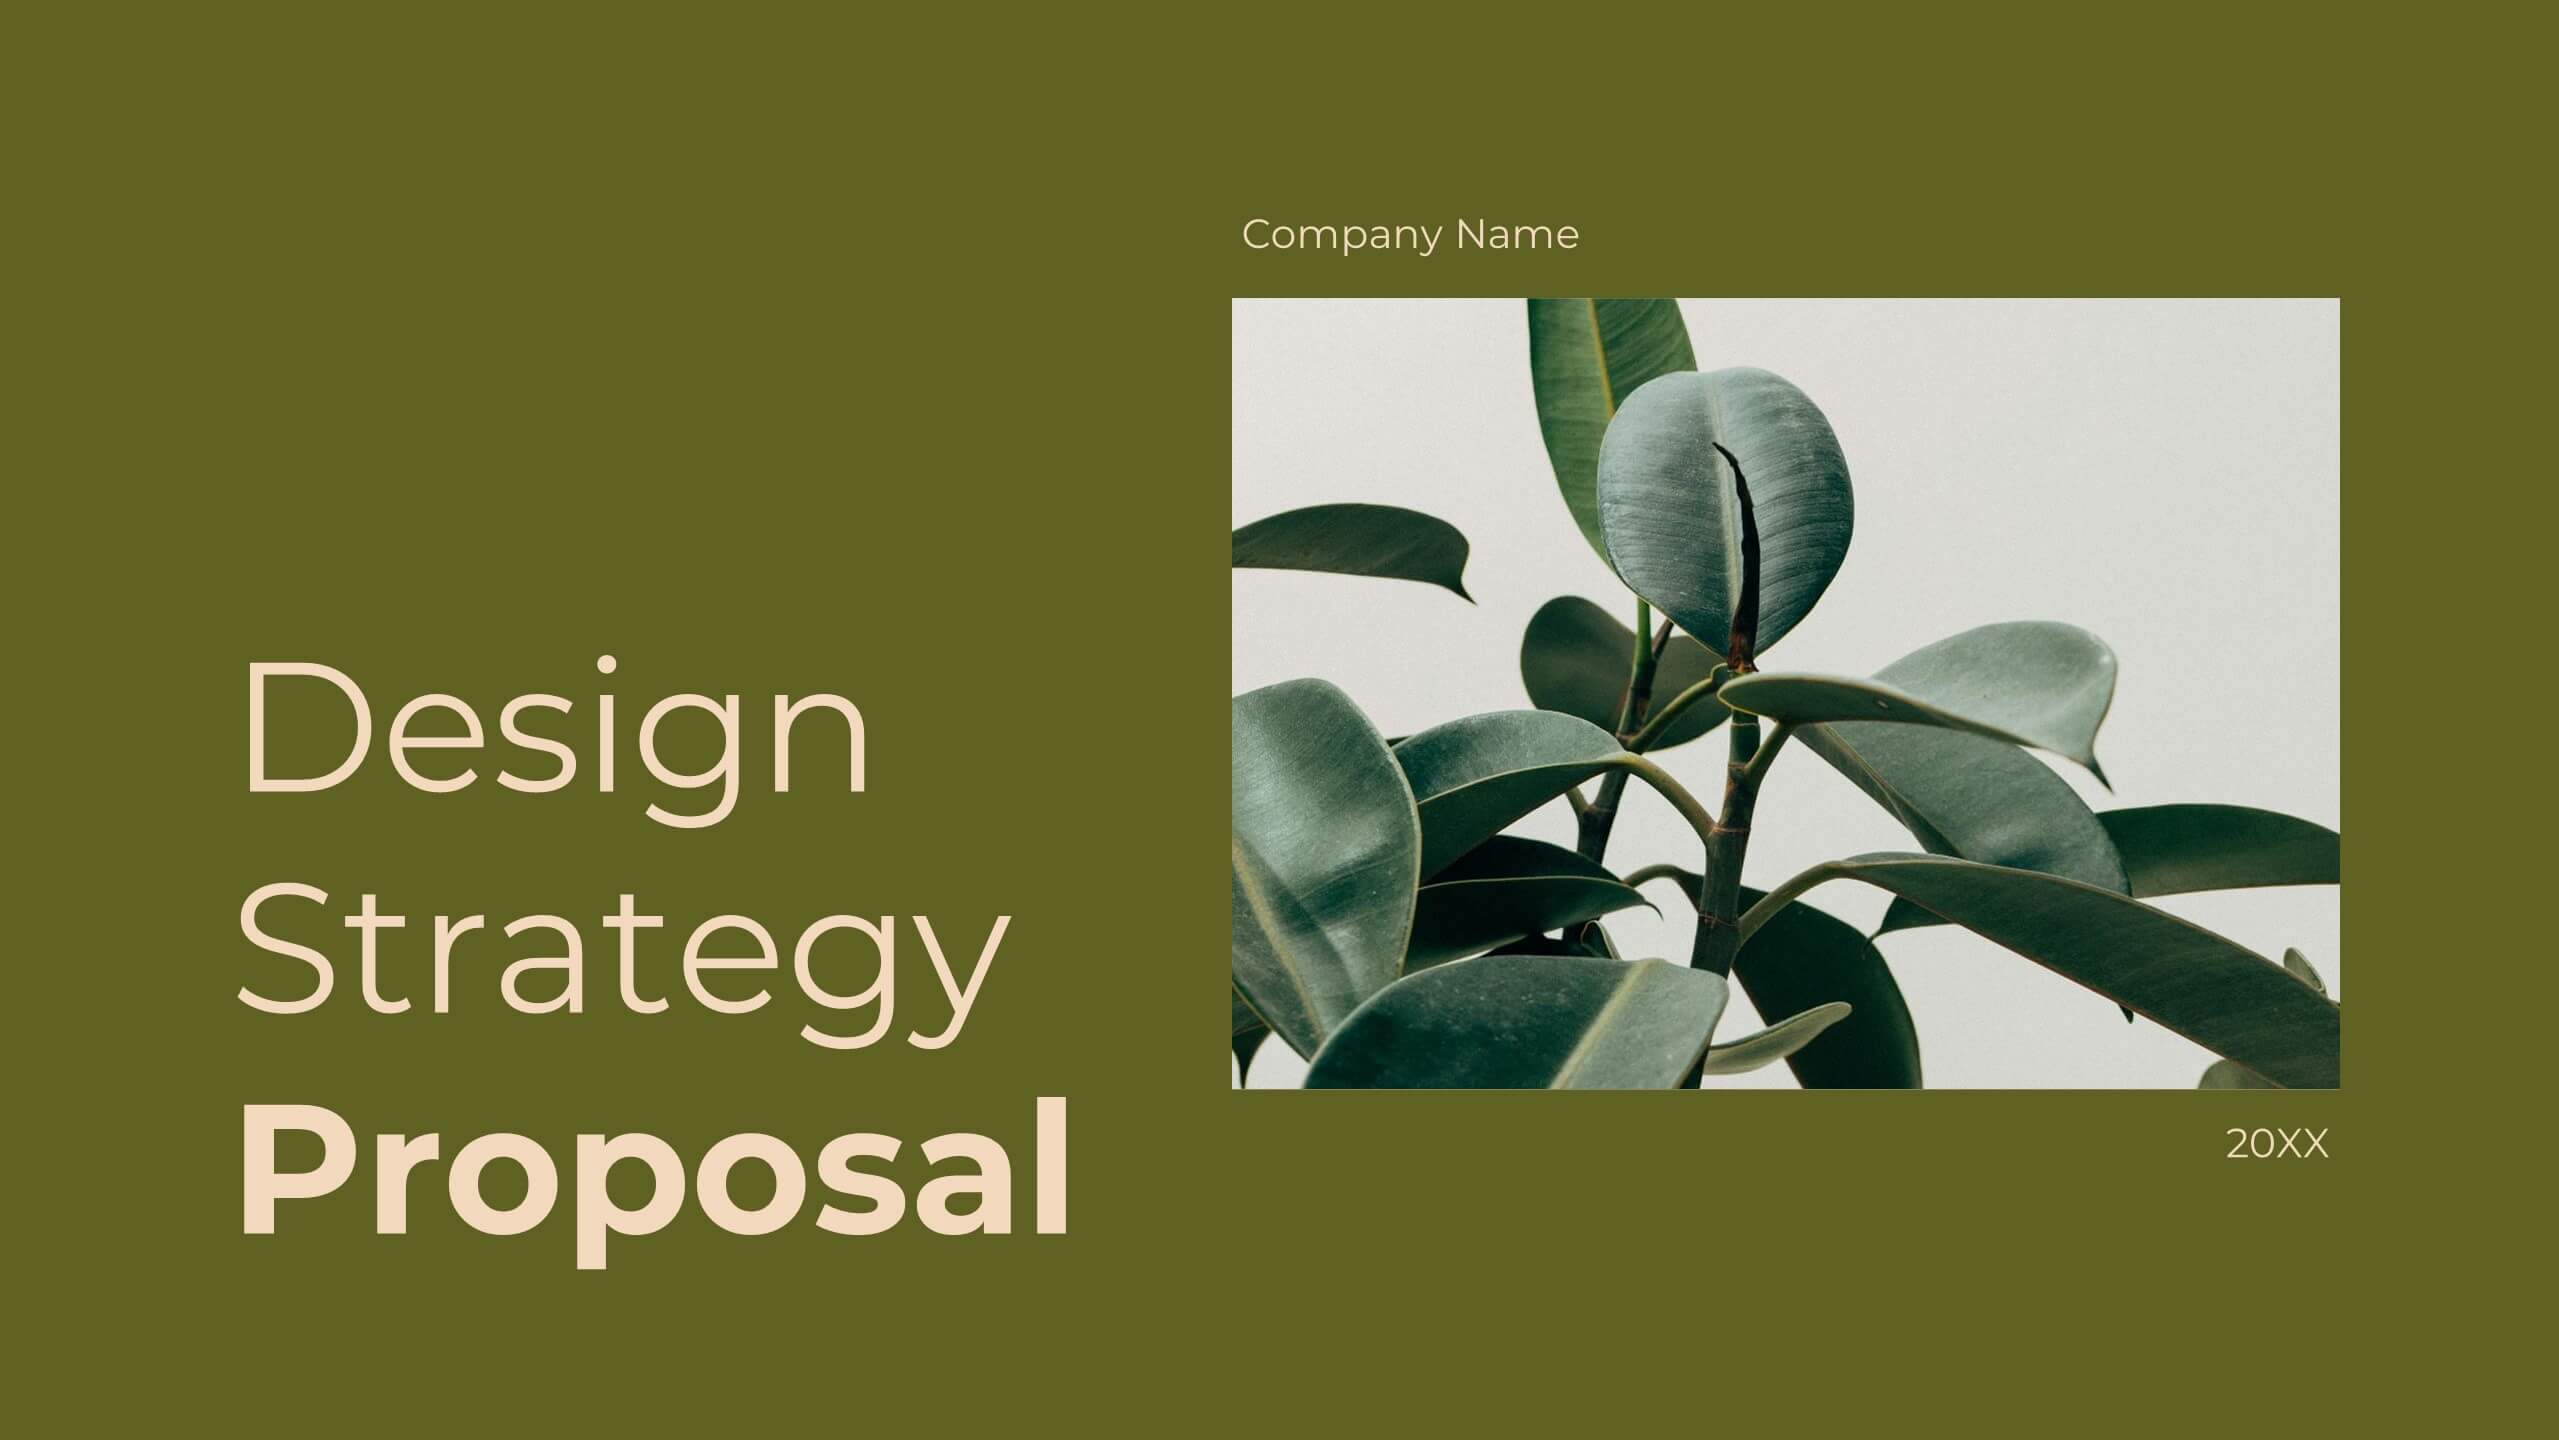
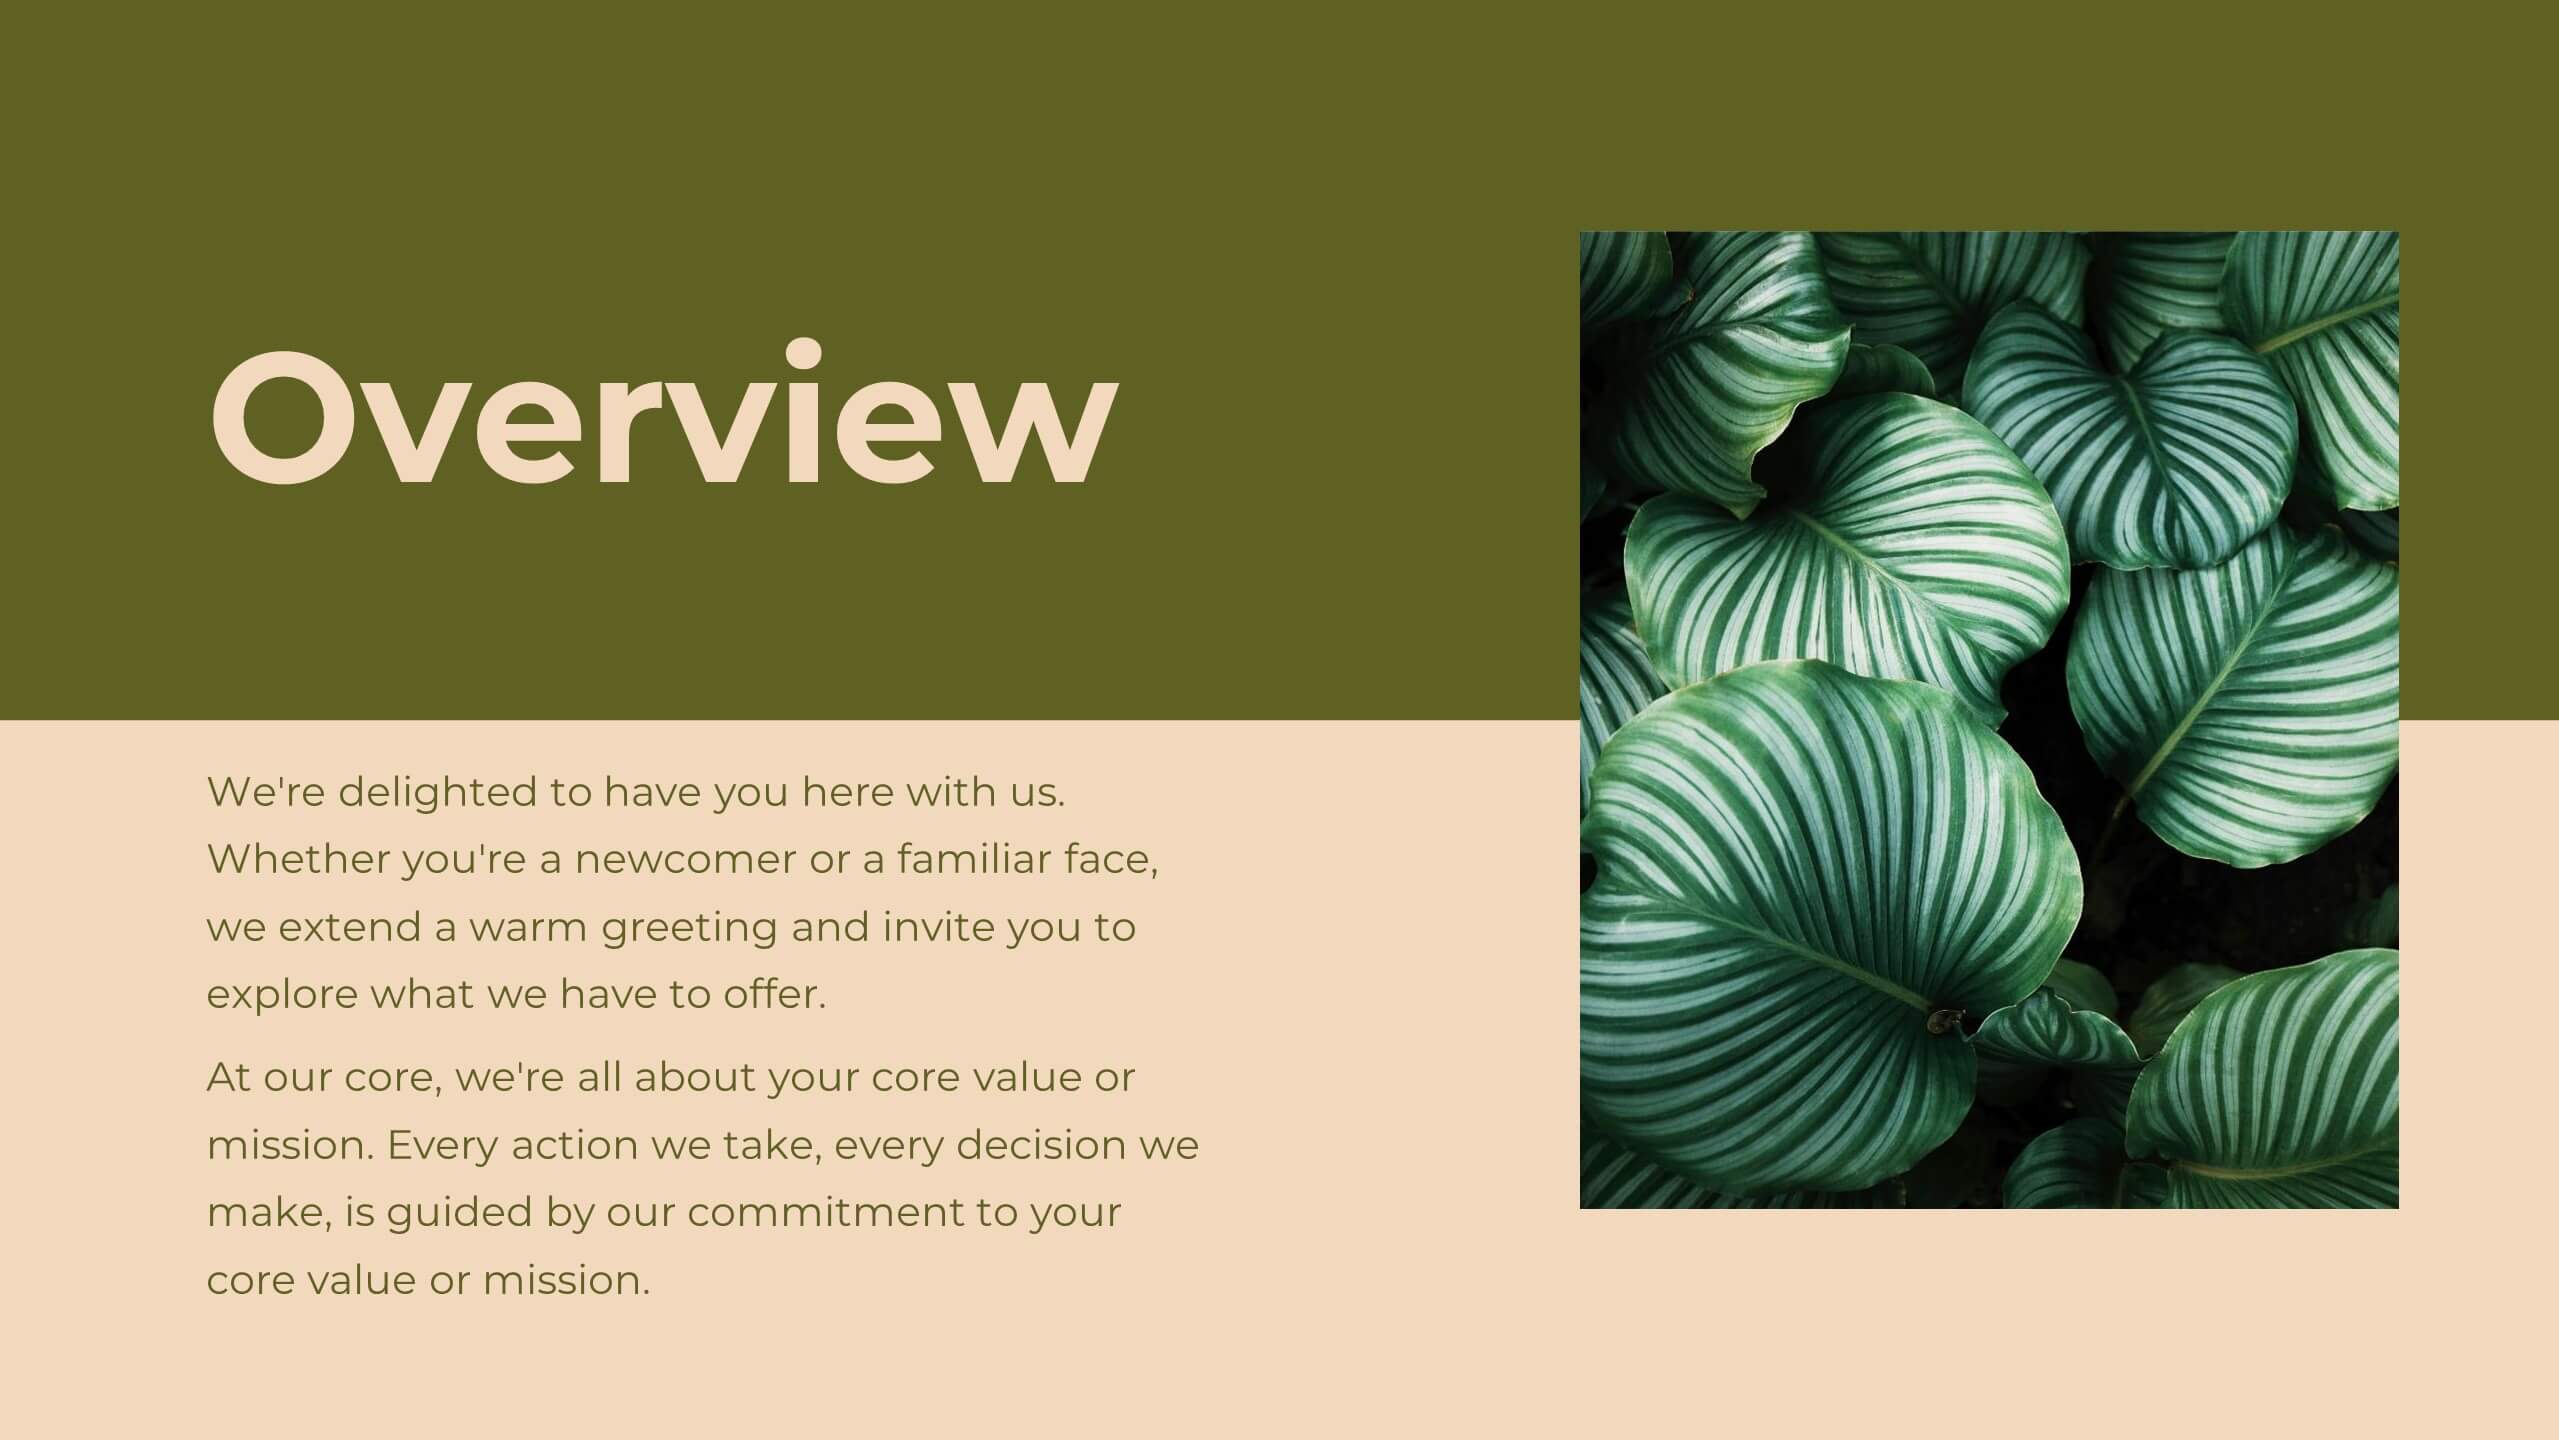
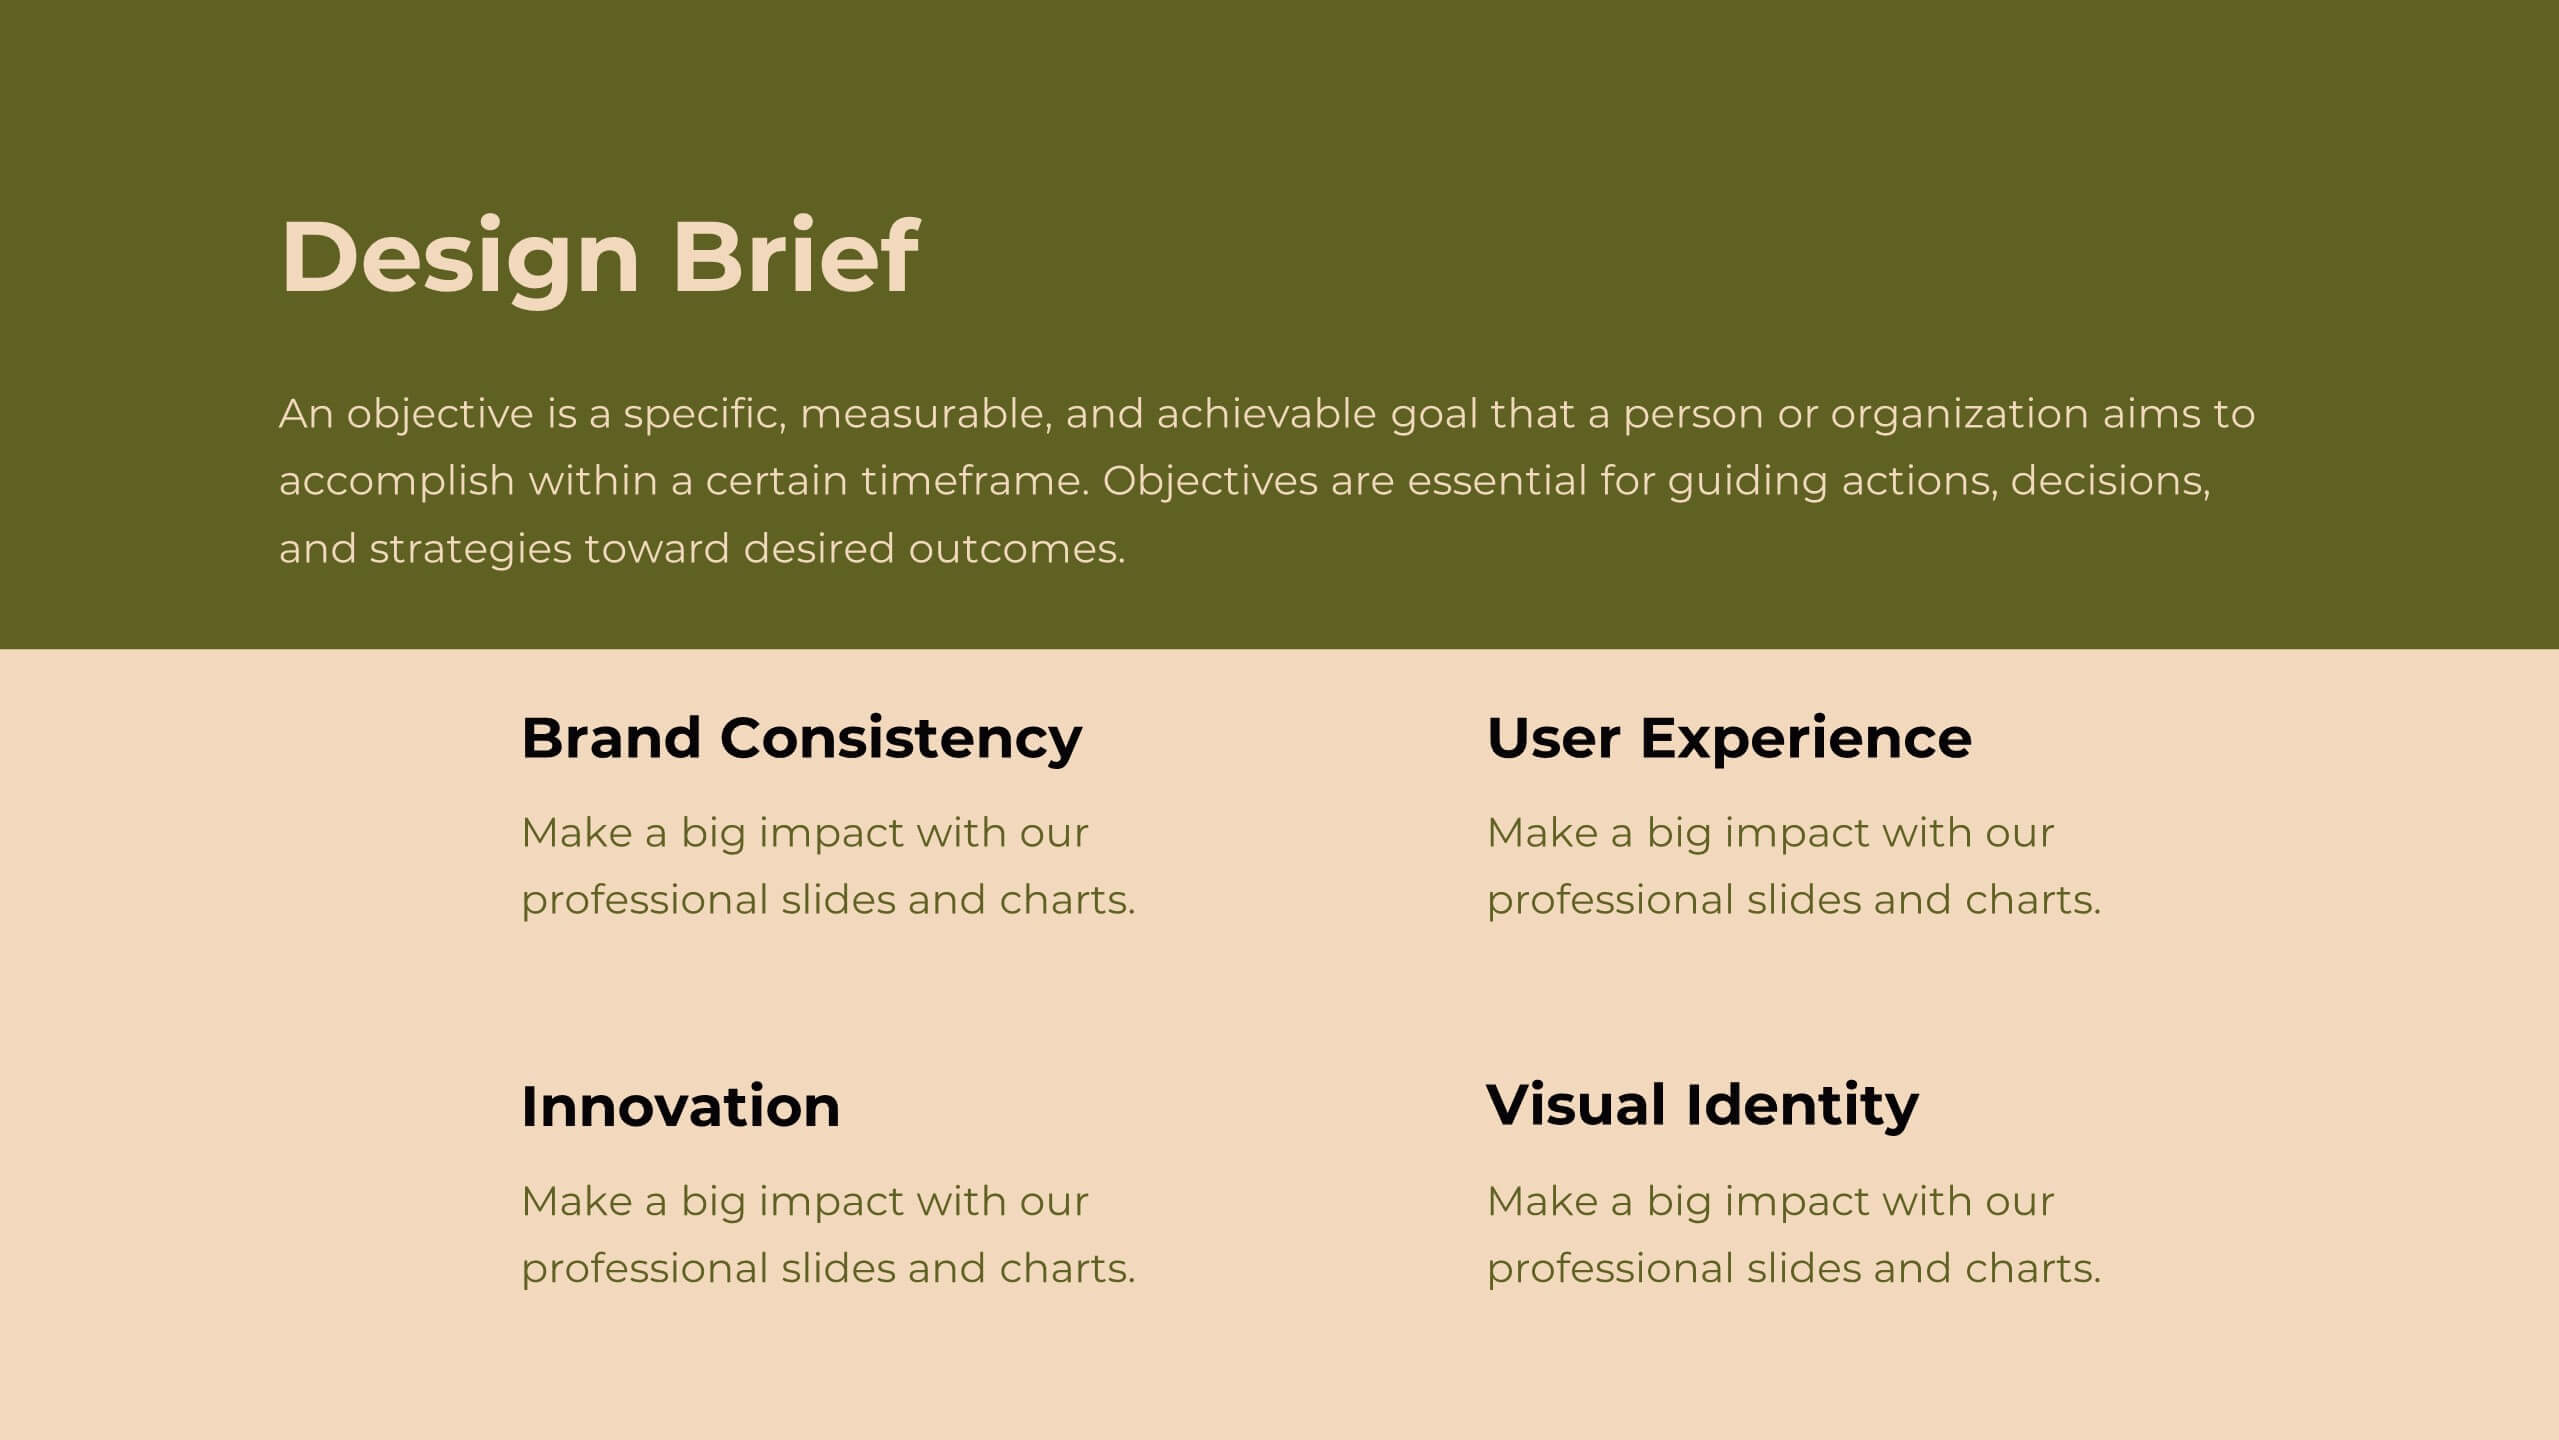
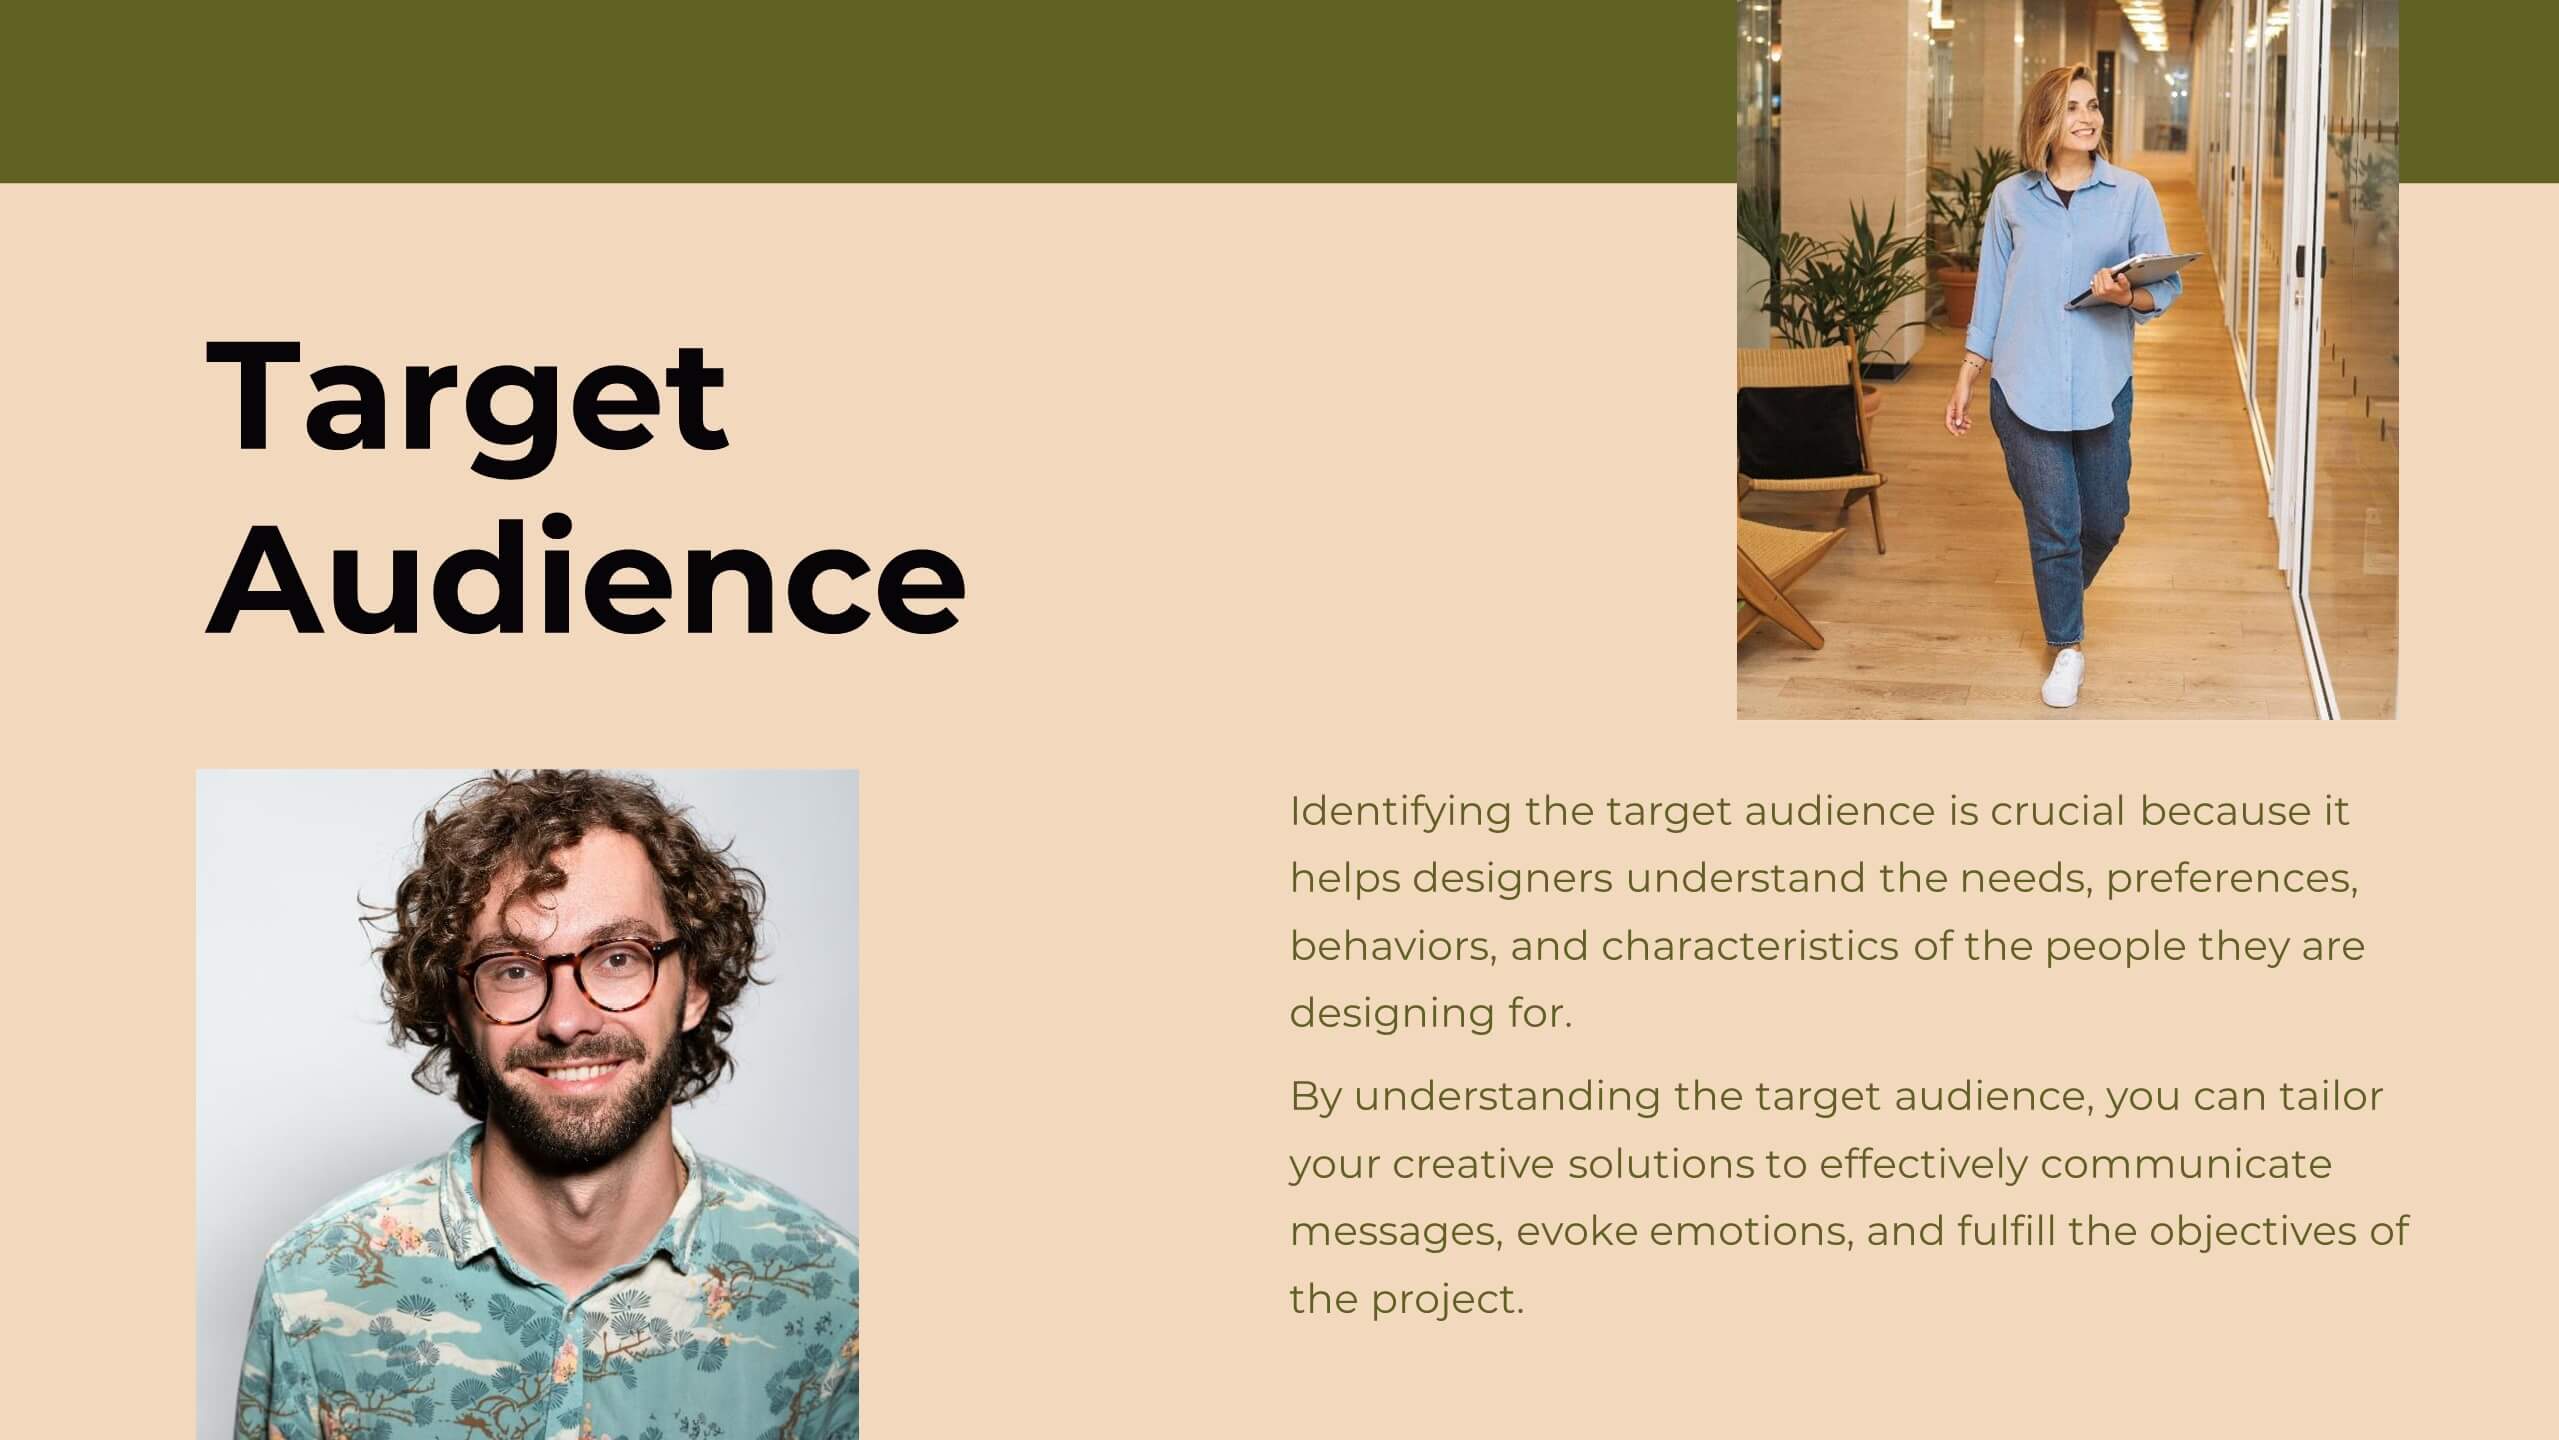
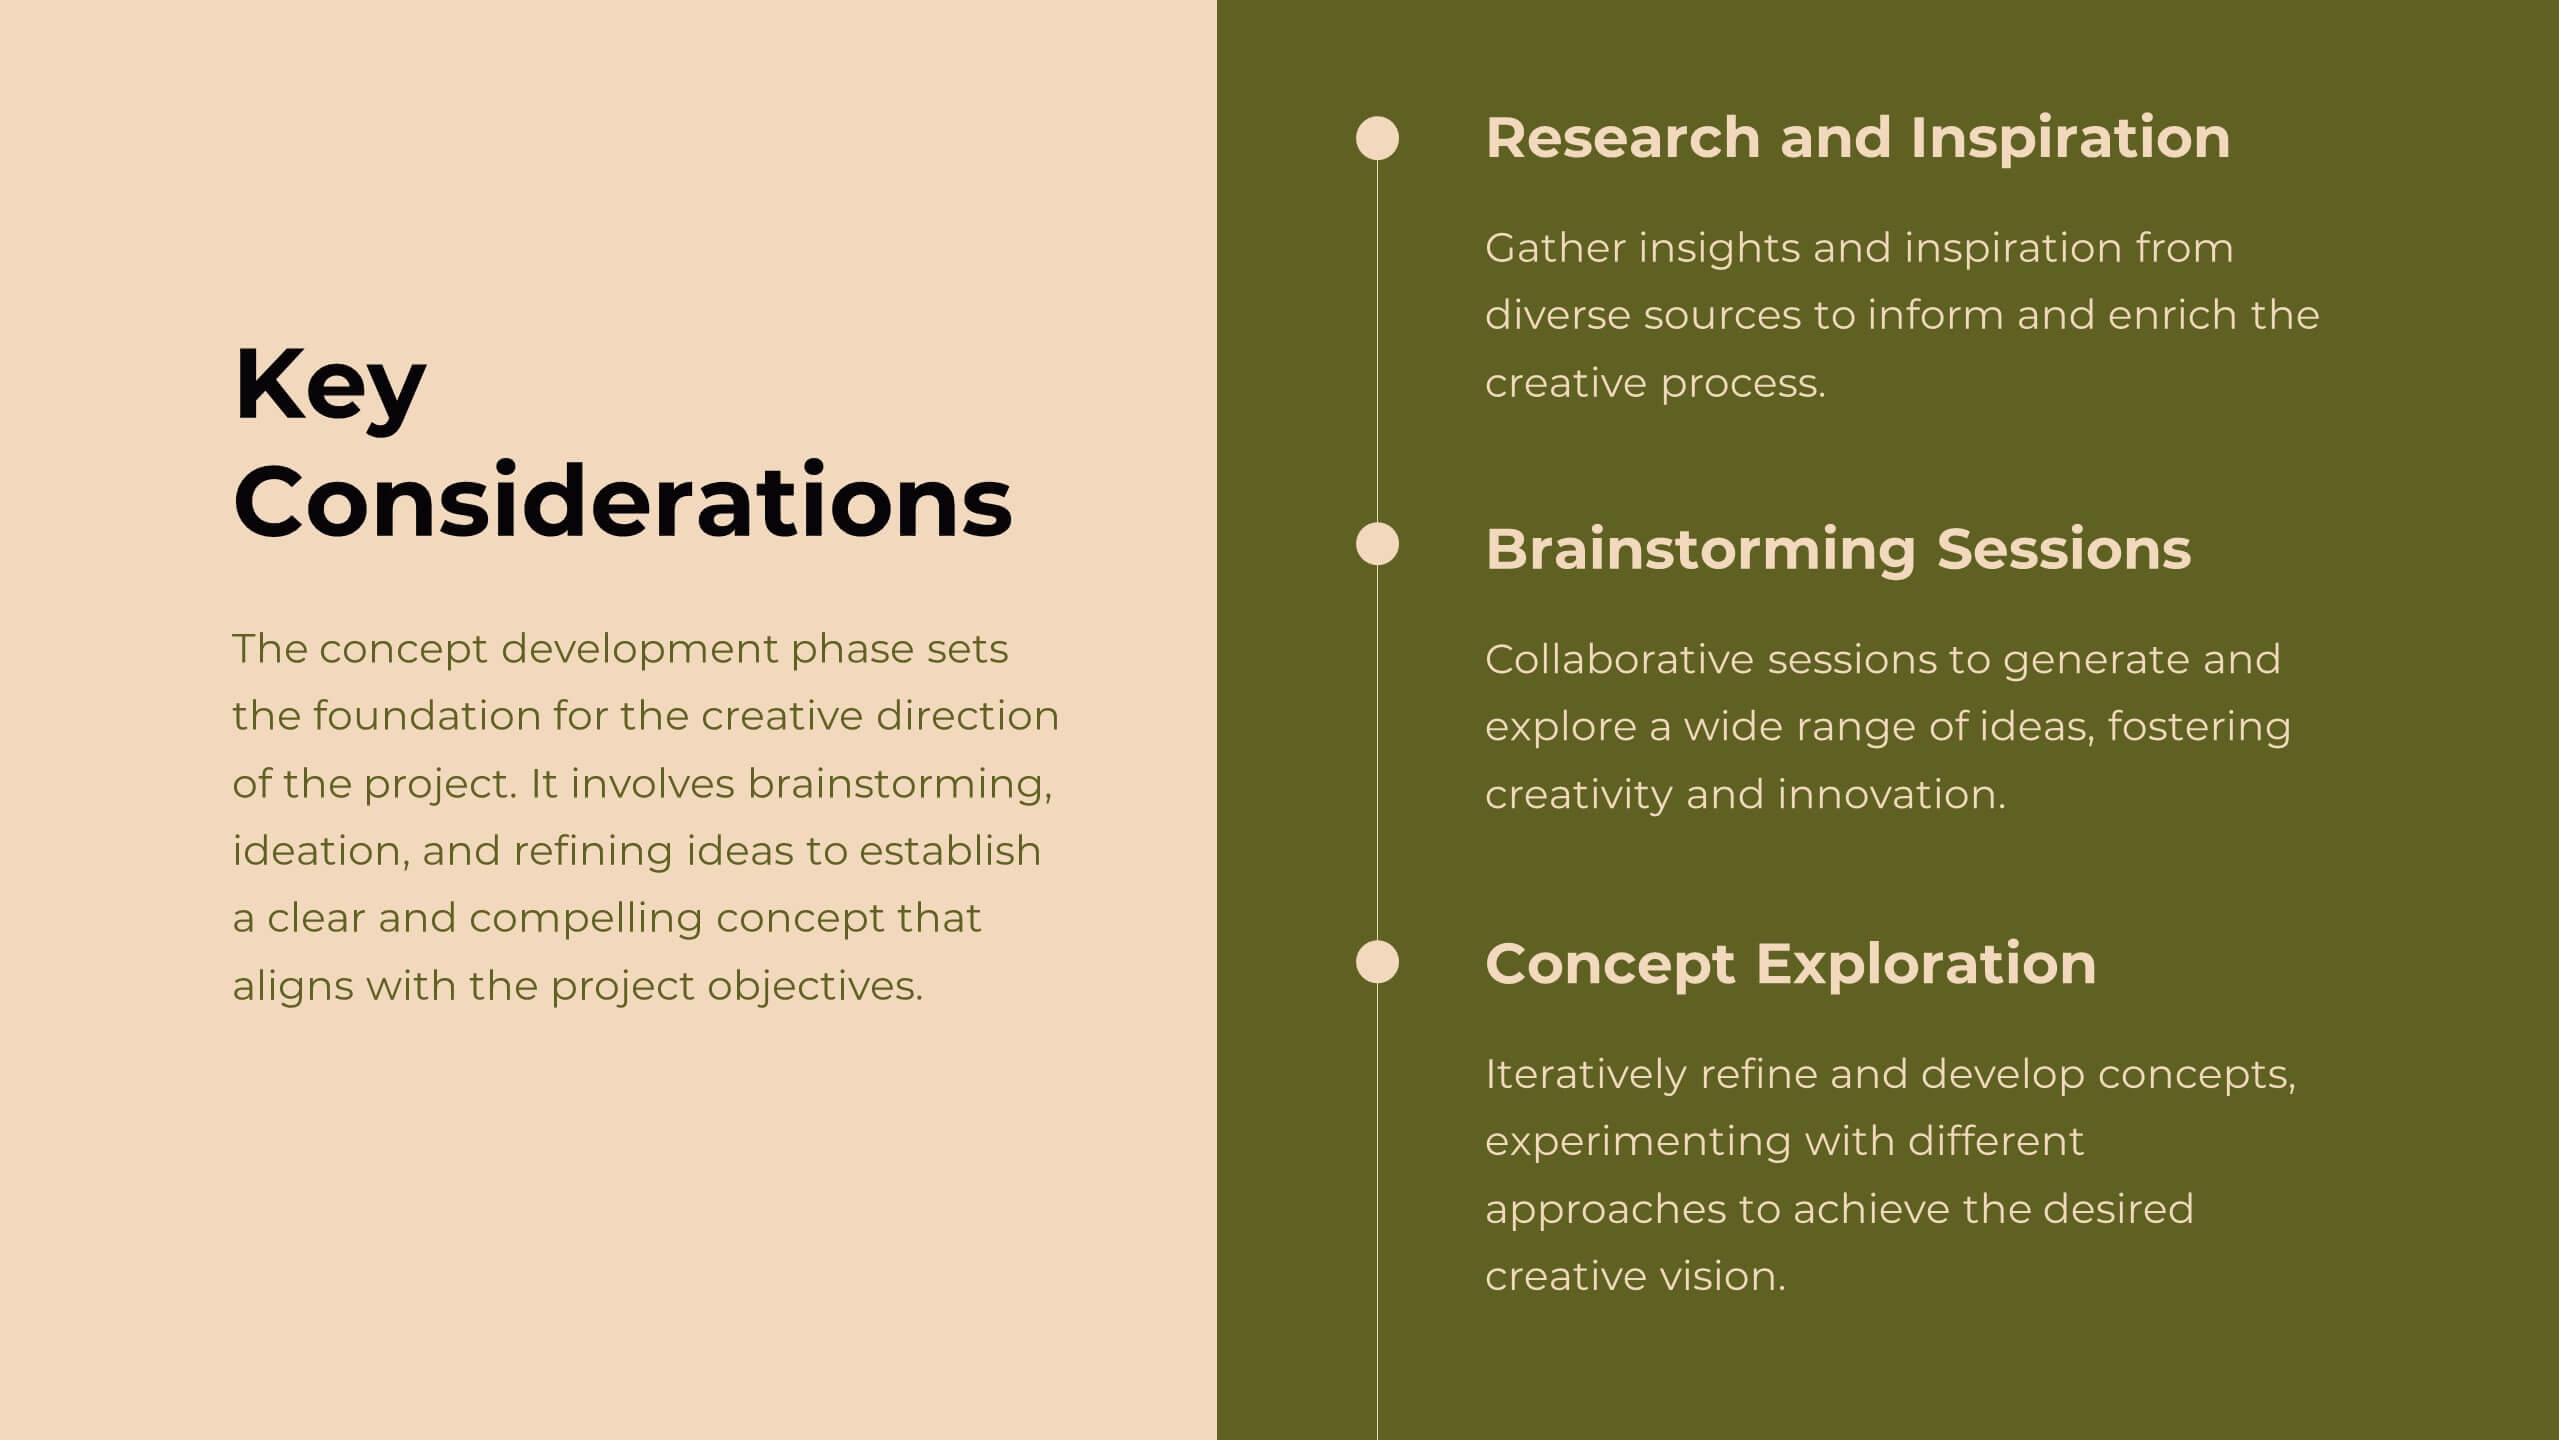
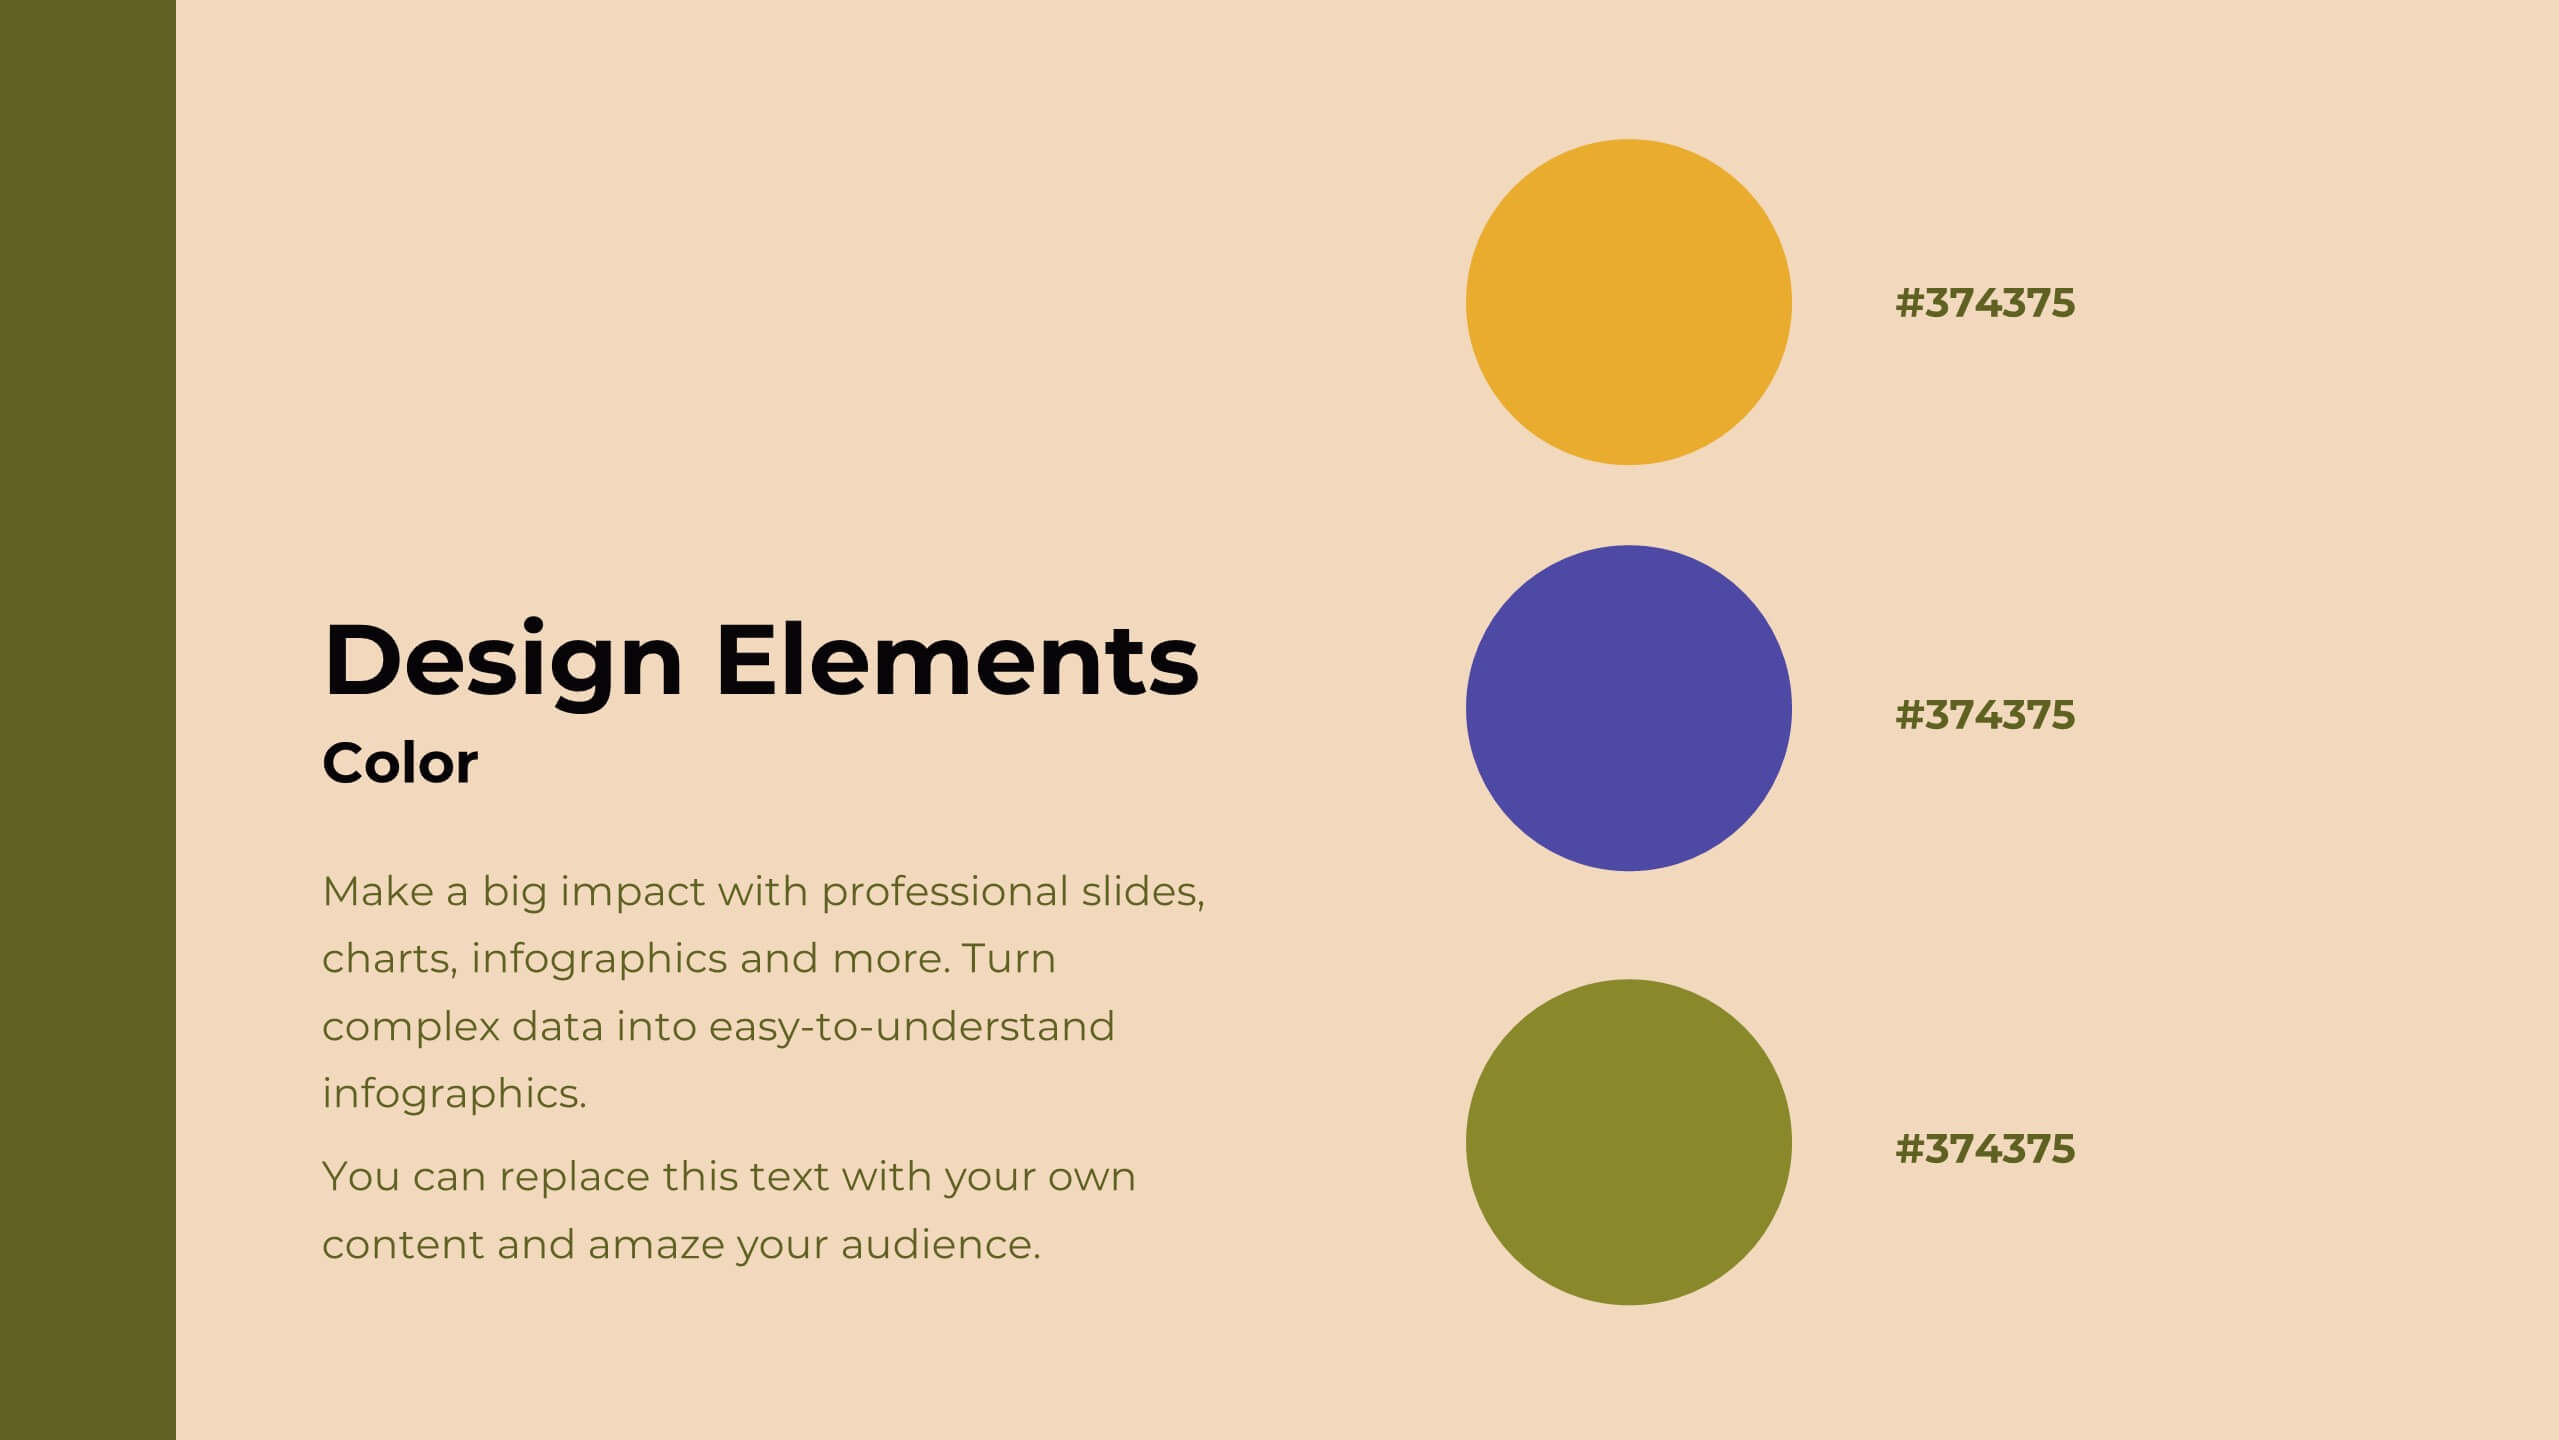
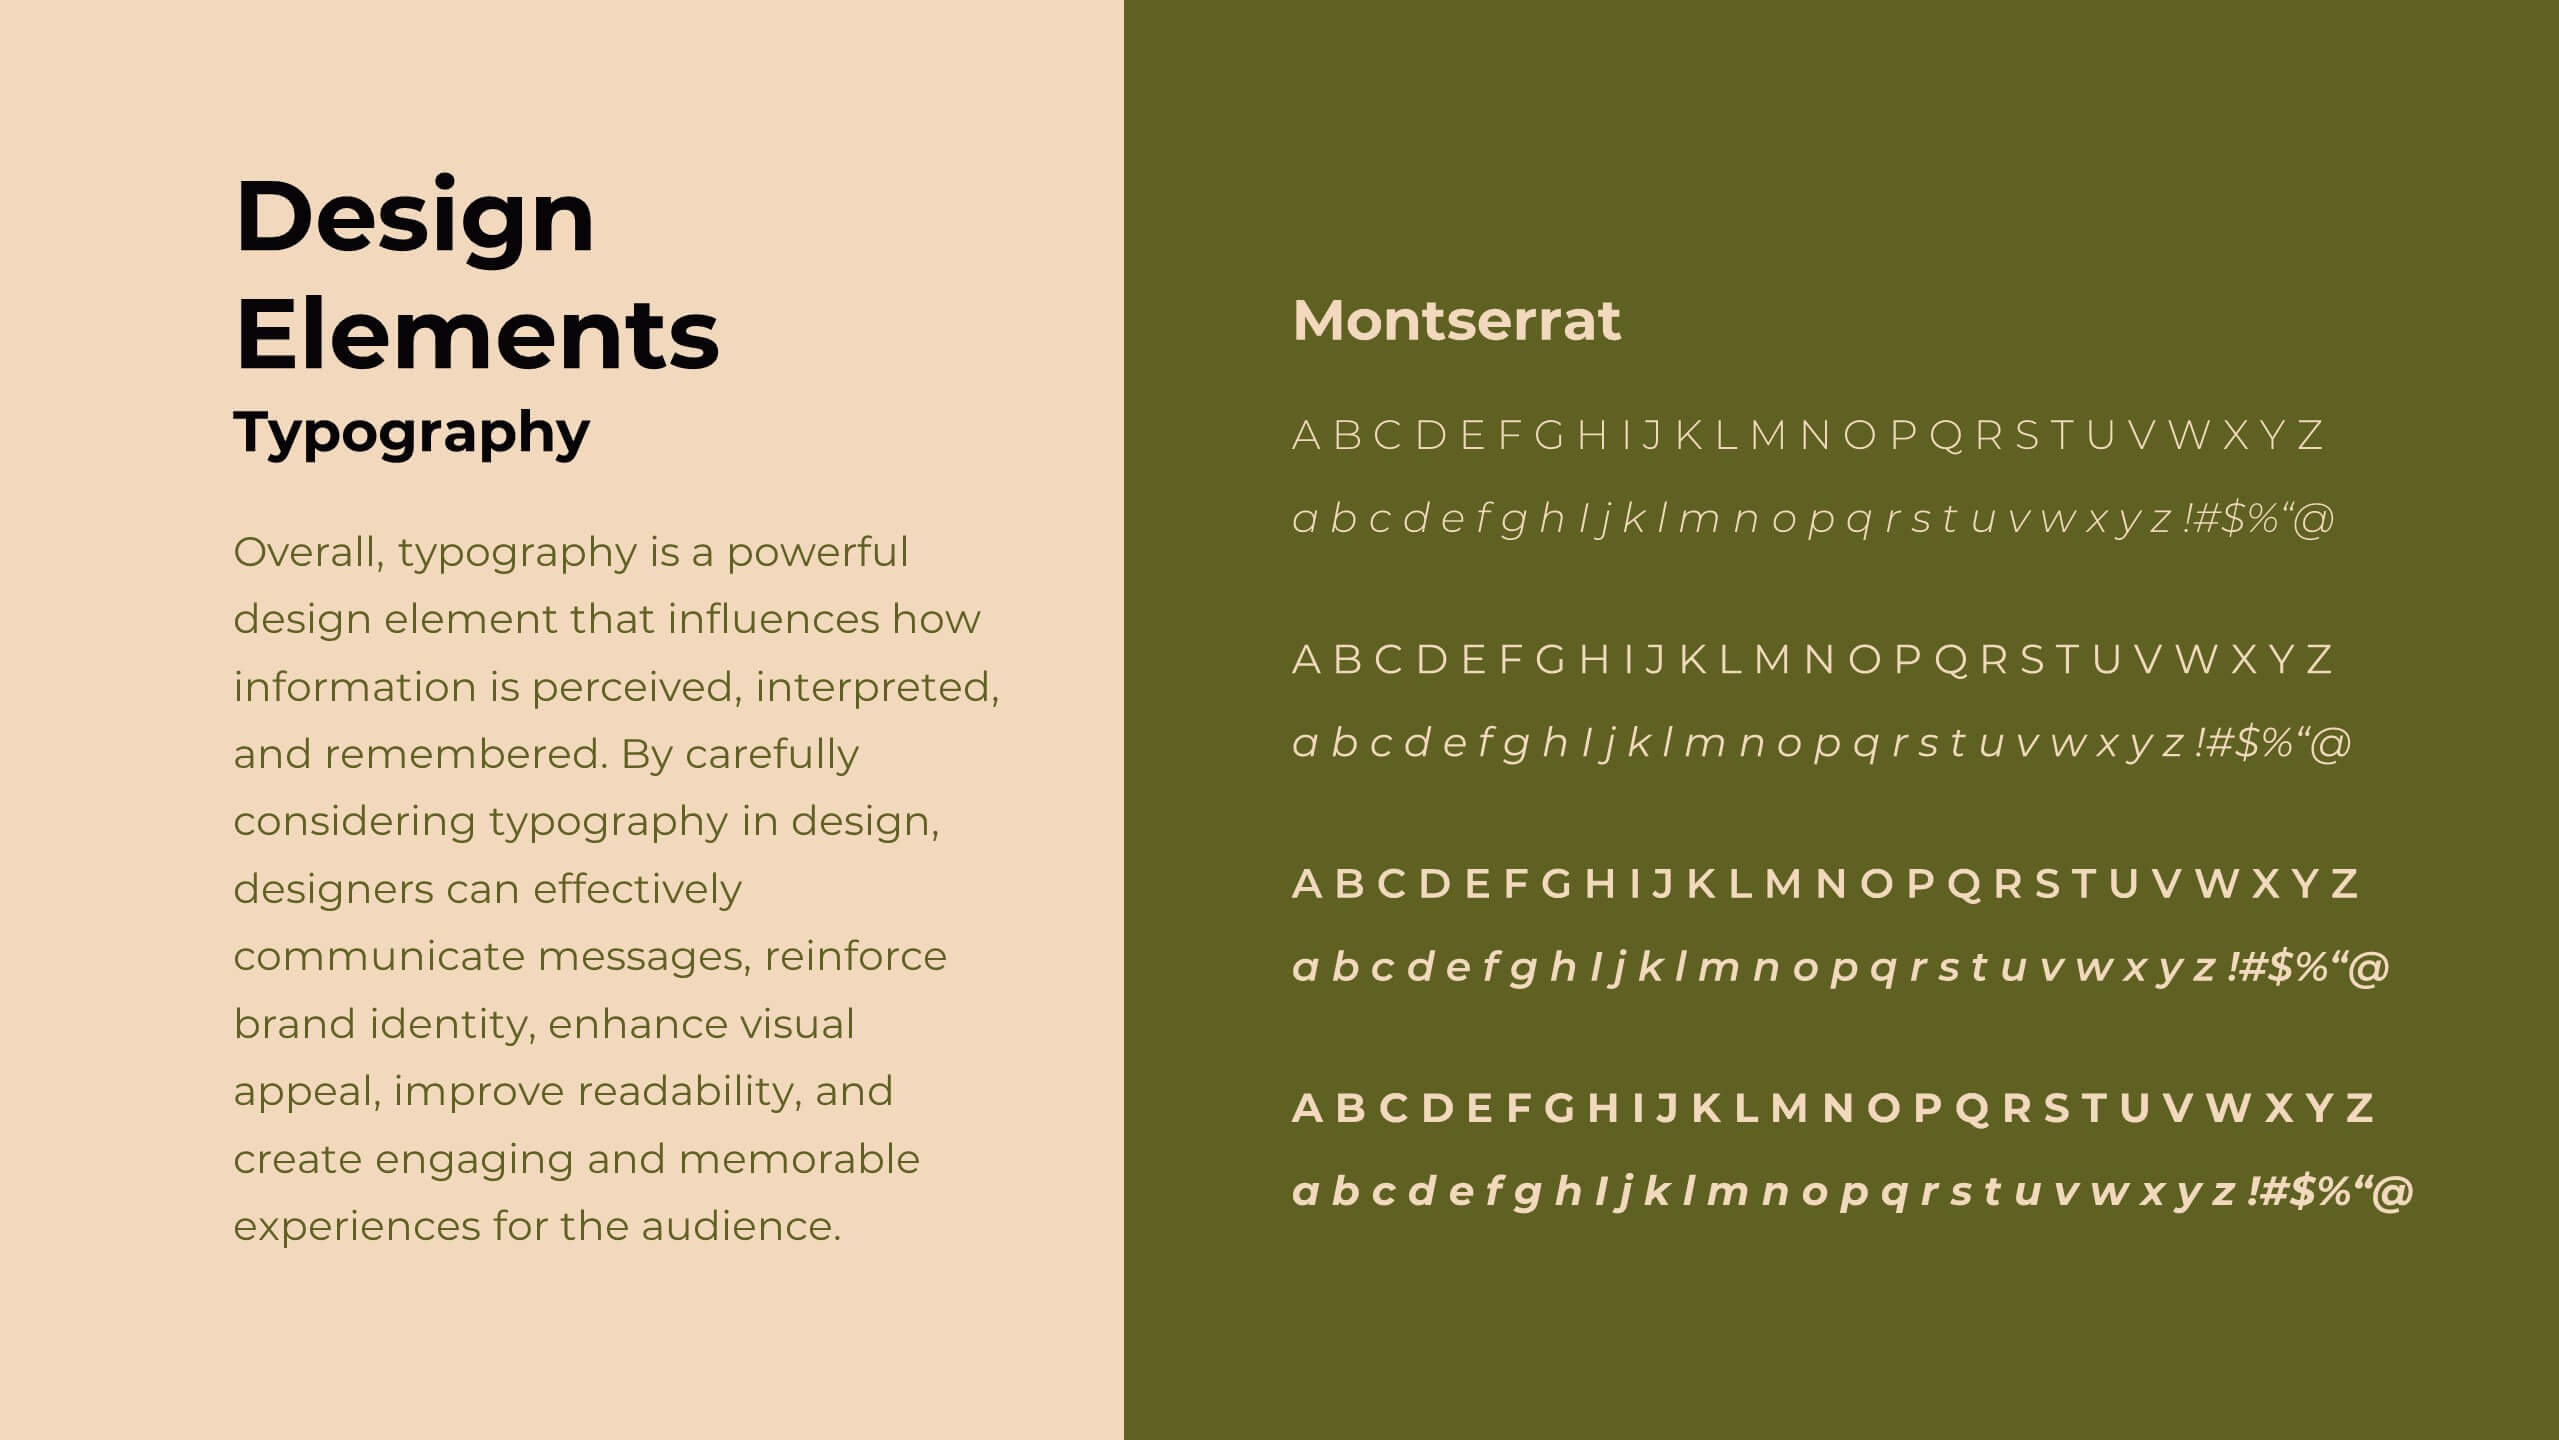
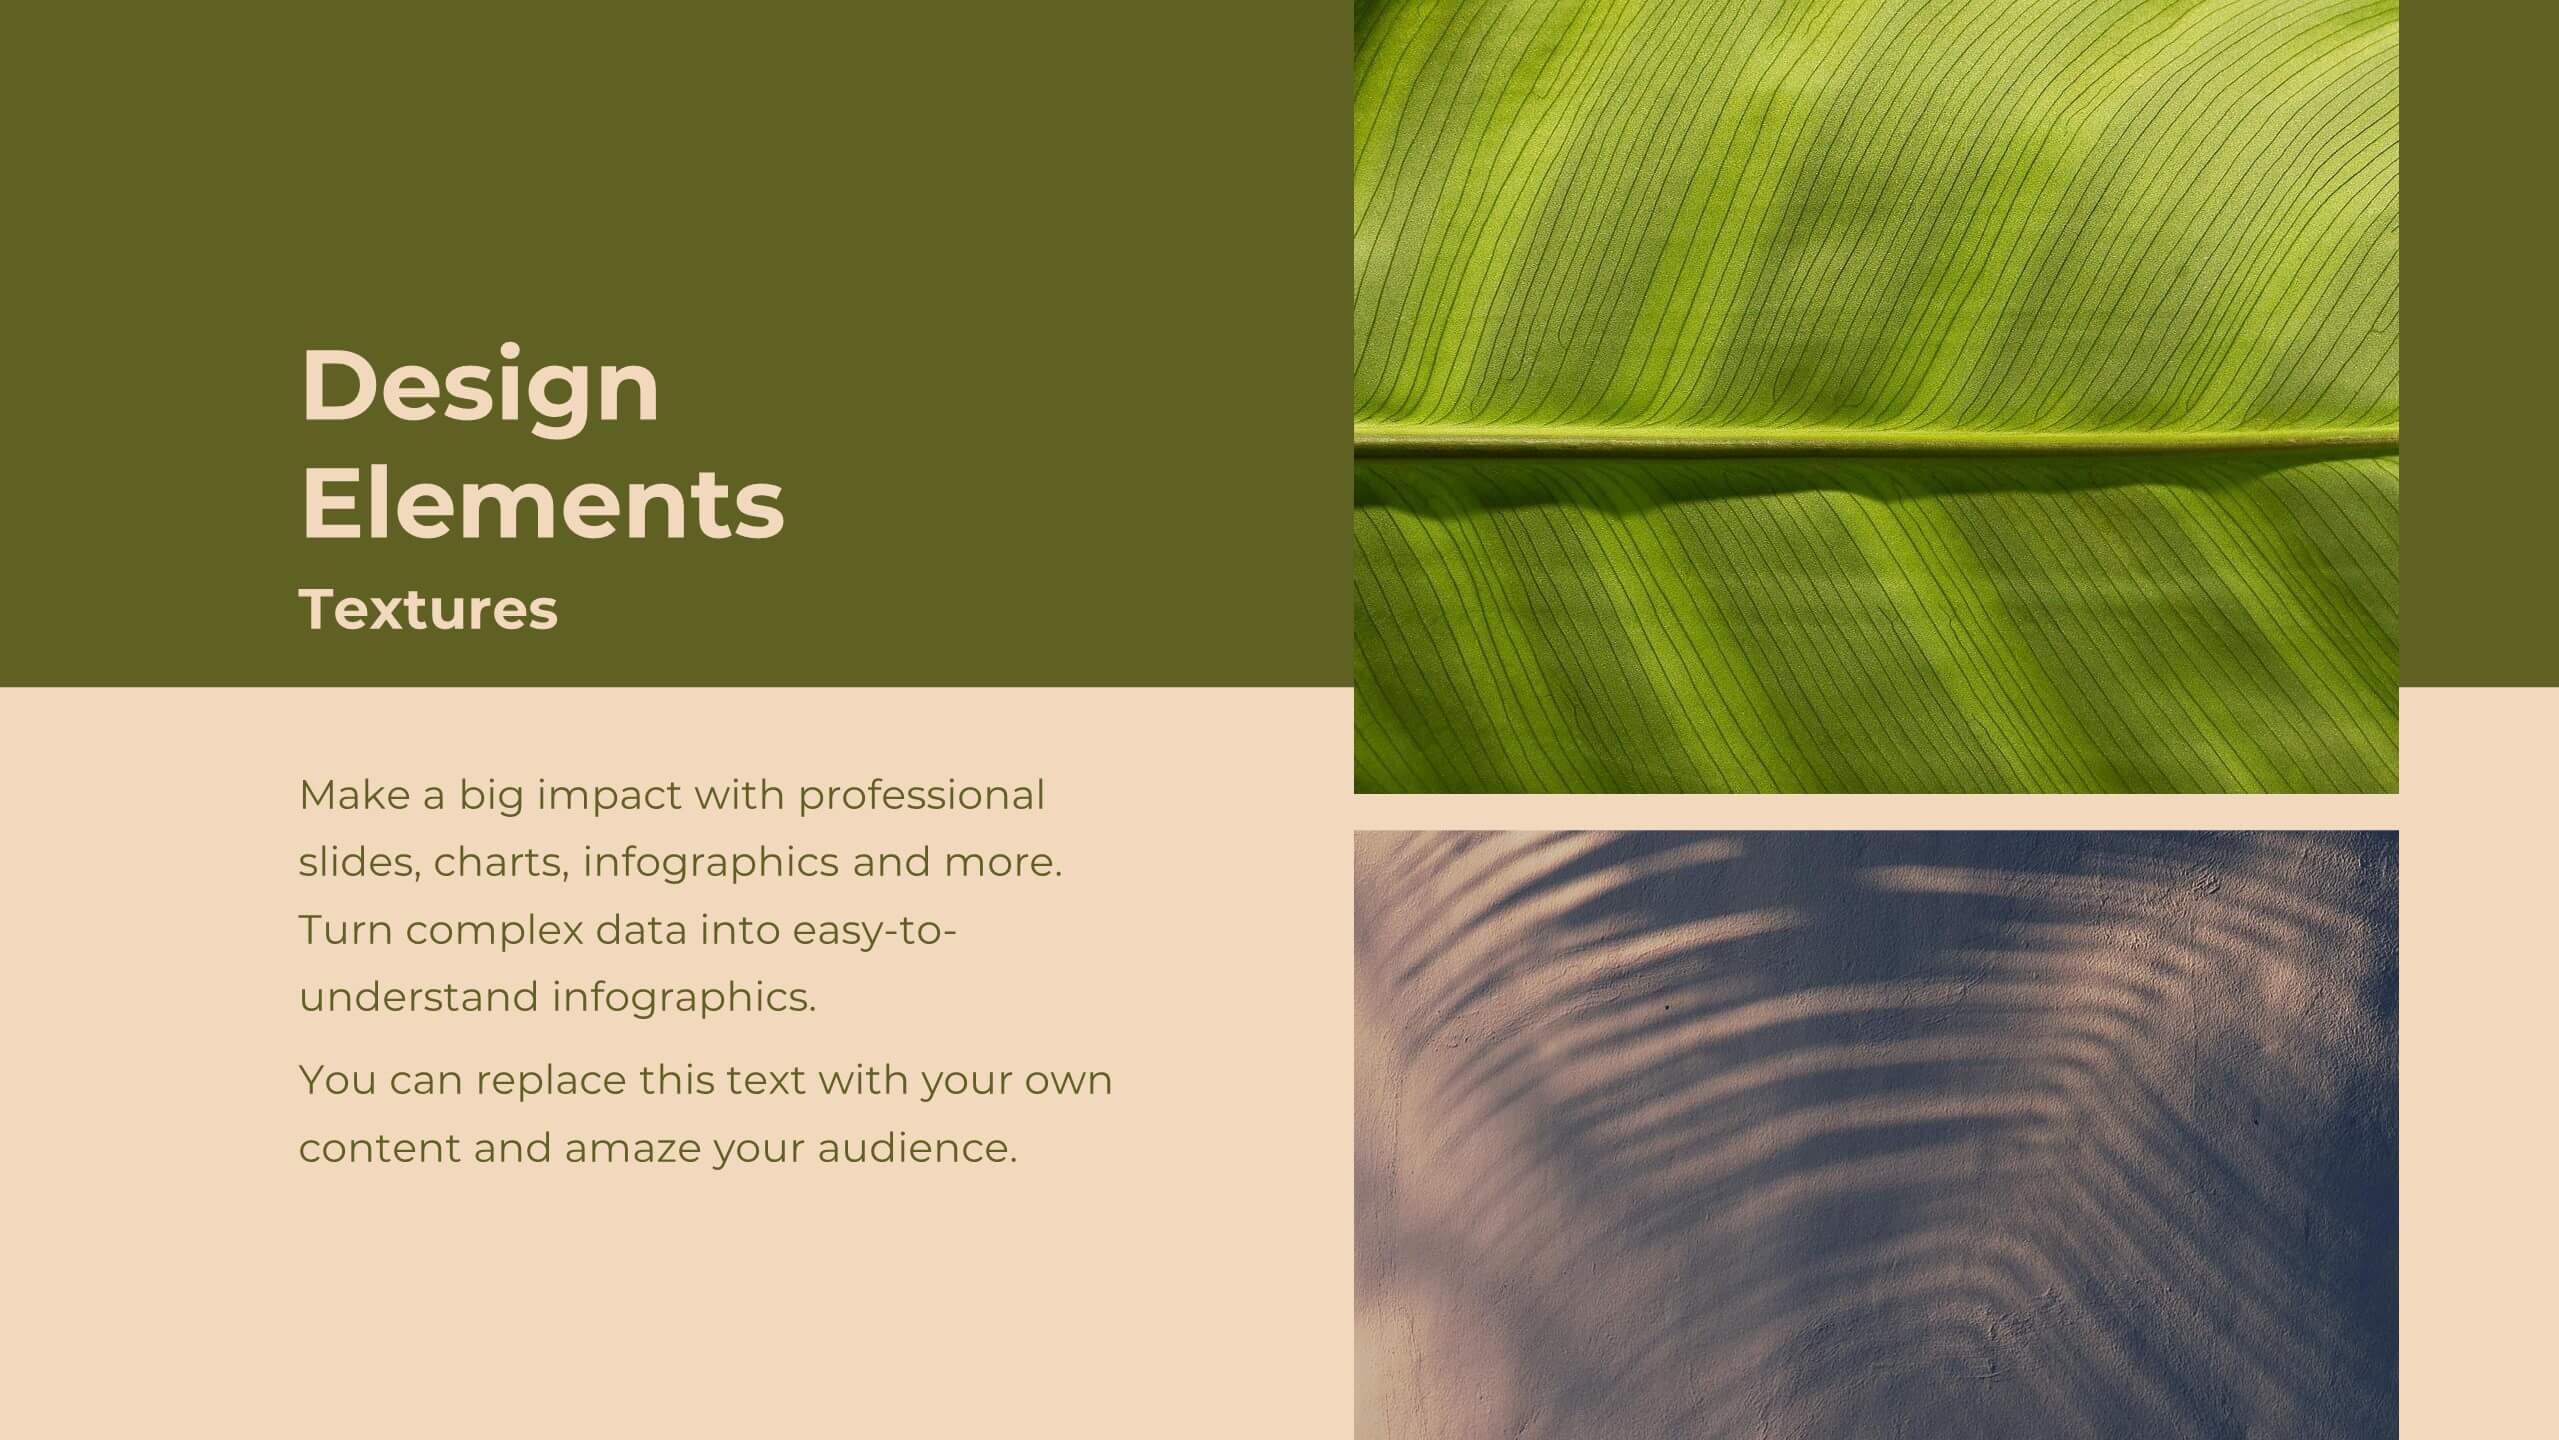
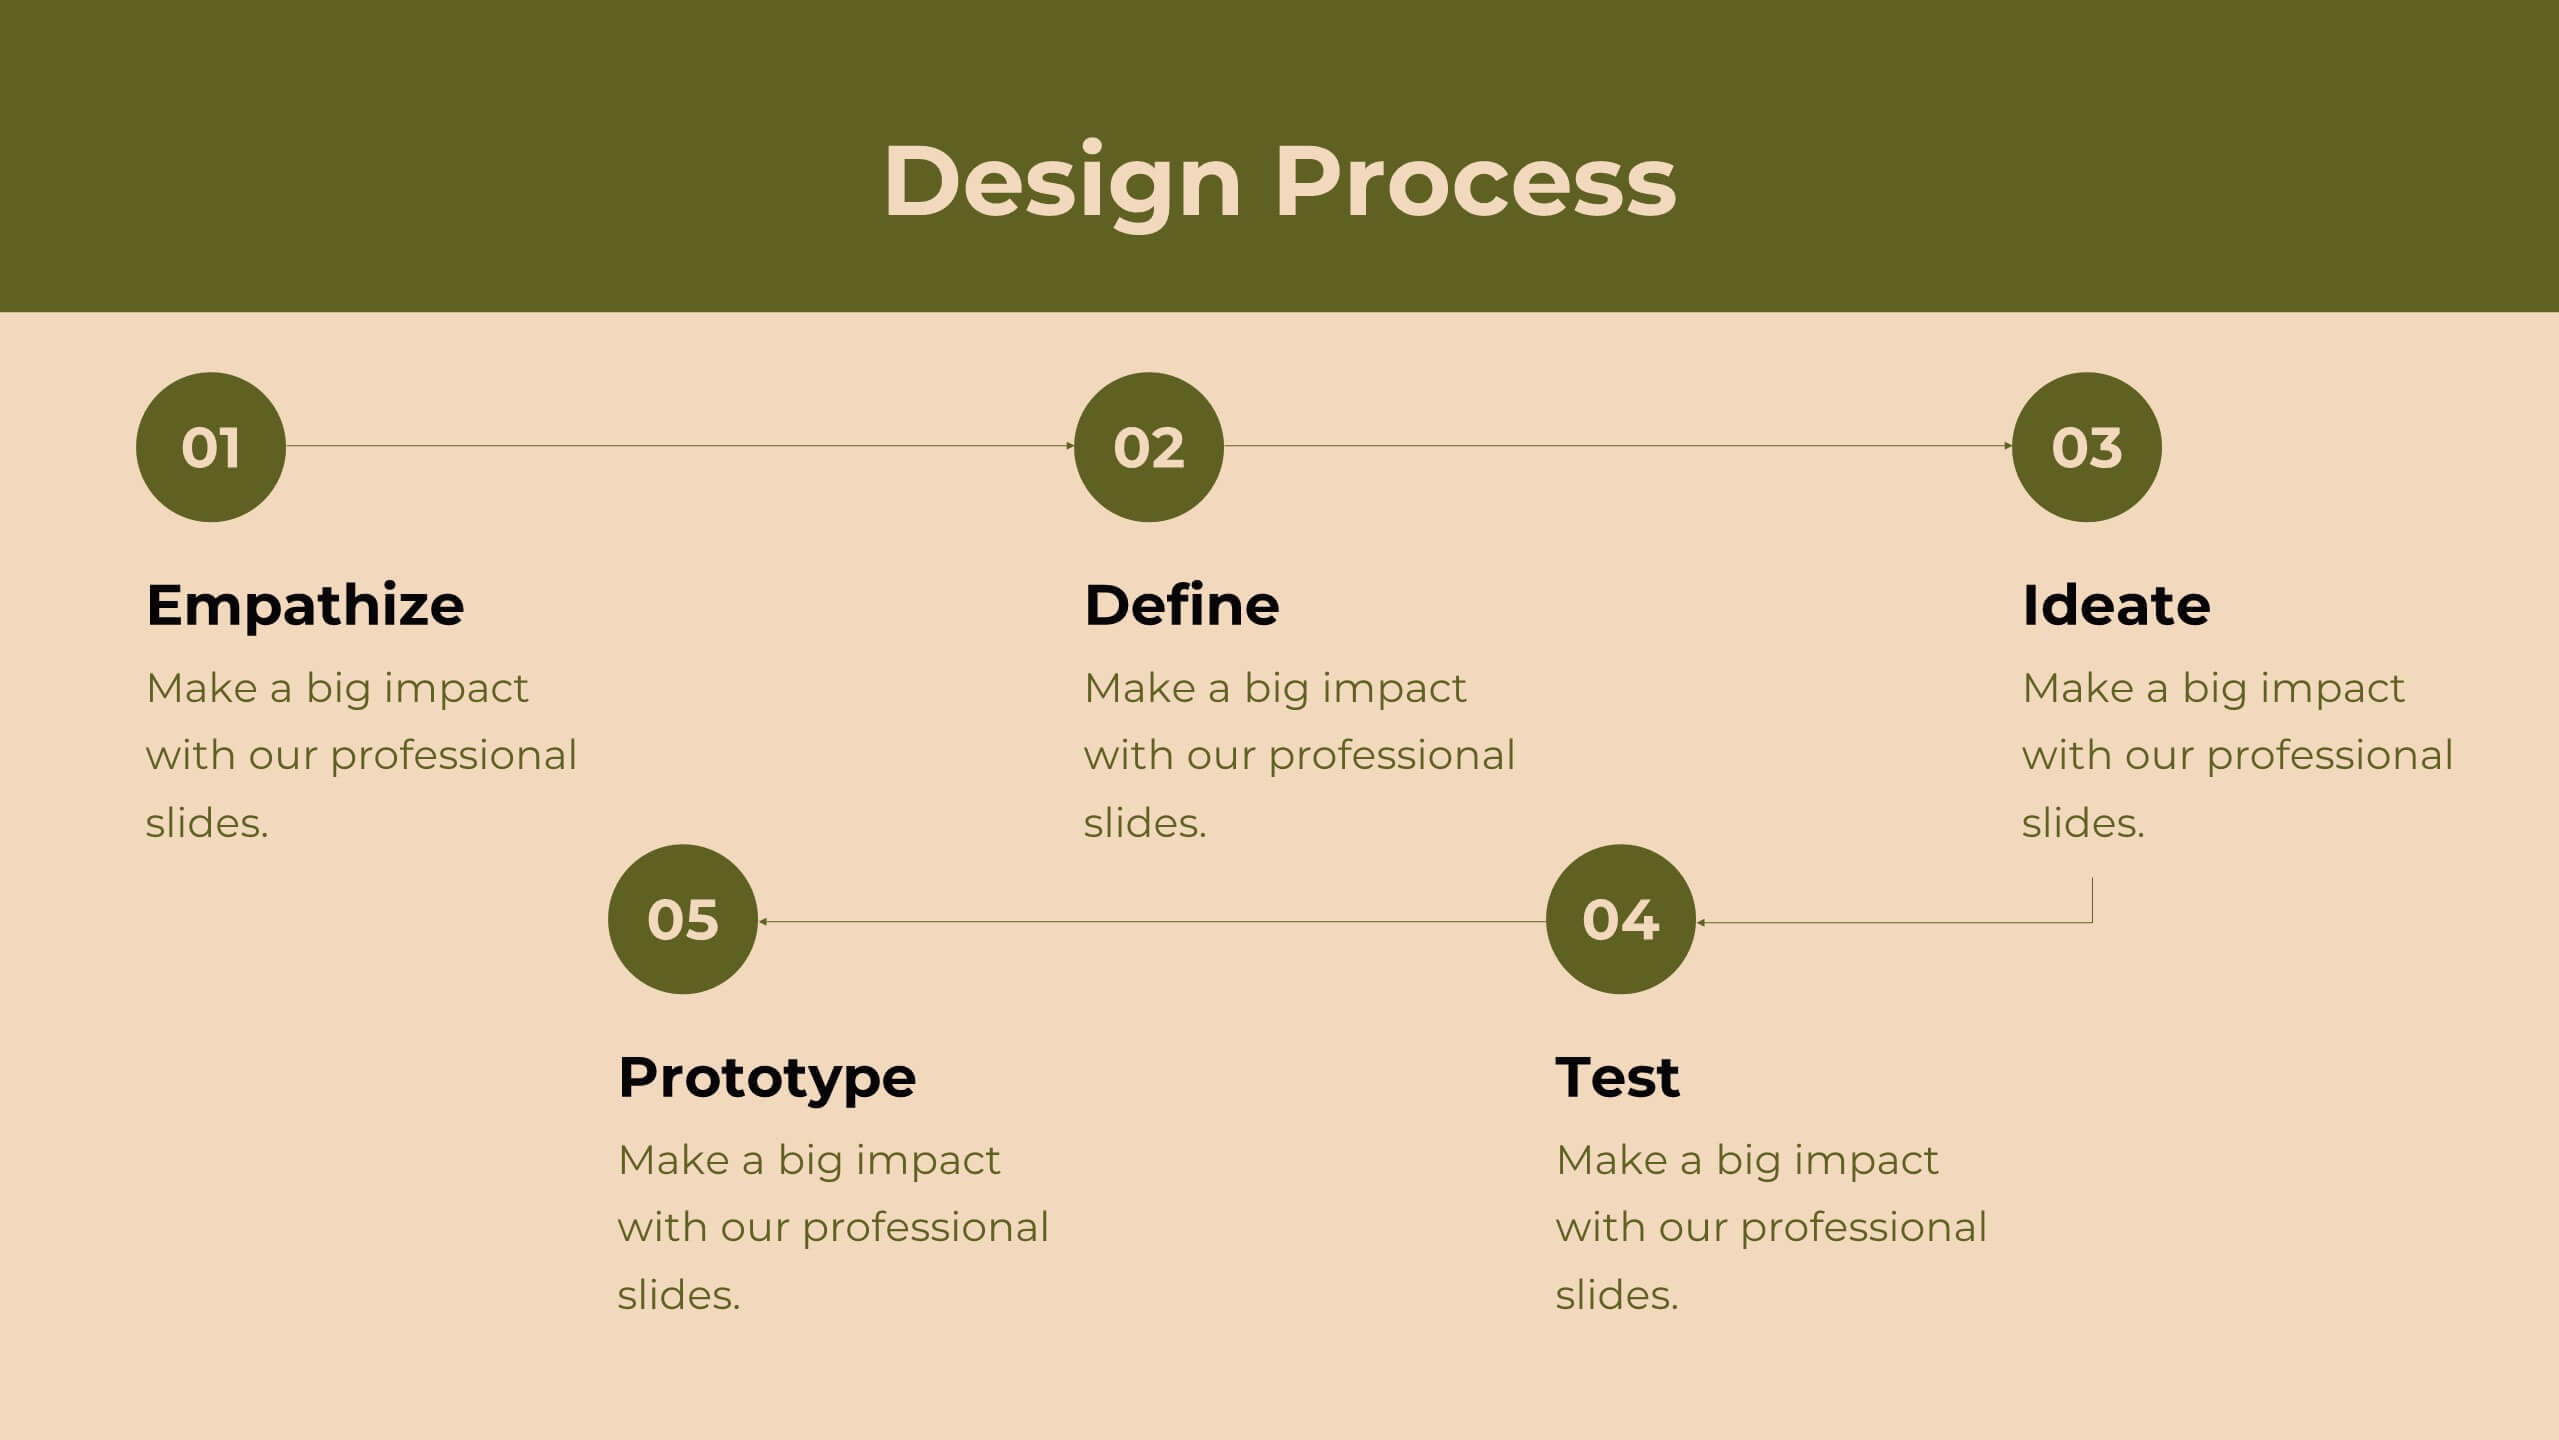
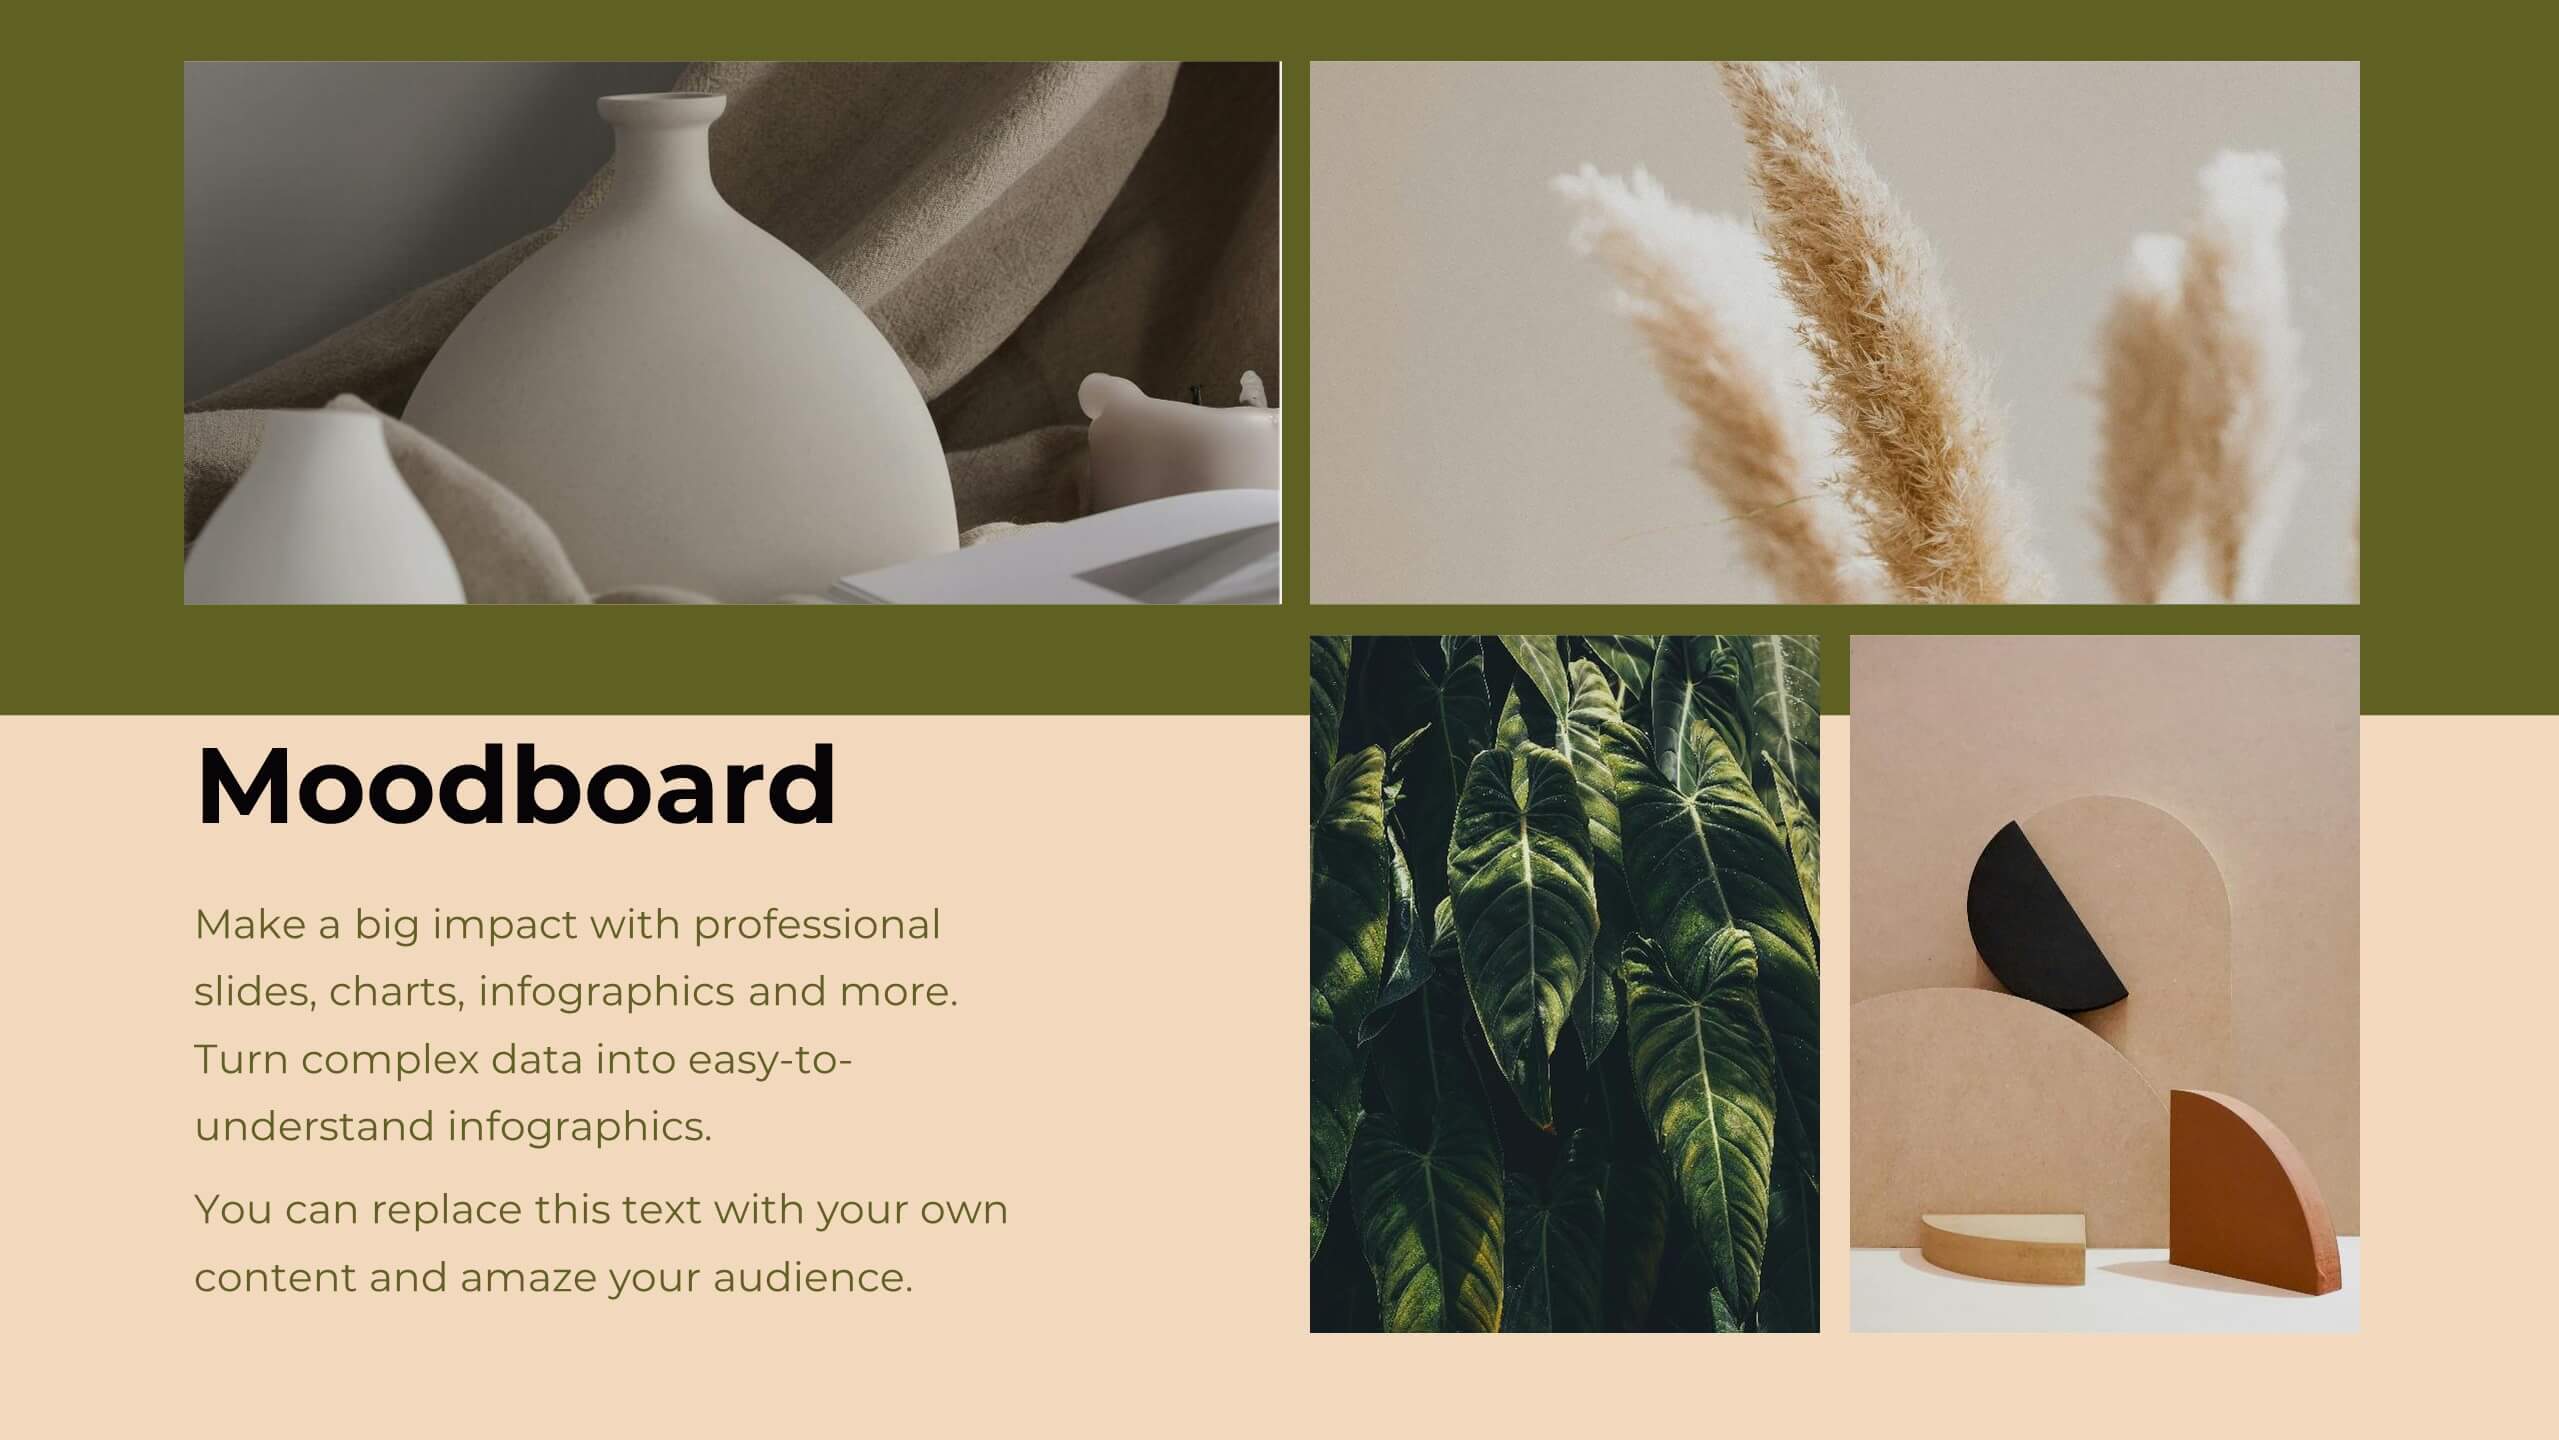
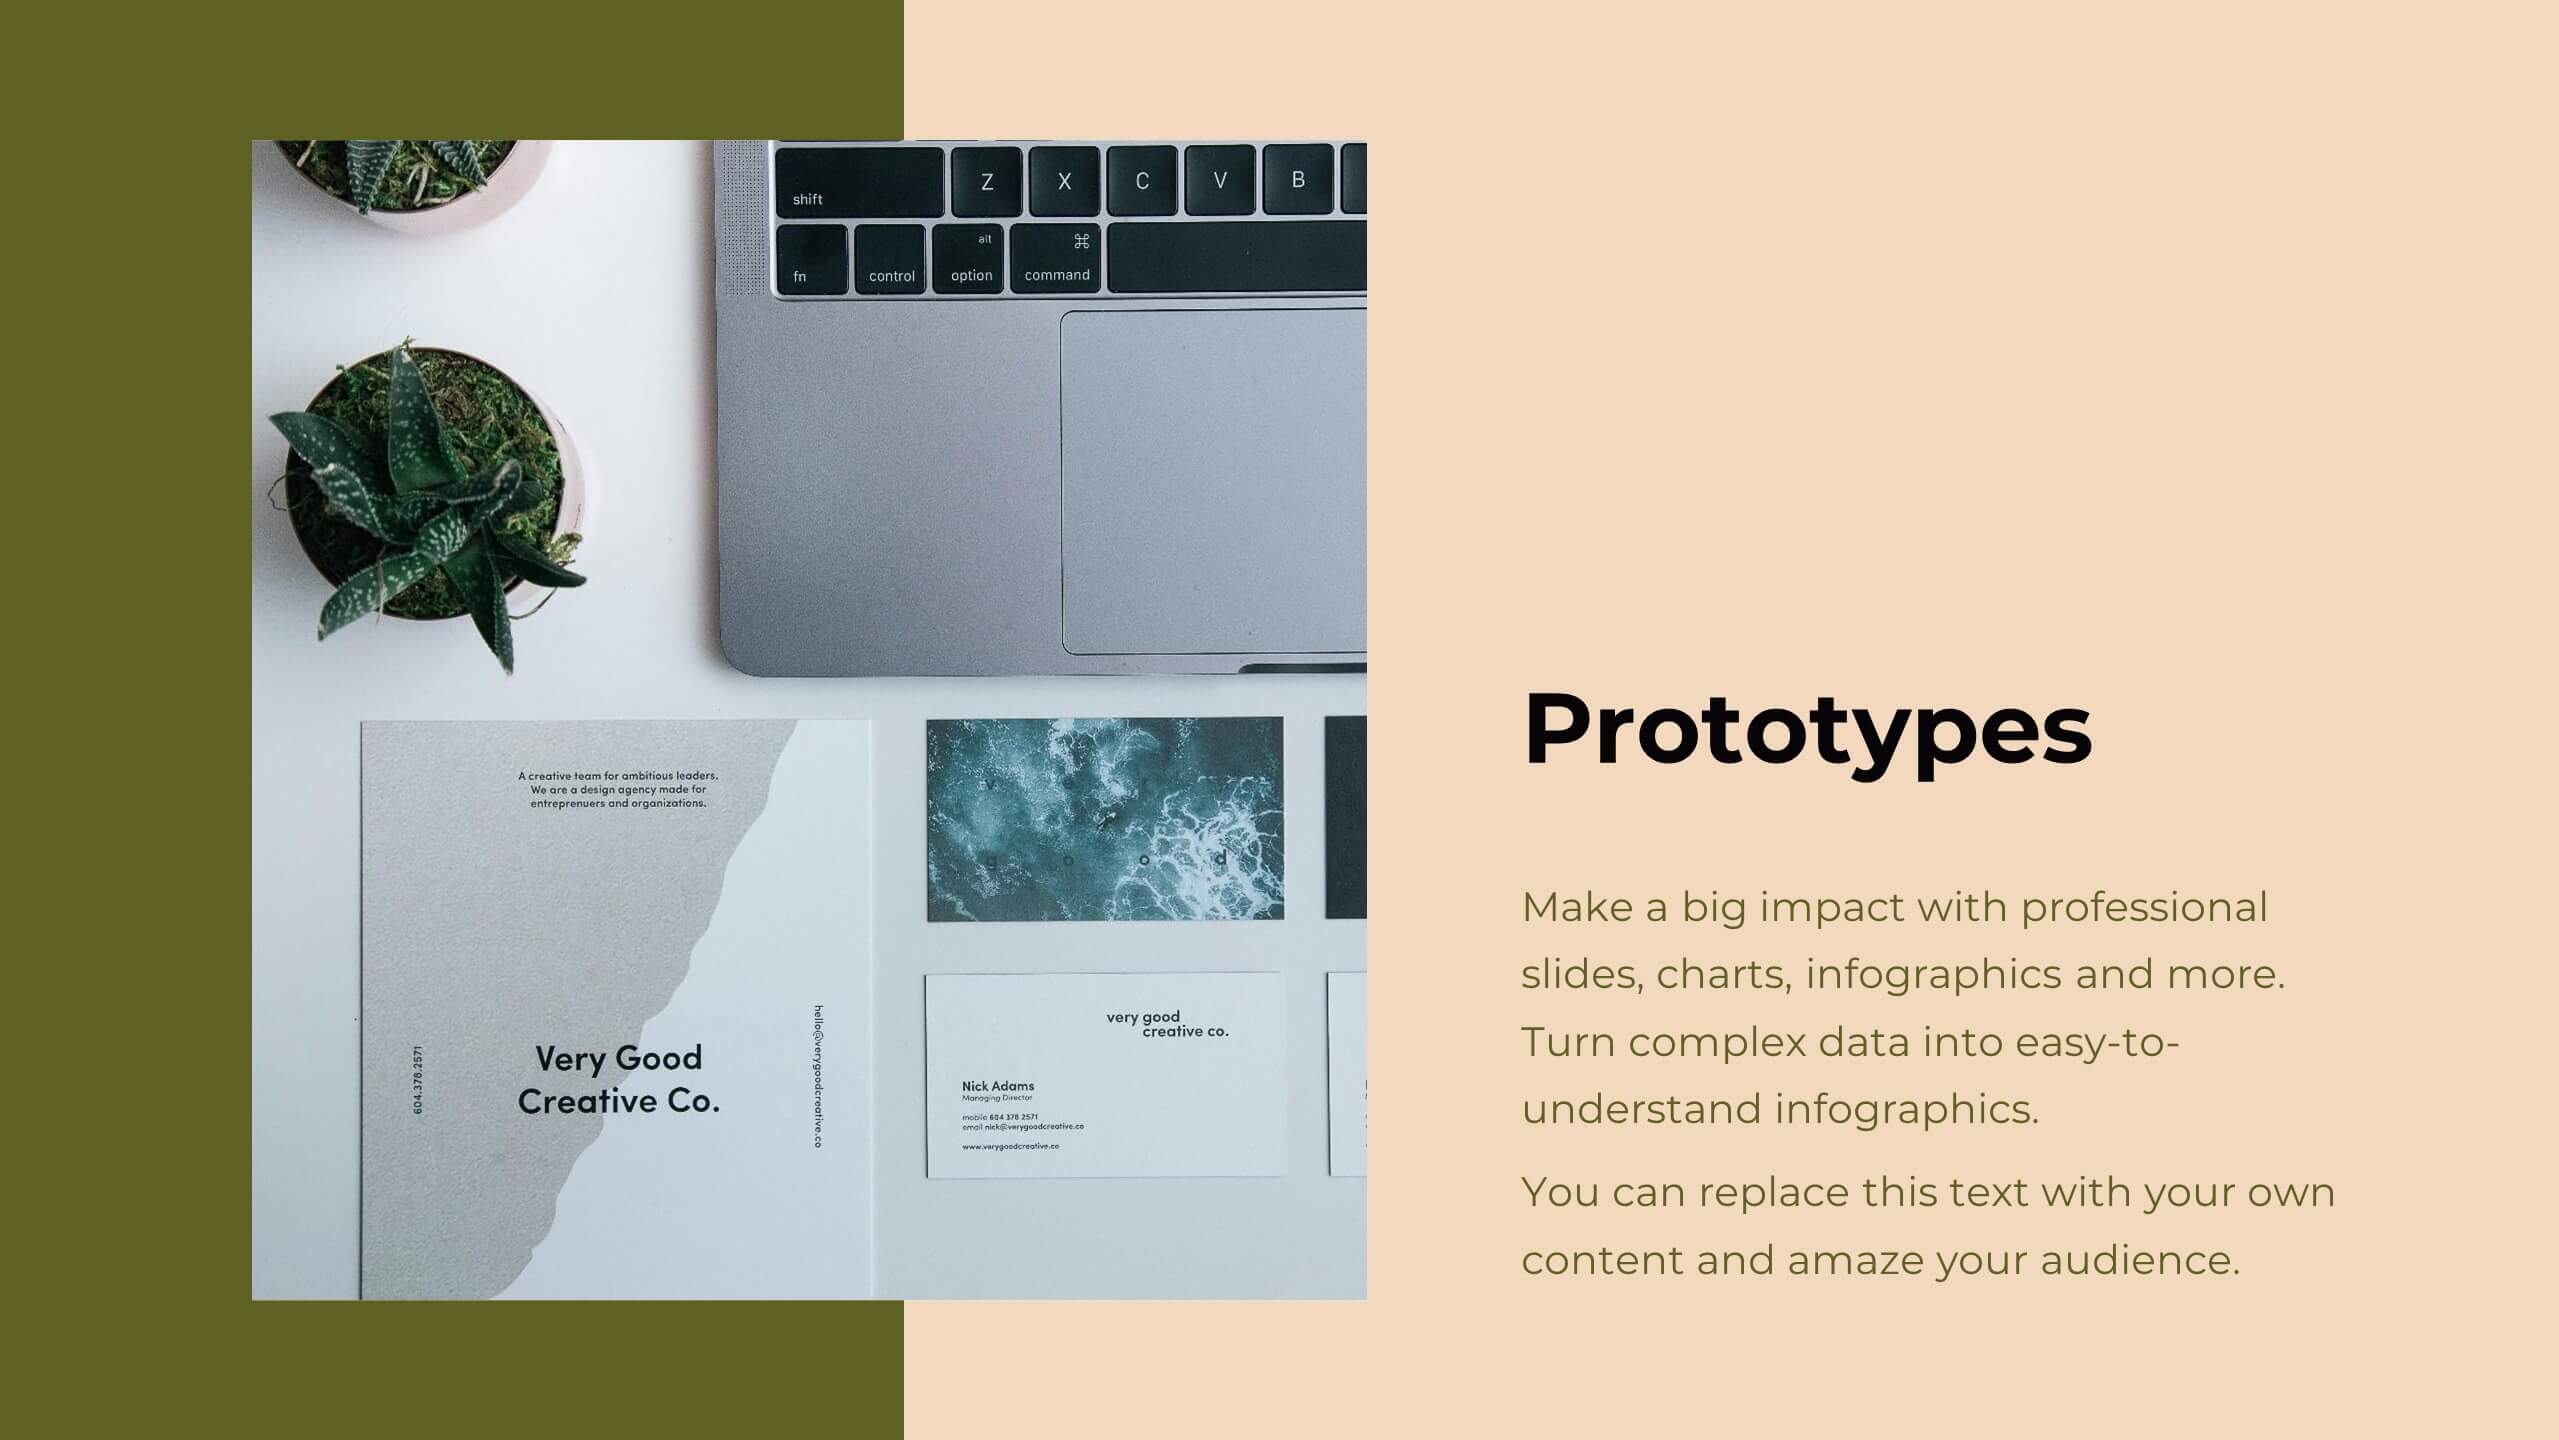
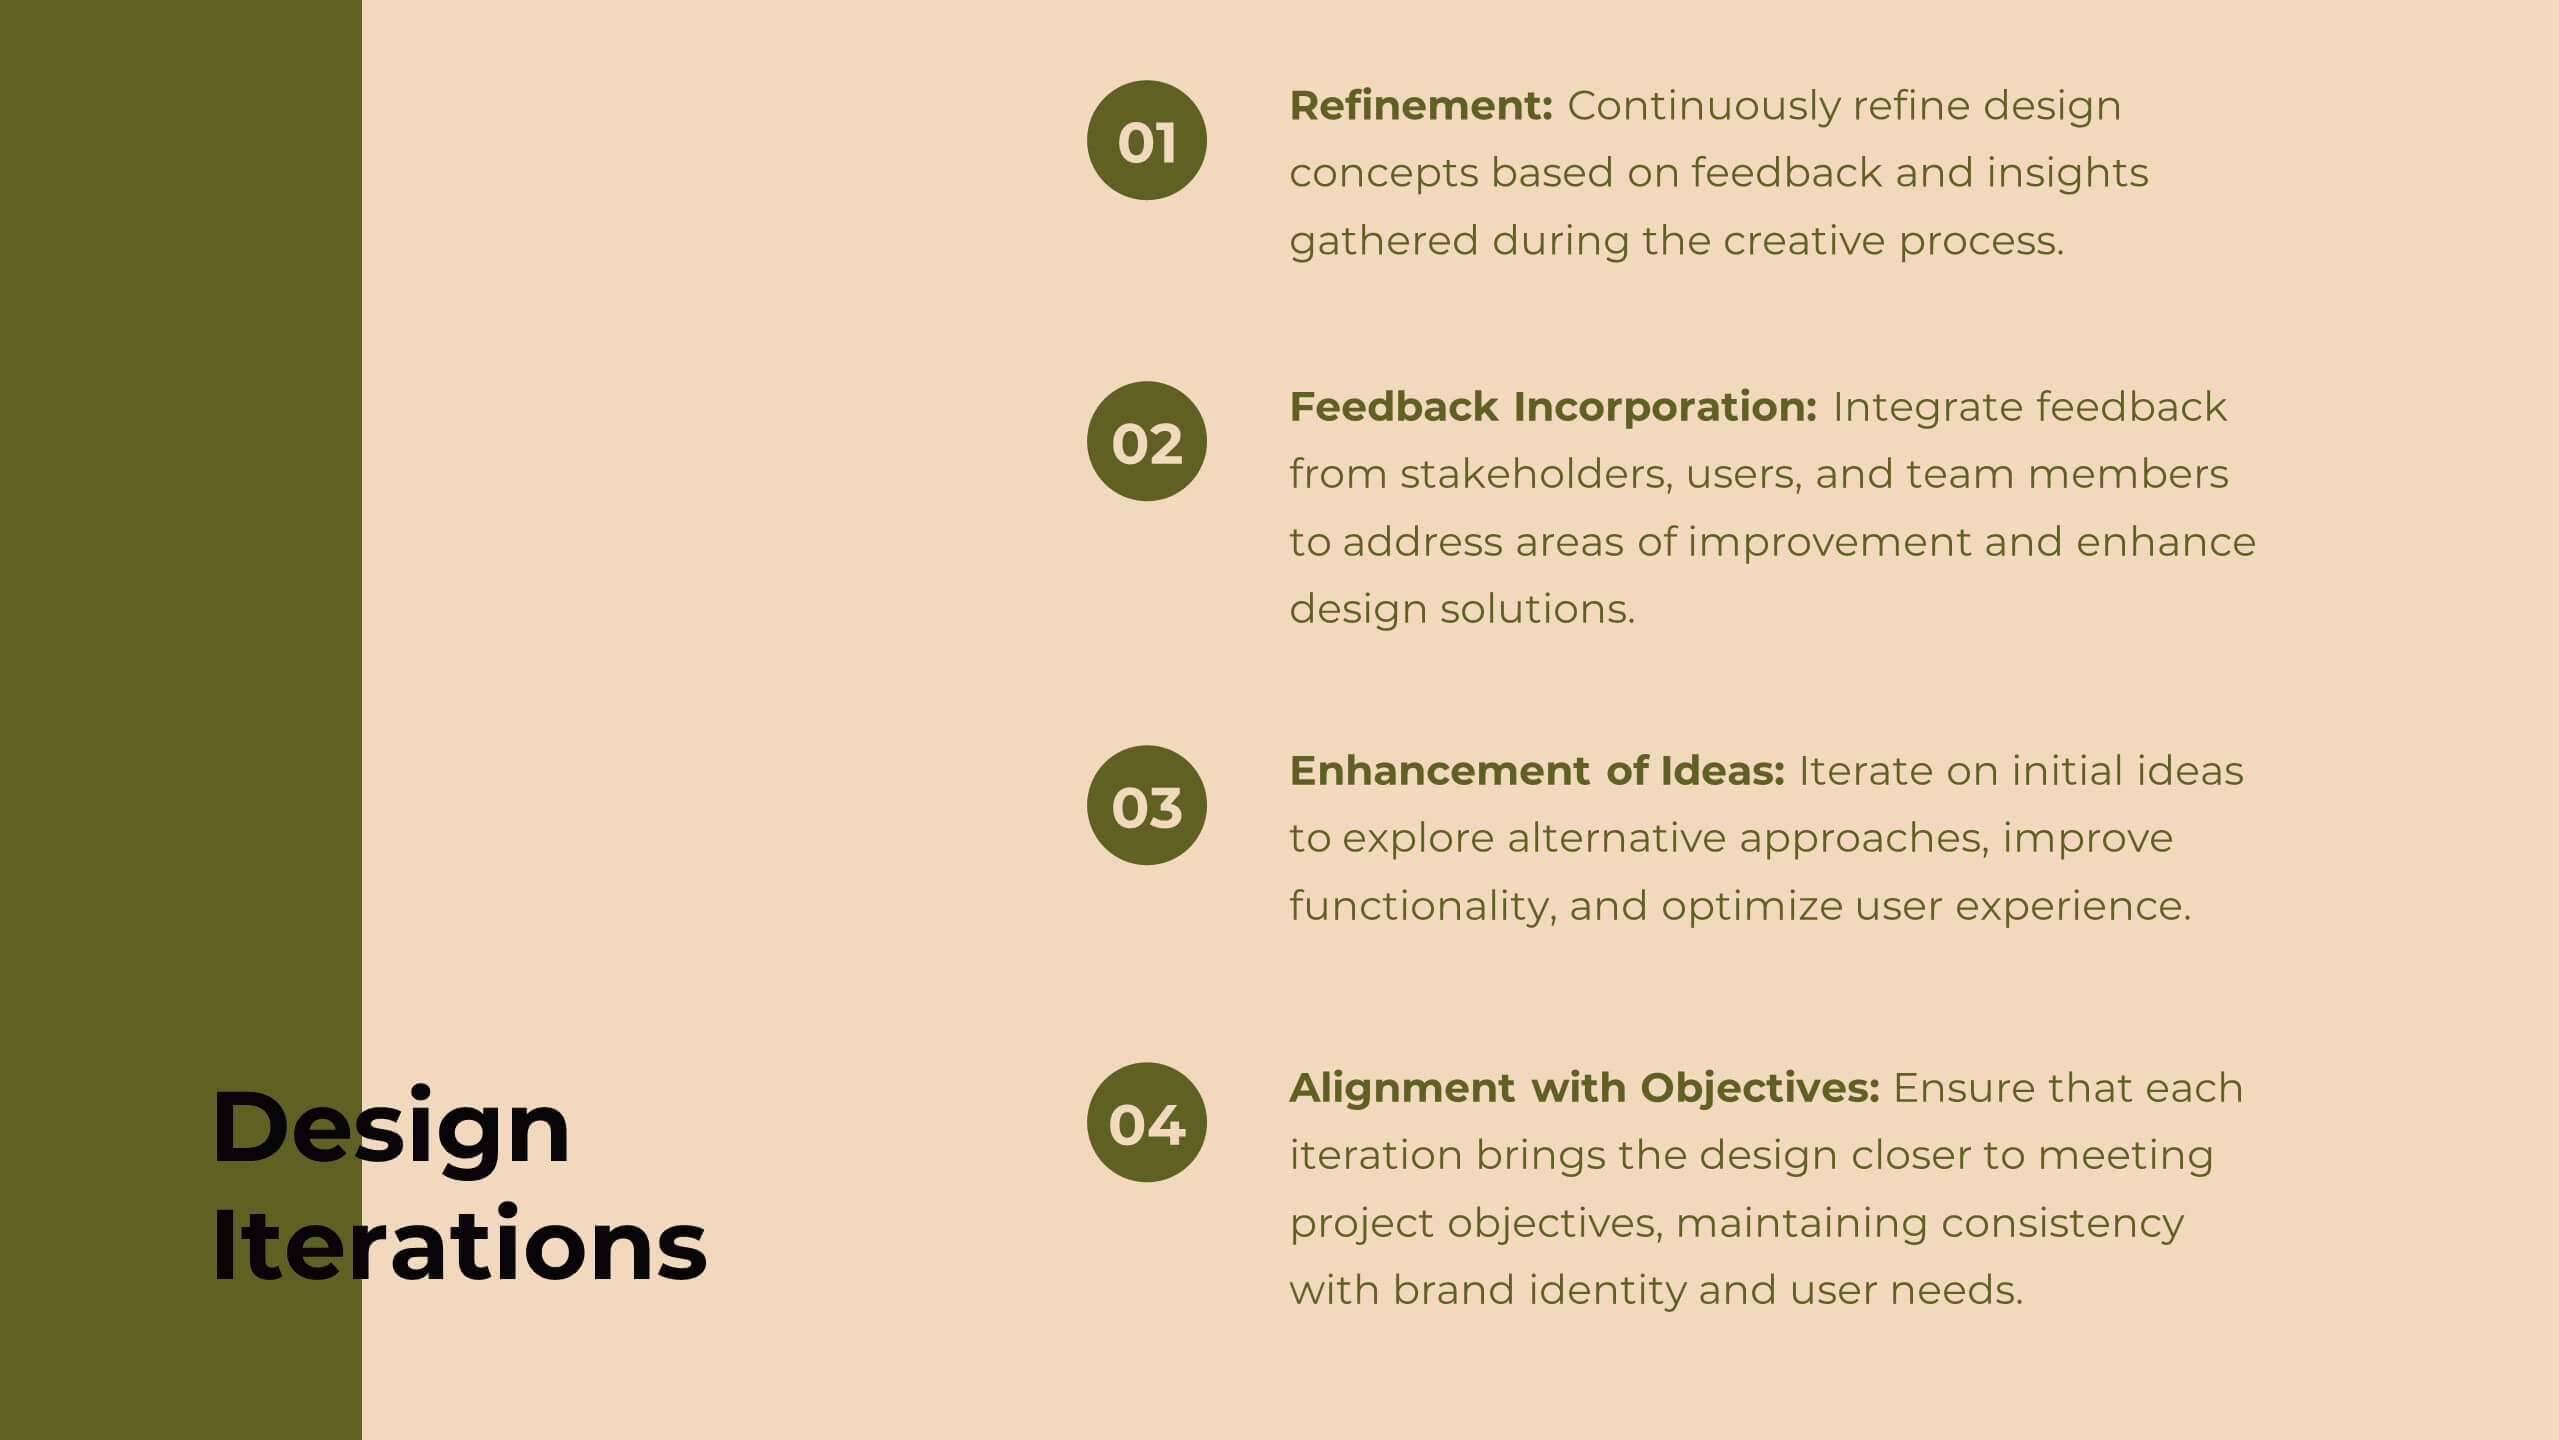
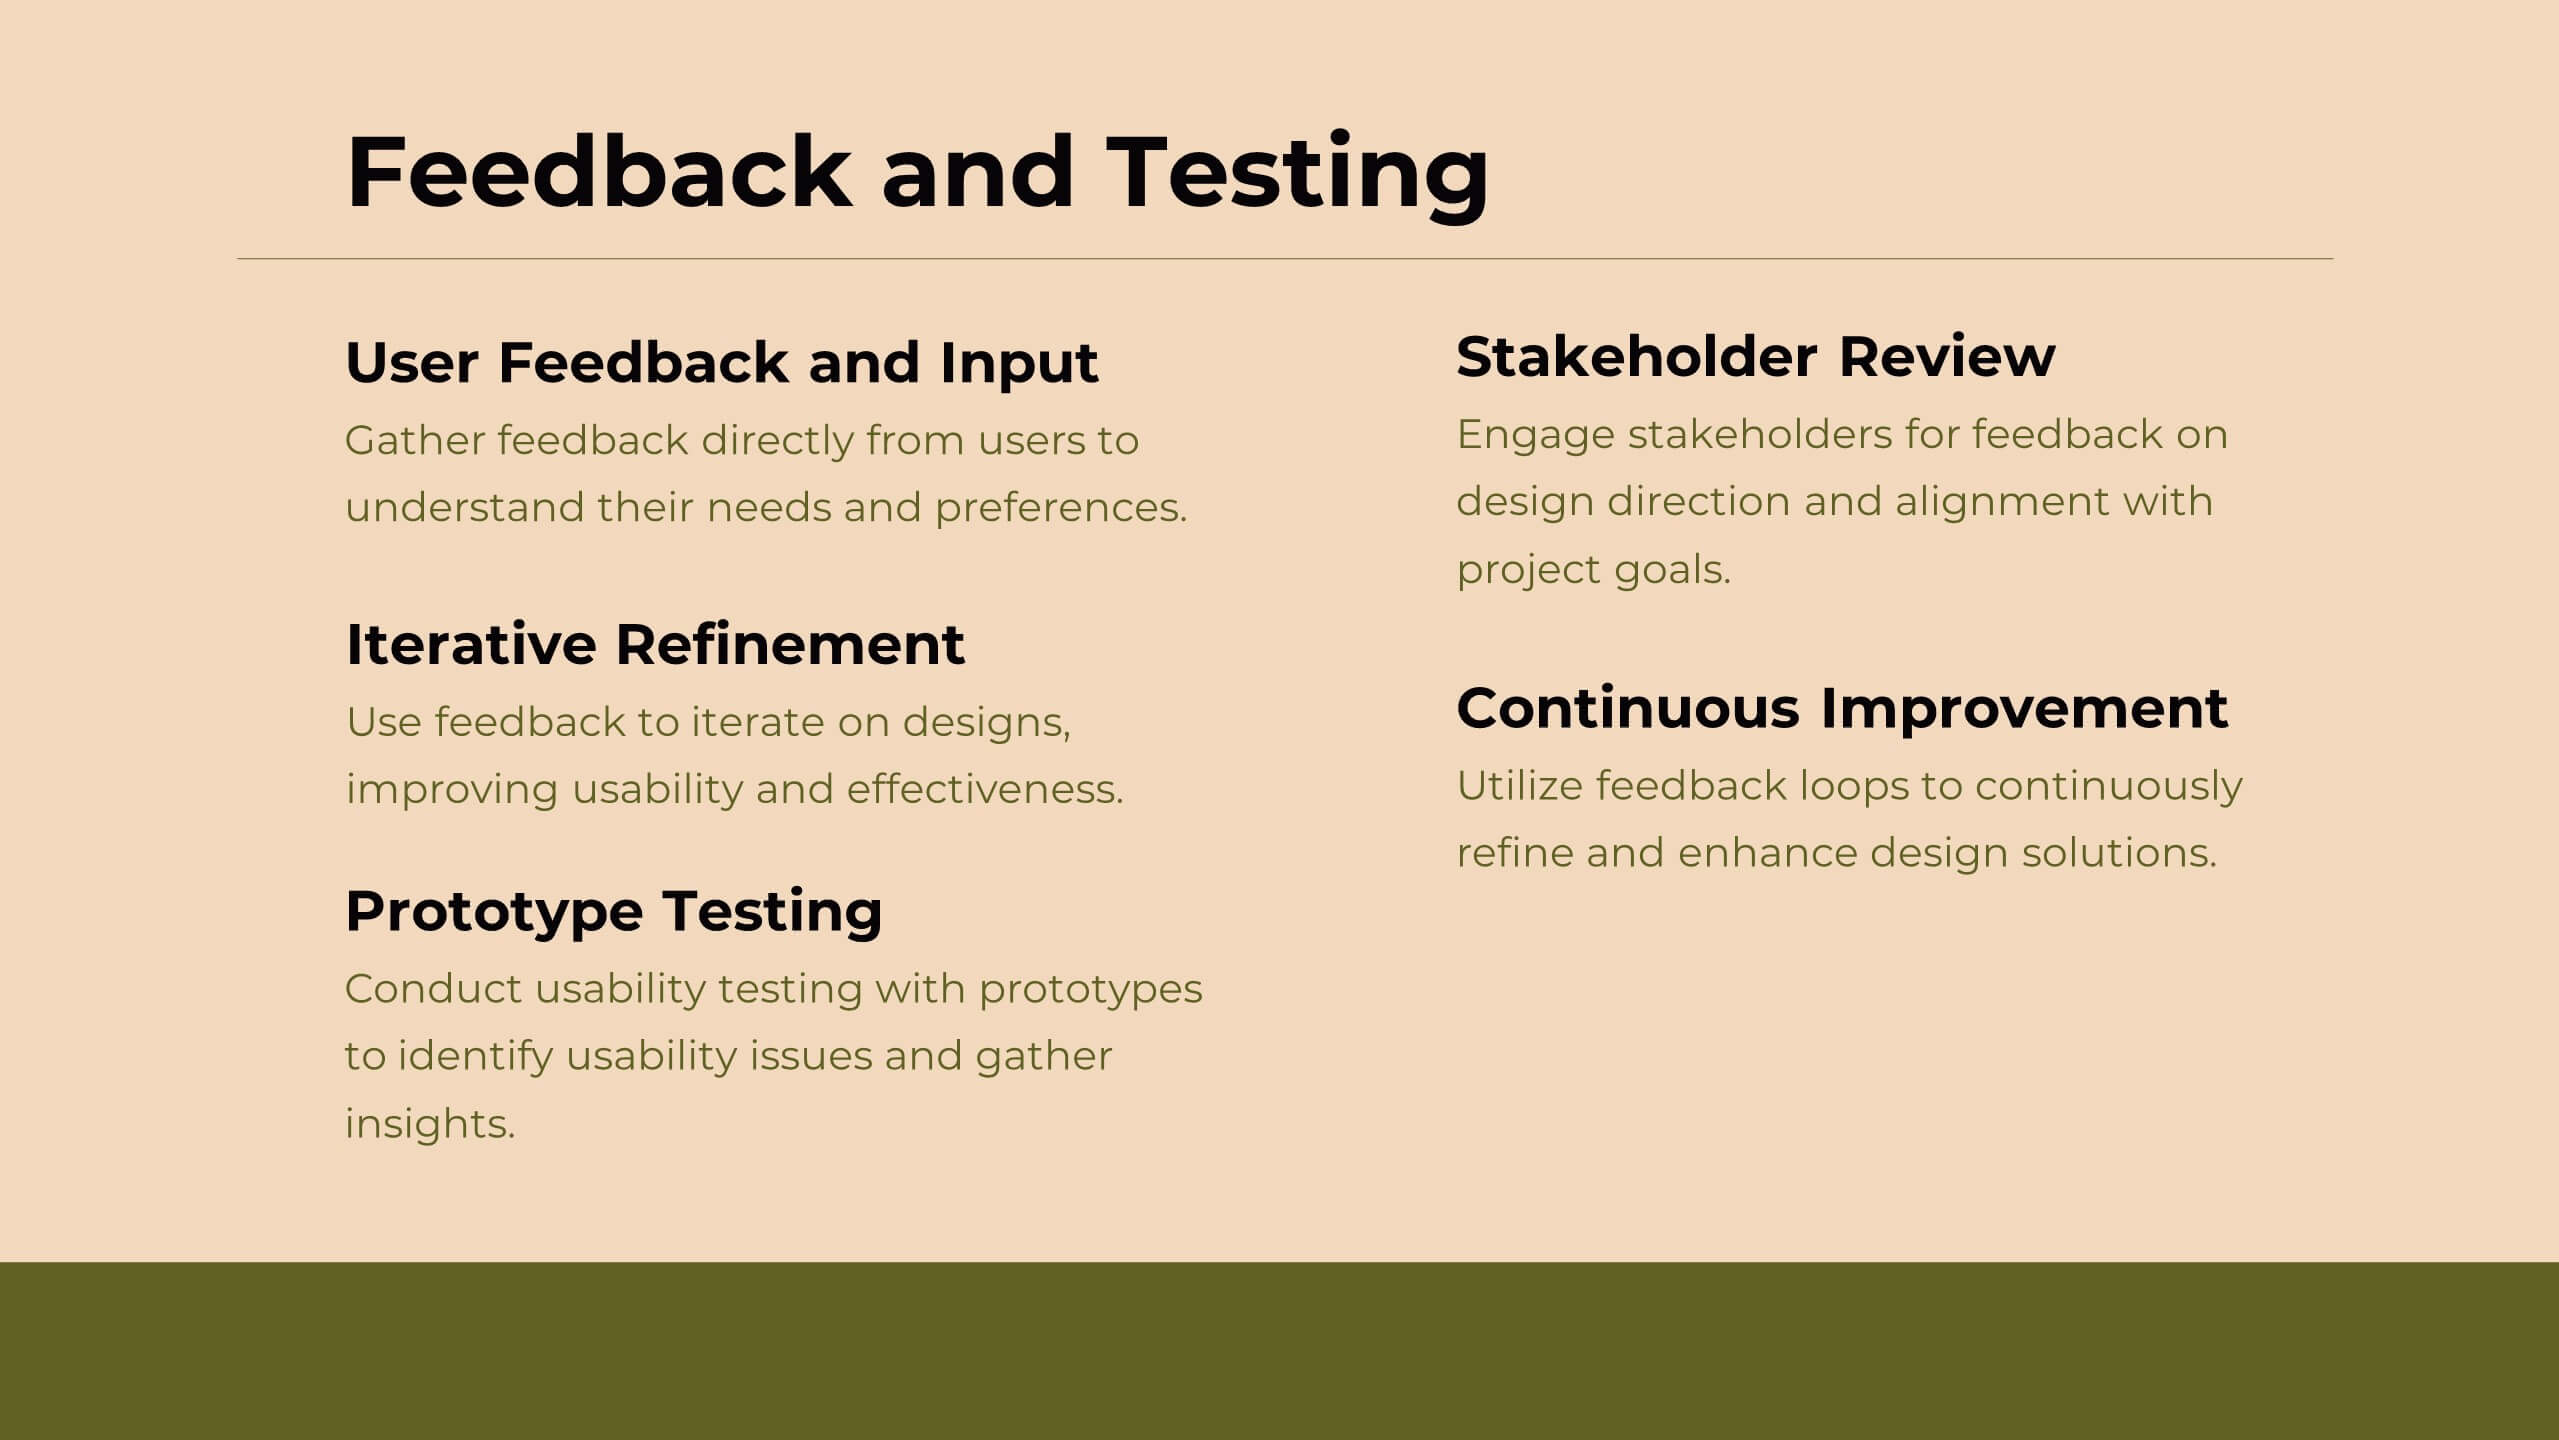
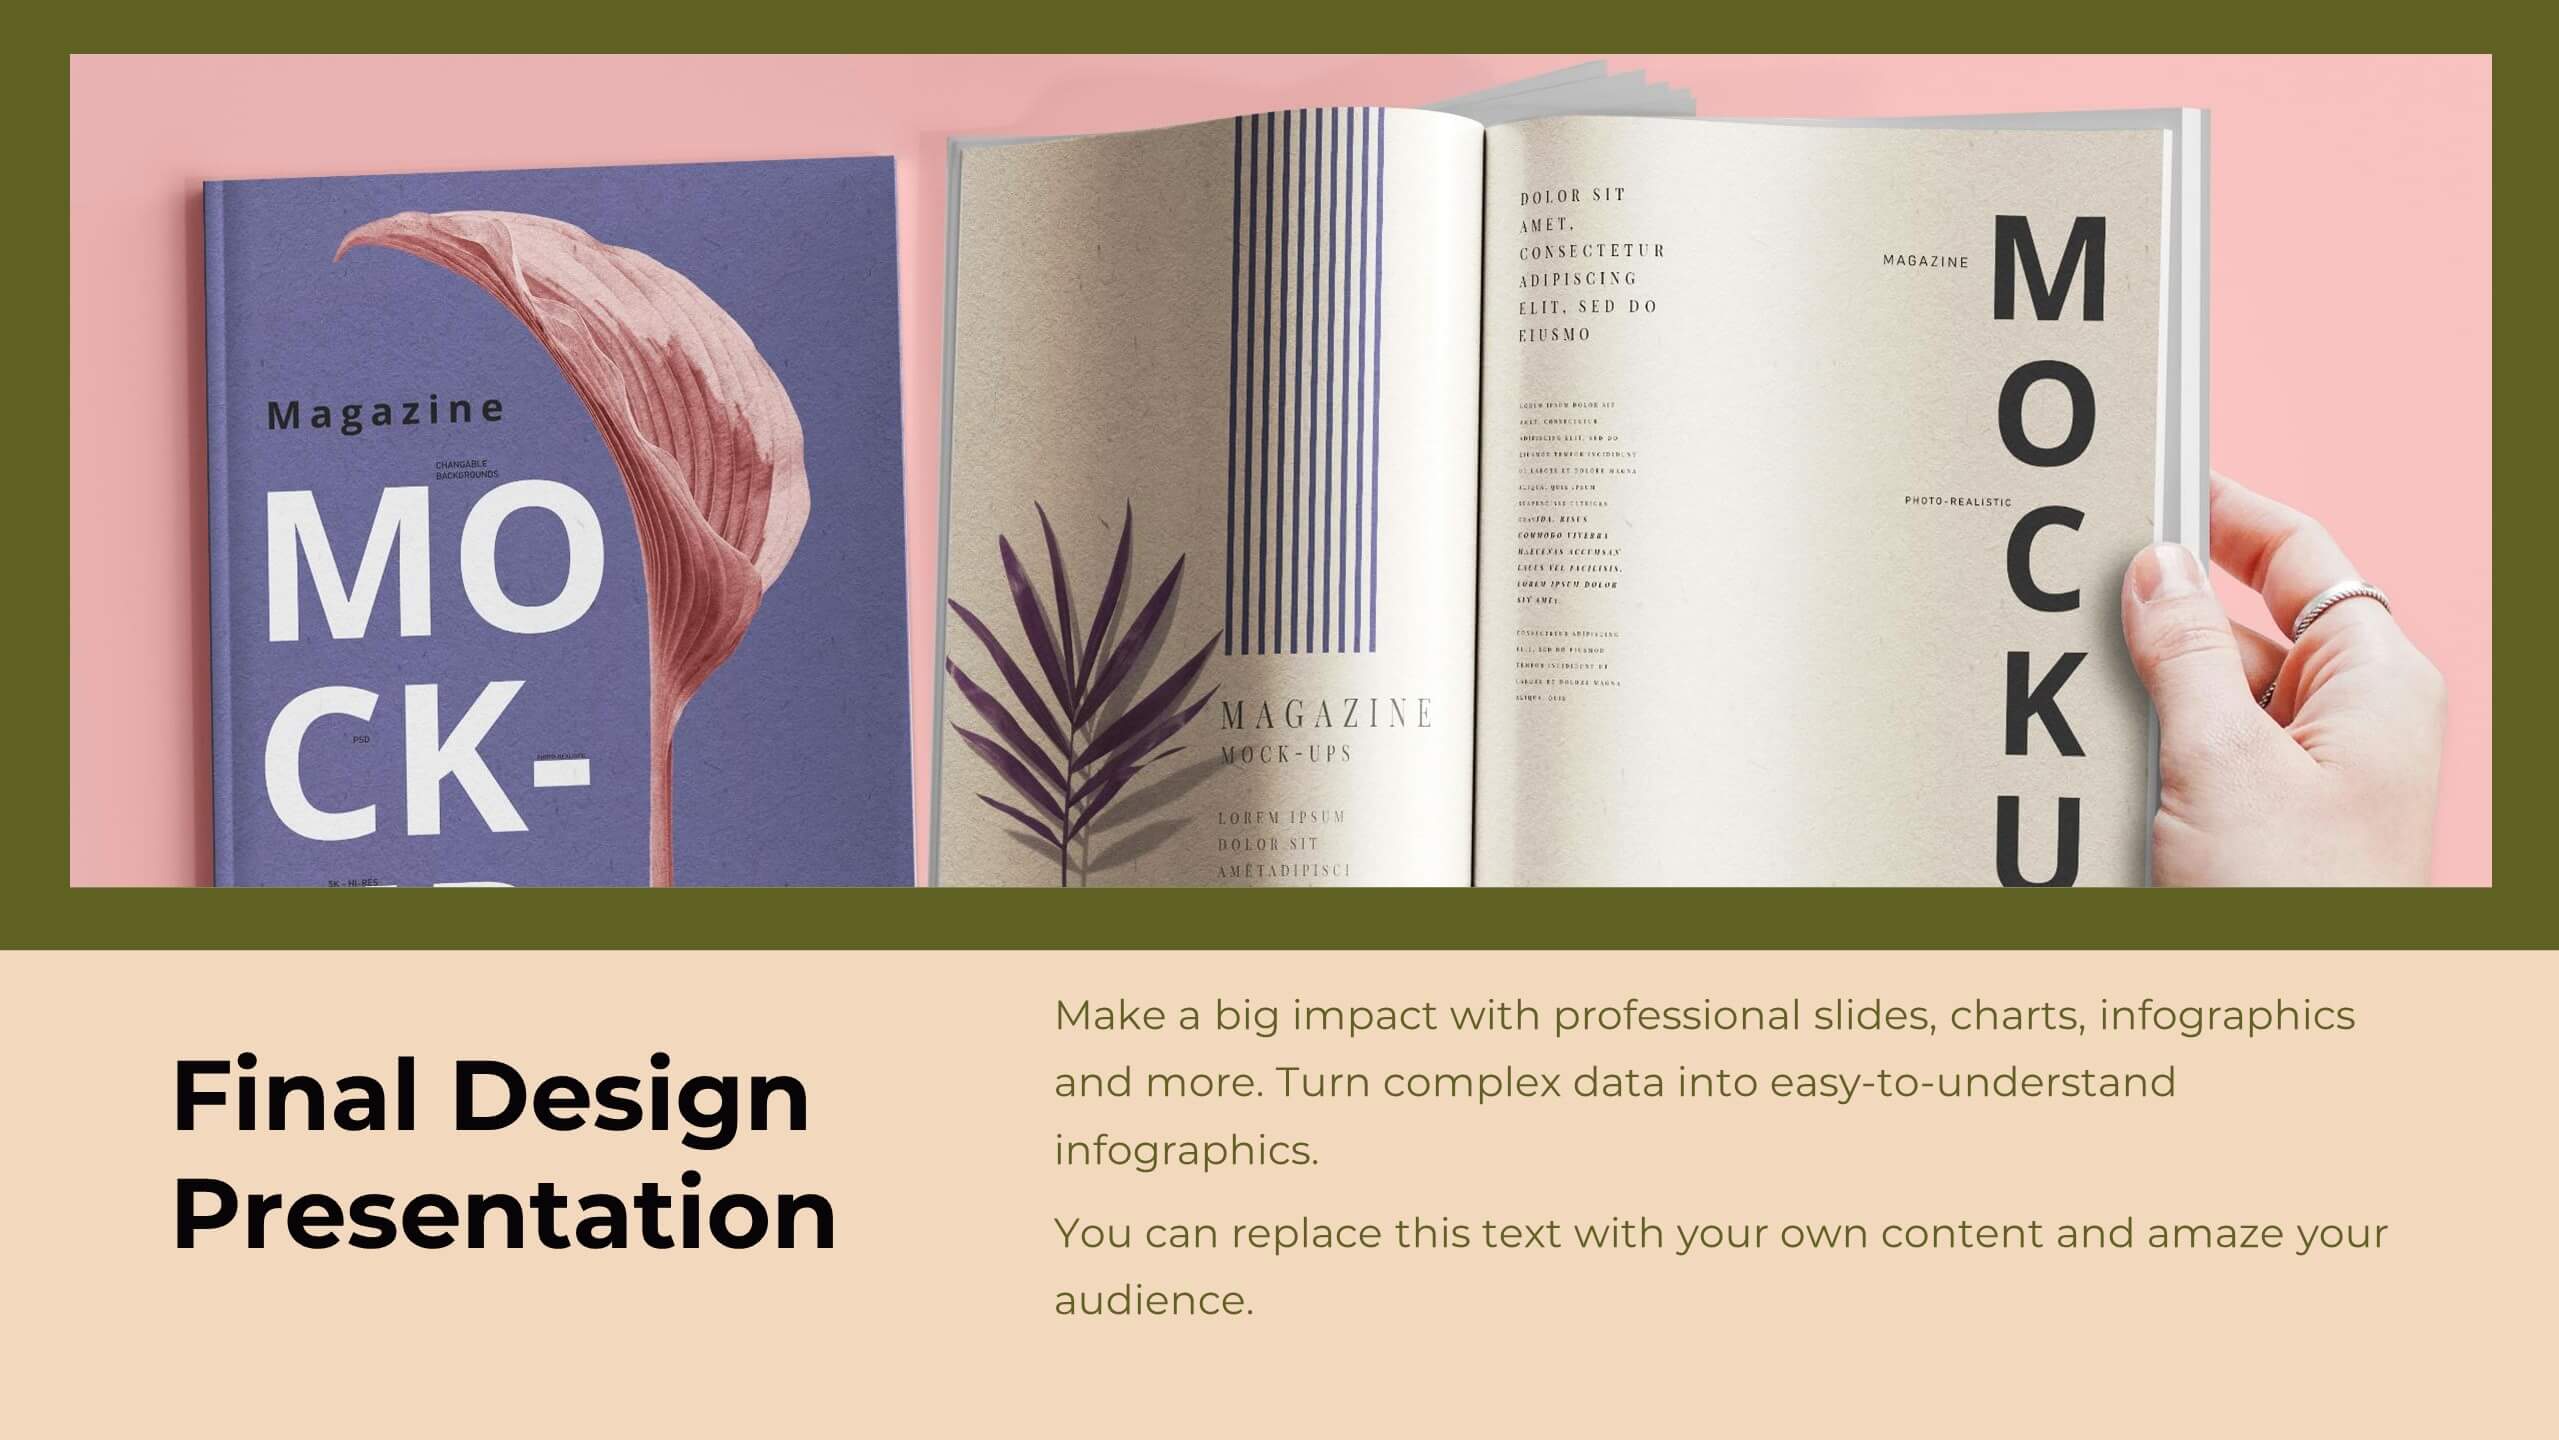
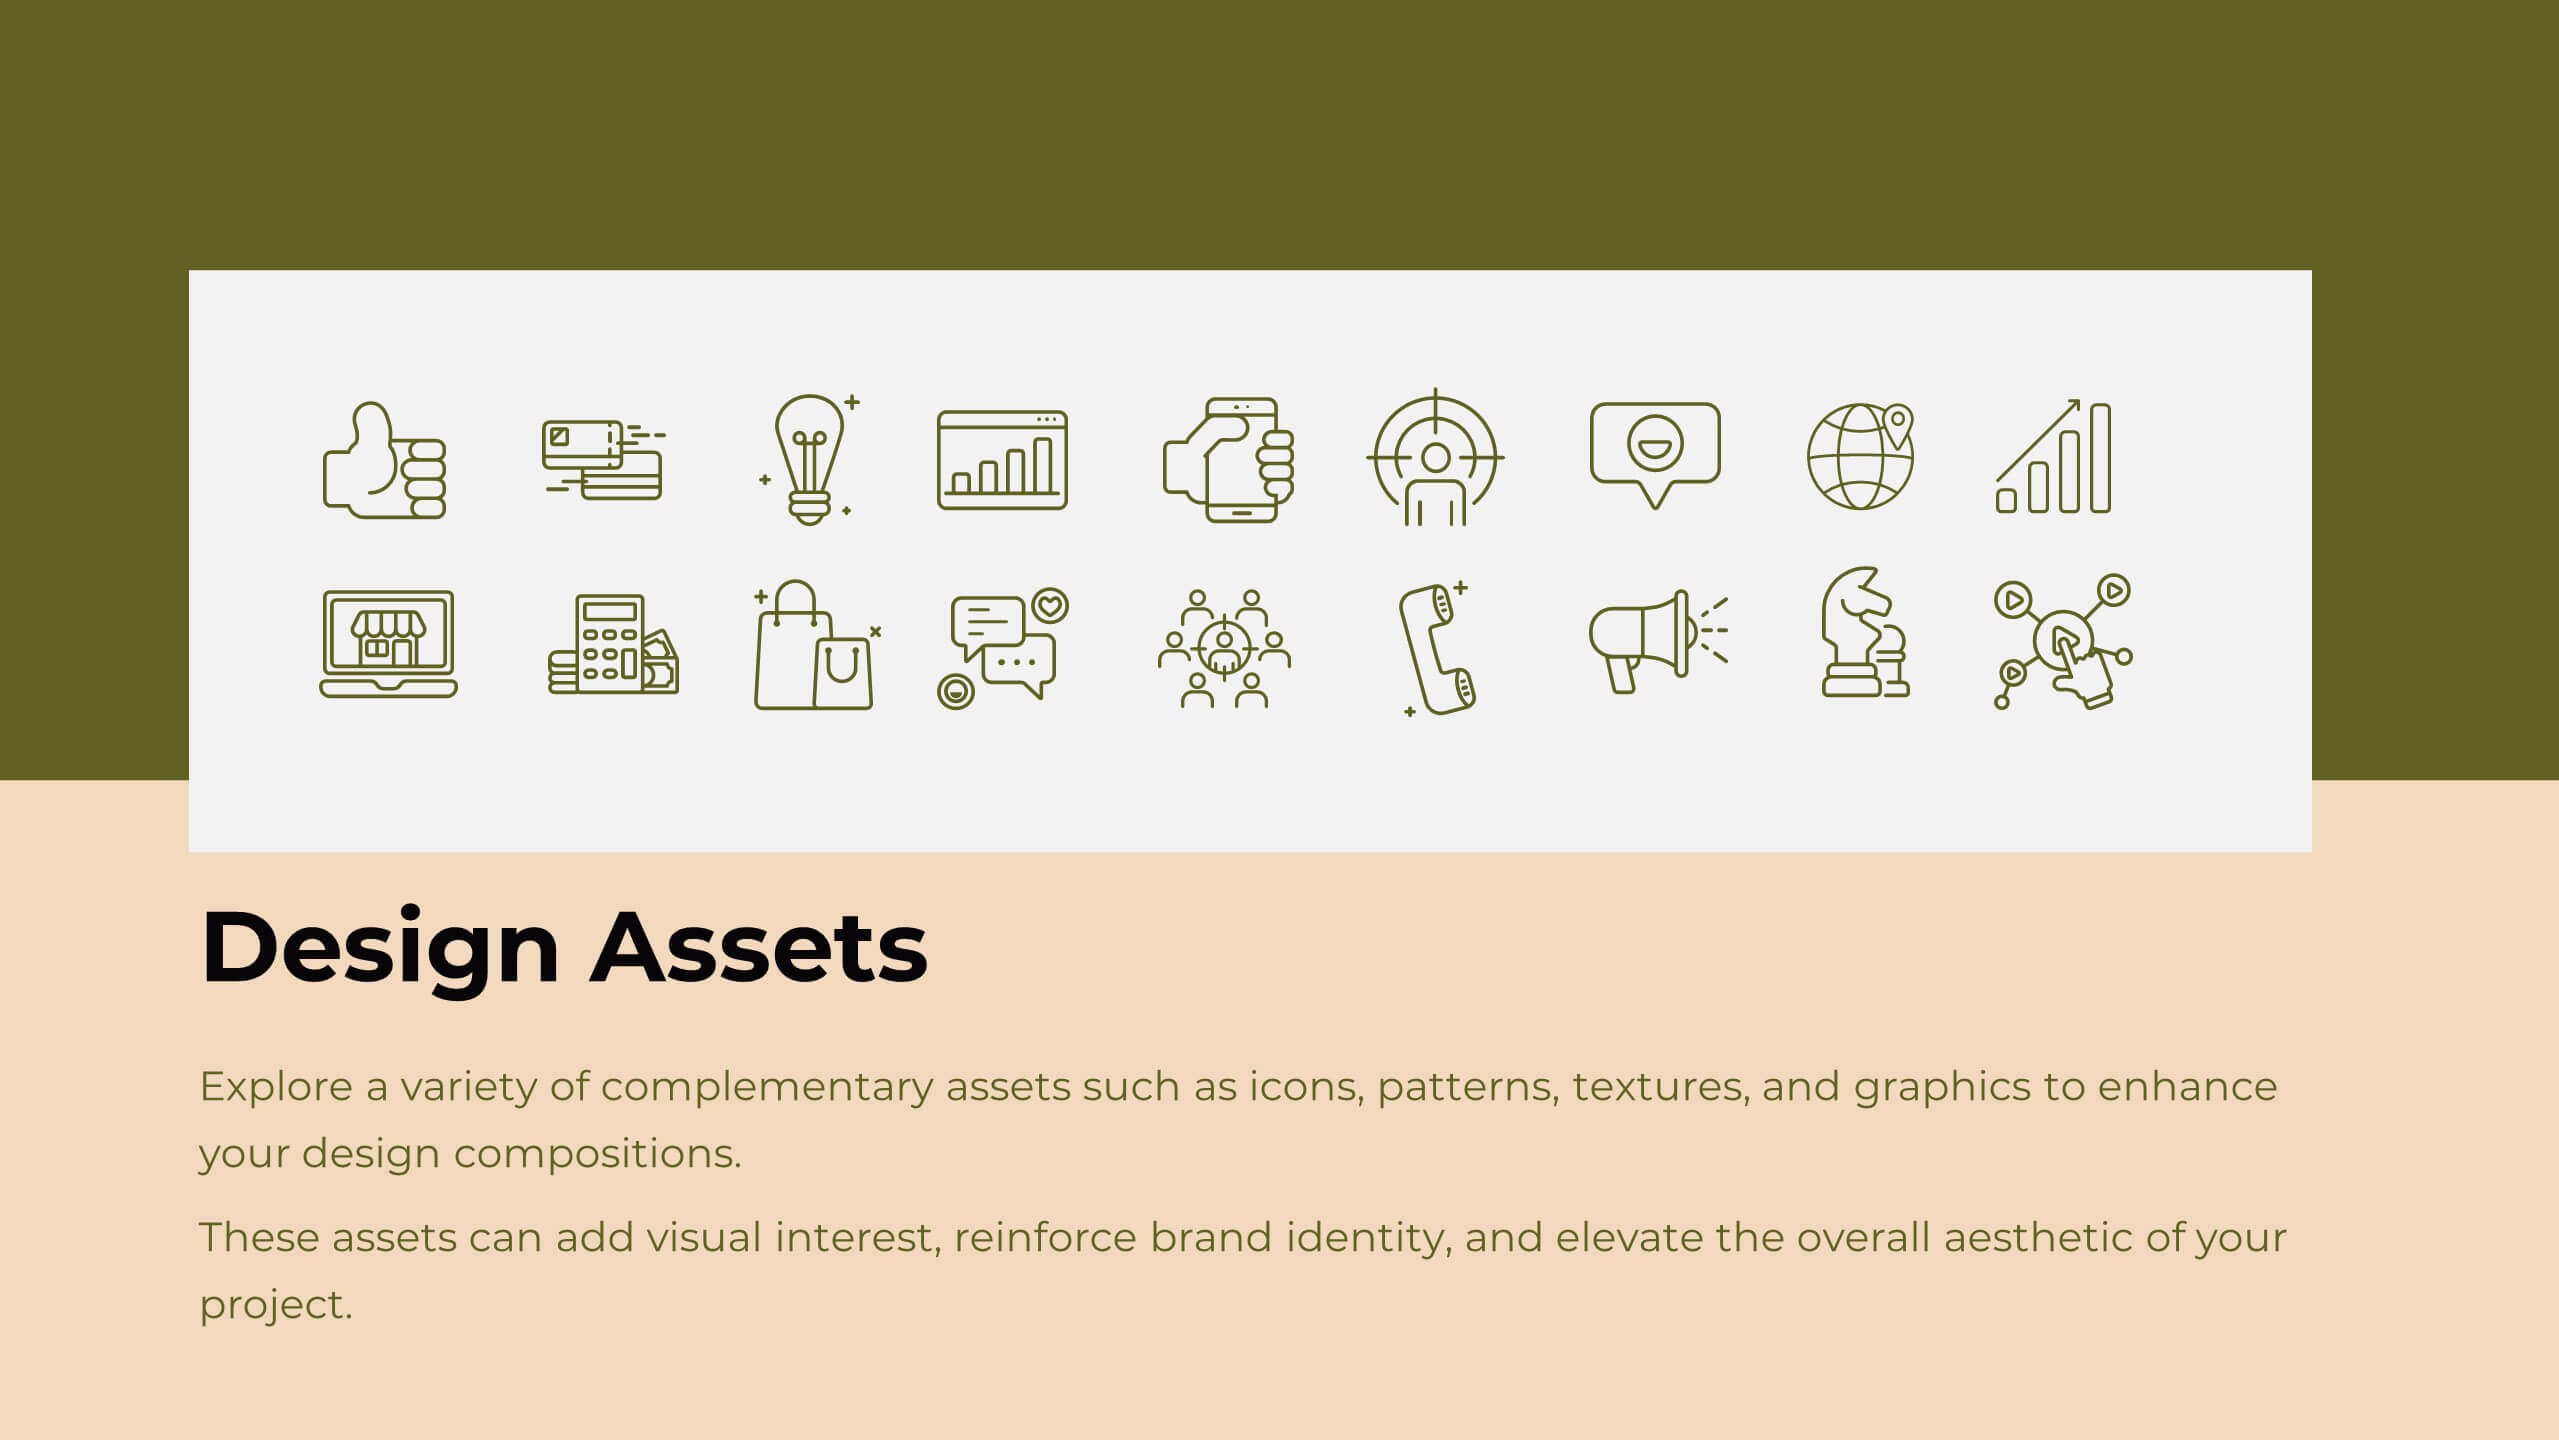
Delta Design Strategy Proposal Presentation
Transform your design strategy with this elegant proposal template! Perfect for presenting design briefs, target audience insights, and concept development. Ideal for designers and creative teams aiming to align vision and execution. Compatible with PowerPoint, Keynote, and Google Slides, this template ensures your design strategy is clear, professional, and compelling. Elevate your projects today!


6 diapositivas
Sustainability Assets Management Infographic
Sustainability management refers to the strategic planning, implementation, and monitoring of practices that promote environmental, social, and economic sustainability within organizations. This infographic template visually presents key elements and strategies for managing sustainability assets within an organization. Visualize the process of identifying sustainability assets within an organization. This template will allow you to explain how each sustainability asset contributes to the organization's overall value proposition. Incorporate icons or graphics that align with the organization's mission and goals.


7 diapositivas
Harvey Ball Charts Infographic
A Harvey Ball is a simple, round graphic used for visual representation and communication of qualitative information. This infographic template harnesses the power of Harvey Balls, those simple yet potent icons, to convey information and insights in a visually striking manner. Highlight strategies to engage the audience effectively using Harvey Balls. Fully customizable and compatible with Powerpoint, Keynote, and Google Slides. This infographic allows you to explore the ability to customize Harvey Balls, varying in size, color, and style to suit your unique data representation needs.


5 diapositivas
Veterinary Medicine Advances Presentation
Discover the latest in Veterinary Medicine Advances with our engaging presentation template. Designed to highlight key innovations and treatment methods, this template offers a clear visual format for presenting complex information effectively to colleagues and stakeholders in the veterinary field.


7 diapositivas
Target Market Identification Strategy
Spot your ideal customers with precision using this lightbulb-centered layout designed to highlight key market segments and decision-making factors. Whether you're building buyer personas or refining your strategy, this slide presents your insights in a smart, structured way. Fully compatible with PowerPoint, Keynote, and Google Slides.
22 diapositivas
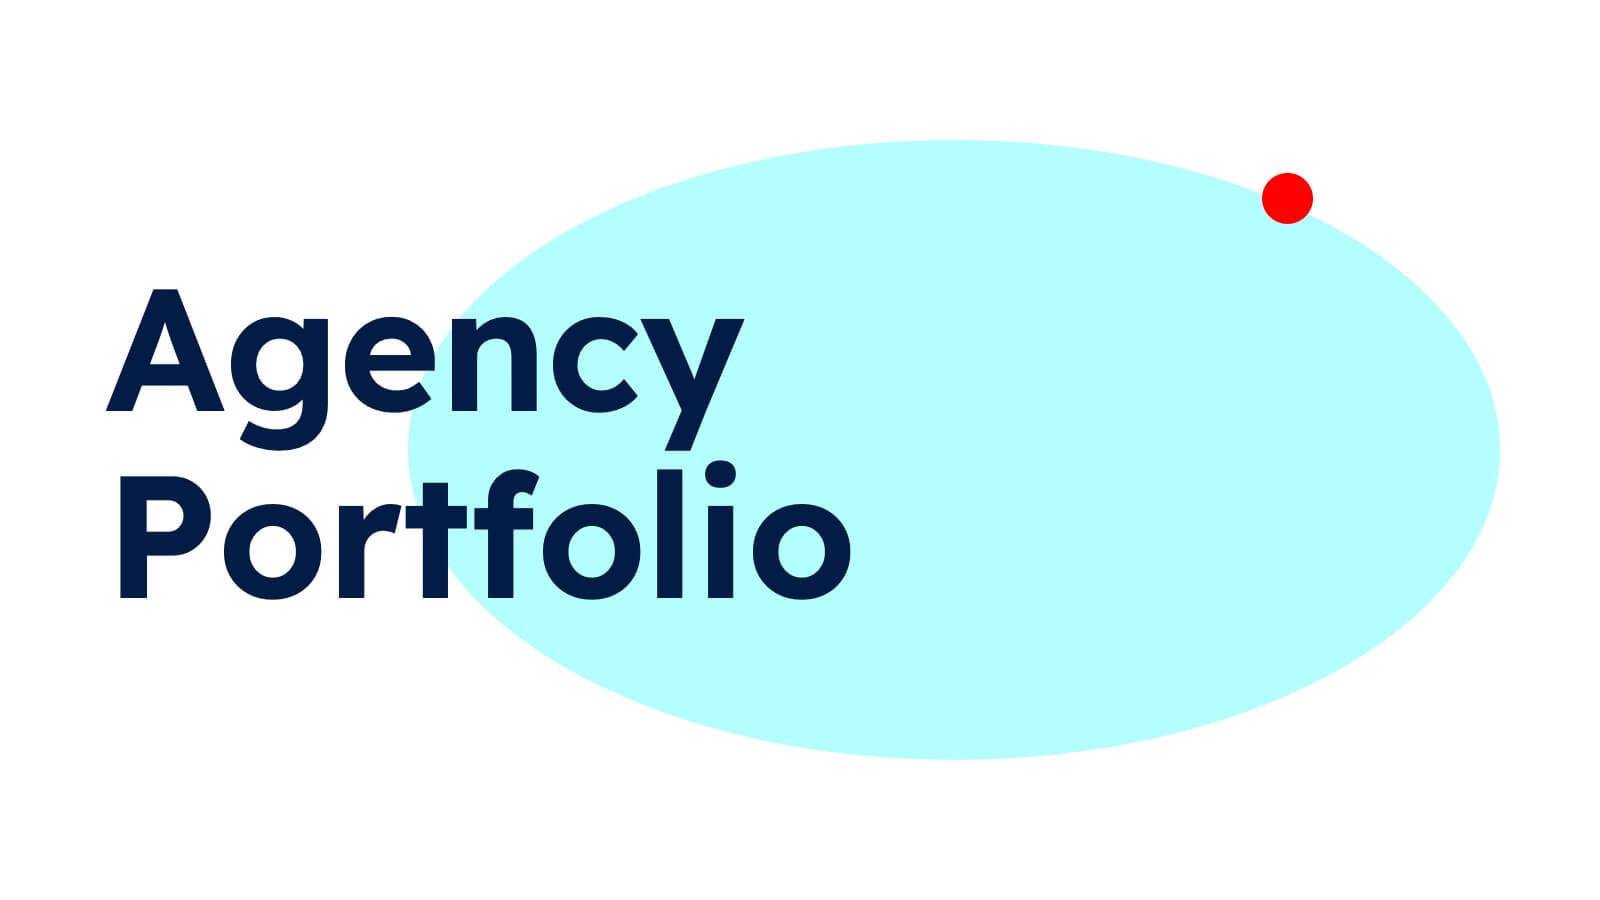
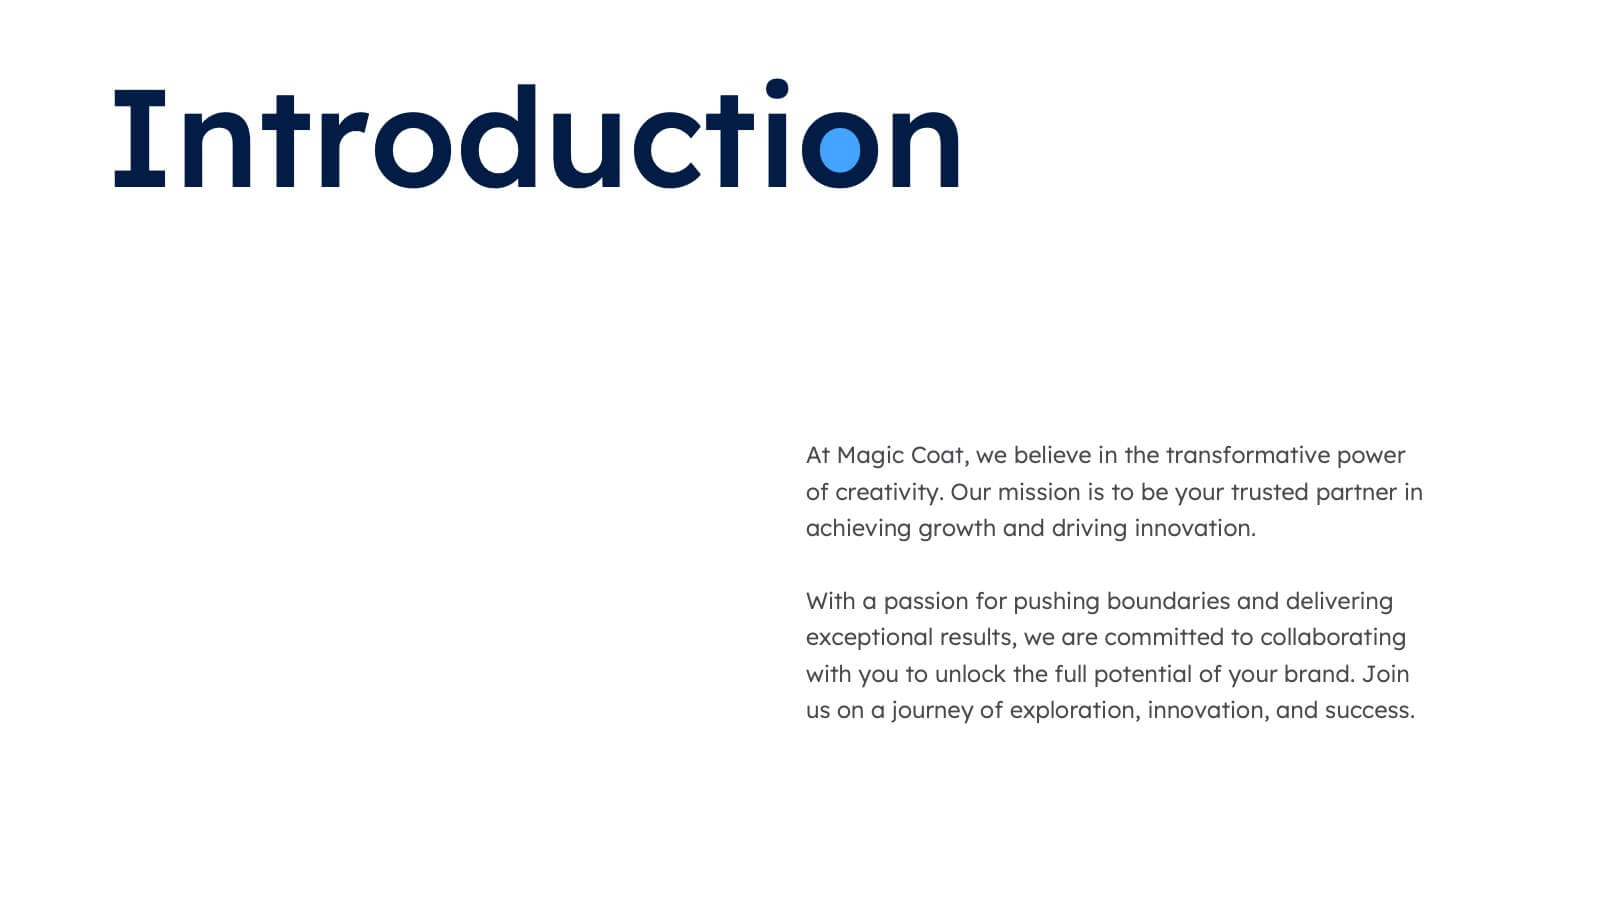
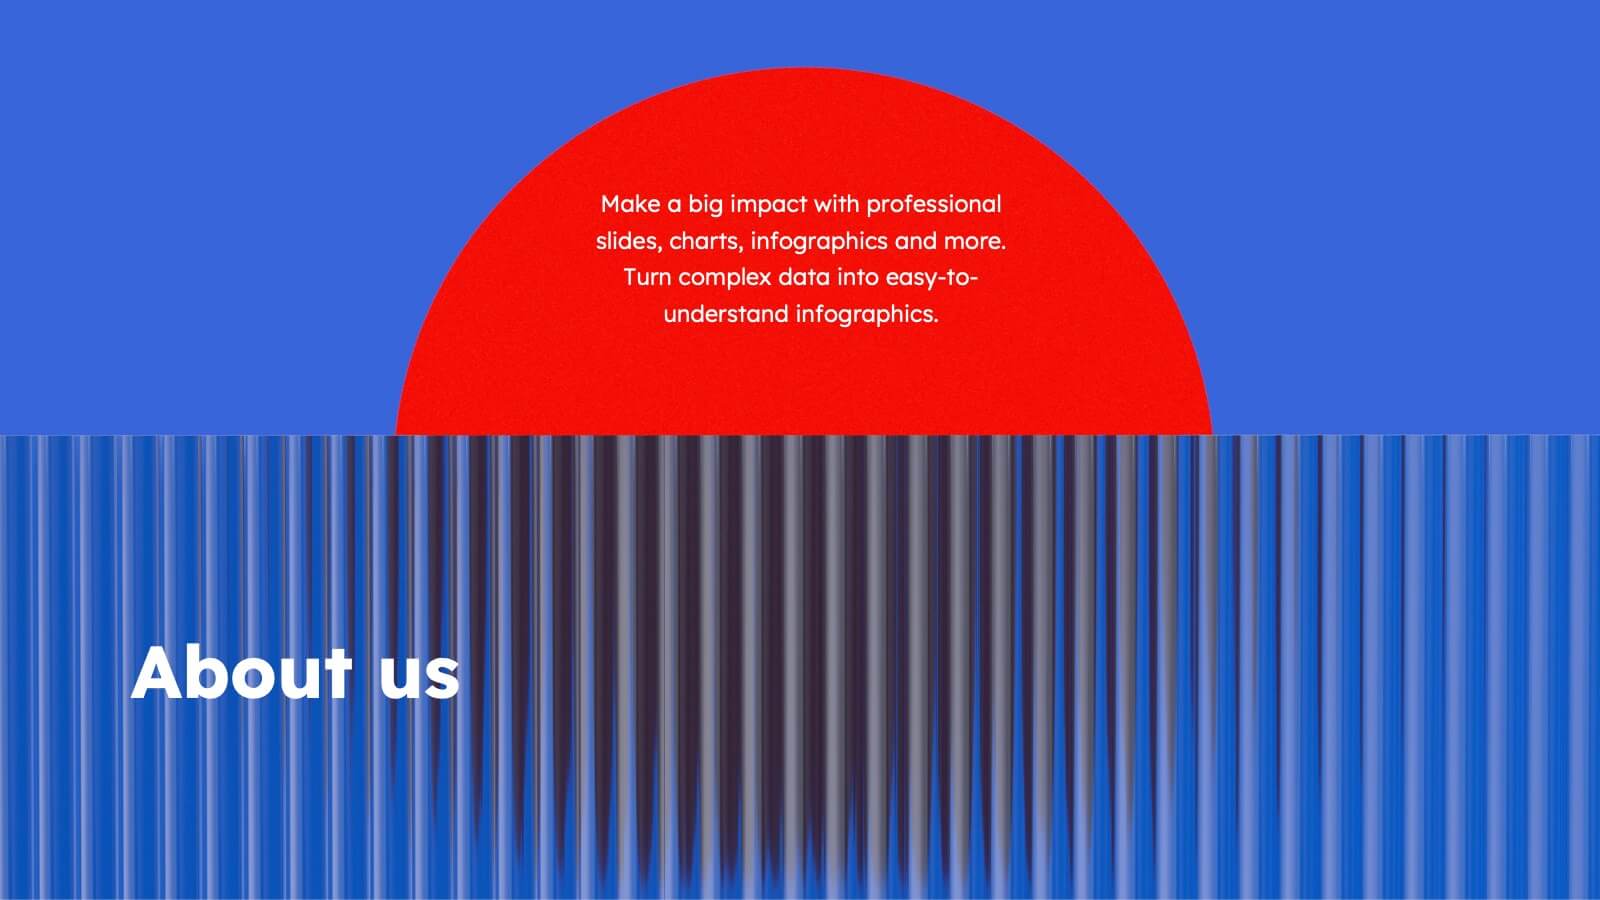
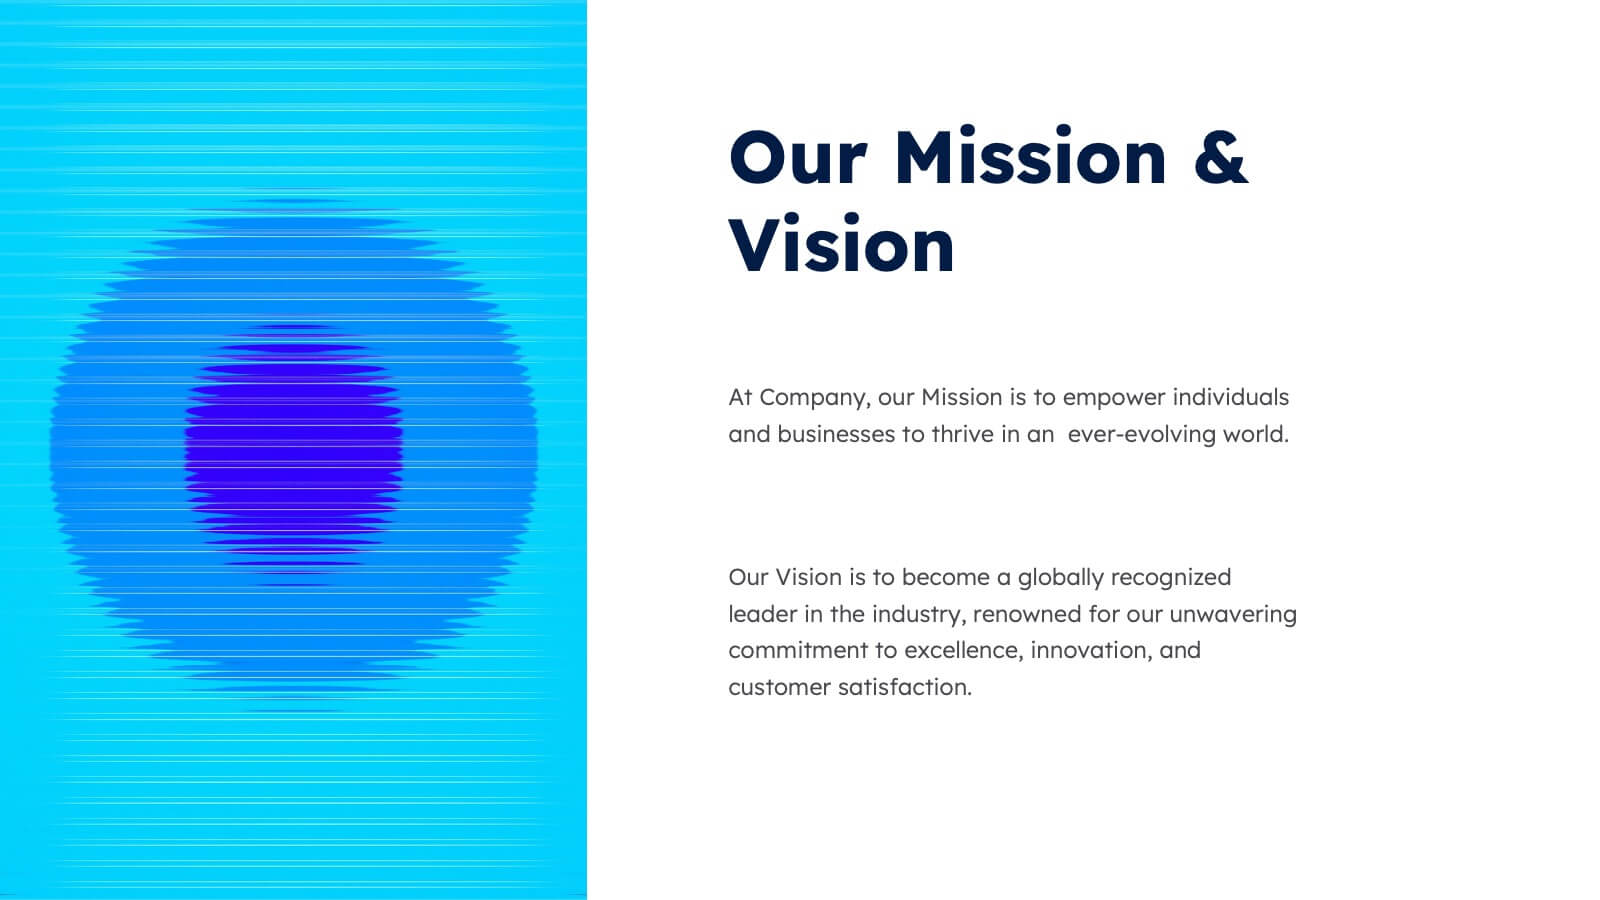
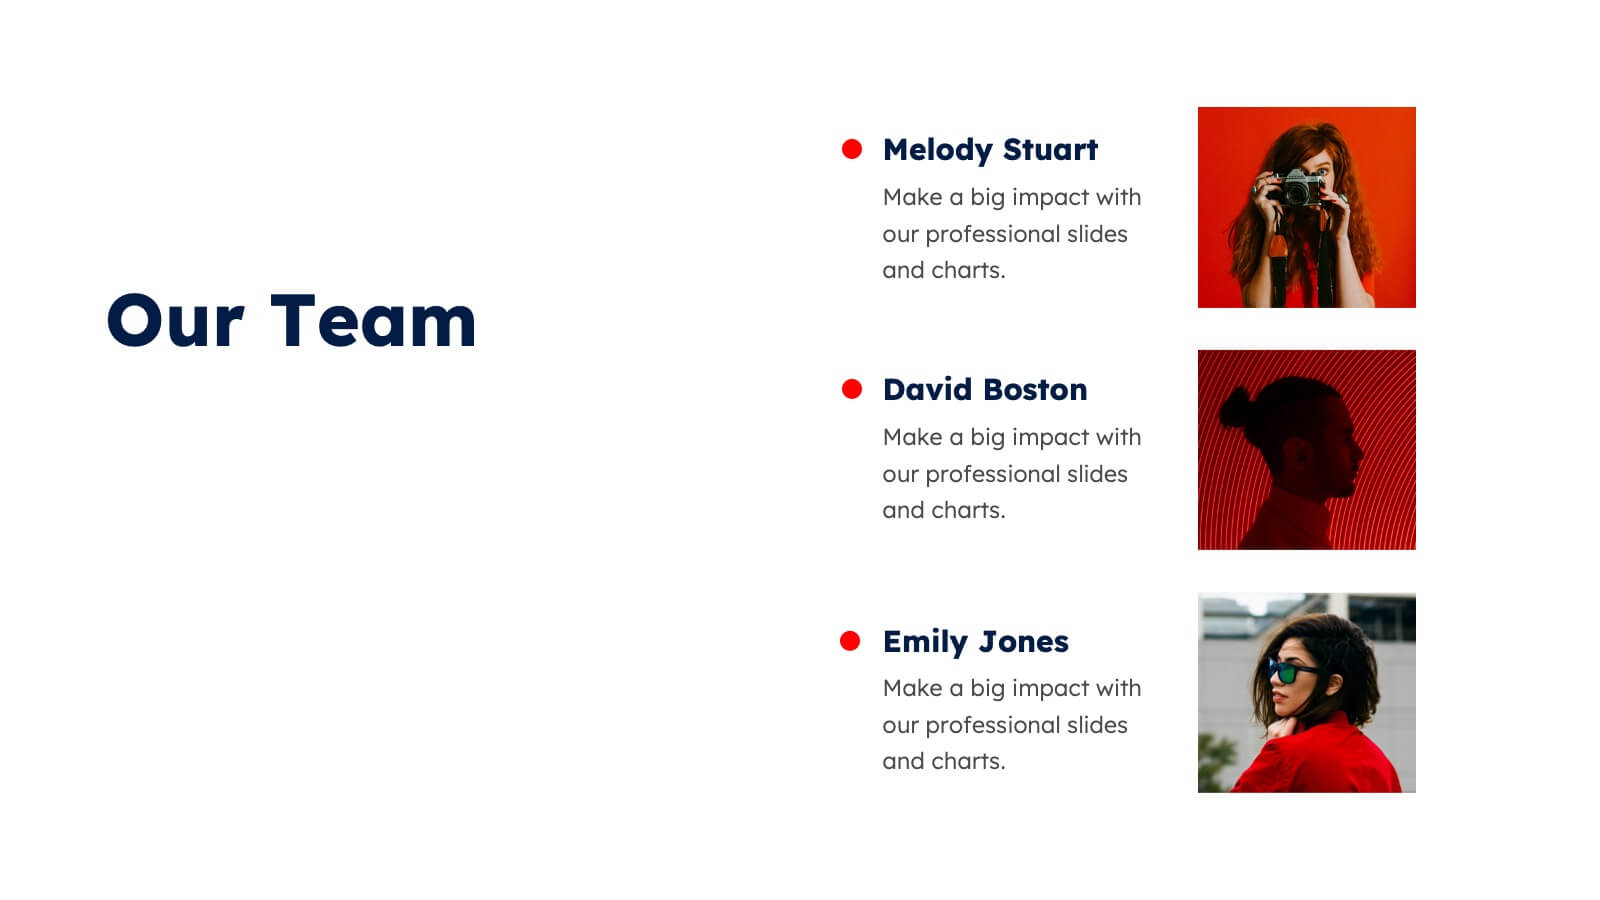
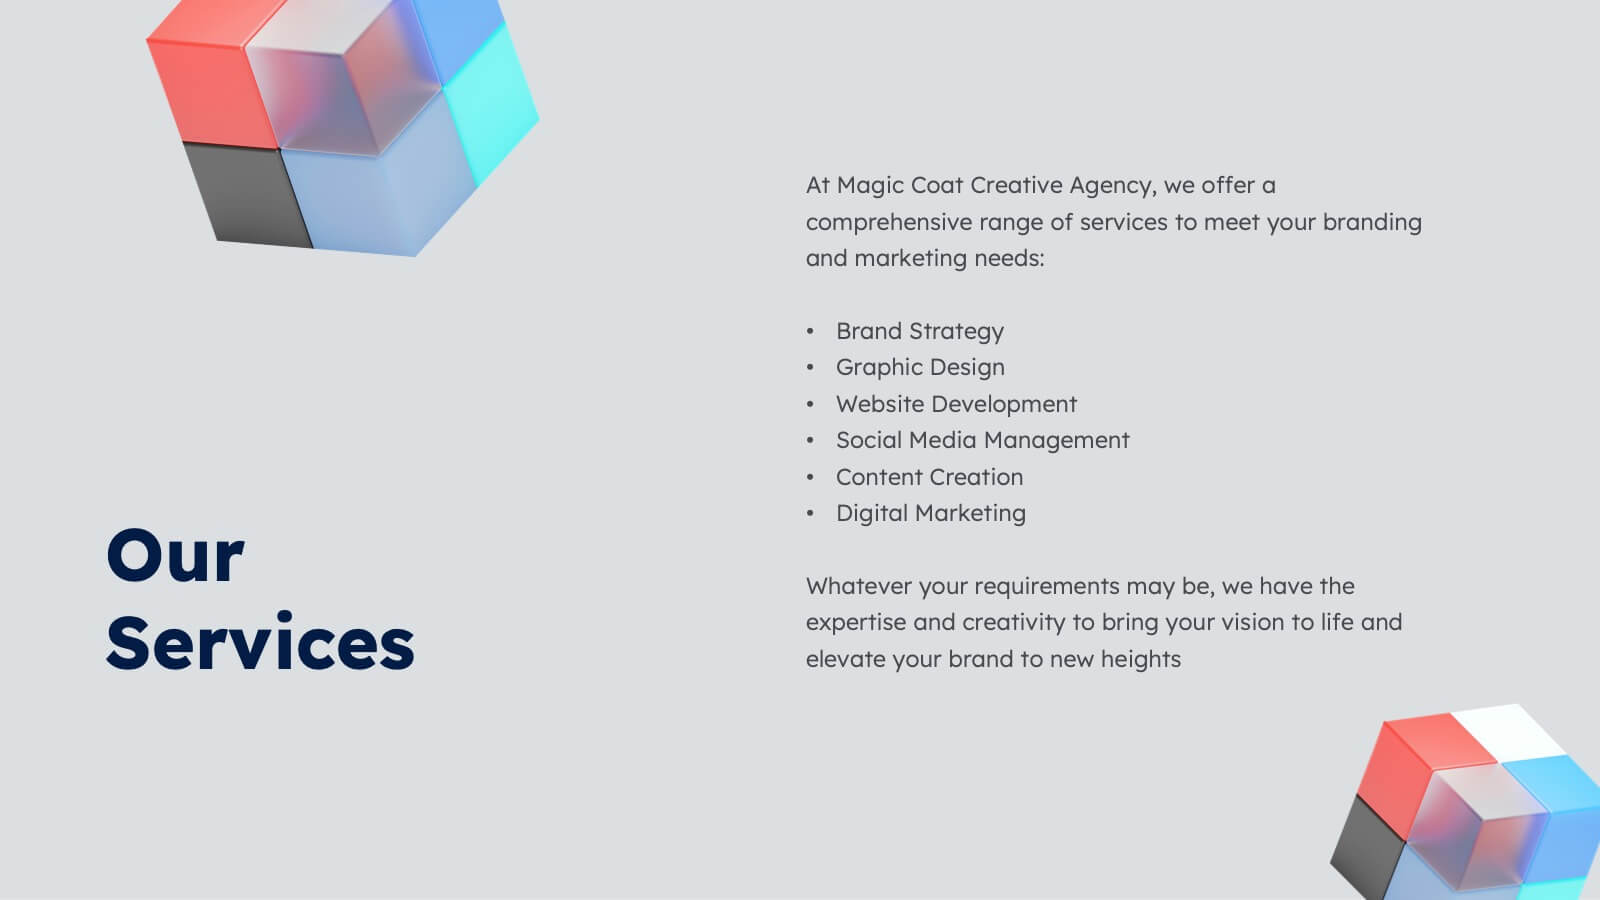
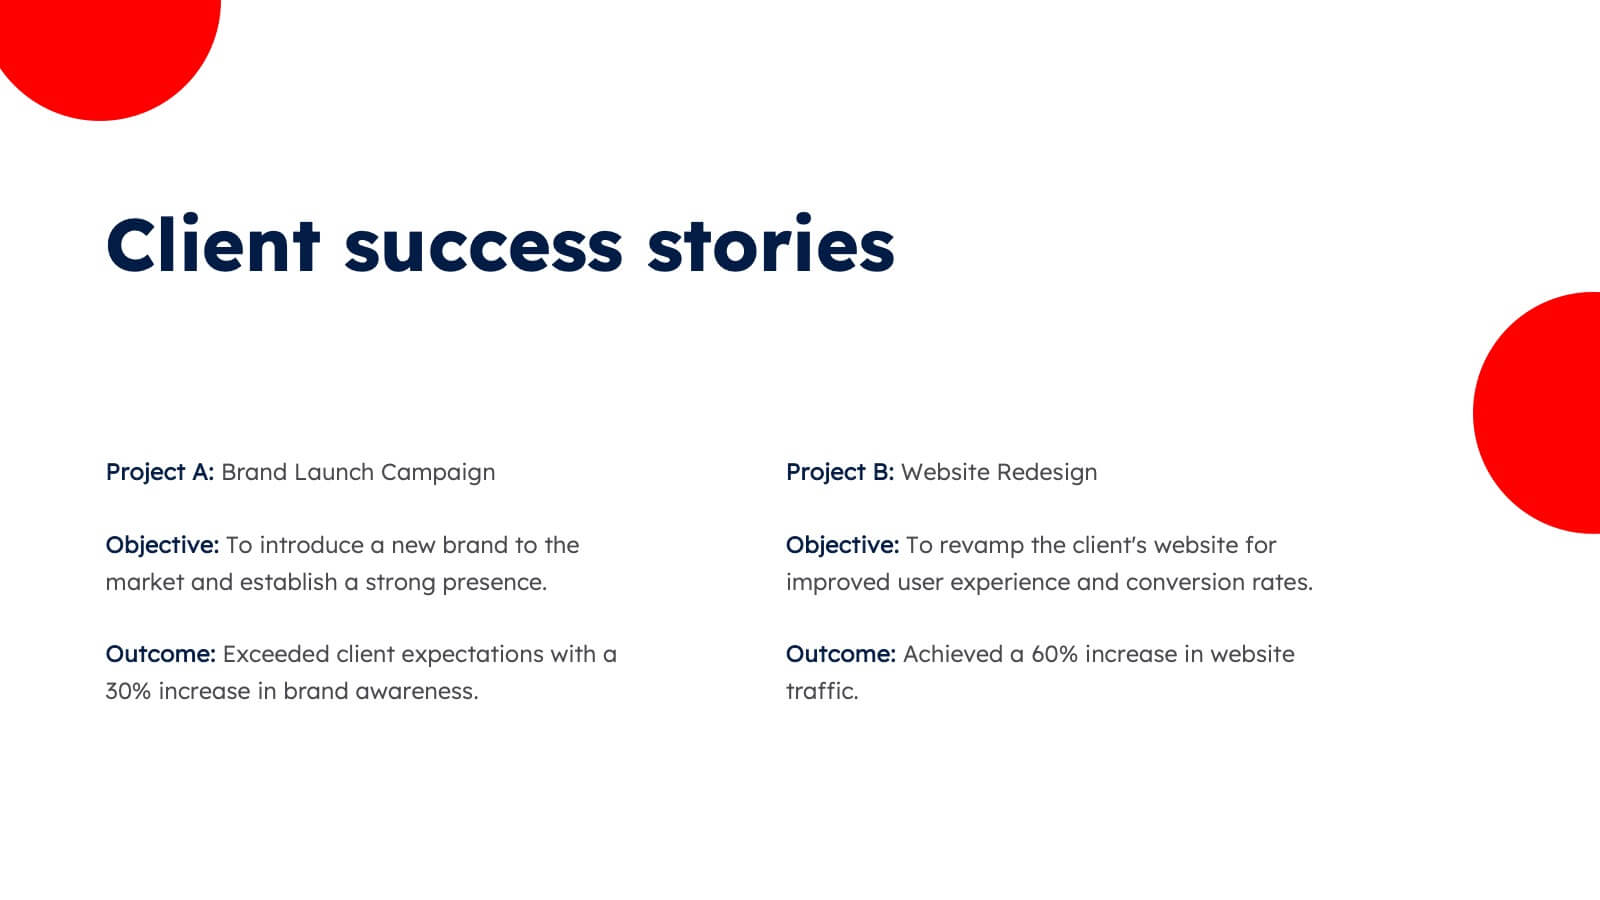
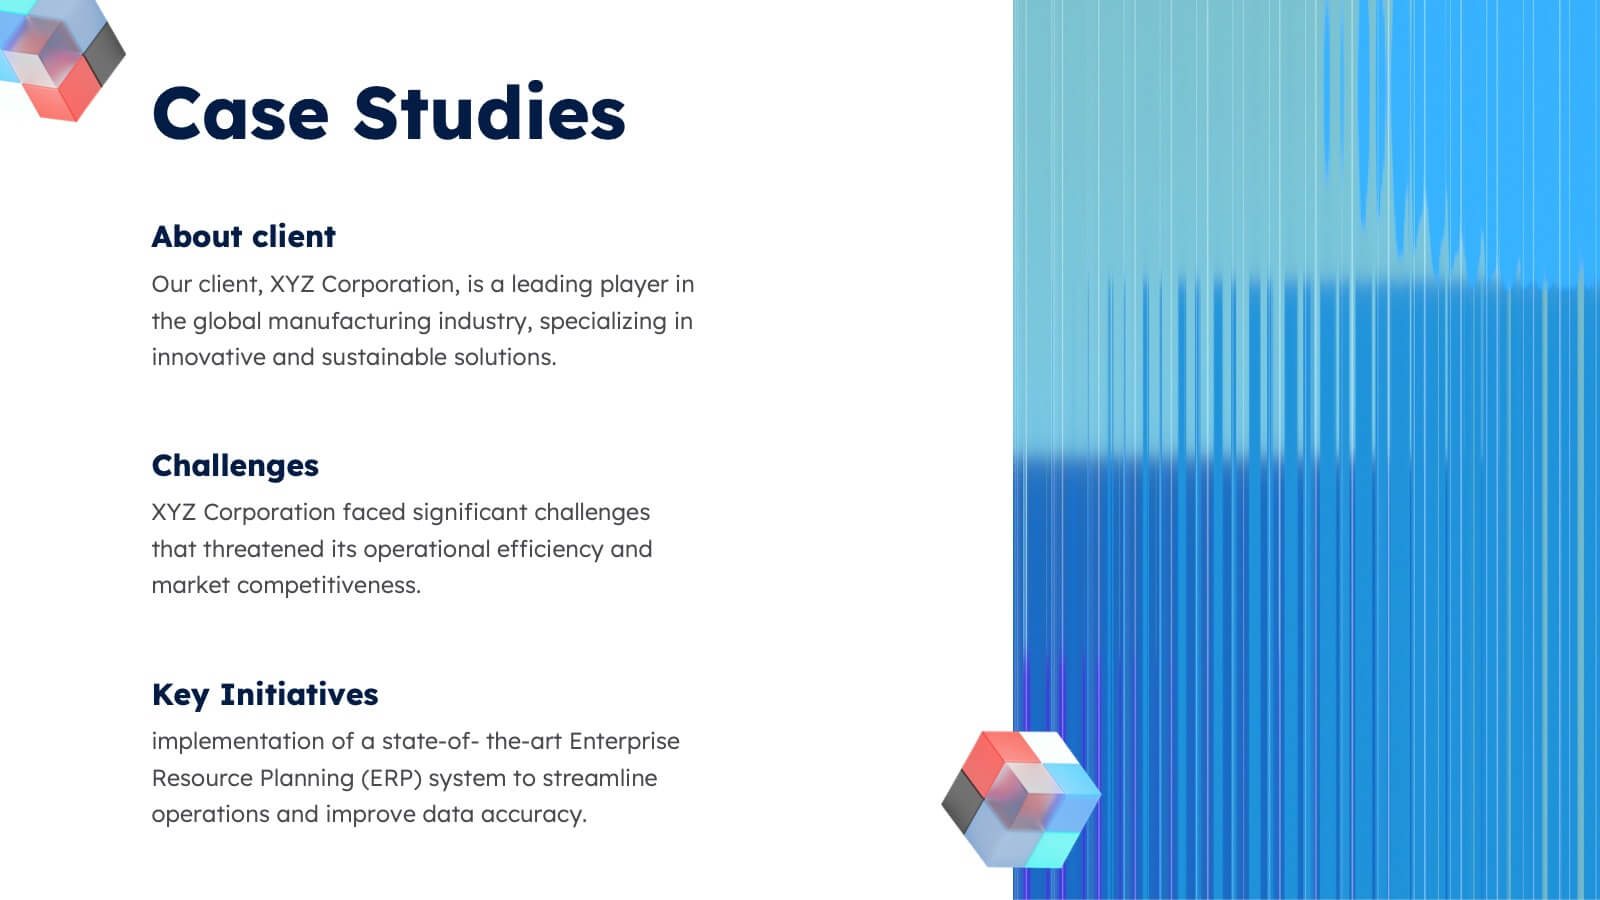
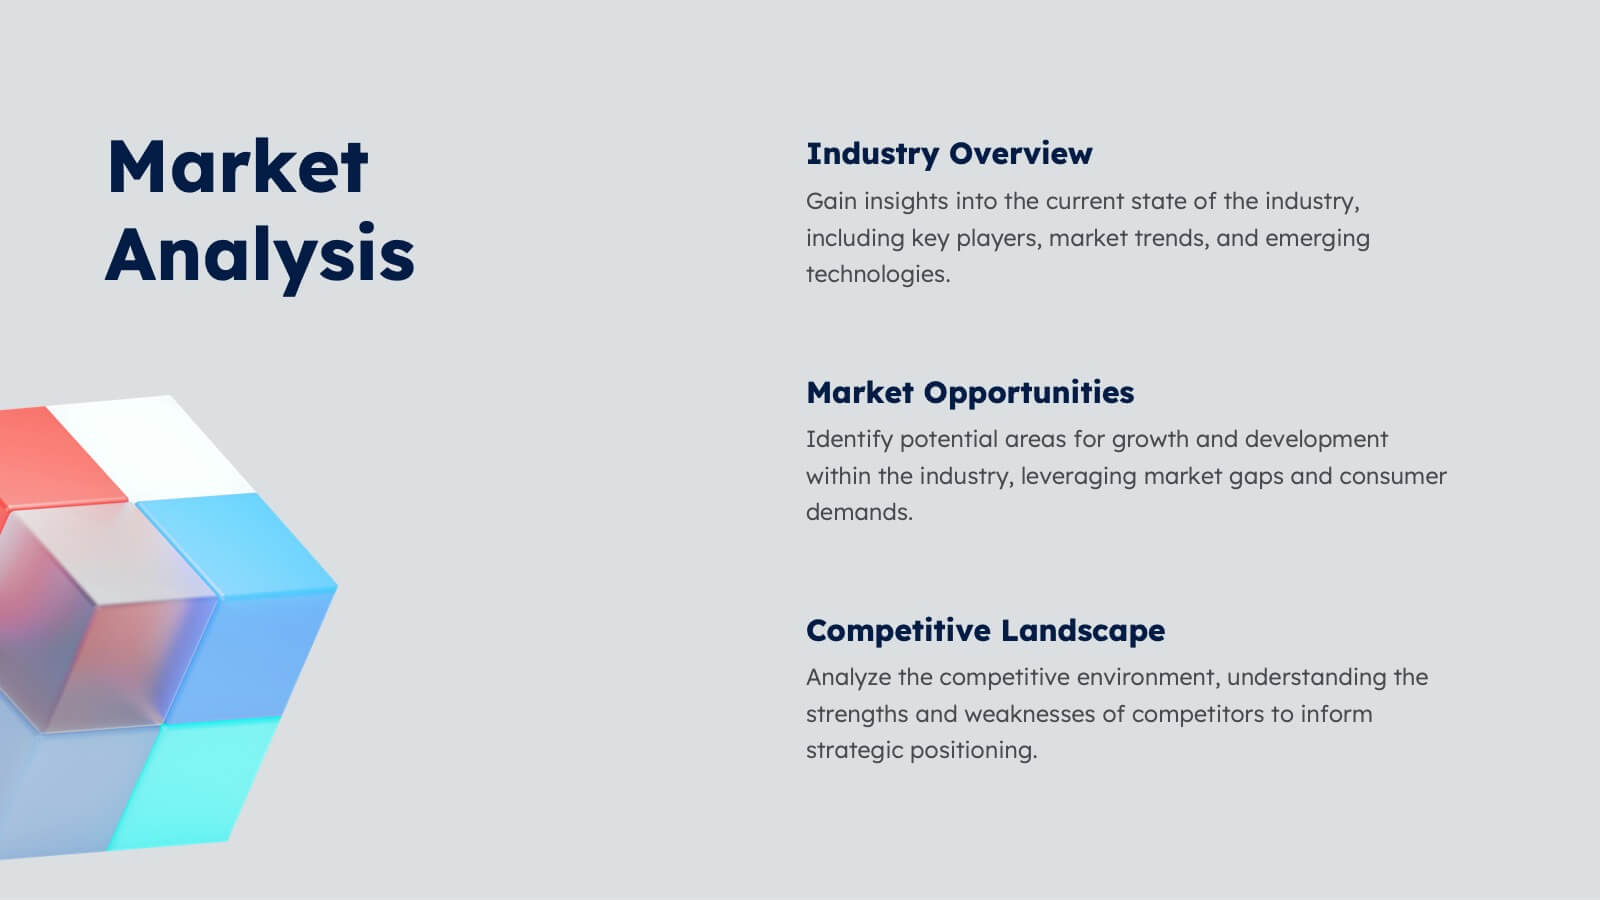
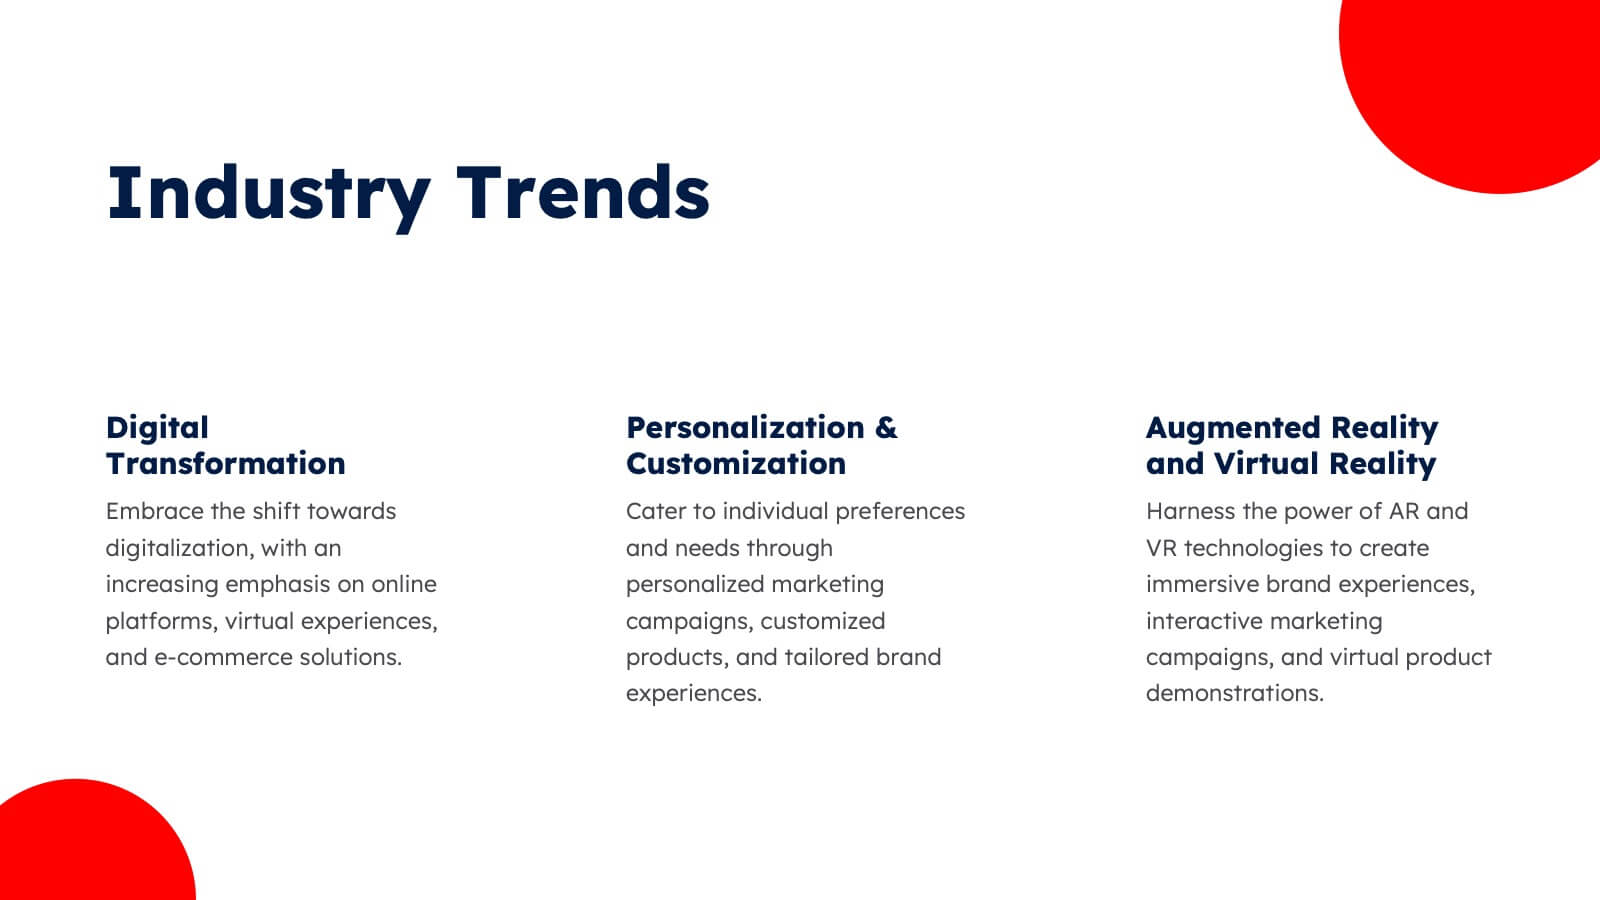
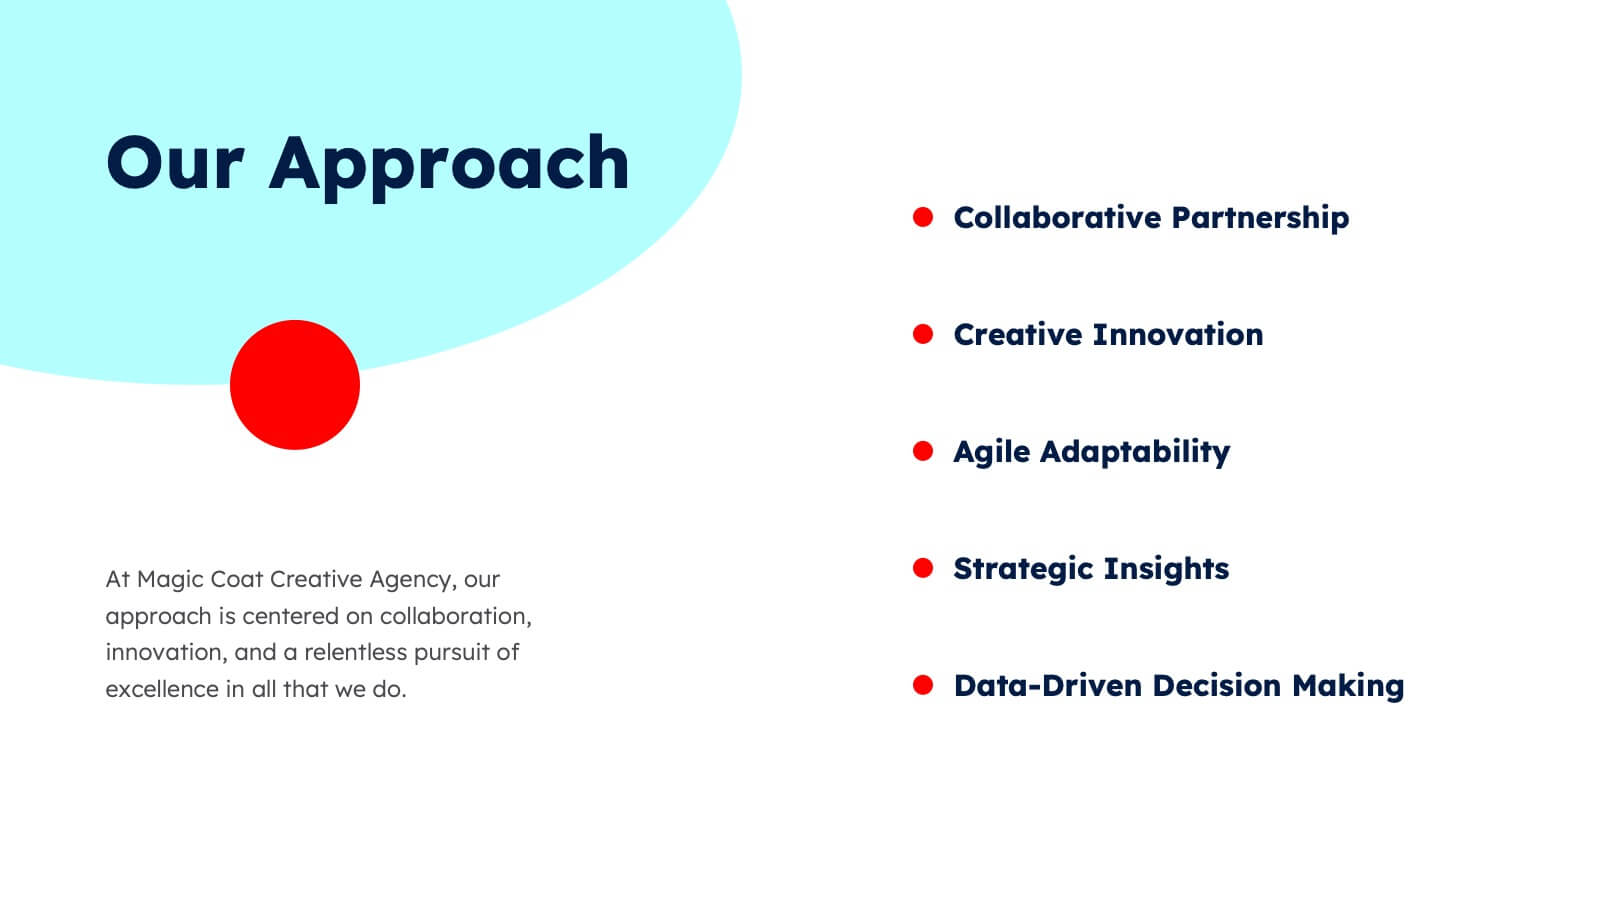
Aura Agency Portfolio Presentation
Showcase your agency's brilliance with this vibrant portfolio presentation template! Ideal for highlighting your mission, vision, case studies, and market analysis, it brings your achievements to life with colorful, engaging slides. Impress clients and partners with a well-structured, visually appealing narrative. Compatible with PowerPoint, Keynote, and Google Slides for easy use on any platform.


7 diapositivas
Ecology Infographic Presentation Template
An Ecology Infographic is a visual representation of information and data related to ecology and the environment. This template is designed in the form of charts, graphs, diagrams, illustrations, and other elements, and is made to make complex information about the environment and ecology easier to understand and more engaging. The goal of this ecology infographic template is to provide clear, concise, and visually appealing information about various environmental issues, such as climate change, pollution, habitat destruction, and other topics related to the health of our planet.


21 diapositivas
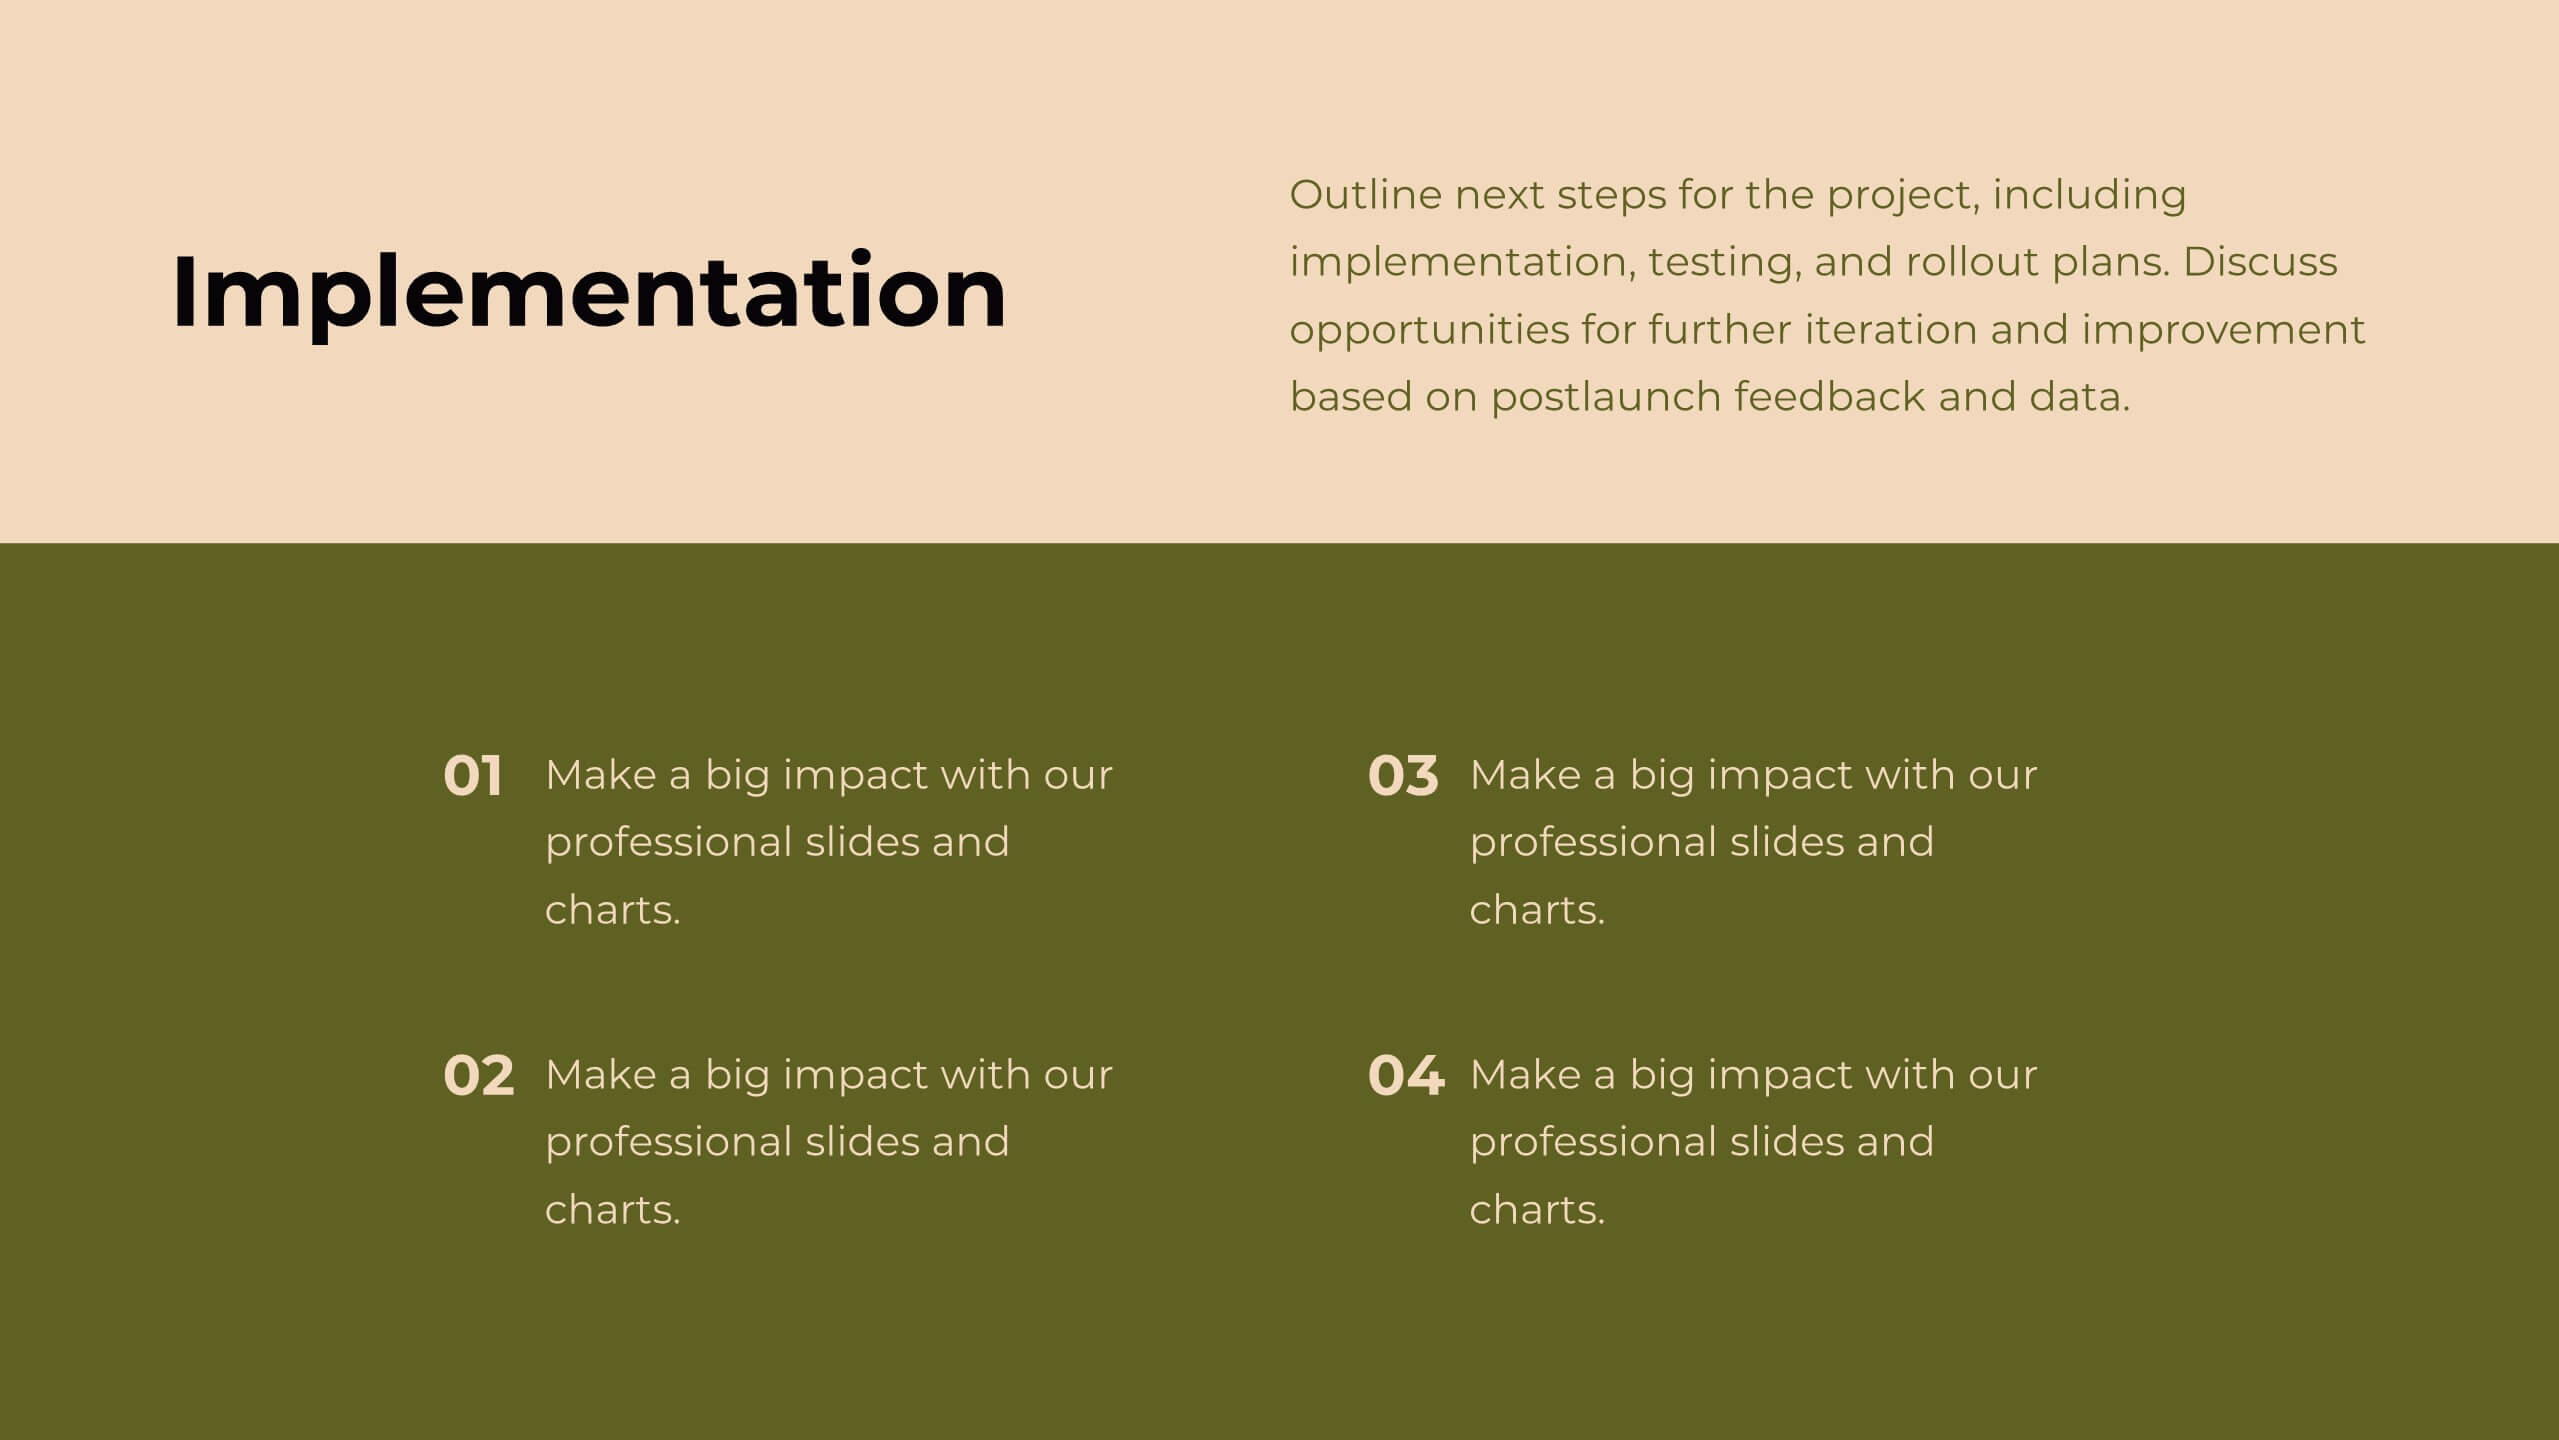
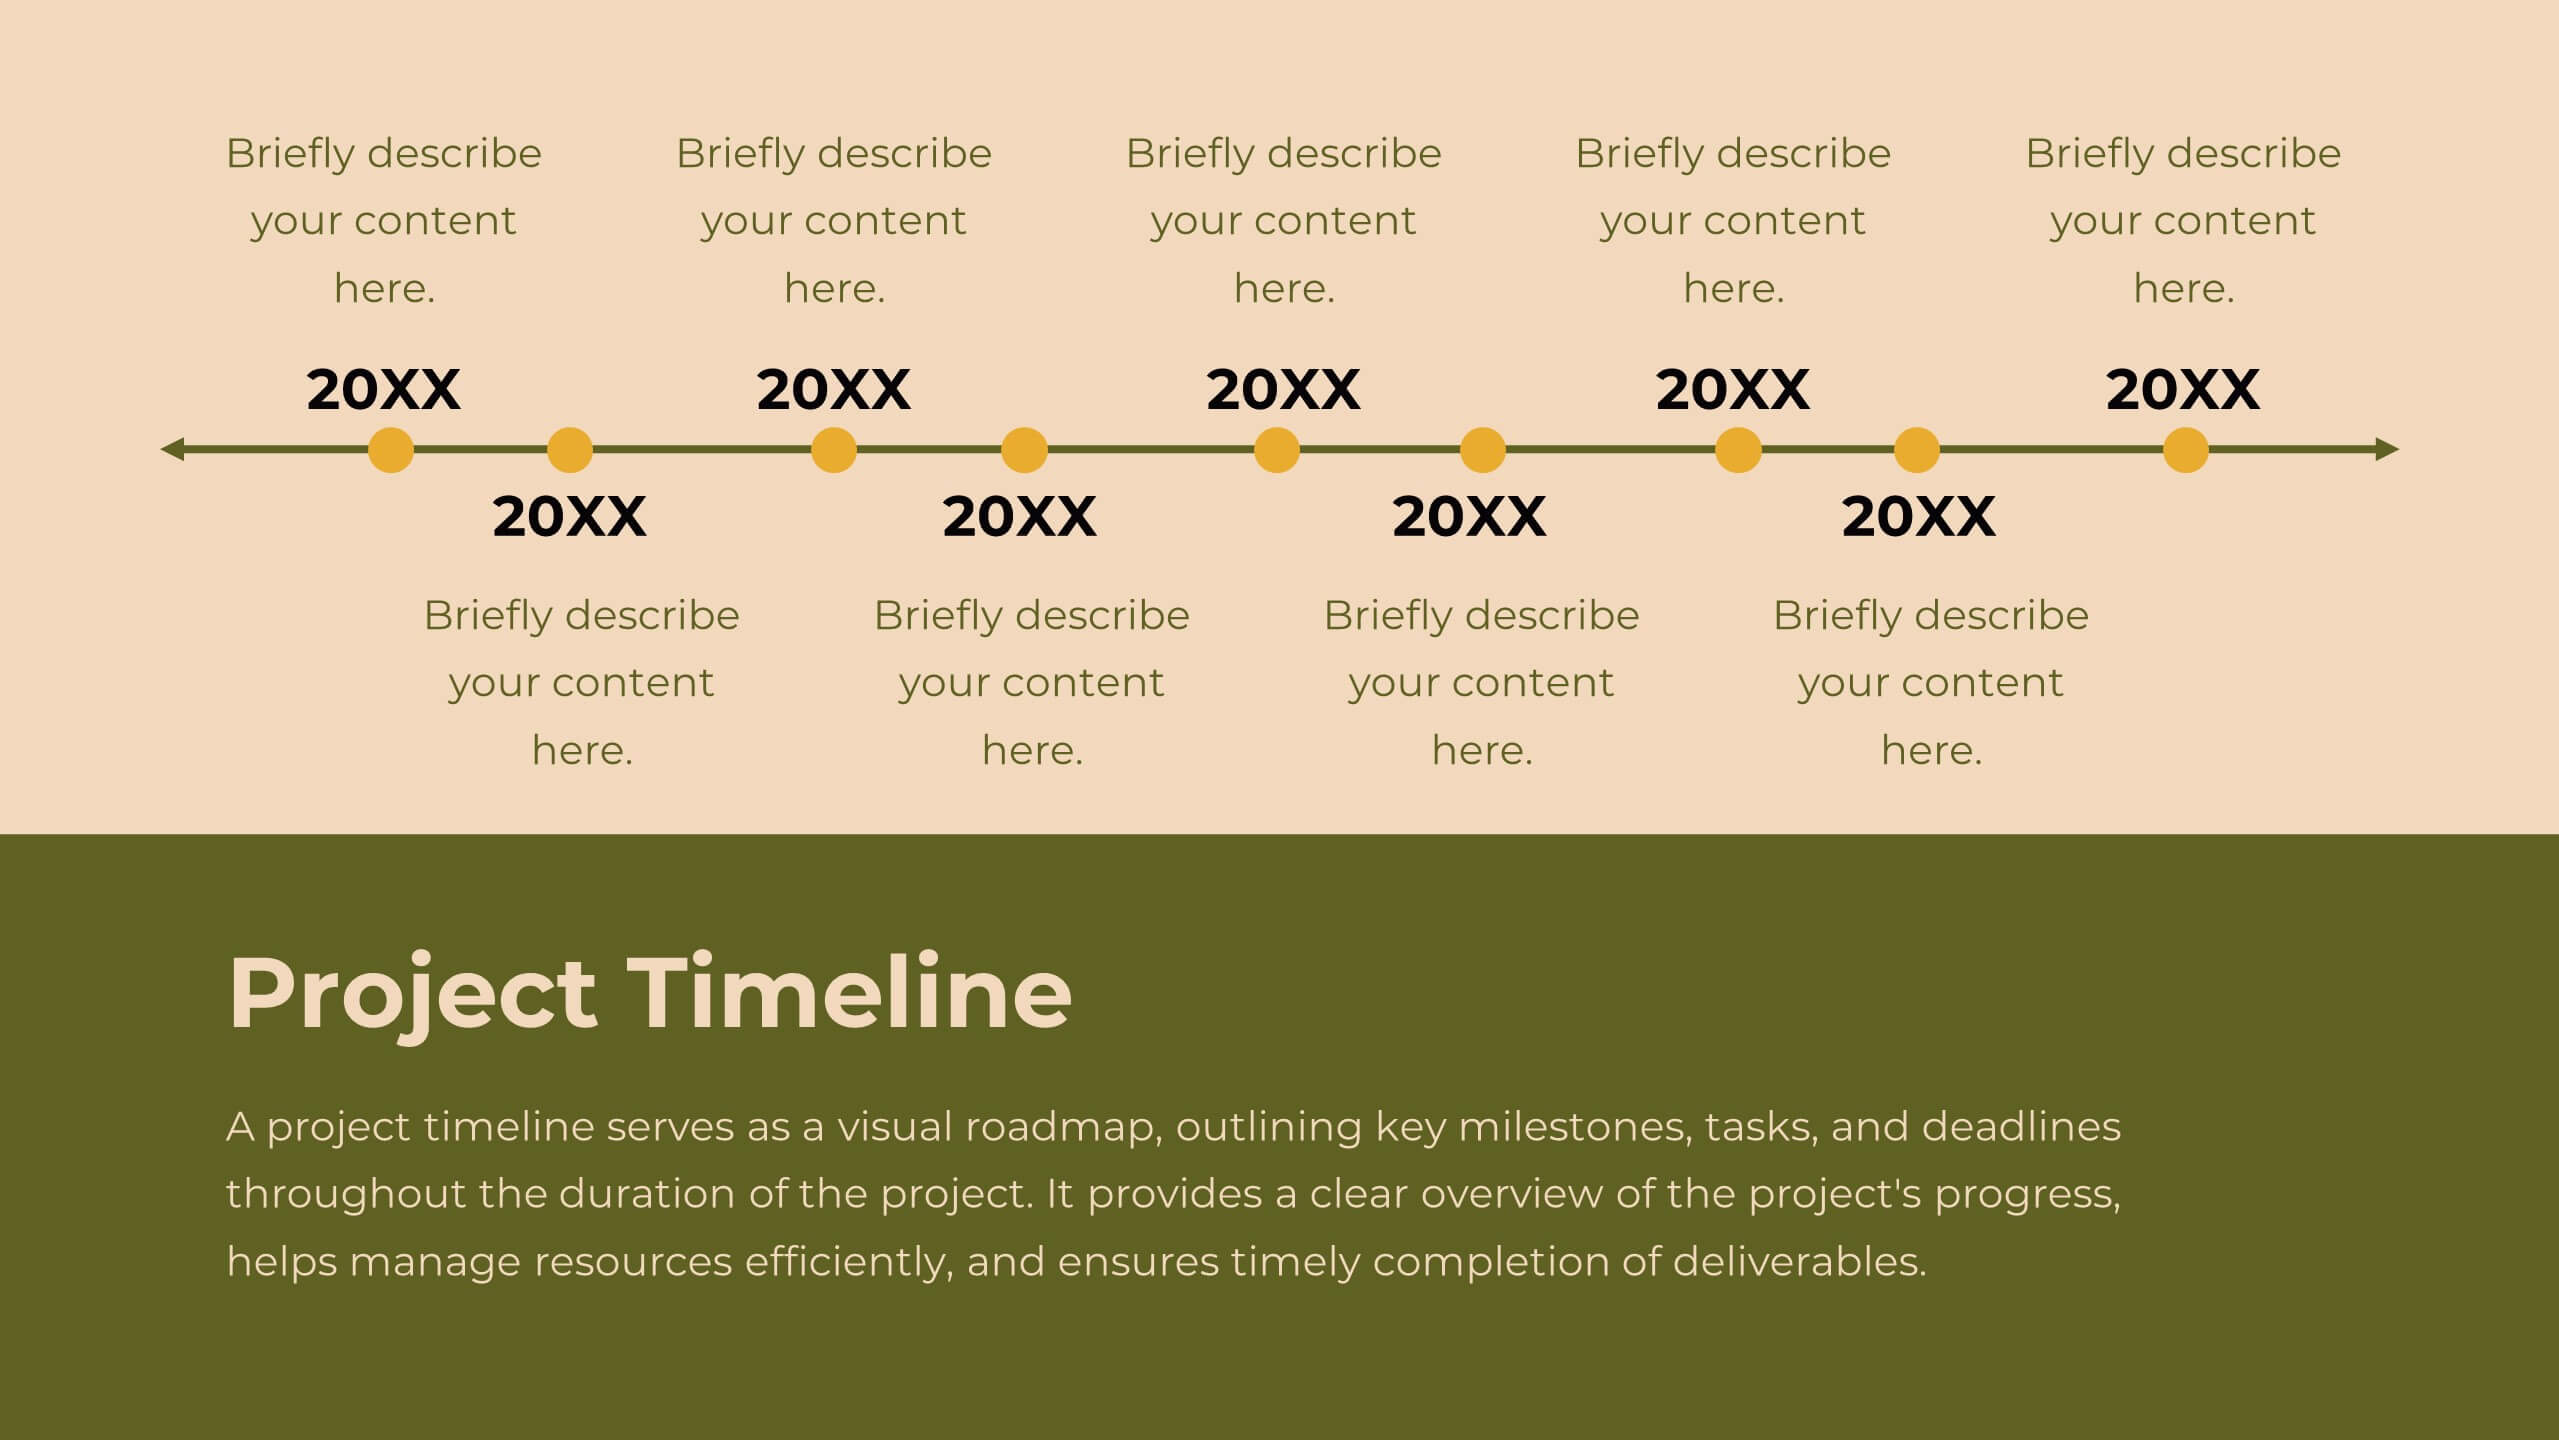
Cerberus Project Timeline Presentation
Bring your project vision to life with a well-structured plan that flows effortlessly. This presentation covers everything from objectives and timelines to budget breakdowns, team introductions, and next steps, helping you communicate key details with clarity. Perfect for internal or client presentations, and fully compatible with PowerPoint, Keynote, and Google Slides.


7 diapositivas
Agile Project Management Approach Presentation
Illustrate iterative planning and delivery cycles with this Agile Project Management Approach Presentation. The dynamic circular graphic paired with a horizontal flow arrow highlights six core steps in agile workflows. Ideal for scrum teams, product owners, or project leads, each phase is clearly labeled with editable titles and content placeholders. Fully customizable and compatible with PowerPoint, Keynote, and Google Slides.


6 diapositivas
Eco-Friendly Operations and Compliance
Promote sustainable practices with the Eco-Friendly Operations and Compliance Presentation. This sleek, leaf-themed diagram is perfect for showcasing environmentally responsible workflows, green policies, or ESG initiatives. Designed to visually align with eco-branding, it's easy to customize in PowerPoint, Keynote, or Google Slides. Ideal for internal teams or client presentations.


4 diapositivas
Productivity and Task Prioritization Presentation
Streamline efficiency with structured task prioritization using this Productivity and Task Prioritization template. Designed with rating indicators, pie charts, and color-coded sections, this slide helps visualize task importance, workload distribution, and performance evaluations. Ideal for team leaders, project managers, and business strategists, this template is fully customizable and compatible with PowerPoint, Keynote, and Google Slides.


5 diapositivas
RACI Matrix Responsibility Breakdown Presentation
Visualize roles and responsibilities with this RACI Matrix slide. Clearly assign who is Responsible, Accountable, Consulted, or Informed across key tasks. Ideal for project planning and team alignment, this editable layout helps avoid confusion and ensures accountability. Perfect for PowerPoint, Keynote, or Google Slides in any business context.