


Características


¿Tienes alguna pregunta?
Recomendar


7 diapositivas
Travel Infographic Presentation Template
Our Travel Infographic is a gorgeous infographic template that allows you to instantly create a modern, stylish and eye-catching travel infographic. You can easily customize this travel infographic to suit all your needs in just a few minutes. This Travel Infographic is designed to used as a travel guide with tons of destinations, flight deals and tips to make your trip memorable. This template can be used to help you create dynamic visual content for your travels. This travel infographic is a perfect way to plan, organize and prepare for your next trip or for all the upcoming trips!


8 diapositivas
Creative SWOT Breakdown for Business Insight
Analyze your business from every angle with the Creative SWOT Breakdown for Business Insight Presentation. This bold, suitcase-style layout visually separates Strengths, Weaknesses, Opportunities, and Threats with color-coded blocks and percentage highlights for quick comparisons. Designed to simplify strategic analysis, it’s ideal for planning meetings, team workshops, or executive reviews. Fully customizable in PowerPoint, Keynote, and Google Slides.


4 diapositivas
Business Growth in Numbers Presentation
Showcase business performance with the Business Growth in Numbers Presentation template. Designed for sales reports, financial reviews, and market analysis, this template includes visualized statistics, percentage comparisons, and trend graphs to highlight key growth metrics. Fully customizable and compatible with PowerPoint, Keynote, and Google Slides, it ensures clear and compelling data storytelling.


6 diapositivas
Simple Step-by-Step Strategy Slide
Present your ideas with clarity and focus using this clean, minimal step-by-step template. Designed with a modern, easy-to-follow layout, it’s ideal for business strategies, timelines, or process explanations. Fully editable in PowerPoint, Keynote, and Google Slides for effortless customization.


4 diapositivas
Executive Data Overview Dashboard Presentation
Drive informed decision-making with the Executive Data Overview Dashboard Presentation. This sleek, data-centric slide layout features clean blocks for KPIs, progress percentages, and simple bar or donut charts—ideal for summarizing business insights, performance metrics, or operational updates. Fully editable in PowerPoint, Keynote, and Google Slides, it's designed for clarity, speed, and high-level reporting.


7 diapositivas
Social Media Infographic Presentation Template
Social media is an important business tool due to the fact that it allows you to reach, nurture, and engage with customers no matter where they are located. Additionally, it allows you to target new audiences, create brand awareness, and grow your following. This template features a clean, fun design that is easy to read. With a variety of slides and infographics, it makes it simple to create. This template will inform you how social media can be a powerful tool. This template is a great way to keep your information organized and includes tips that can be added at the bottom of each section.


28 diapositivas
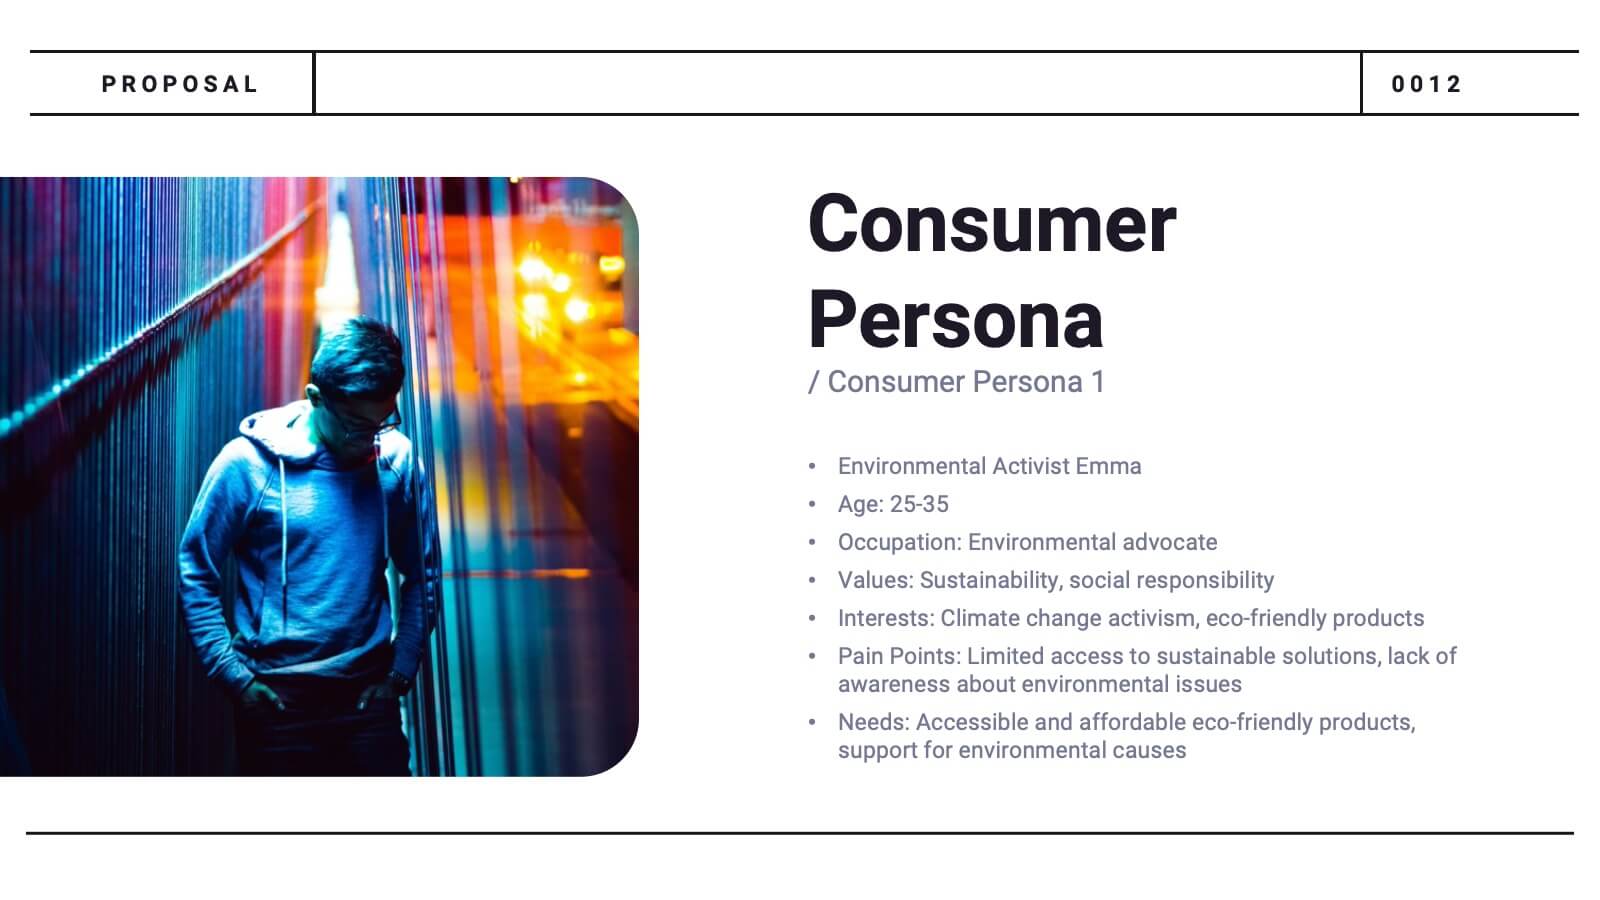
Glowspire Brand Guidelines Proposal Presentation
This brand identity template covers essential components: logo, imagery, color, typography, and voice & tone. It includes slides for consumer persona, market analysis, USP, brand positioning, and strategy. Ideal for establishing a cohesive brand, it highlights brand touchpoints across digital, print, packaging, and advertising mediums. Customizable for various platforms.


6 diapositivas
Six Sigma Process Infographic
Dive into the world of process improvement with our six sigma process infographic. Crafted with a harmonious blend of blue, yellow, and white, this infographic elucidates the principles of Six Sigma methodology in an engaging manner. Ideal for business analysts, quality assurance teams, and corporate trainers, it delineates the DMAIC process in vivid detail. The design encapsulates the rigorous methodology of Six Sigma, providing clarity and fostering knowledge retention. This versatile template is a perfect fit for PowerPoint, Keynote, and Google Slides, making your presentations both captivating and insightful.


23 diapositivas
Mystic Small Business Pitch Deck Presentation
Elevate your small business presentations with this sleek, professional pitch deck template! It’s designed to highlight your company's background, market opportunities, and key objectives in a visually appealing format. Perfect for showcasing your products, services, value proposition, and financial performance, this template makes your pitch stand out. Customize it for PowerPoint, Keynote, or Google Slides to suit your needs.


4 diapositivas
Circular Strategy Model Presentation
Turn your ideas into a story that flows effortlessly with this clean and modern presentation design. Perfect for visualizing continuous improvement, collaboration strategies, or organizational frameworks, it helps you present key points in a clear circular format. Fully compatible with PowerPoint, Keynote, and Google Slides for easy customization.


6 diapositivas
Bubble Chart Data Visualization Presentation
Make your data pop with visuals that tell a story at a glance. This modern presentation transforms raw numbers into clear, engaging bubble charts that simplify complex insights and comparisons. Fully editable and compatible with PowerPoint, Keynote, and Google Slides for effortless customization and professional results.


5 diapositivas
Business Development Five-Step Plan Presentation
Accelerate your growth with the Business Development Five-Step Plan presentation. This structured template guides you through key stages of business expansion, from strategy to execution. Designed for entrepreneurs, startups, and corporate teams, this clear and engaging format ensures effective planning and communication. Fully customizable for PowerPoint, Keynote, and Google Slides to fit your specific needs.


4 diapositivas
Task Automation Workflow Presentation
Streamline your operations with the Task Automation Workflow template, designed to visualize automated processes and optimize efficiency. Perfect for project managers and teams, this template helps clarify task dependencies, process flows, and automation impact. Fully customizable and compatible with PowerPoint, Keynote, and Google Slides for seamless workflow presentations.


12 diapositivas
Banking Offers and Card Perks Overview Presentation
Showcase financial benefits clearly with this Banking Offers and Card Perks Overview Presentation. Designed with a bold payment terminal and card visual, this layout helps you highlight key rewards, cashback deals, and special cardholder perks. Ideal for banks, fintechs, and retail loyalty programs. Fully editable in PowerPoint, Keynote, and Google Slides.


26 diapositivas
The Impact of 5G Technology Presentation
Step into the future with this insightful presentation on the impact of 5G technology. Covering key areas like faster connectivity, IoT advancements, industry applications, and potential challenges, this template helps you break down complex concepts with clarity. Fully customizable and compatible with PowerPoint, Keynote, and Google Slides for a seamless presentation experience.


25 diapositivas
Zephyrion Brand Guidelines Proposal Presentation
Build and communicate your brand effectively with this comprehensive brand strategy presentation! It features sections like brand voice, positioning, competitive landscape, and performance metrics, helping you align your messaging and identity. Ideal for internal brand workshops or client presentations, this template works seamlessly with PowerPoint, Keynote, and Google Slides.
22 diapositivas
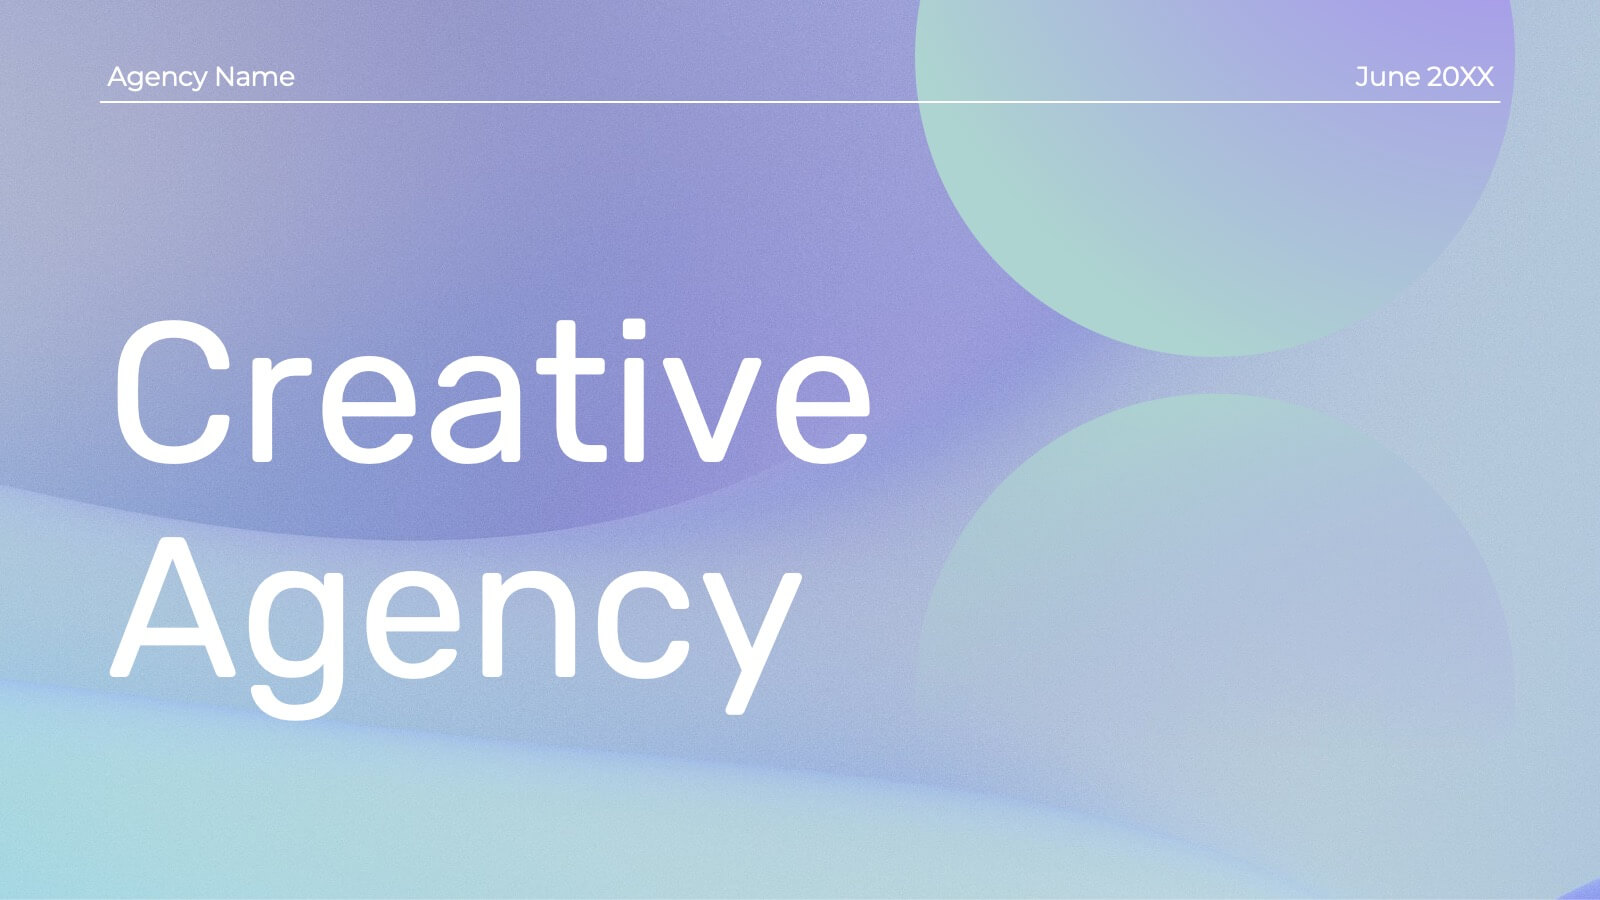
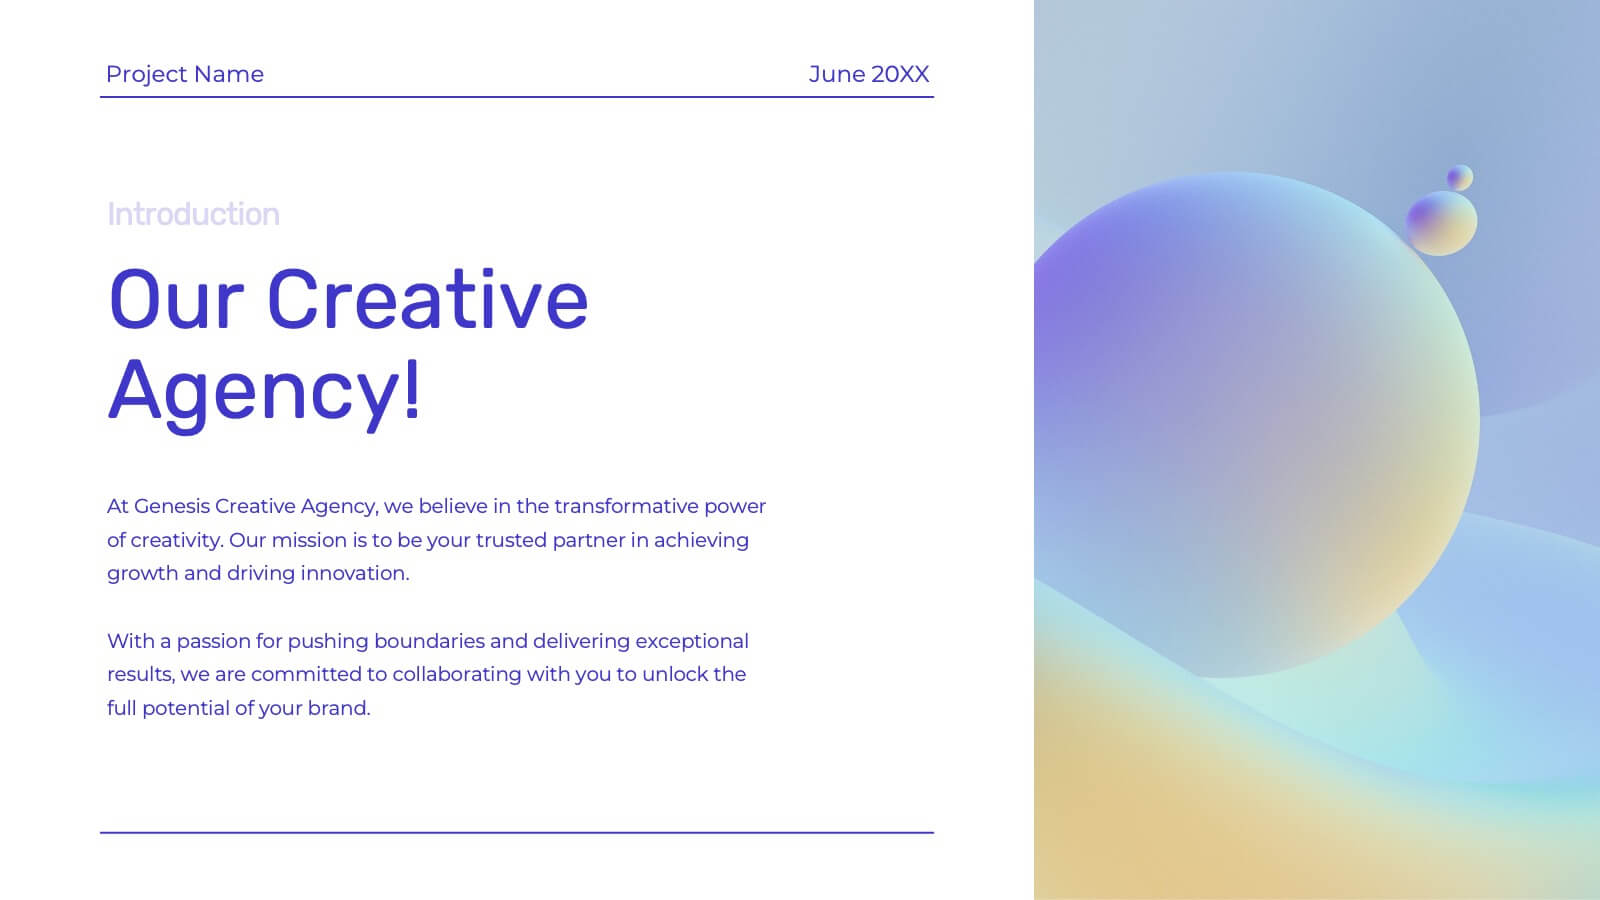
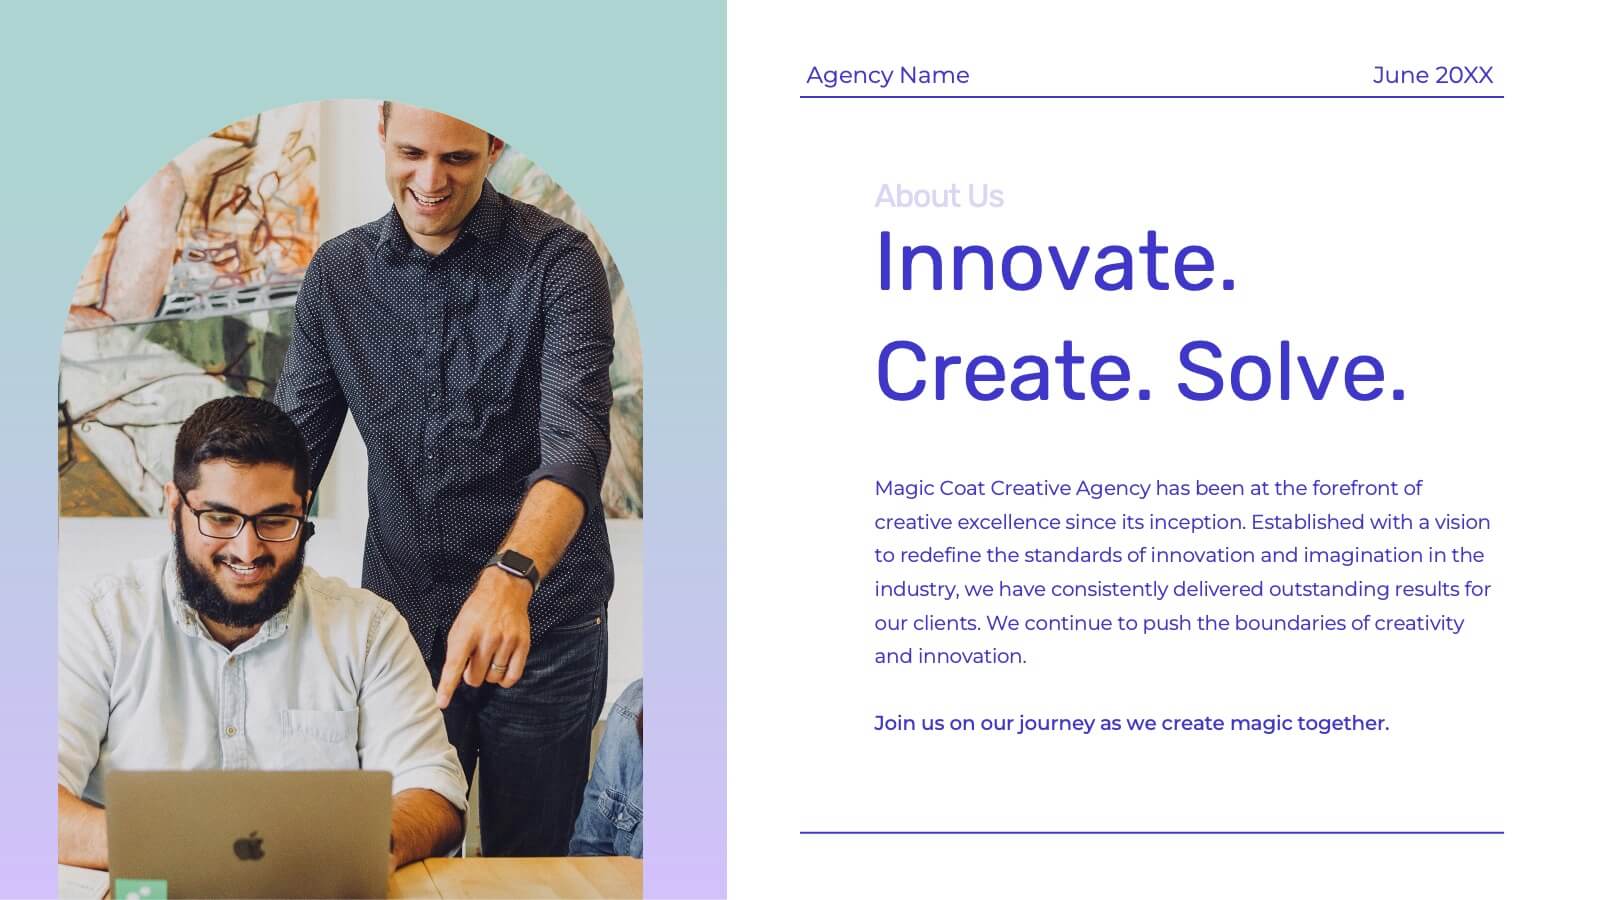
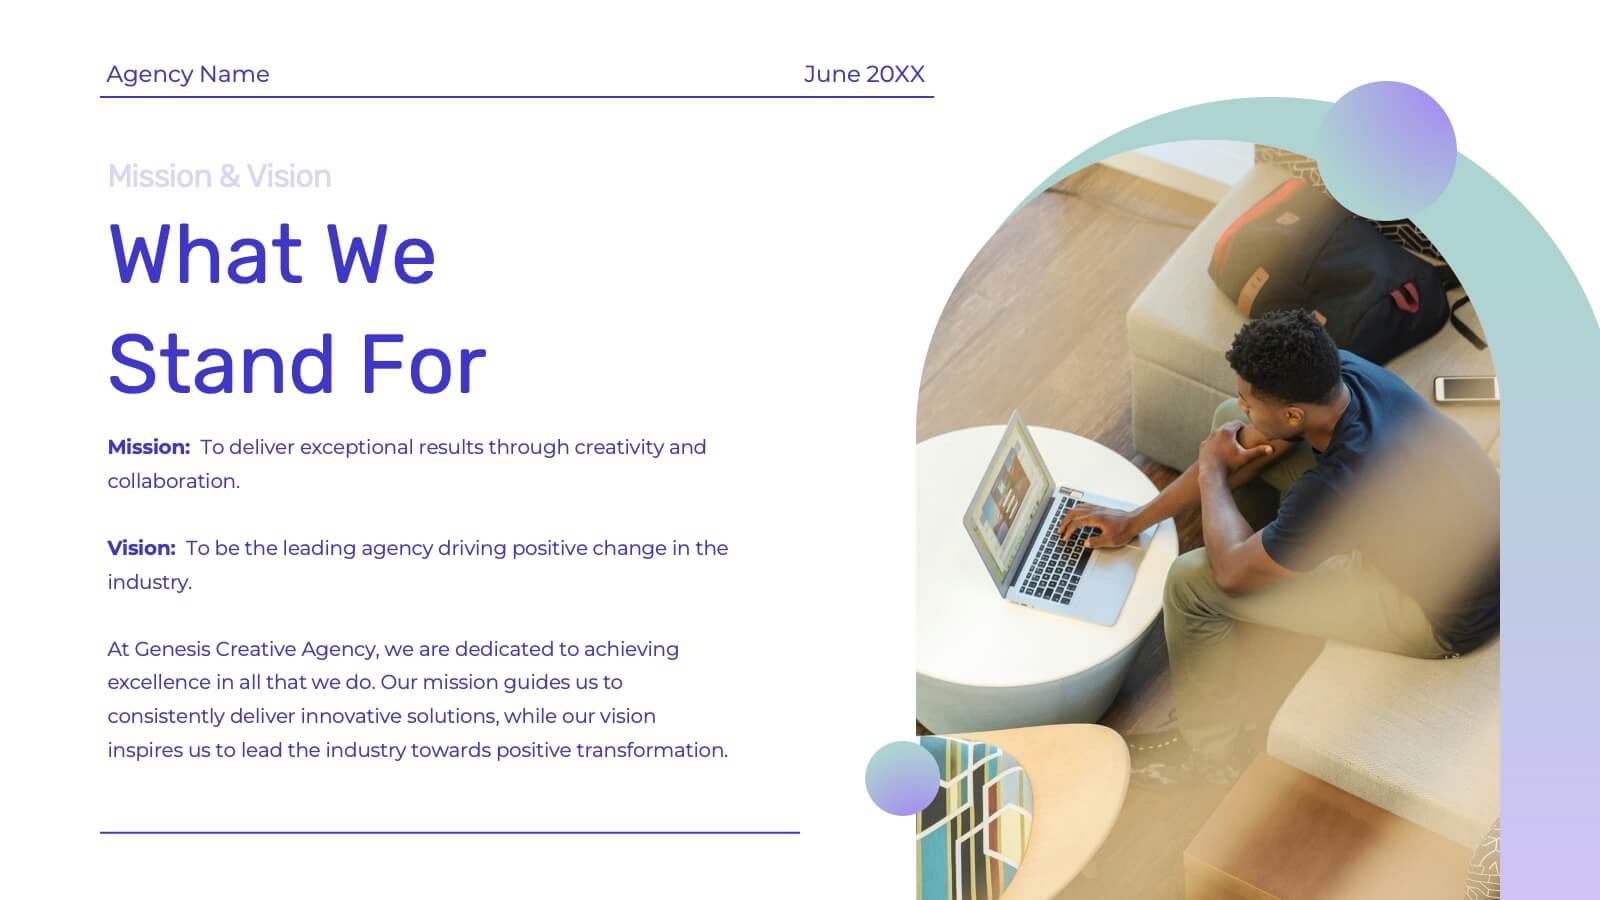
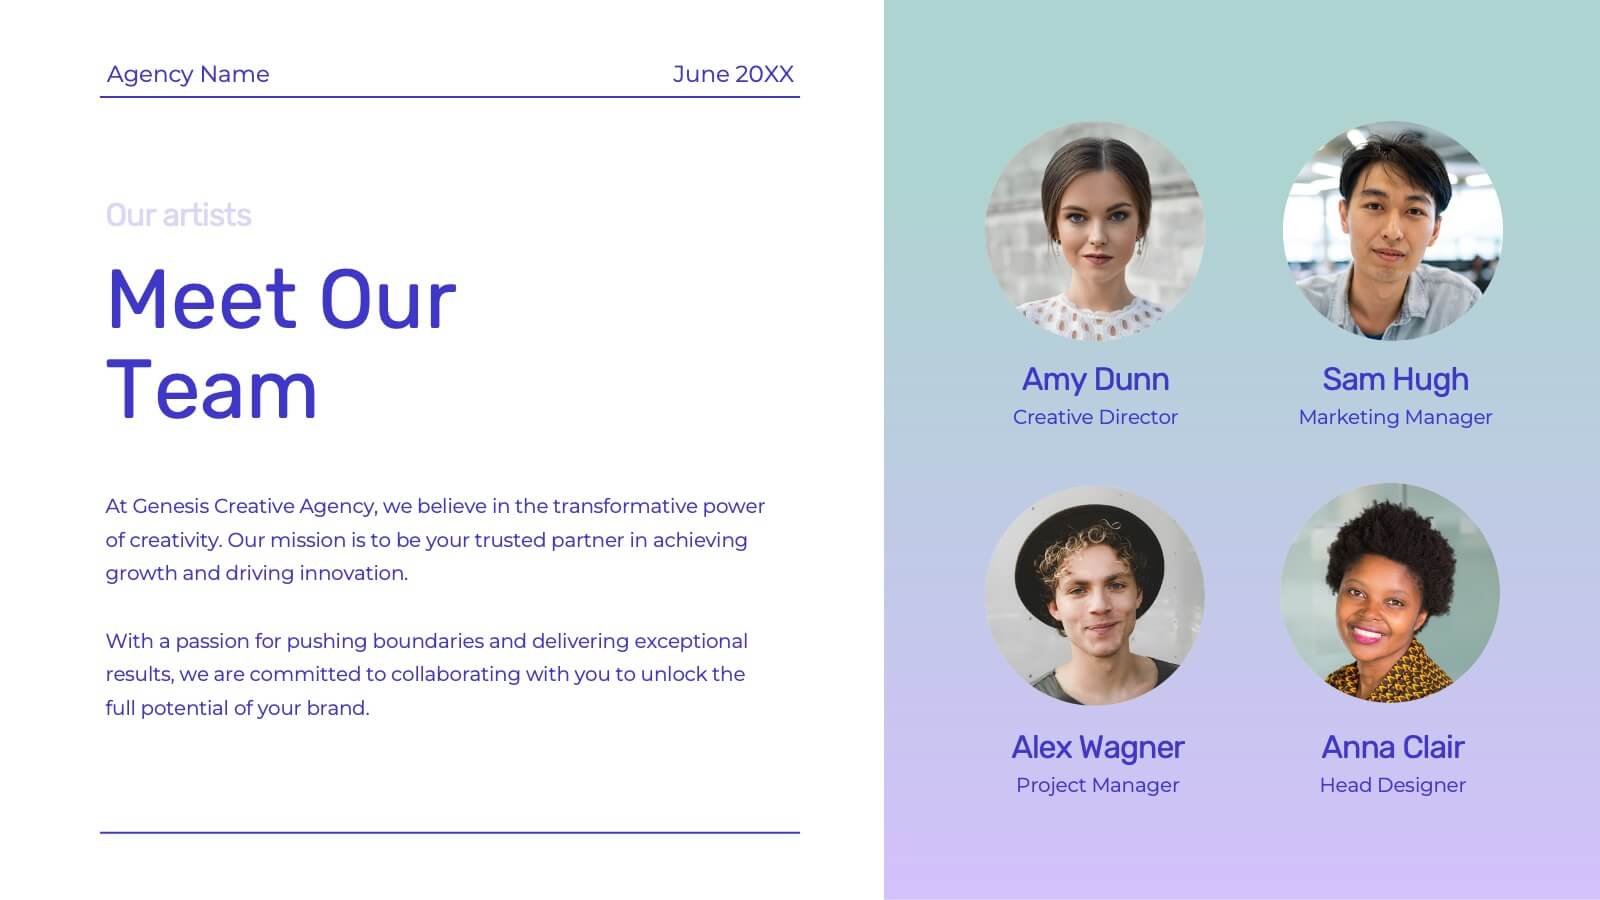
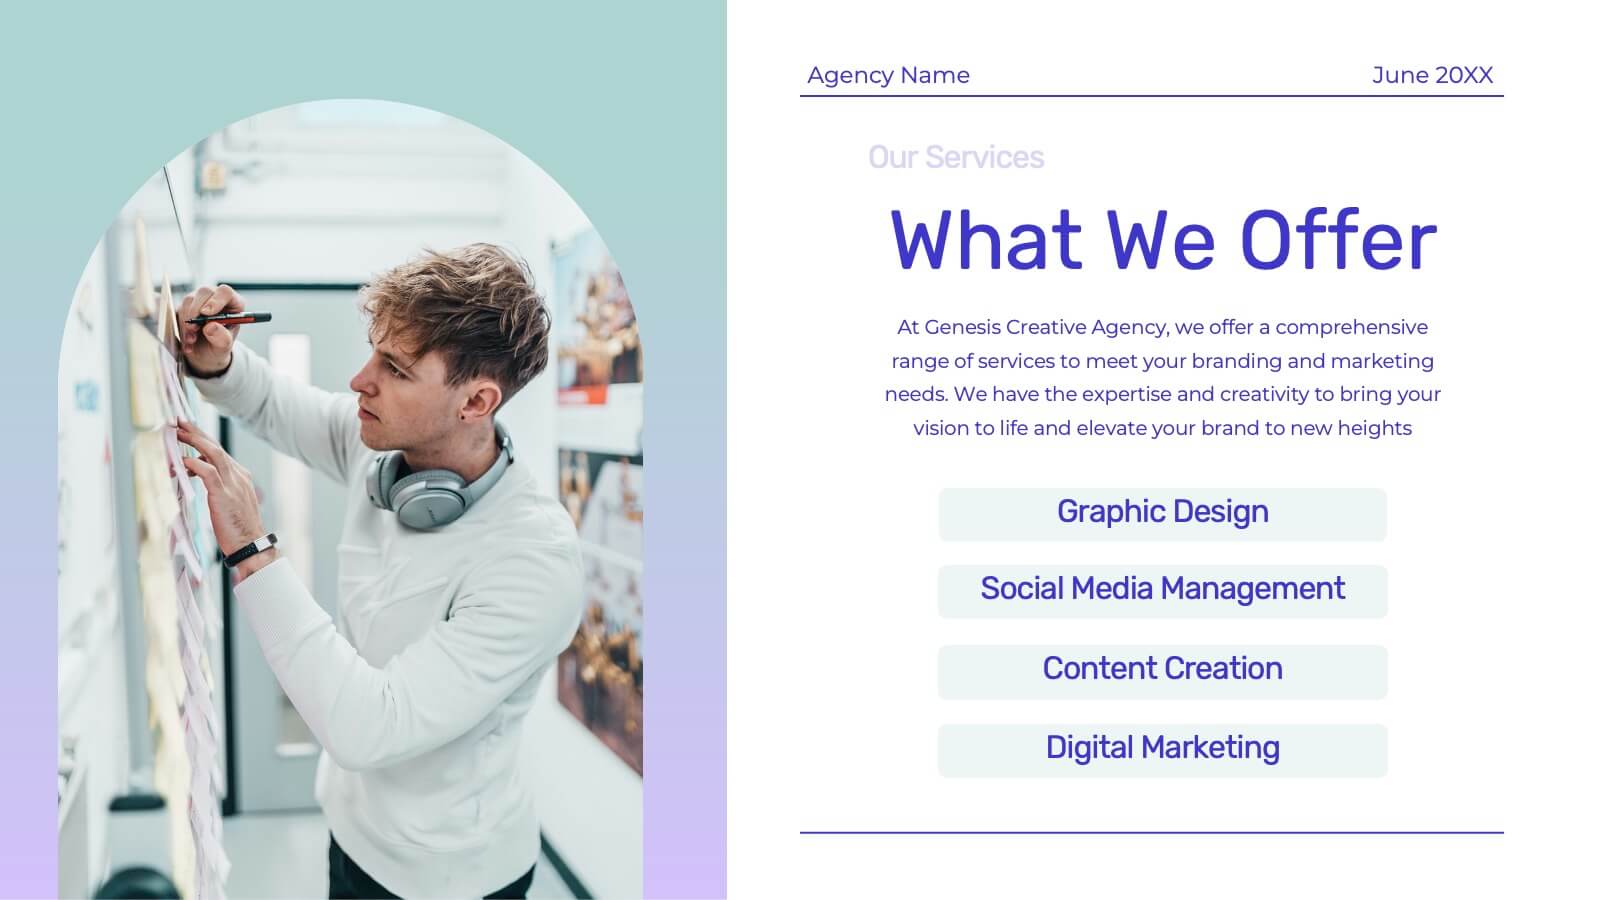
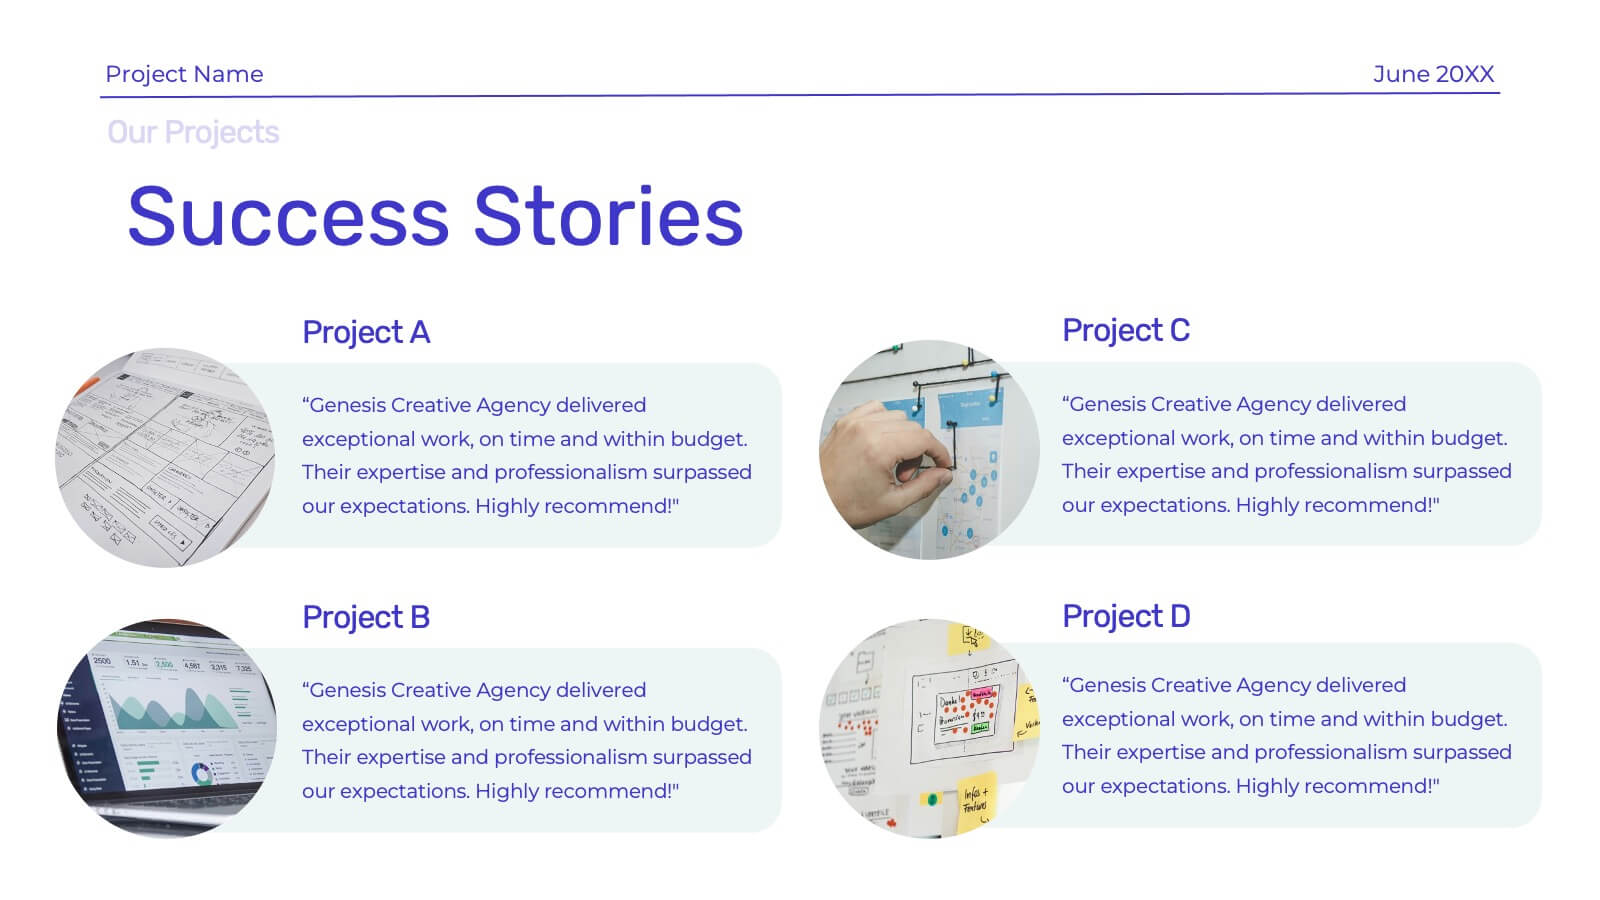
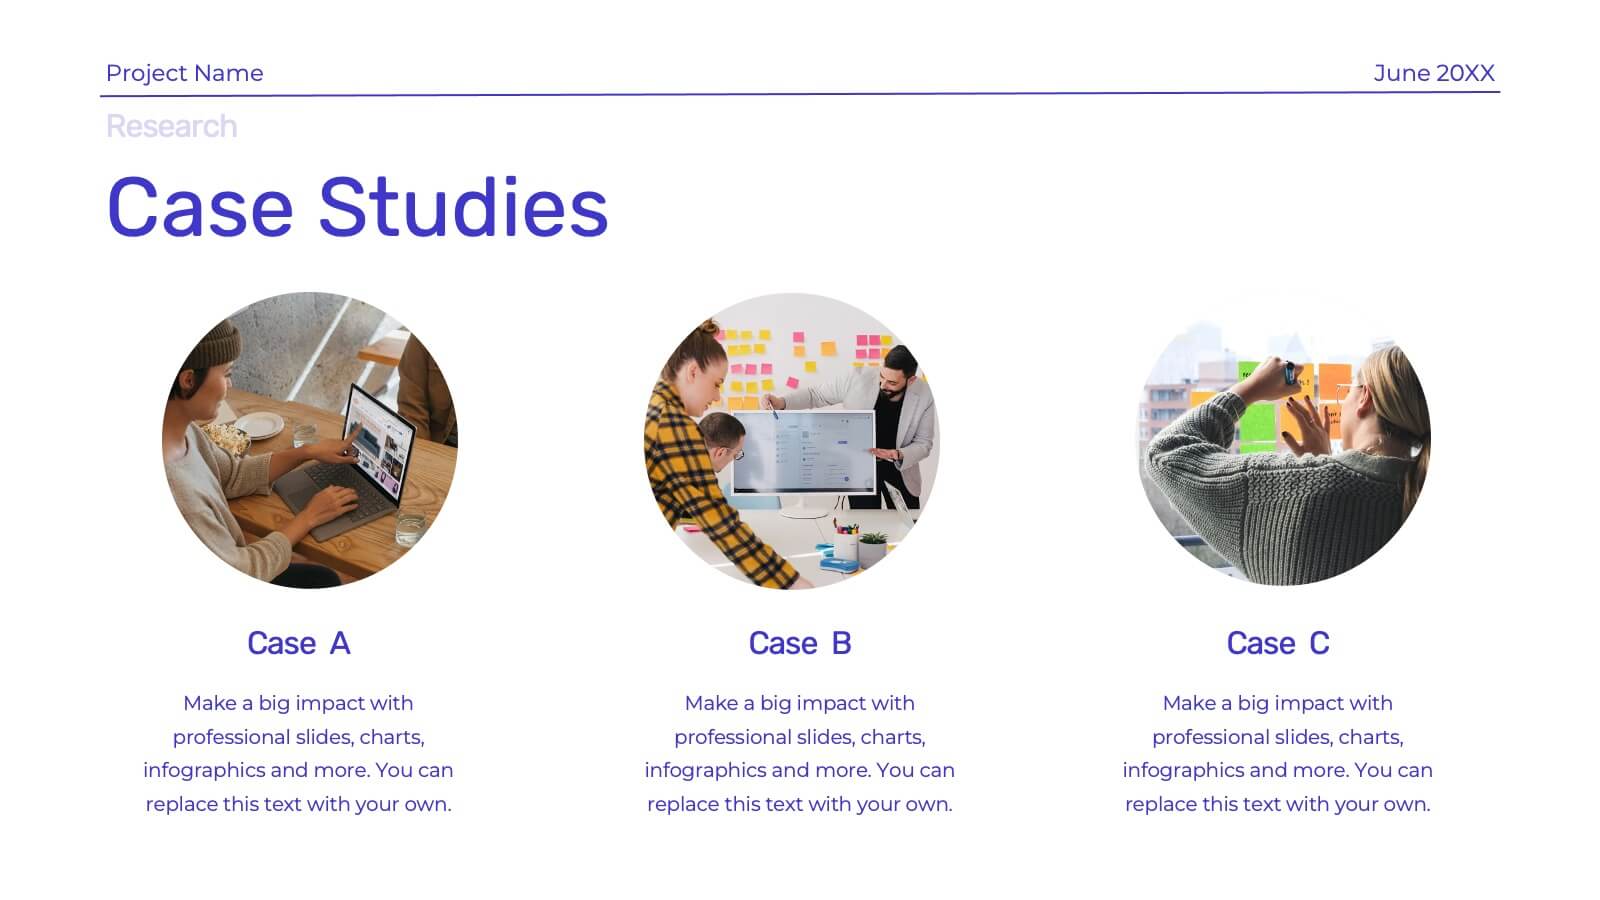
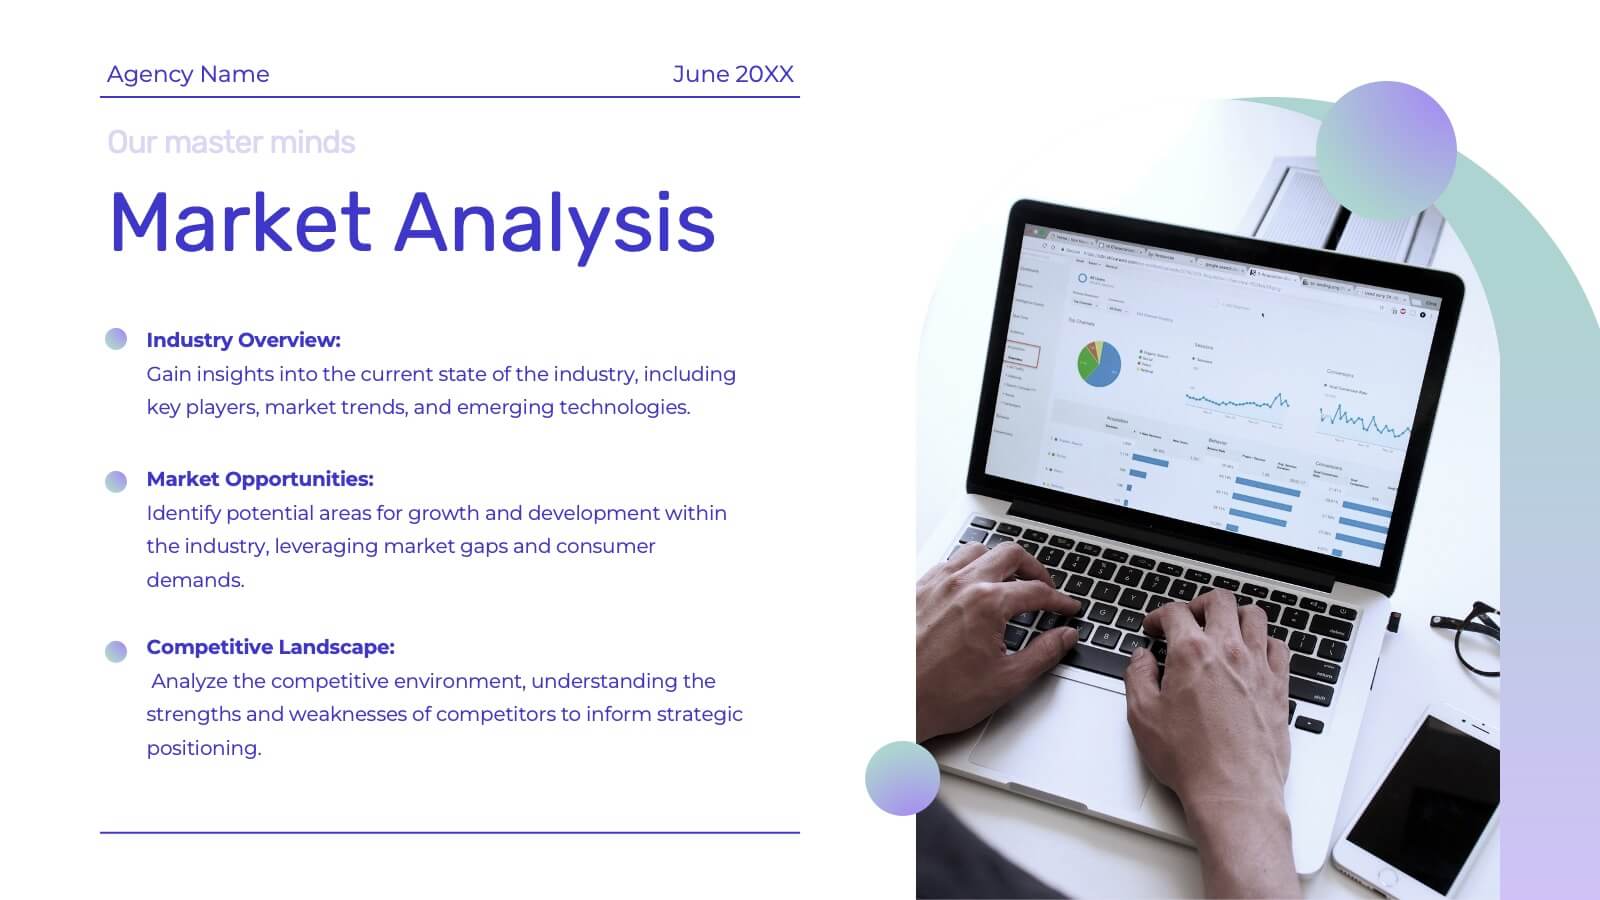
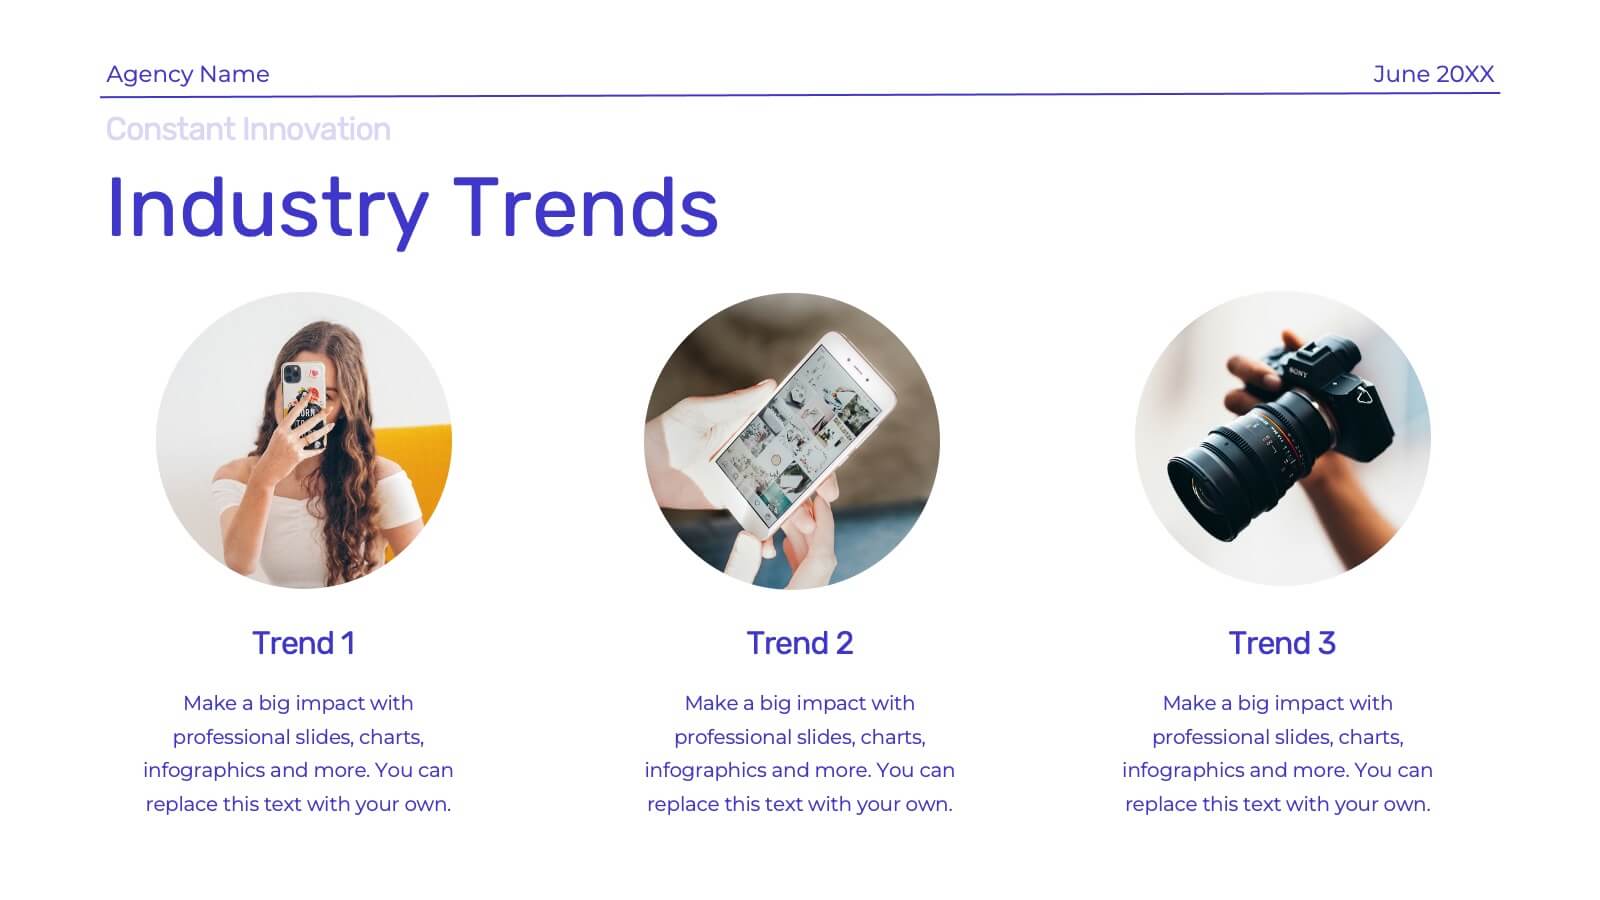
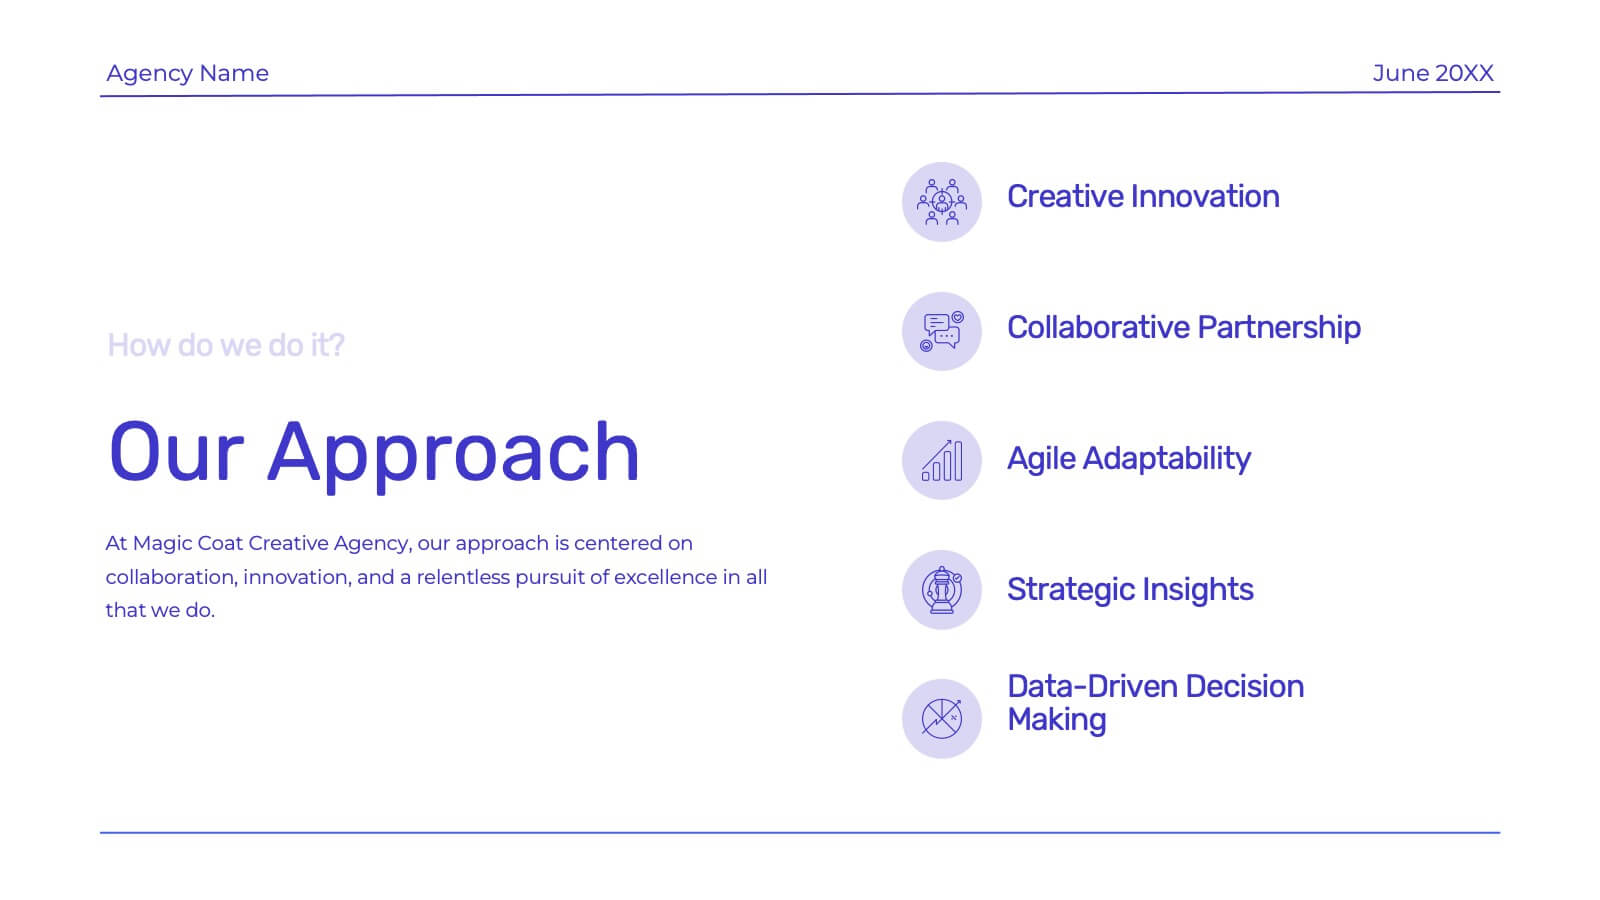
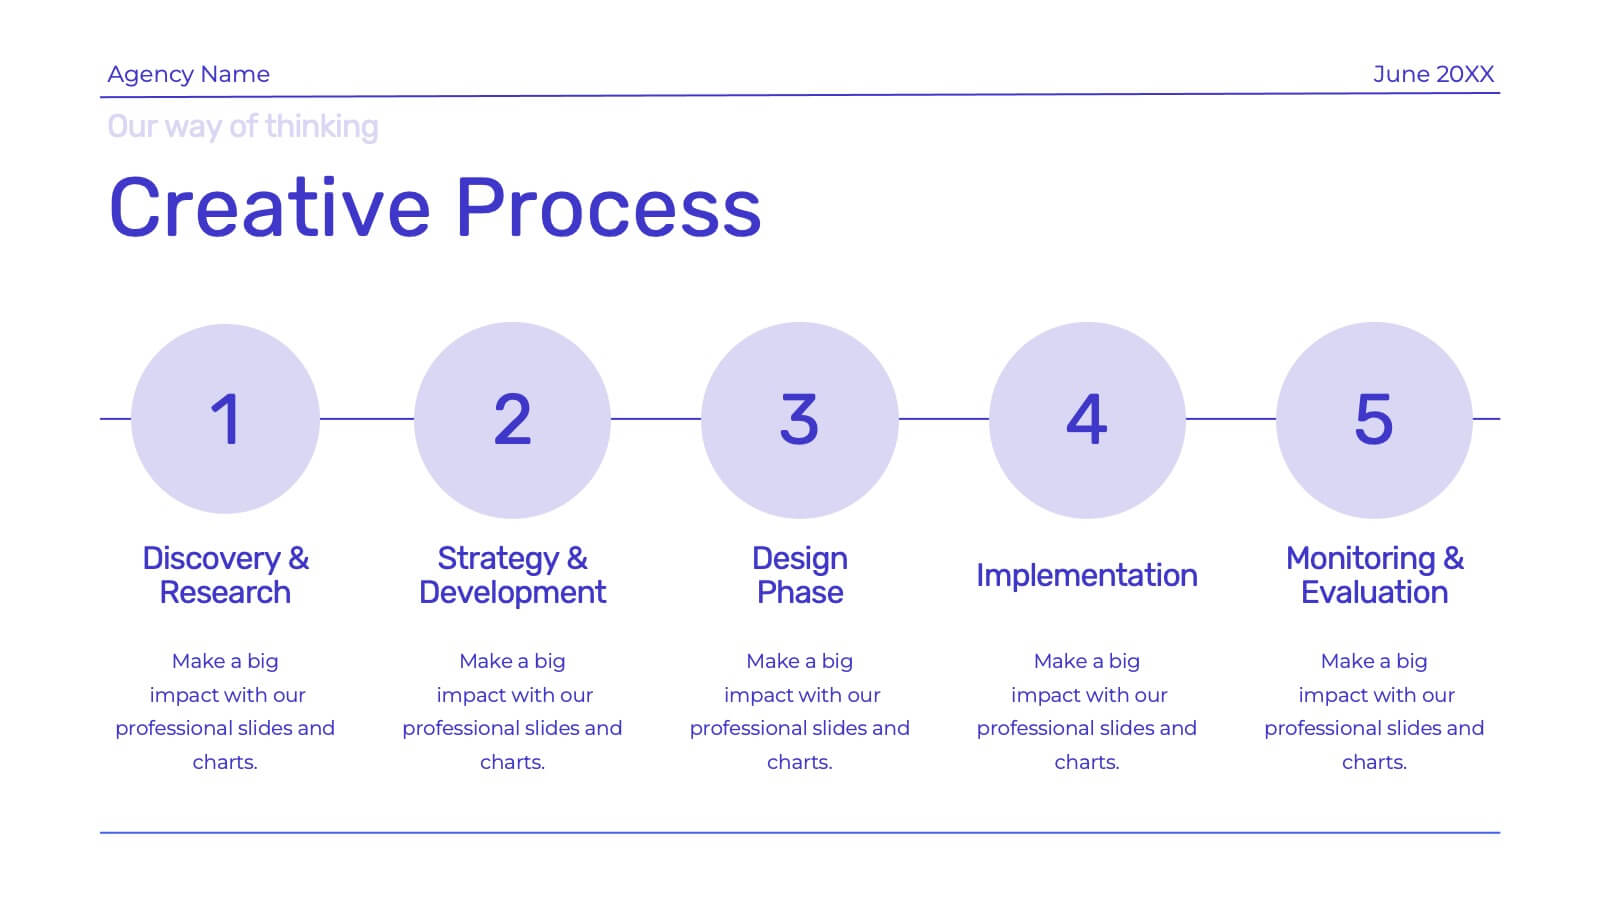
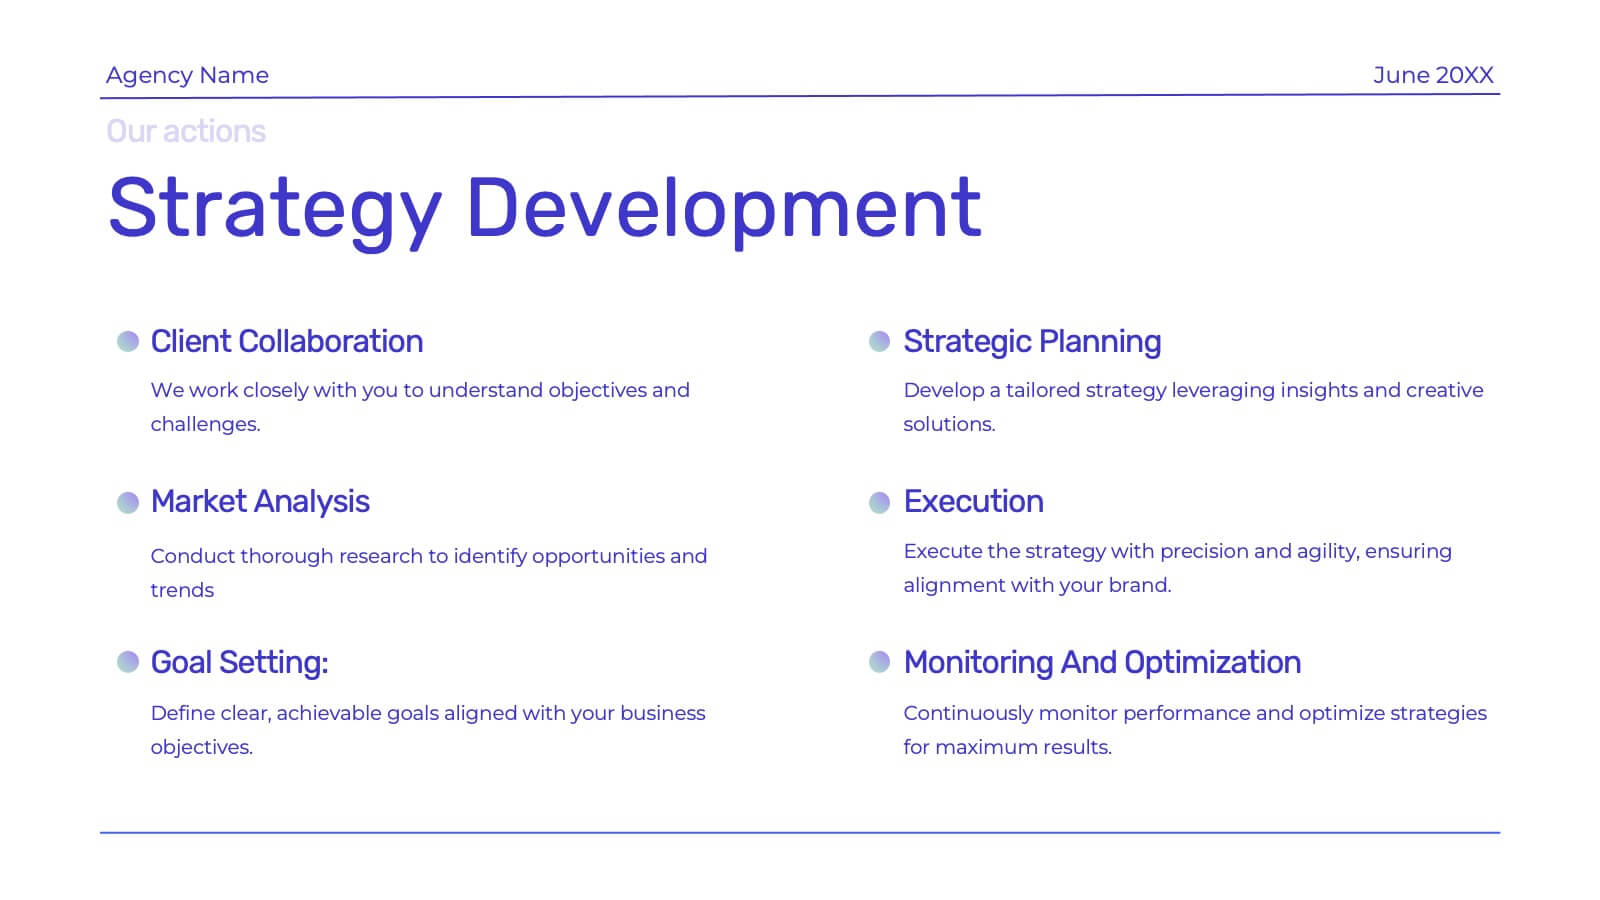
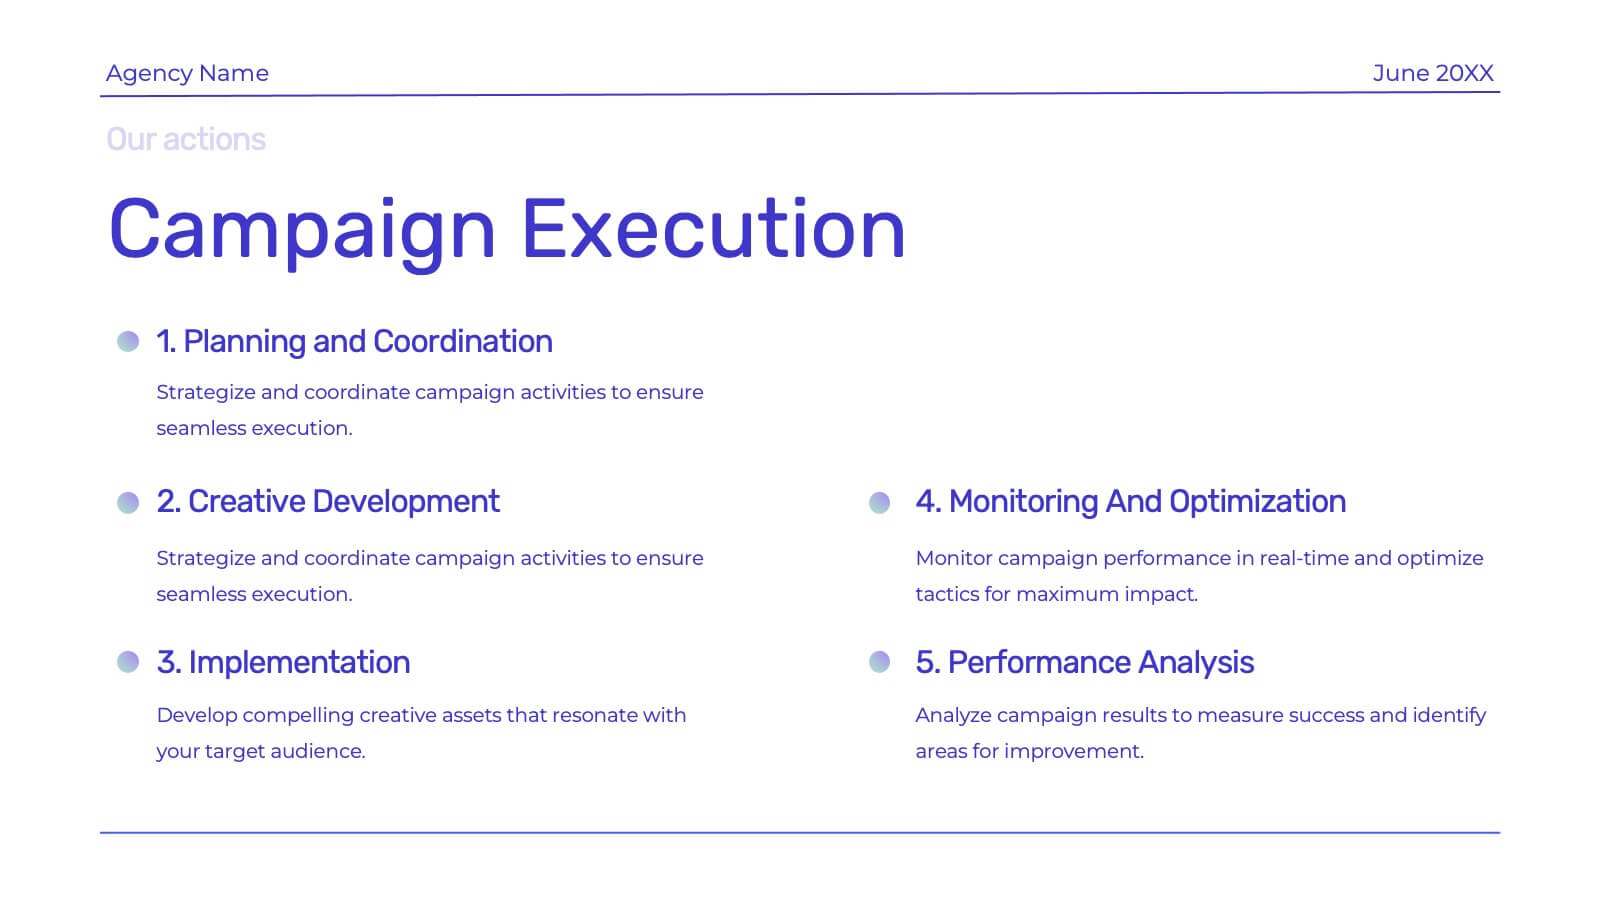
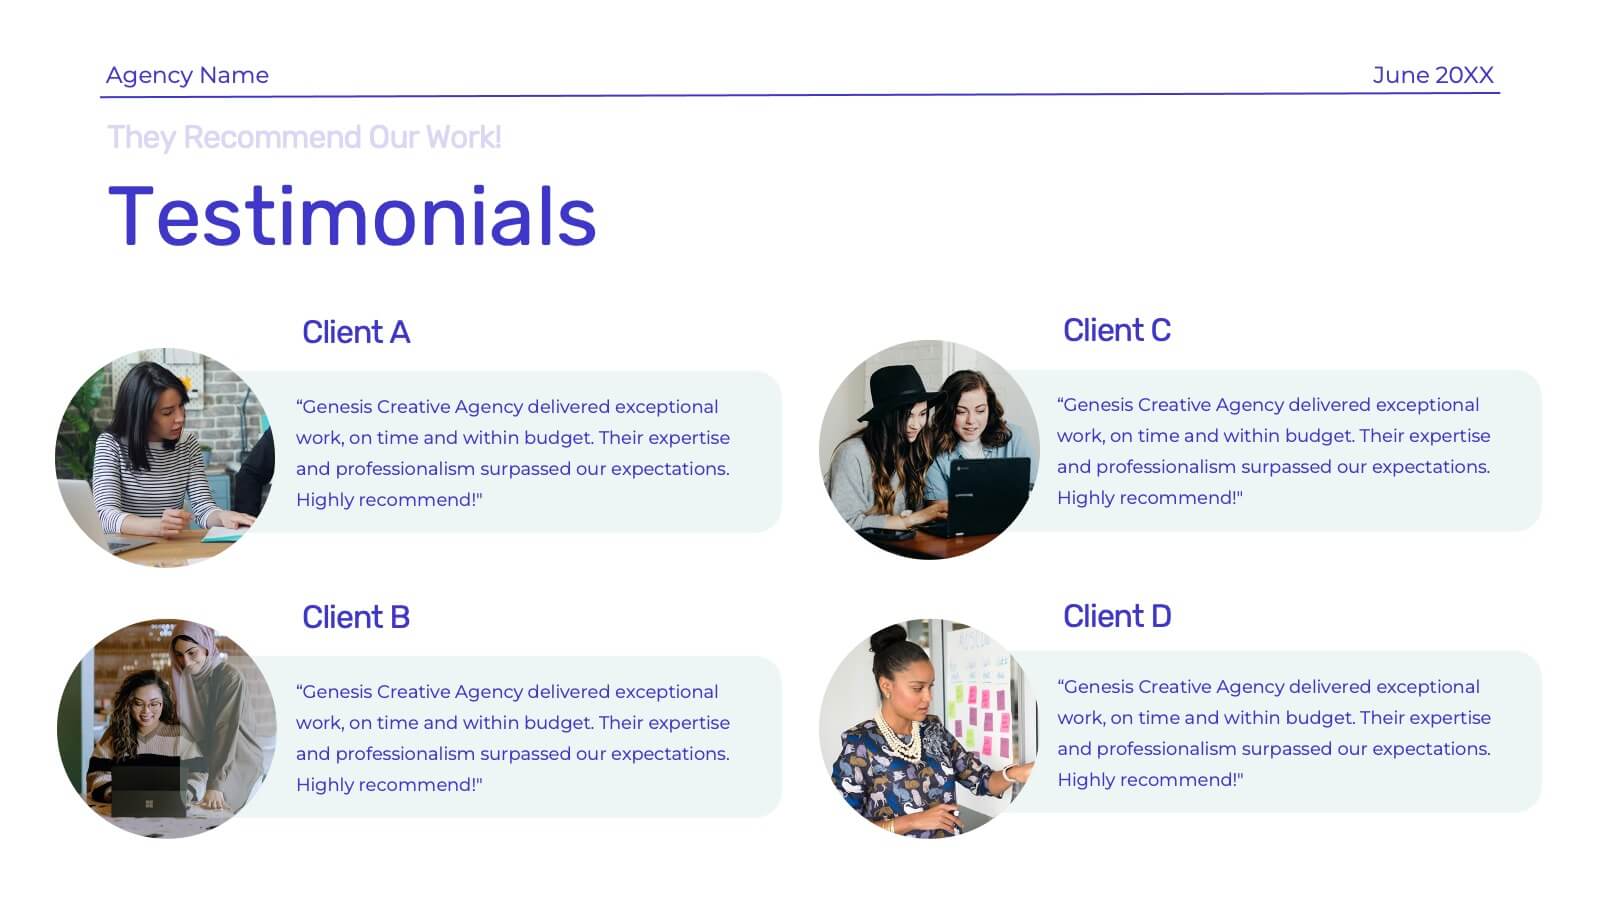
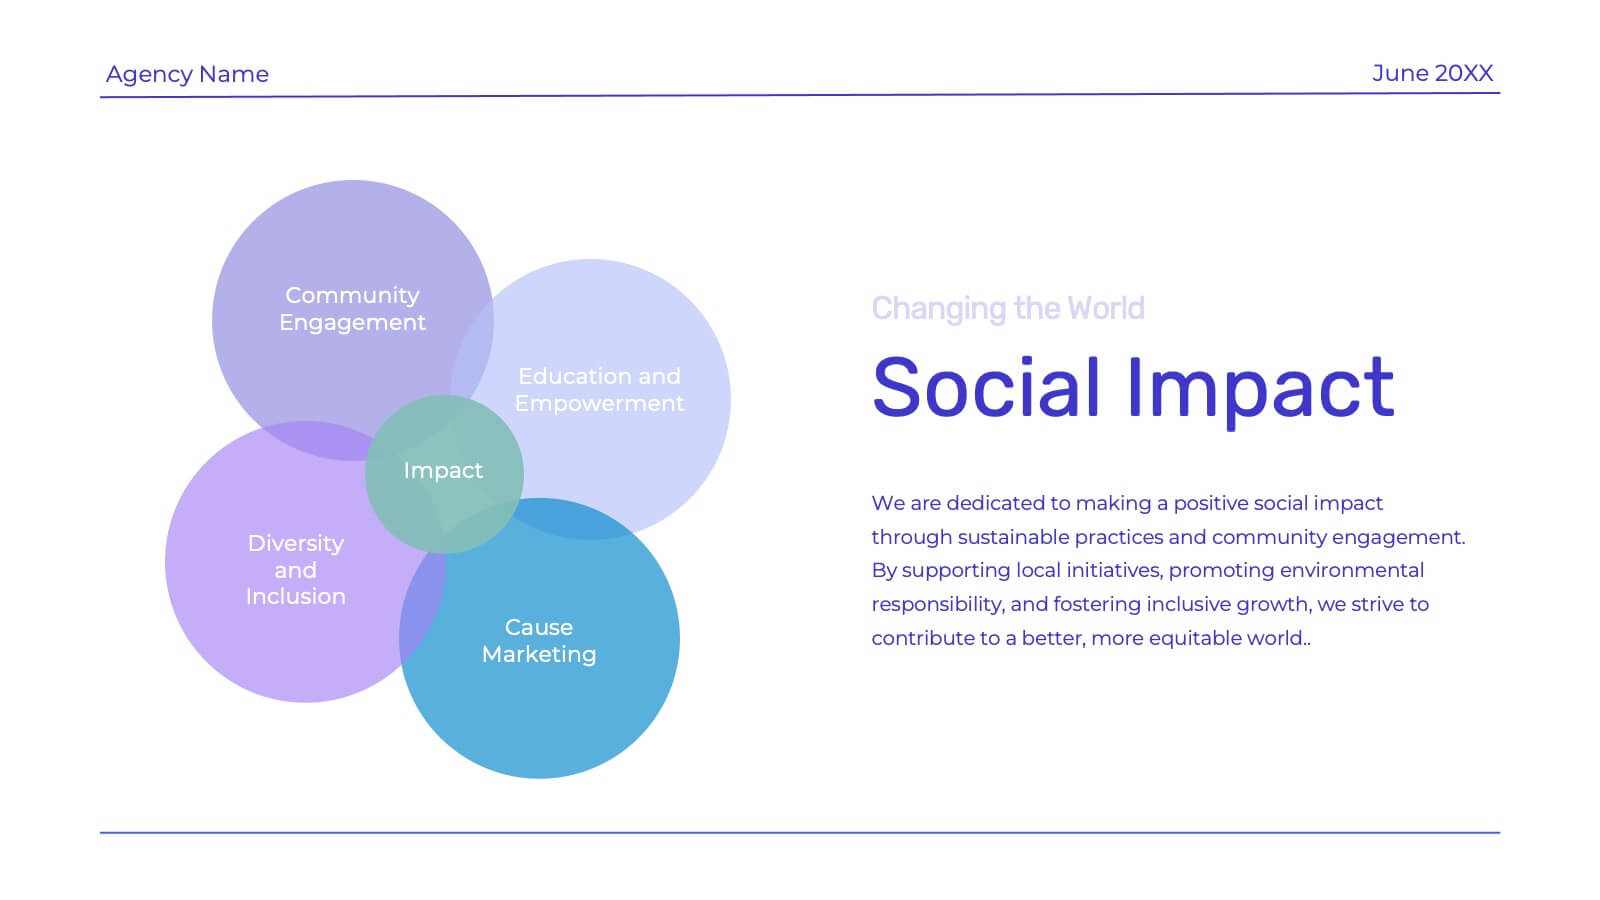
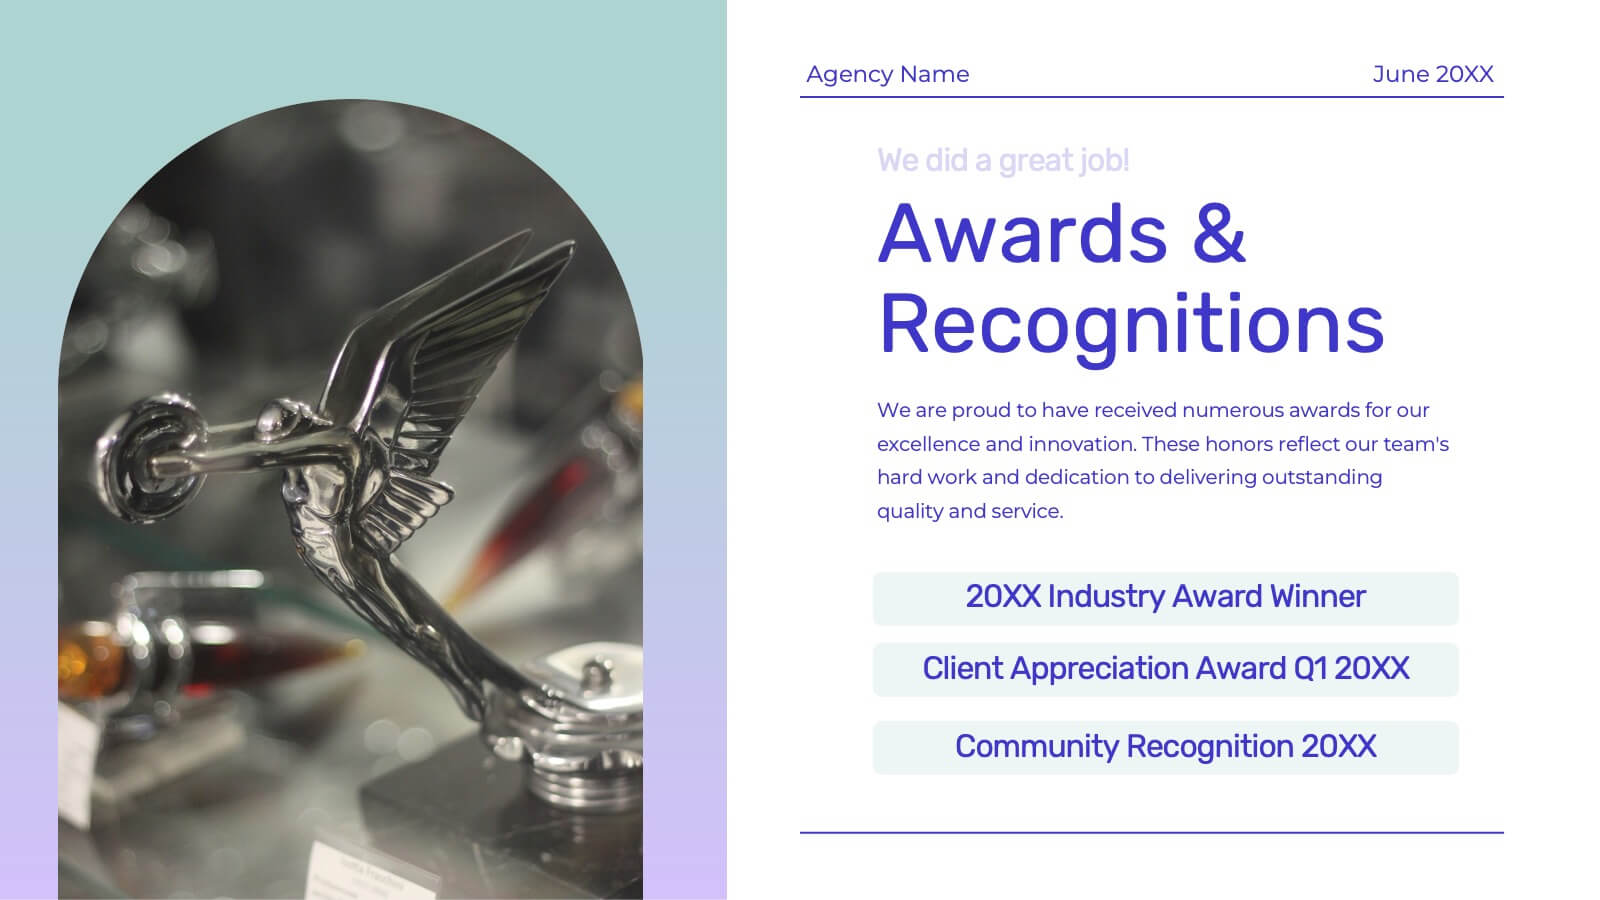
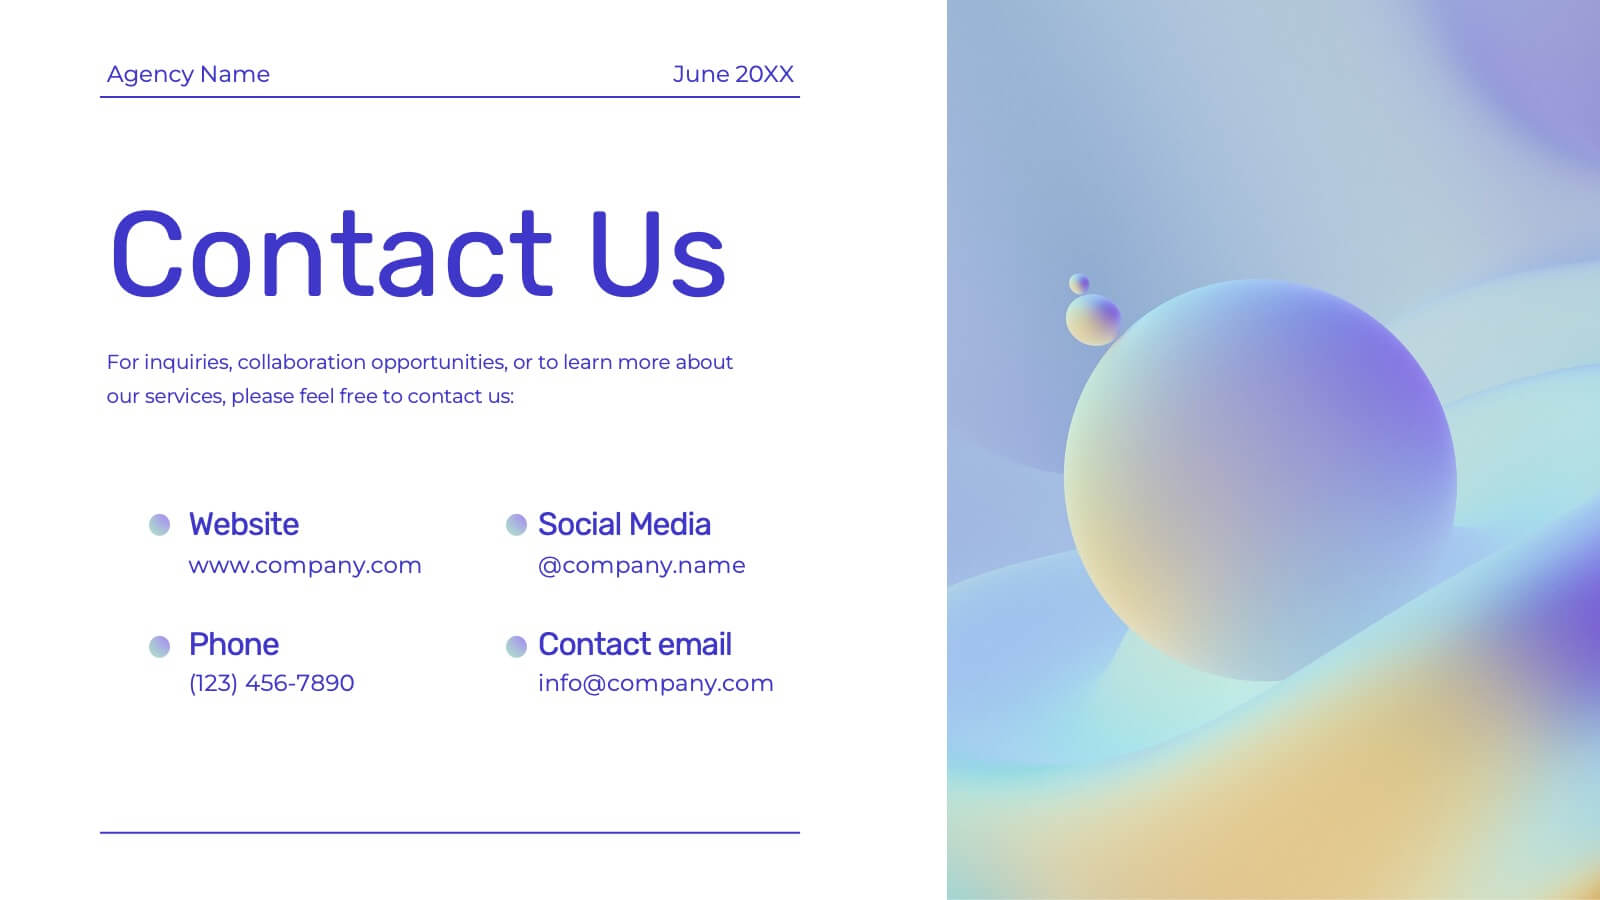
Genesis Creative Agency Pitch Deck Presentation
Showcase your creative agency’s strengths with this vibrant template. Highlight your team, services, success stories, and unique approach. Ideal for case studies, market analysis, and campaign execution. Fully compatible with PowerPoint, Keynote, and Google Slides.