


Características


¿Tienes alguna pregunta?
Recomendar


5 diapositivas
Strategic Business Case Presentation
Make every proposal stand out with a clear, goal-focused design that simplifies your strategic narrative. Ideal for presenting initiatives, project justifications, or decision-making insights, this layout balances visual clarity with professionalism. Fully compatible with PowerPoint, Keynote, and Google Slides for effortless editing and polished presentations.


4 diapositivas
E-Learning Module Structure Presentation
Turn your lesson flow into a visual journey your audience can actually follow. This presentation template maps out the structure of an e-learning module with step-by-step clarity—ideal for course creators, instructional designers, or trainers. Easily customize each stage. Fully editable in PowerPoint, Keynote, and Google Slides for flexible use.


21 diapositivas
Fahrenheit Scientific Research Presentation
Present your findings with clarity using this scientific research presentation template. Designed for researchers, it includes sections for objectives, methodology, data analysis, results, and recommendations. Perfect for academic and professional use, this template ensures a polished, organized presentation and is fully compatible with PowerPoint, Keynote, and Google Slides.


5 diapositivas
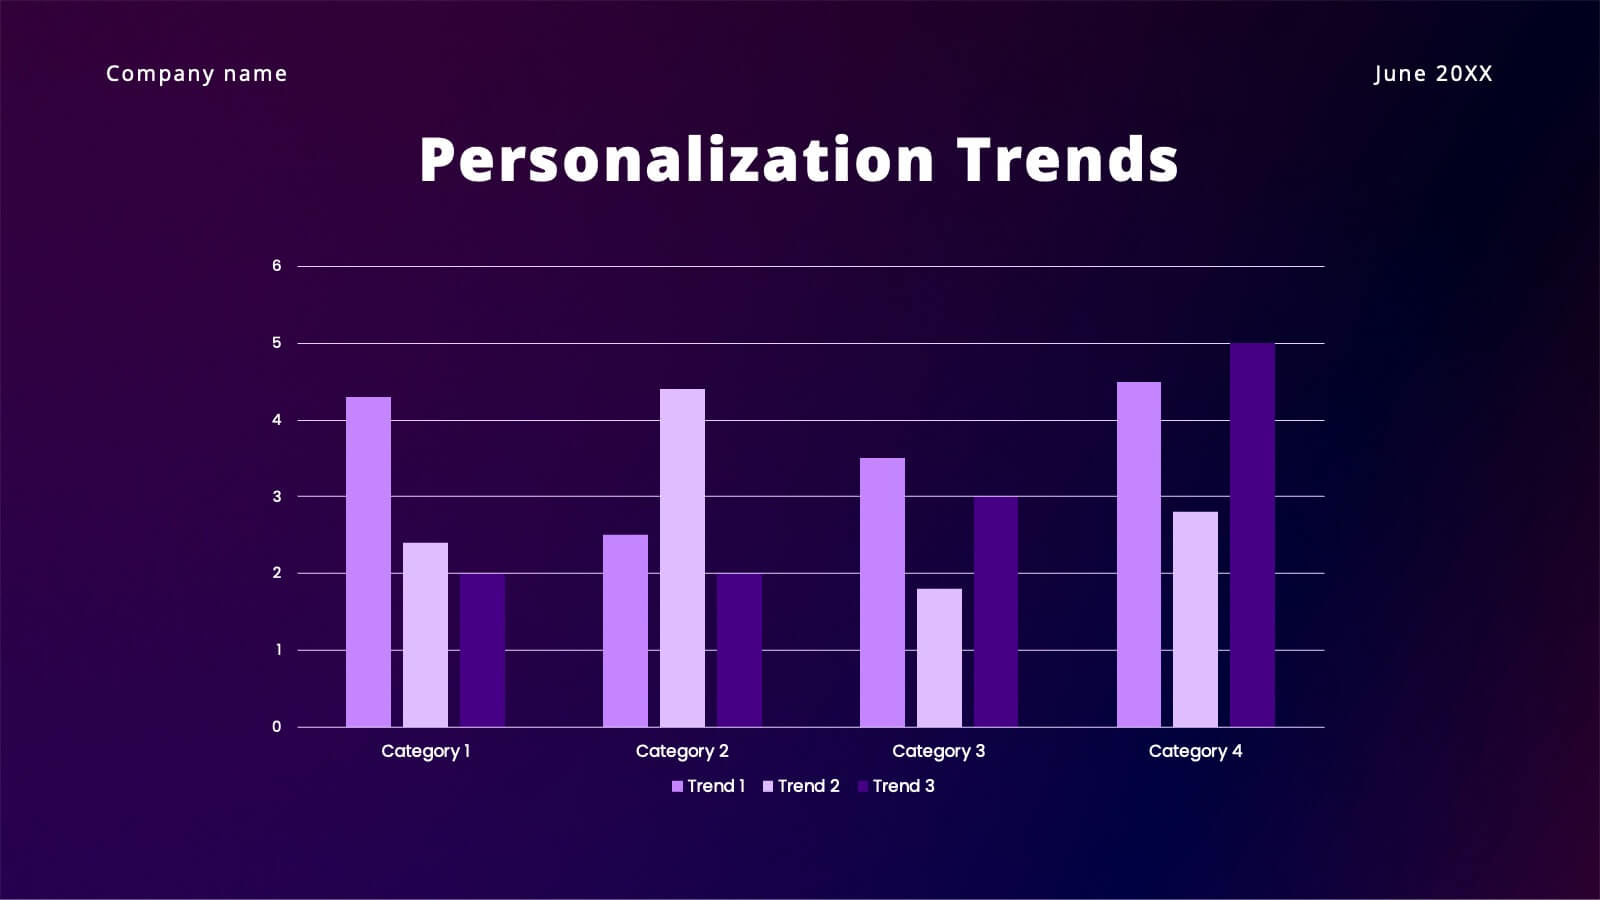
Brainstorming Spider Chart Presentation
Turn your ideas into action with a clean, modern design that keeps every thought connected and easy to follow. This presentation helps teams brainstorm, organize concepts, and refine strategies with clarity and flow. Fully editable and compatible with PowerPoint, Keynote, and Google Slides for seamless collaboration.


6 diapositivas
Market Growth Strategy with Asia Map Presentation
Visualize strategic growth across Asian markets with this map-based presentation. Highlight regions by opportunity level, compare metrics with vertical bar charts, and display yearly projections. Ideal for business development, expansion plans, or market analysis. Fully editable in PowerPoint, Keynote, and Google Slides for tailored, data-driven presentations.


23 diapositivas
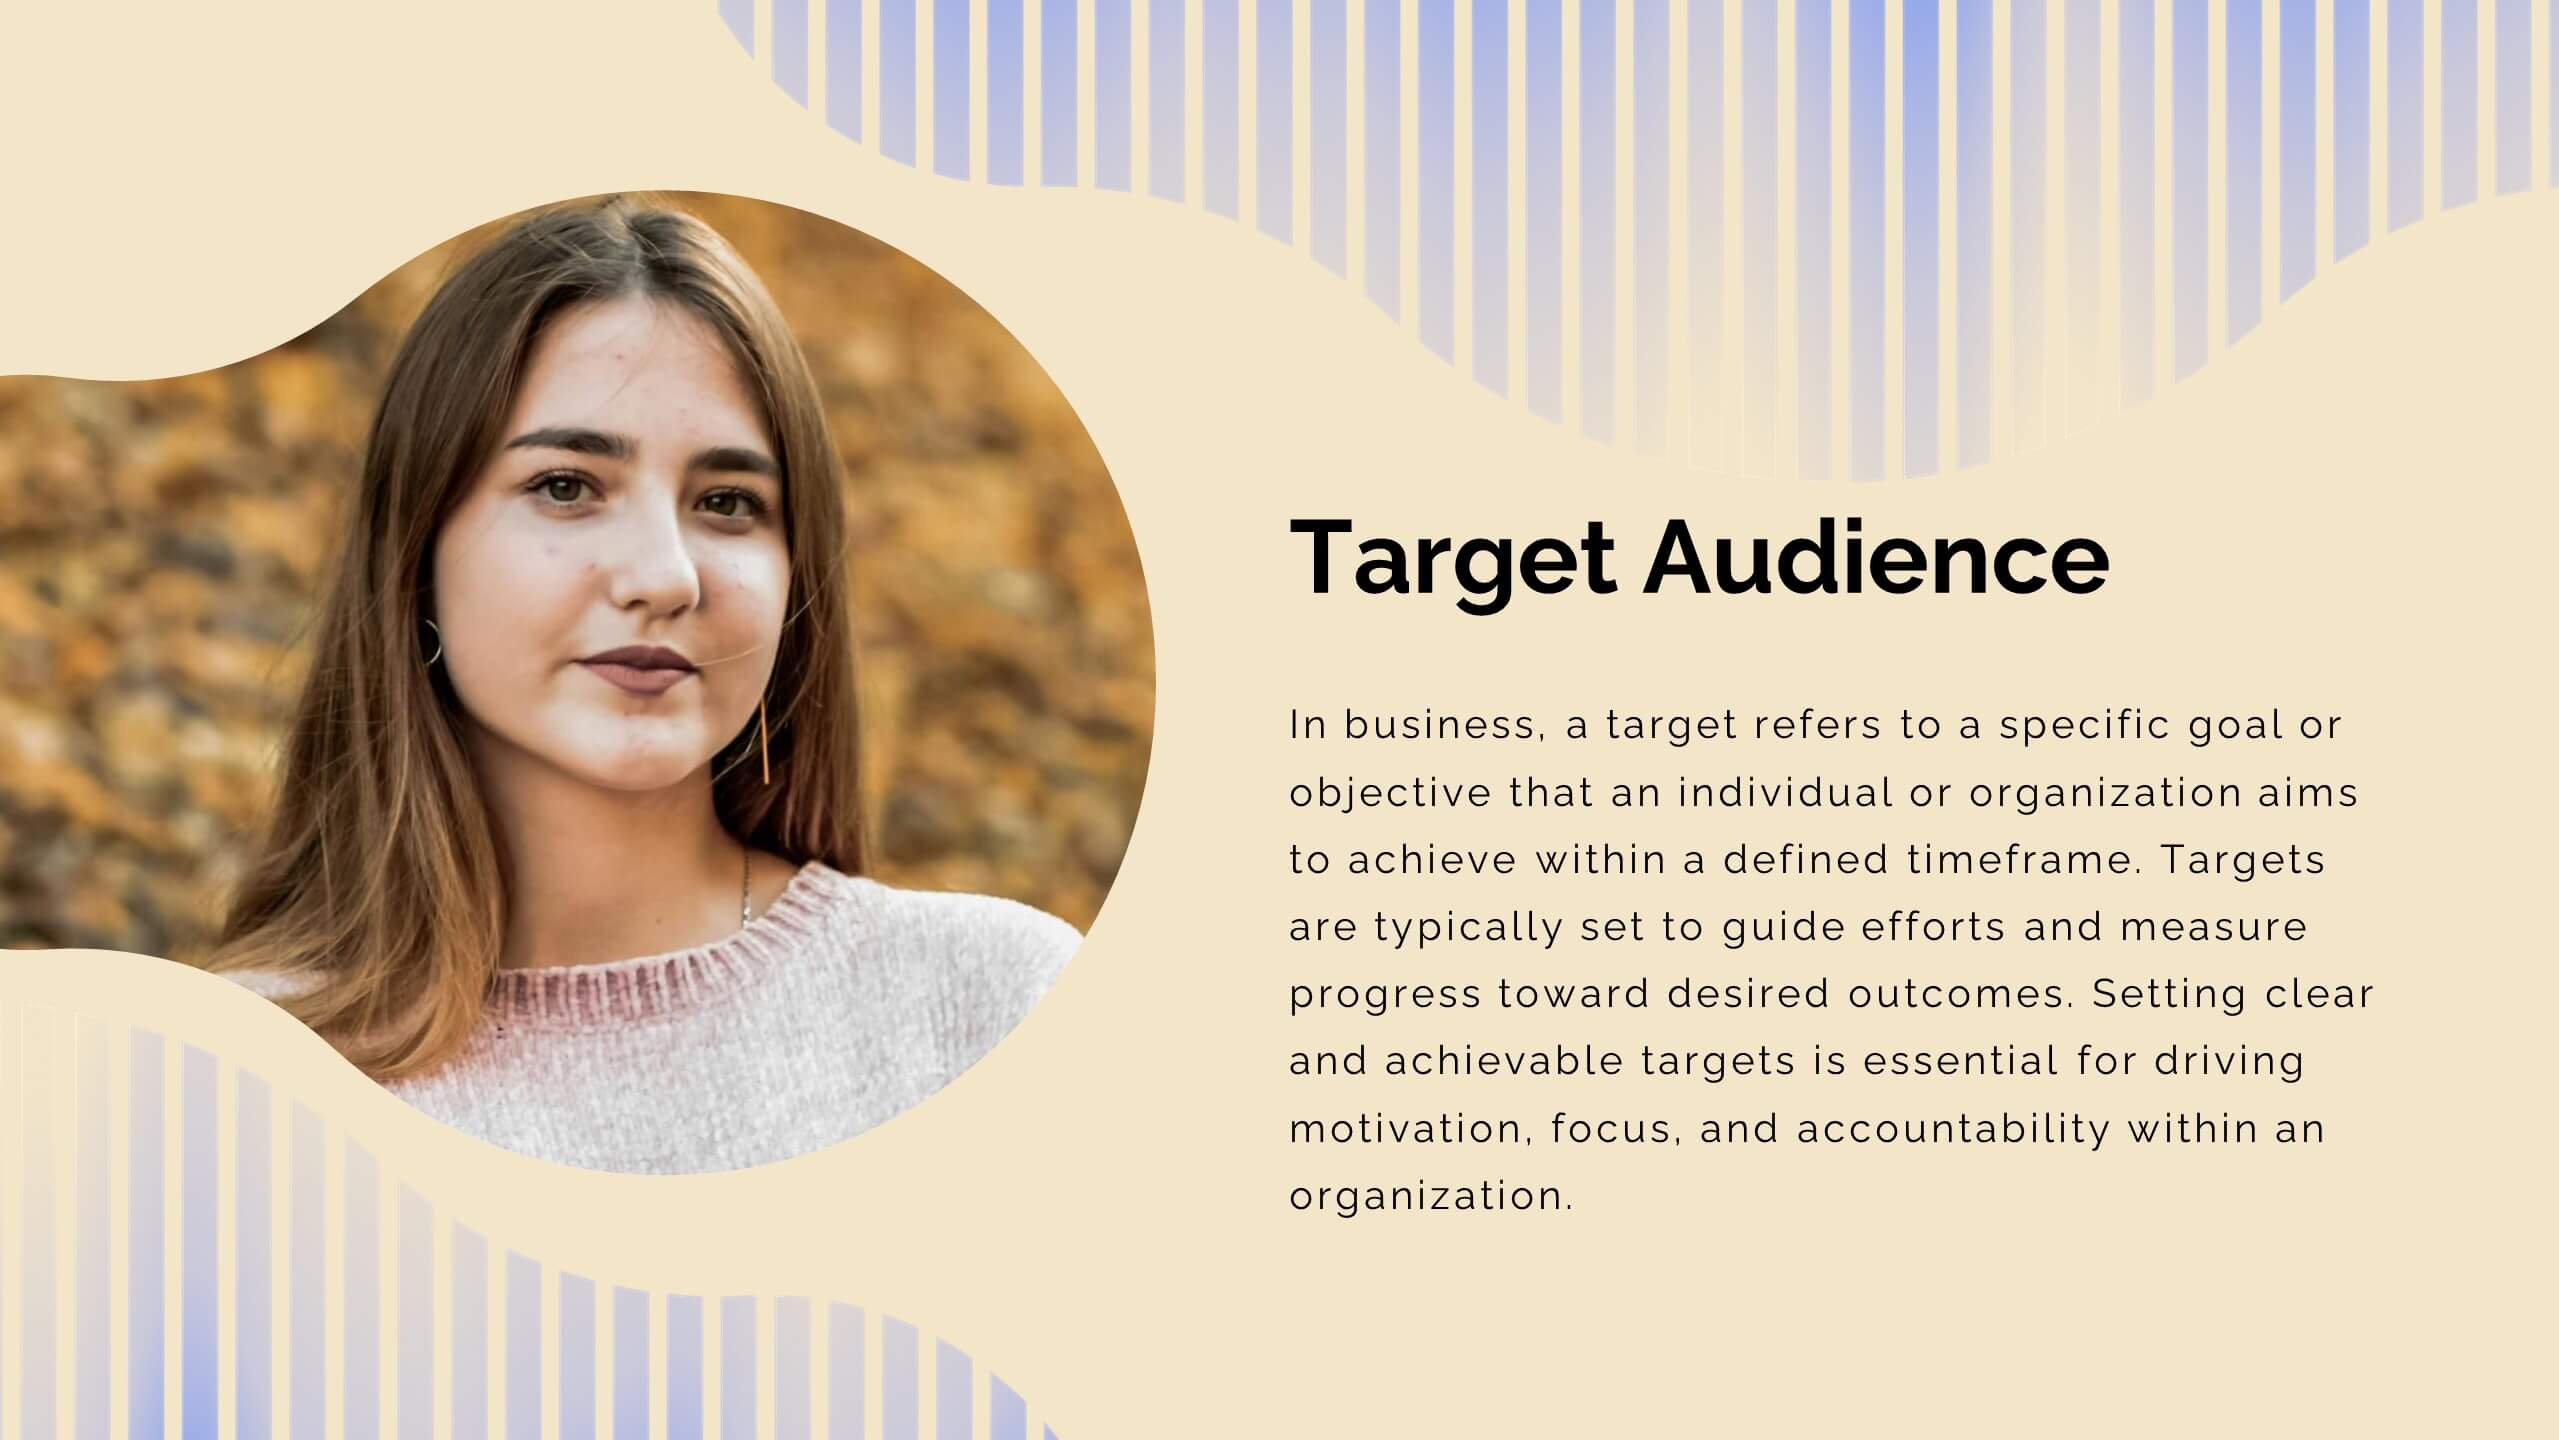
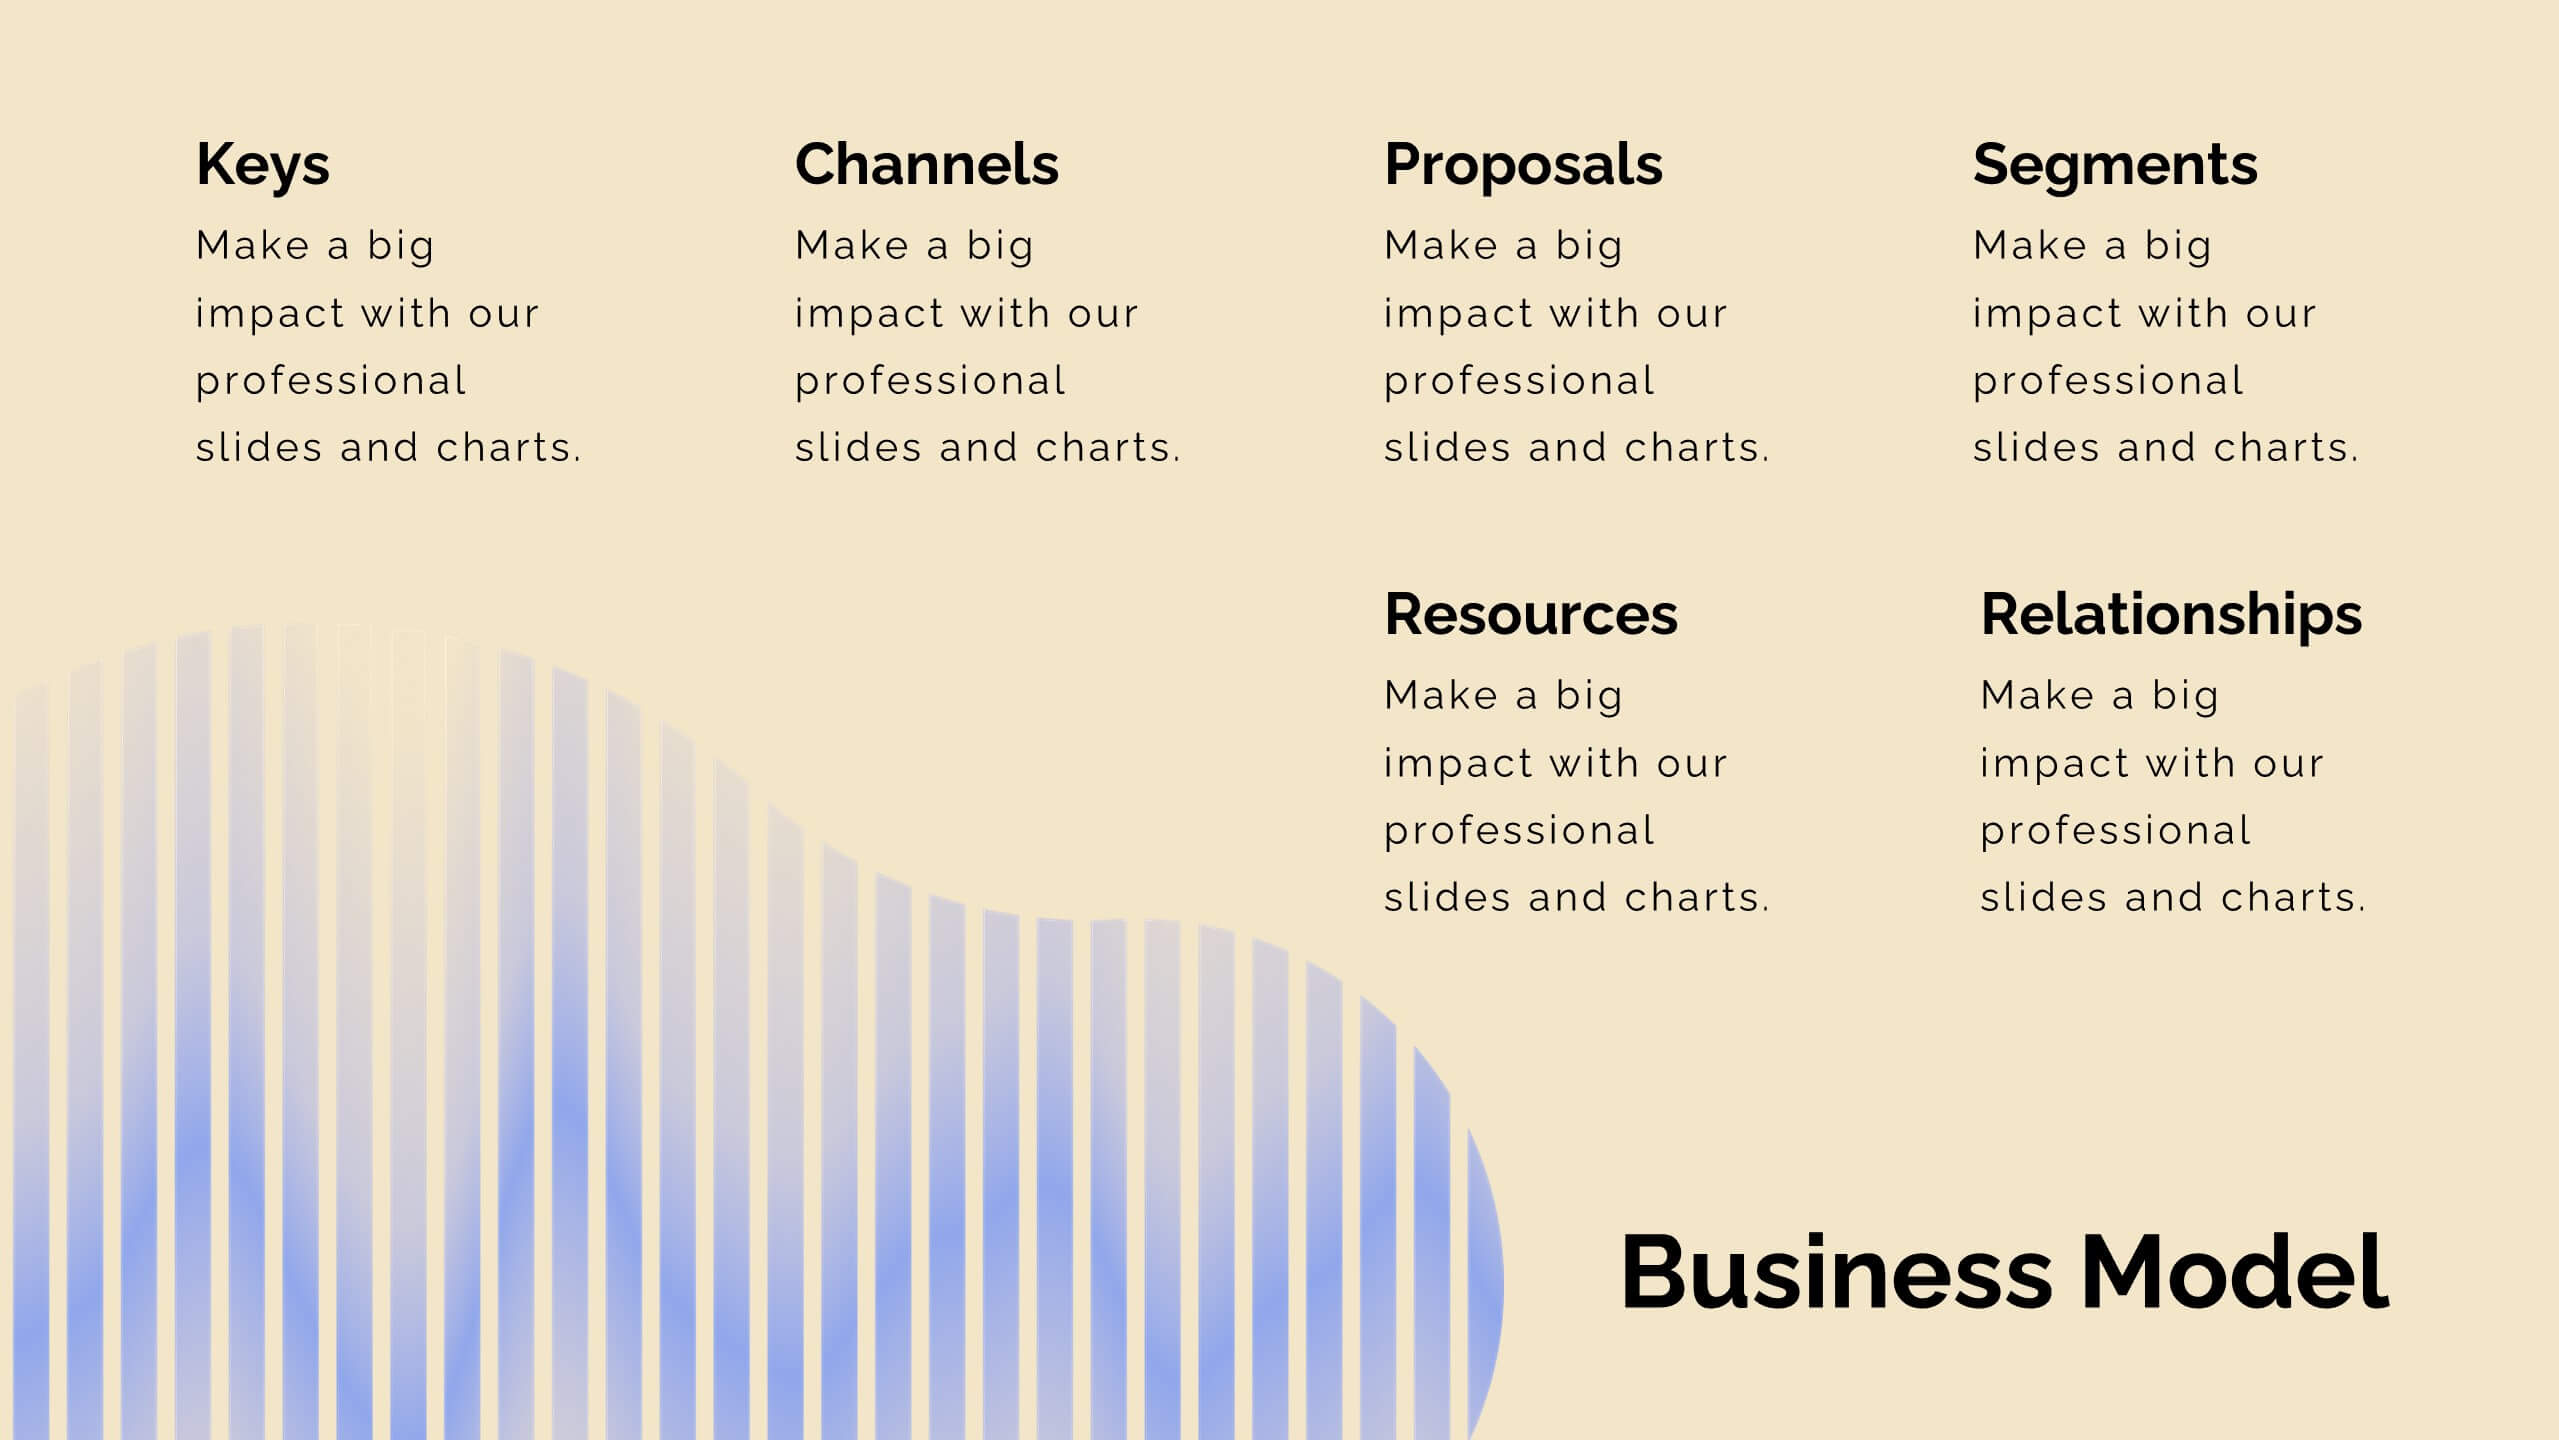
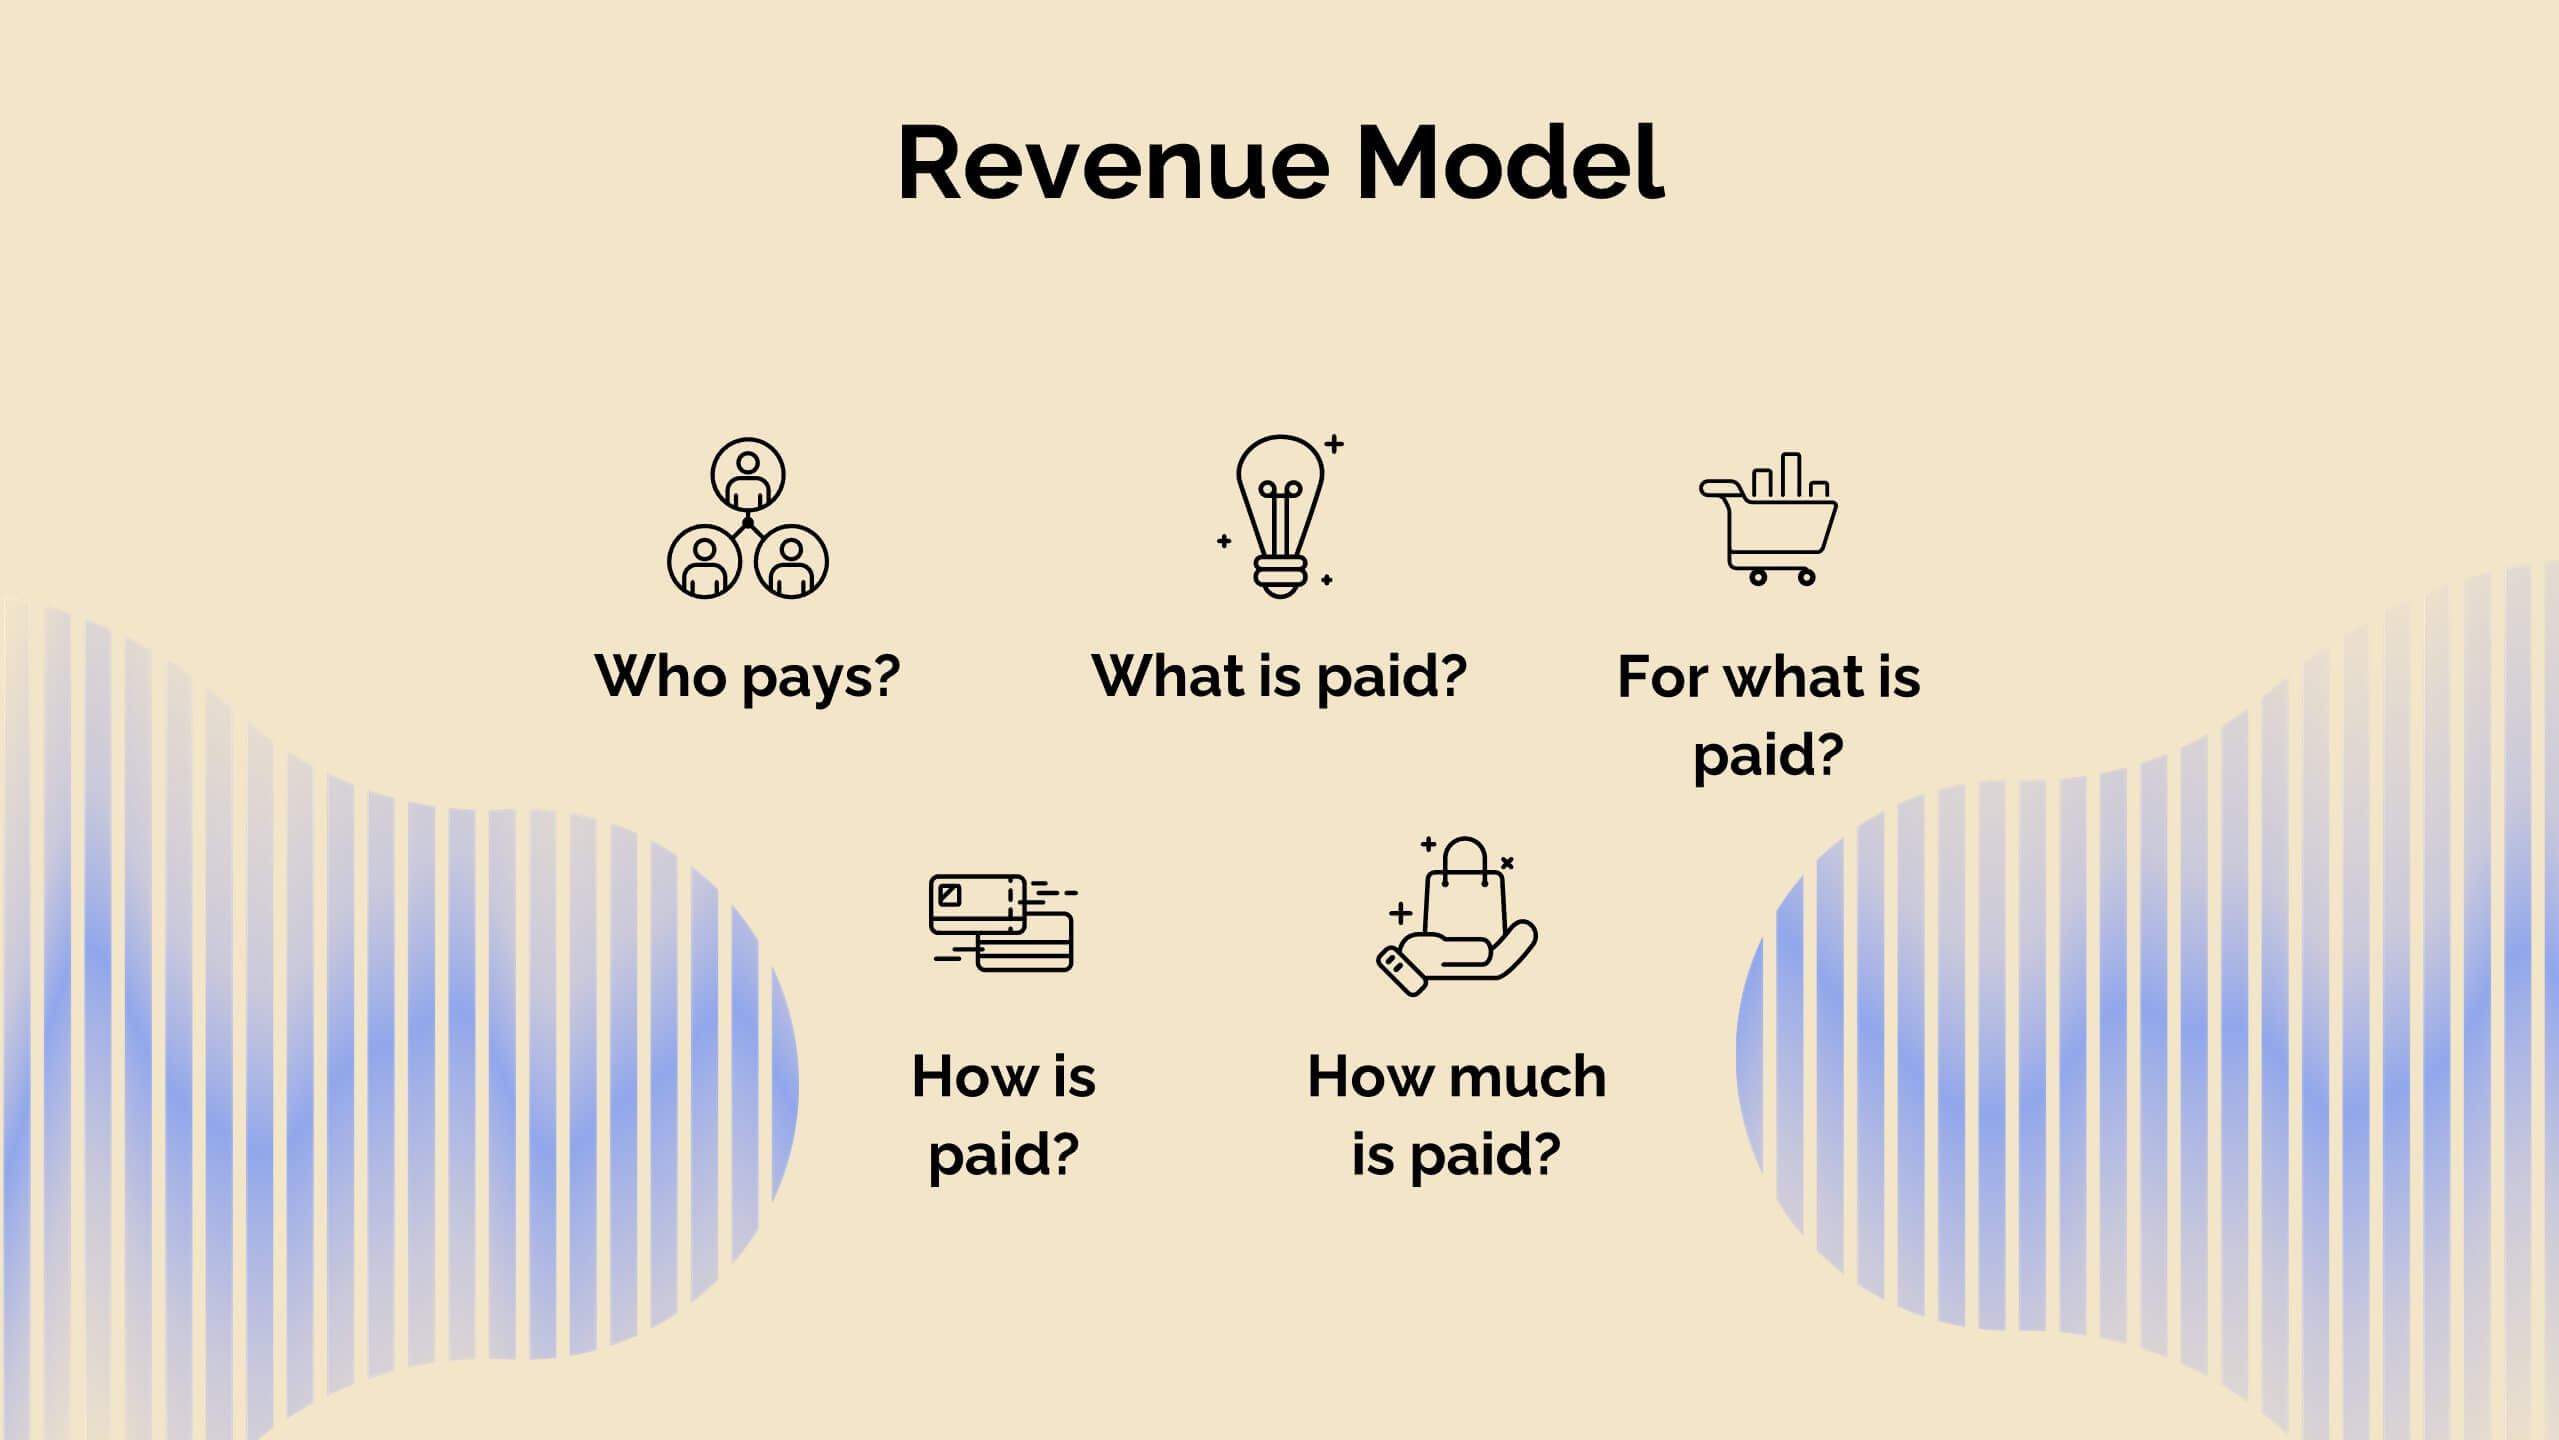
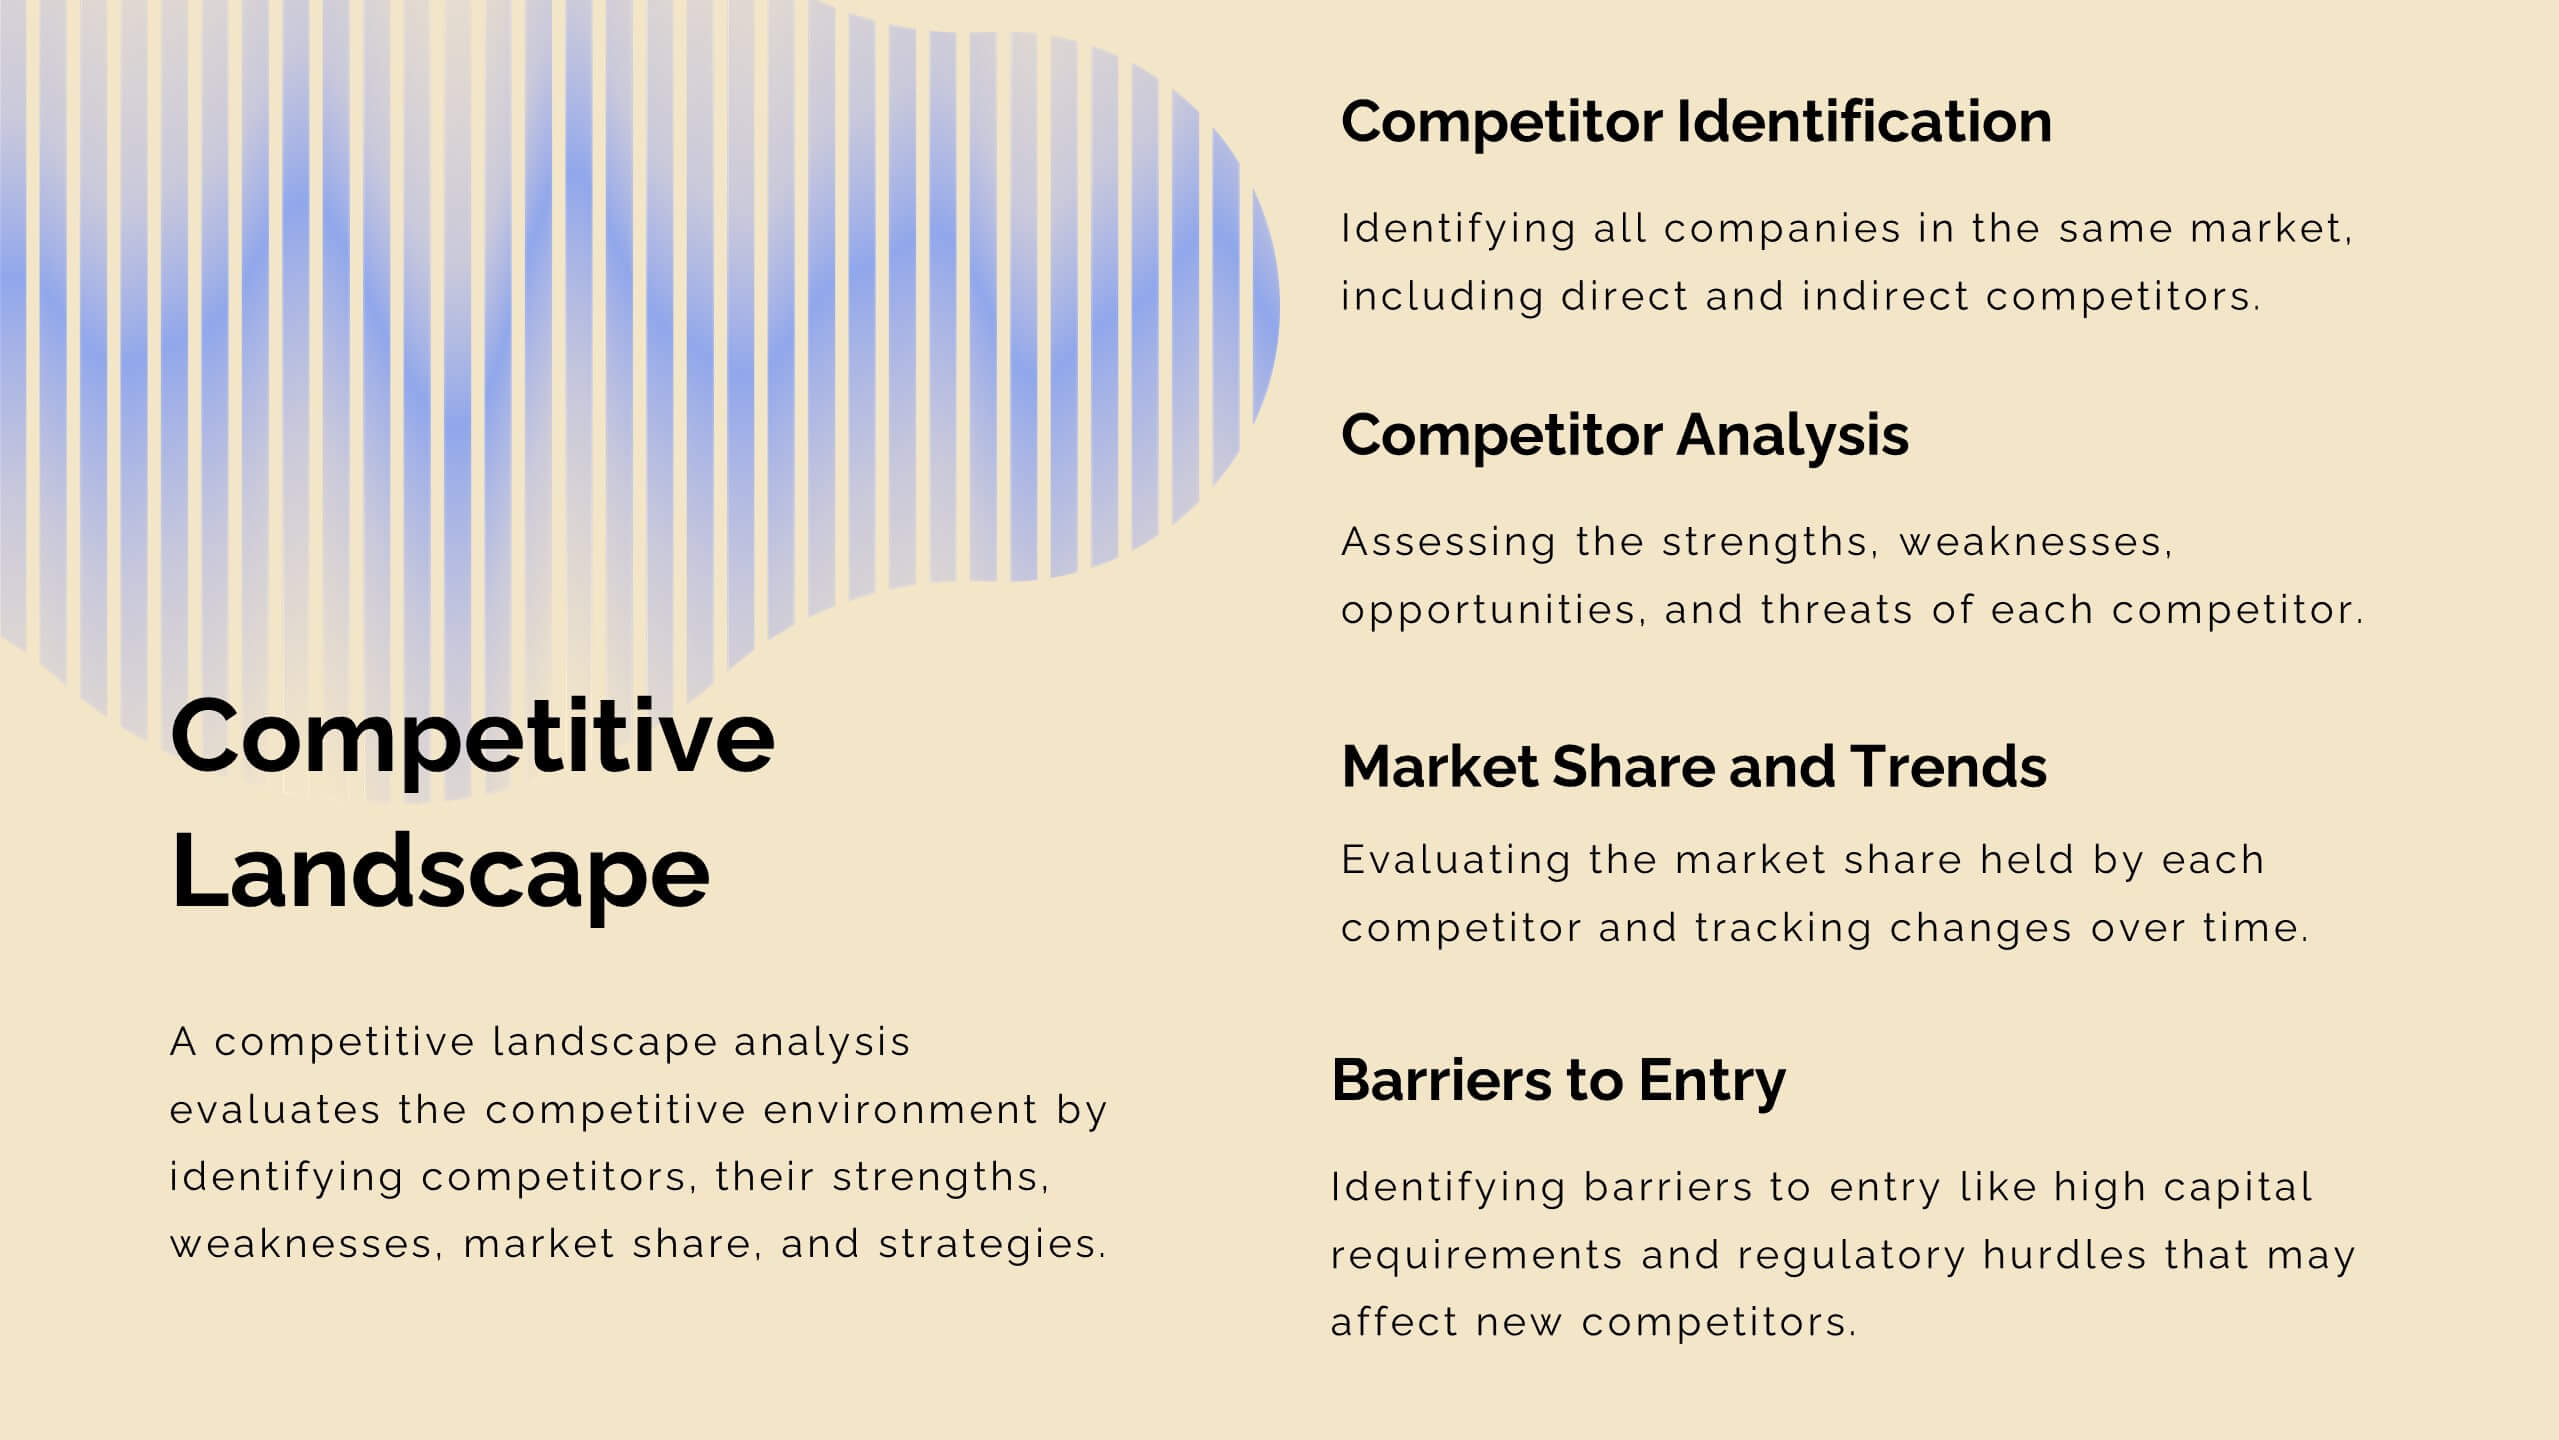
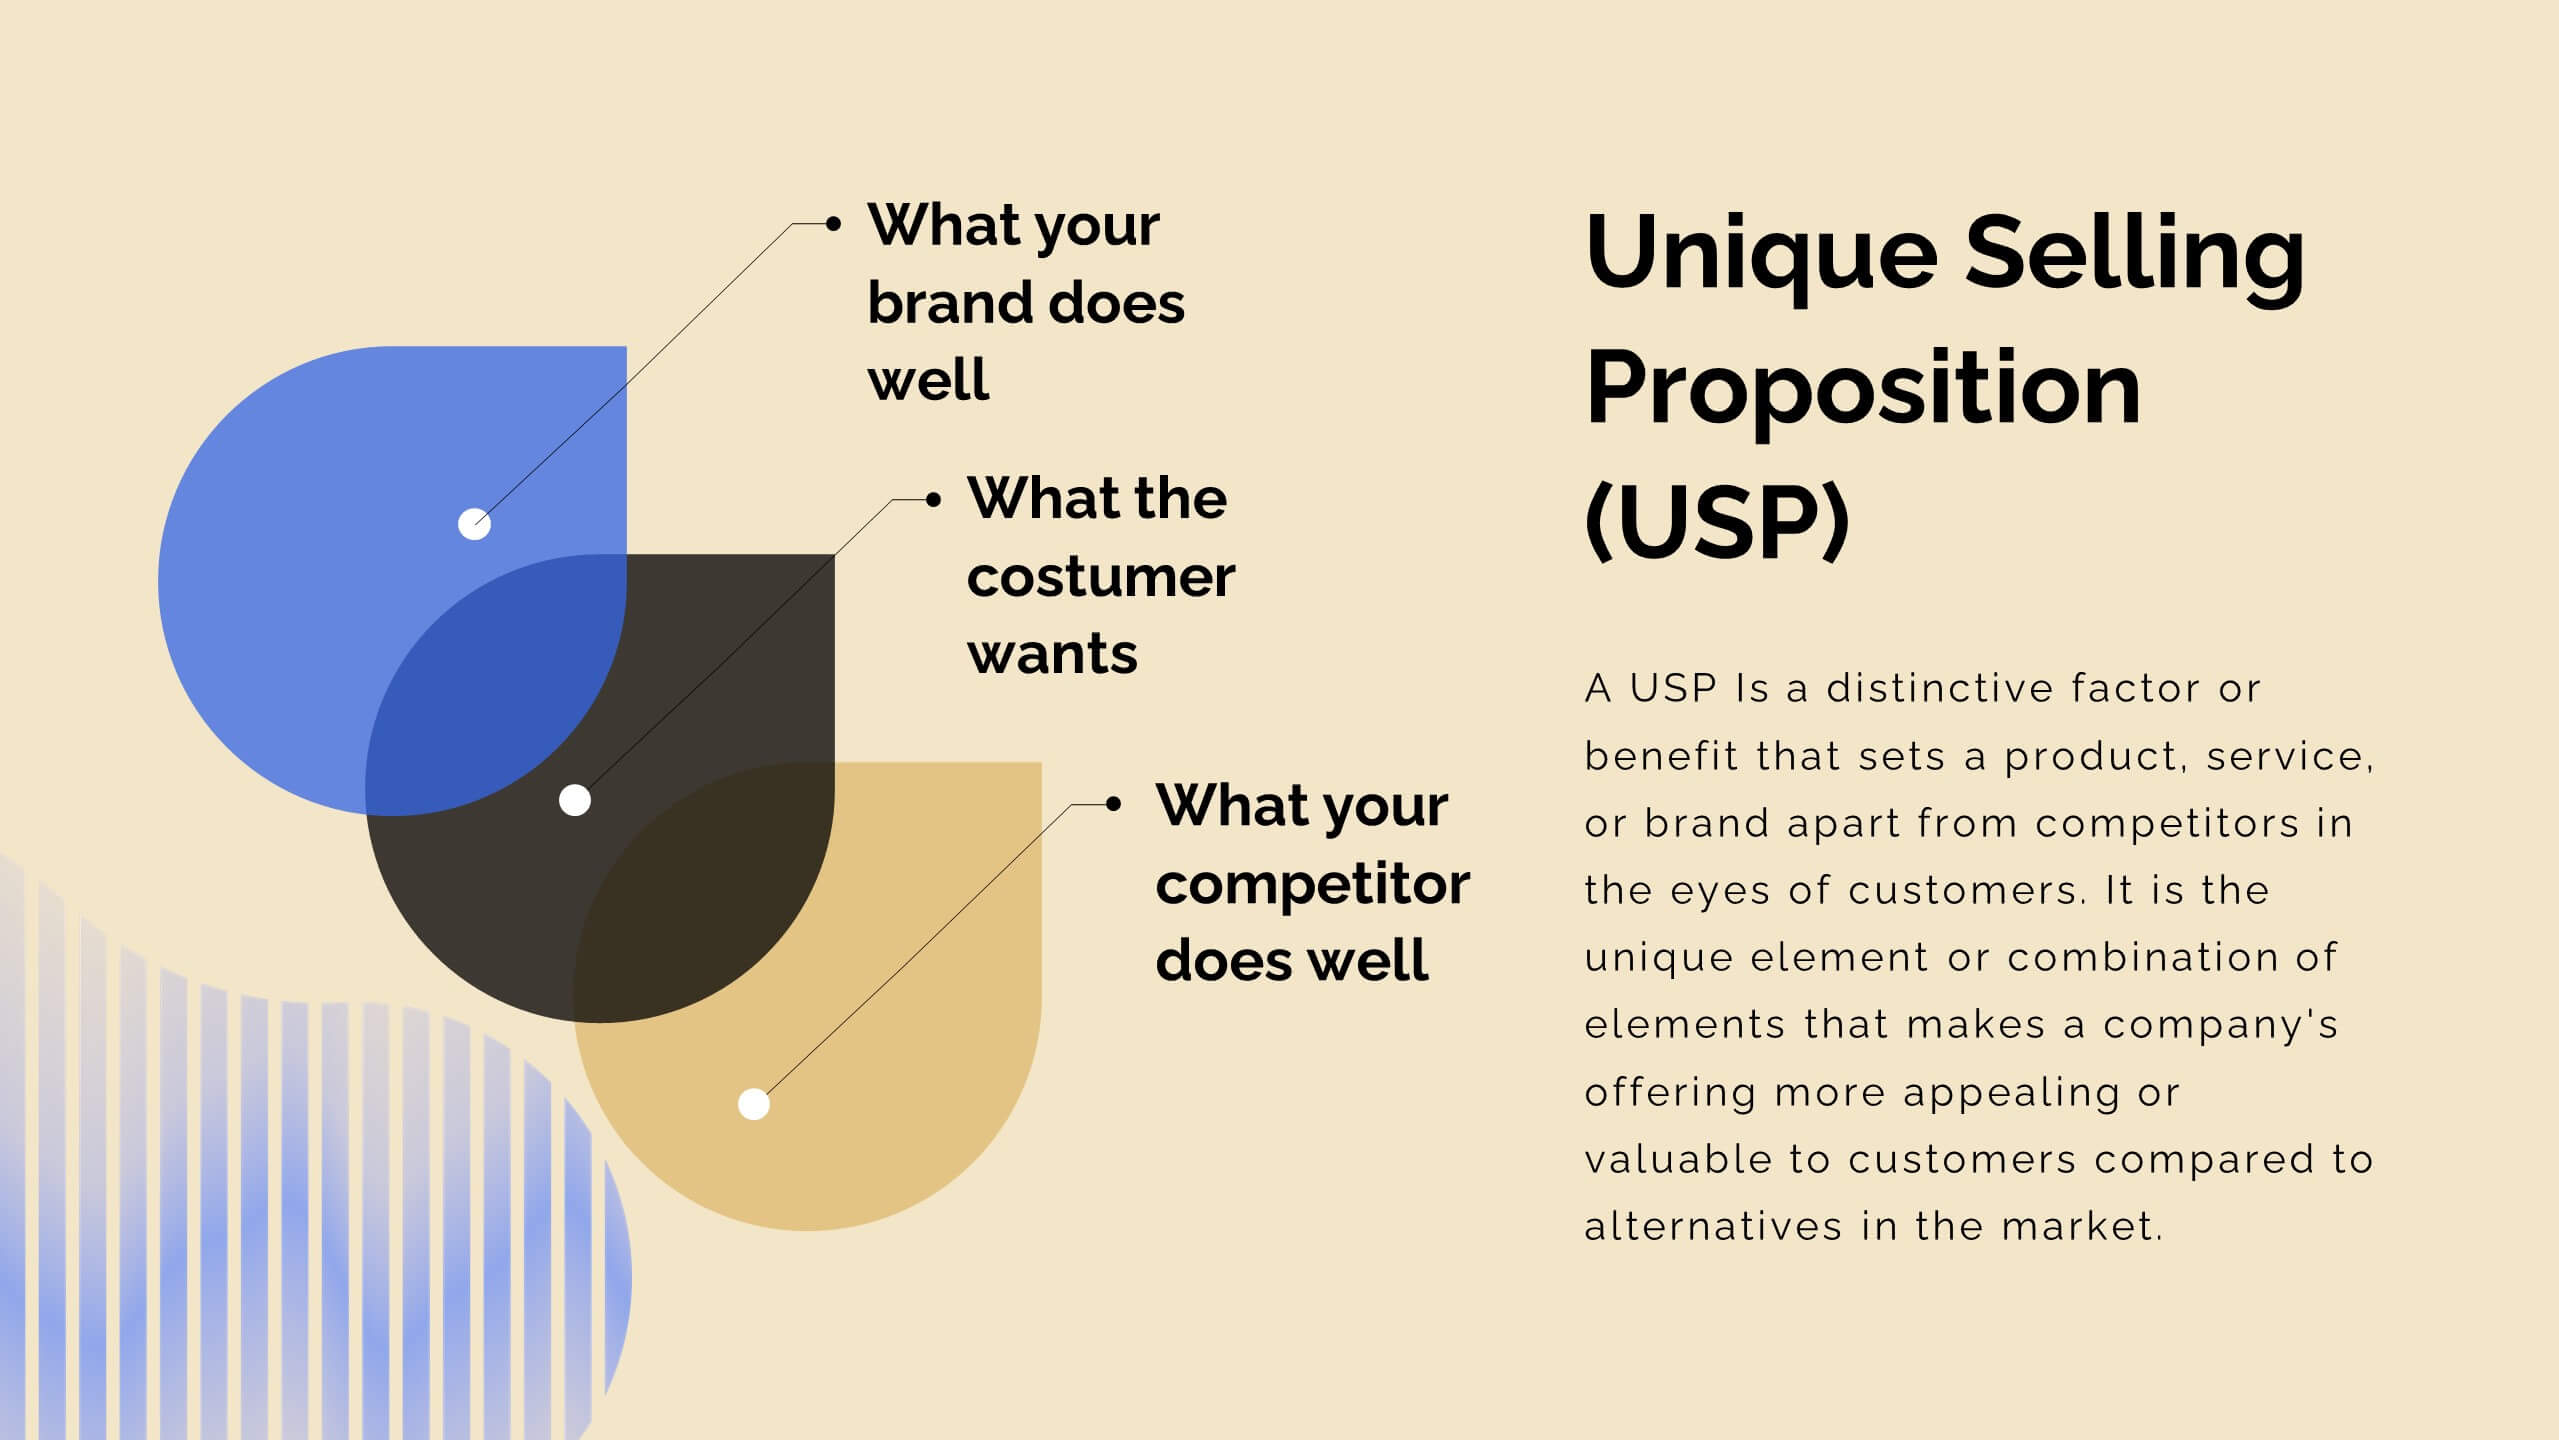
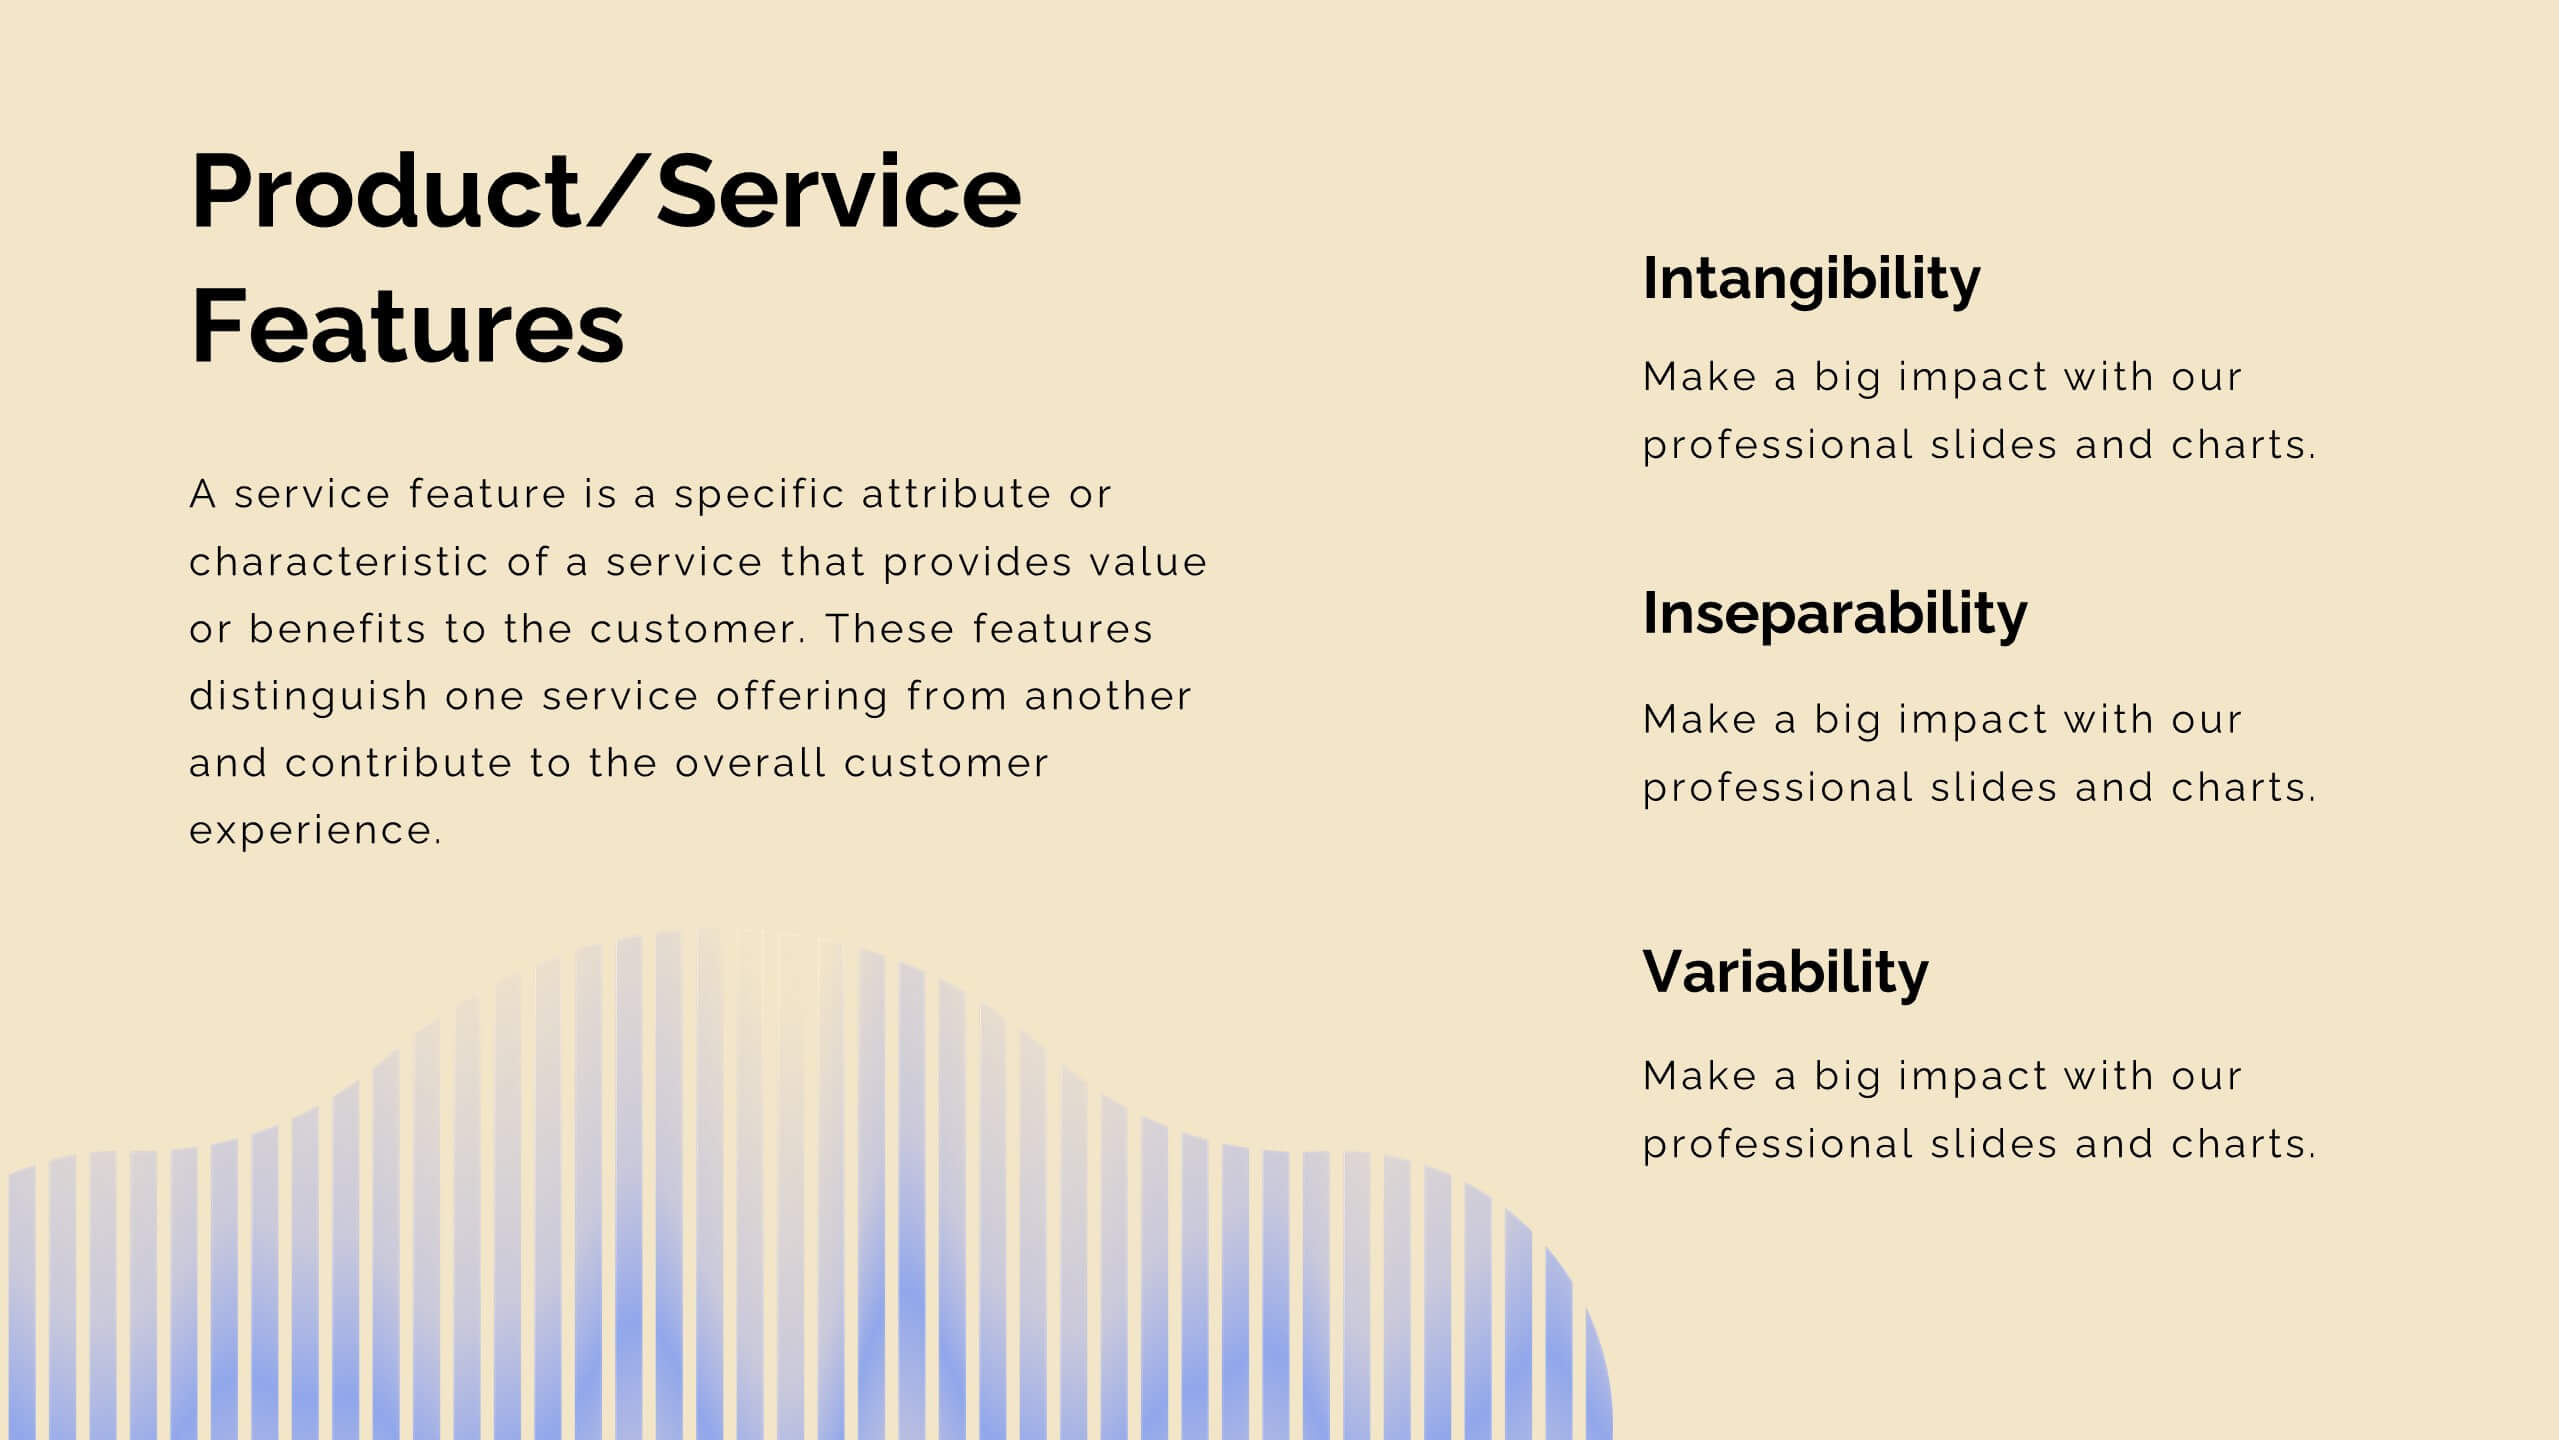
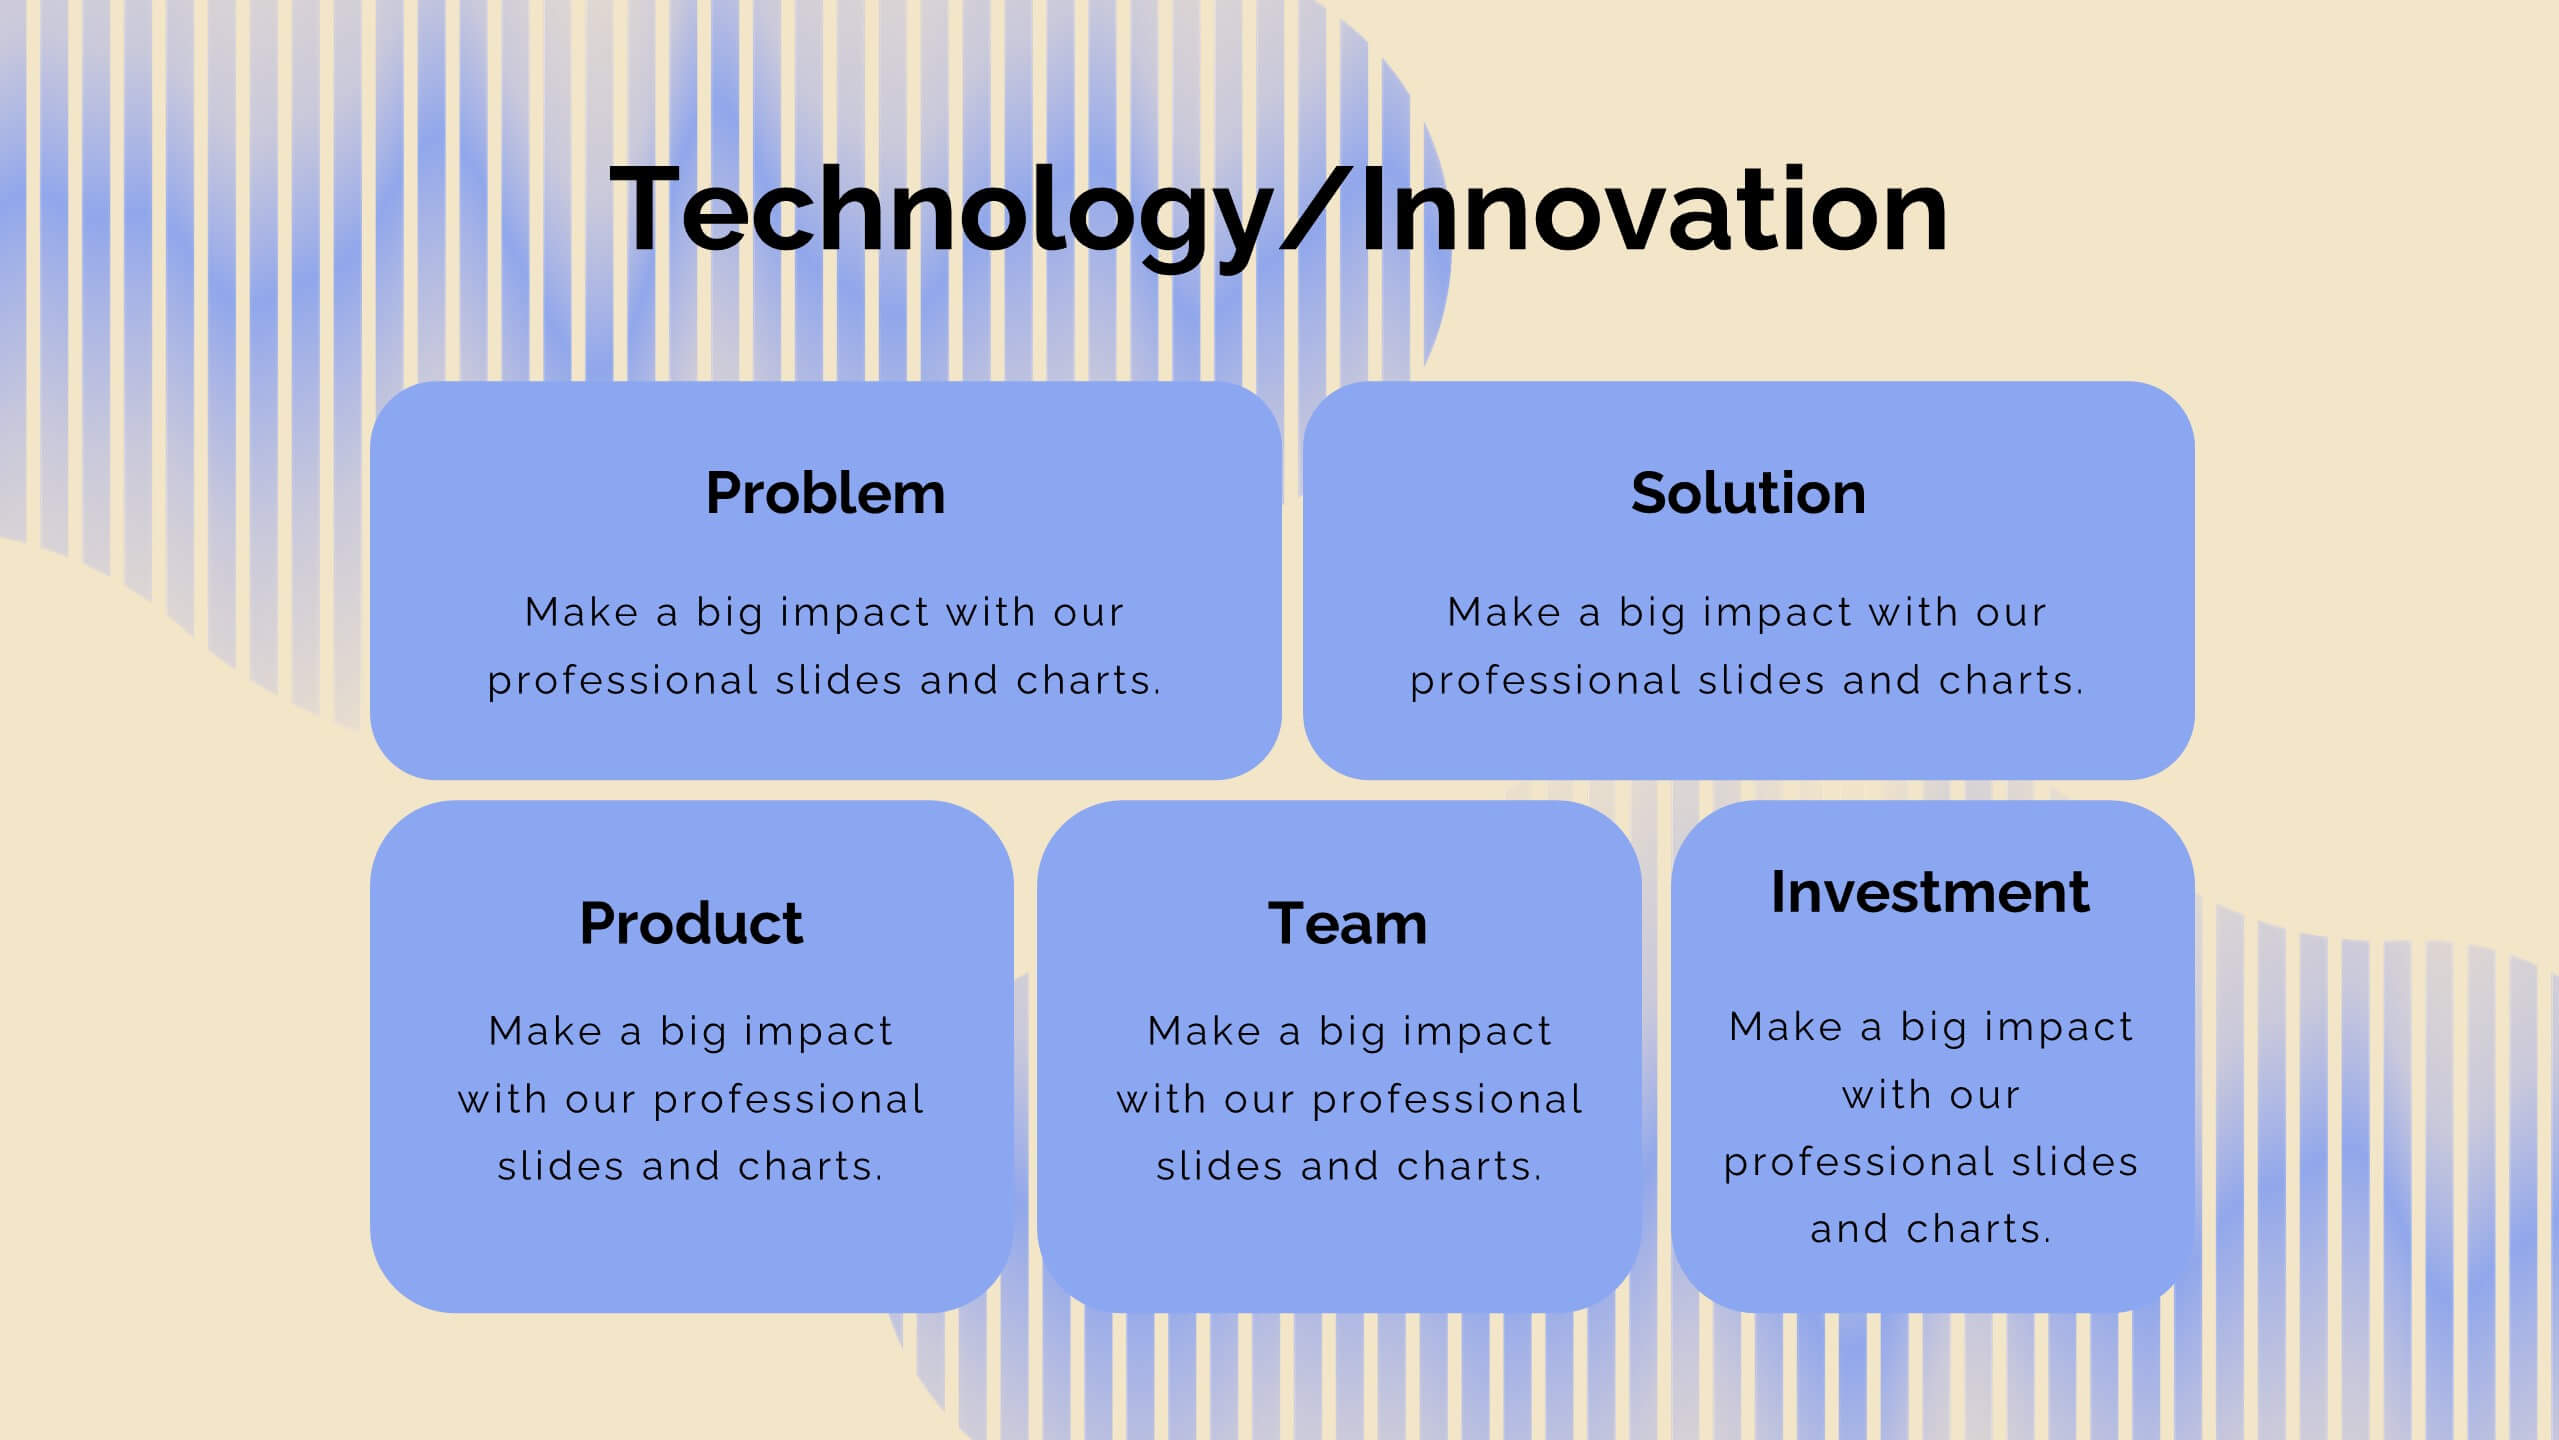
Journey Product Roadmap Presentation
Embark on a seamless journey through your product’s lifecycle with this comprehensive roadmap template! Perfect for illustrating key milestones, business models, and market opportunities, it’s your go-to for clear and engaging presentations. Dive into competitive analysis, showcase your unique selling proposition, and outline your growth projections with style. Compatible with PowerPoint, Keynote, and Google Slides.


7 diapositivas
Supply Chain Process Mapping Presentation
Streamline your logistics and operations presentations with the Supply Chain Process Mapping Presentation. Featuring a linked-chain visual, this editable template is ideal for outlining each step in your supply flow—from sourcing to delivery. Highlight dependencies, bottlenecks, or key stages with customizable color coding. Fully compatible with PowerPoint, Keynote, and Google Slides.


5 diapositivas
Eco-Friendly Practices Summary Presentation
Bring your green initiatives to life with a vibrant, city-inspired visual that makes sustainability easy to explain and engaging to explore. This presentation helps you outline key eco-friendly efforts, goals, and results in a clean, modern layout. Fully customizable and compatible with PowerPoint, Keynote, and Google Slides.


5 diapositivas
Scalability and Sustainable Growth Model Presentation
Communicate long-term vision with the Scalability and Sustainable Growth Model Presentation. This layered mountain-style design is ideal for visualizing strategic phases, scaling challenges, or sustainable development milestones. Perfect for roadmap pitches, growth models, or financial projections—fully editable in PowerPoint, Keynote, and Google Slides.


23 diapositivas
Mystic Small Business Pitch Deck Presentation
Elevate your small business presentations with this sleek, professional pitch deck template! It’s designed to highlight your company's background, market opportunities, and key objectives in a visually appealing format. Perfect for showcasing your products, services, value proposition, and financial performance, this template makes your pitch stand out. Customize it for PowerPoint, Keynote, or Google Slides to suit your needs.


5 diapositivas
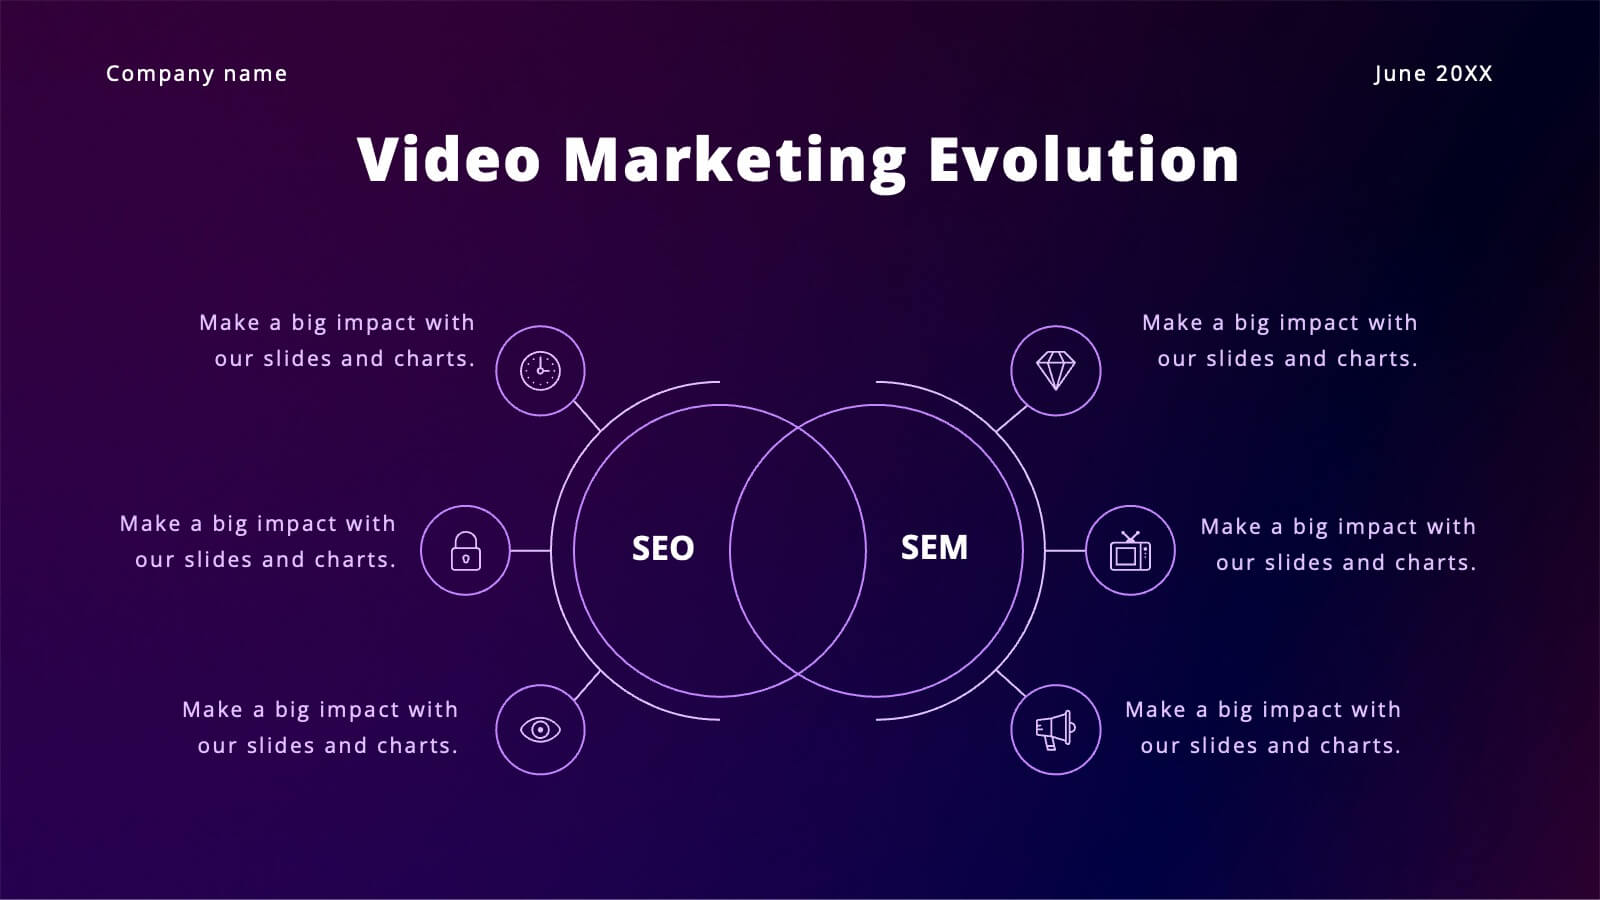
Digital Strategy and Online Campaigns Presentation
Aim for success with the Digital Strategy and Online Campaigns Presentation. This template uses a dynamic target and arrow graphic to represent strategic goals, campaign directions, and marketing focus. Ideal for showcasing KPIs, digital initiatives, and performance insights. Fully customizable in PowerPoint, Keynote, and Google Slides.

20 diapositivas
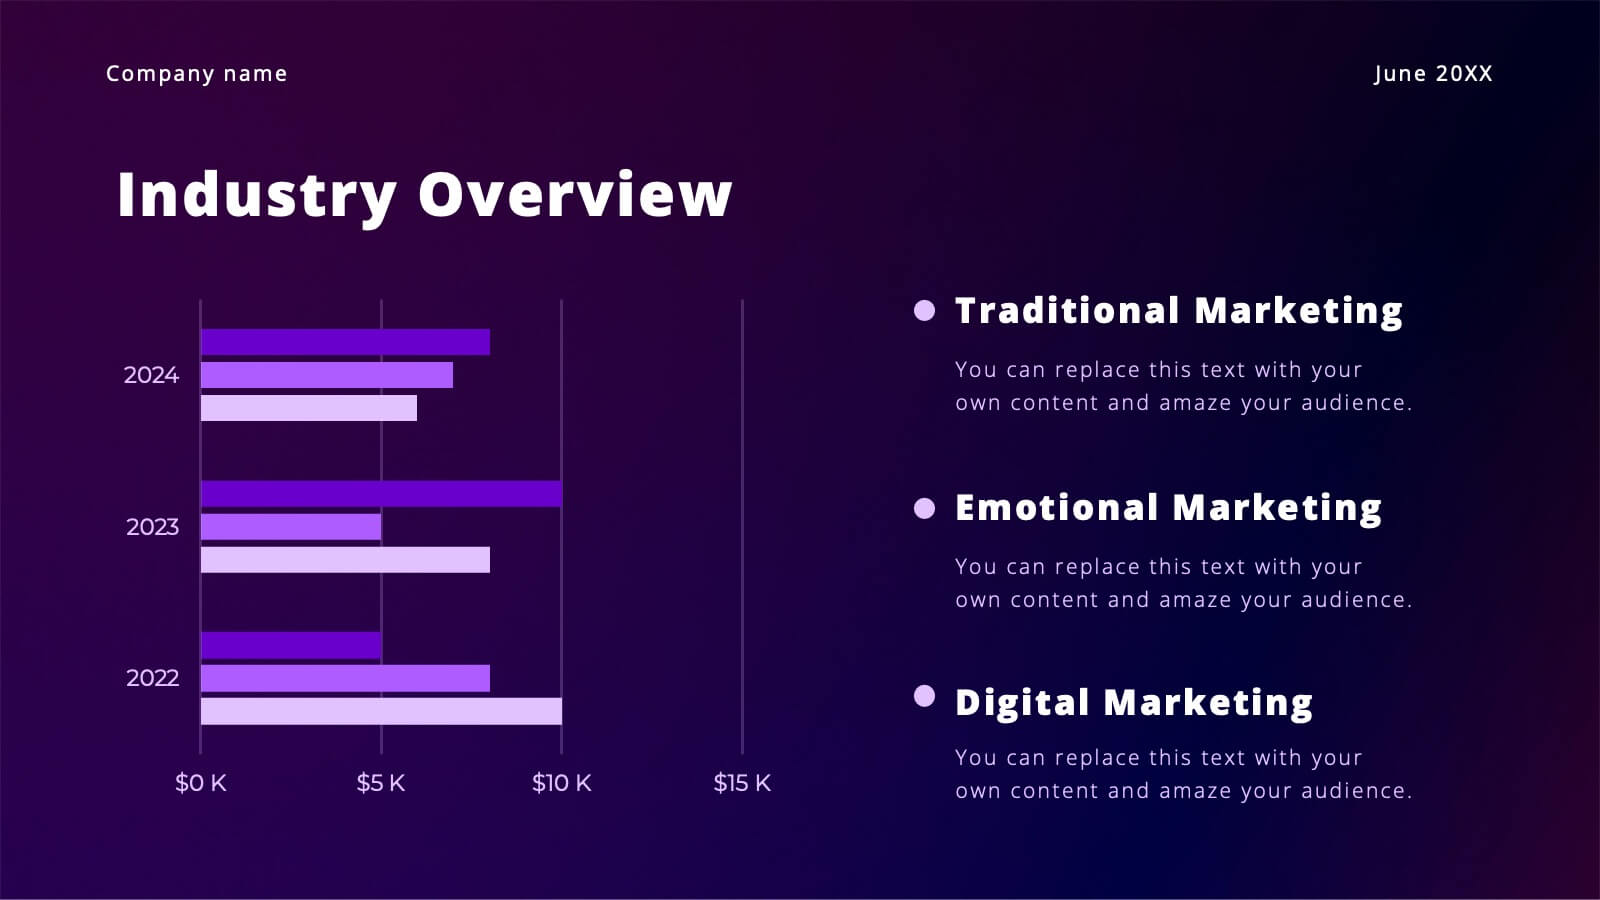
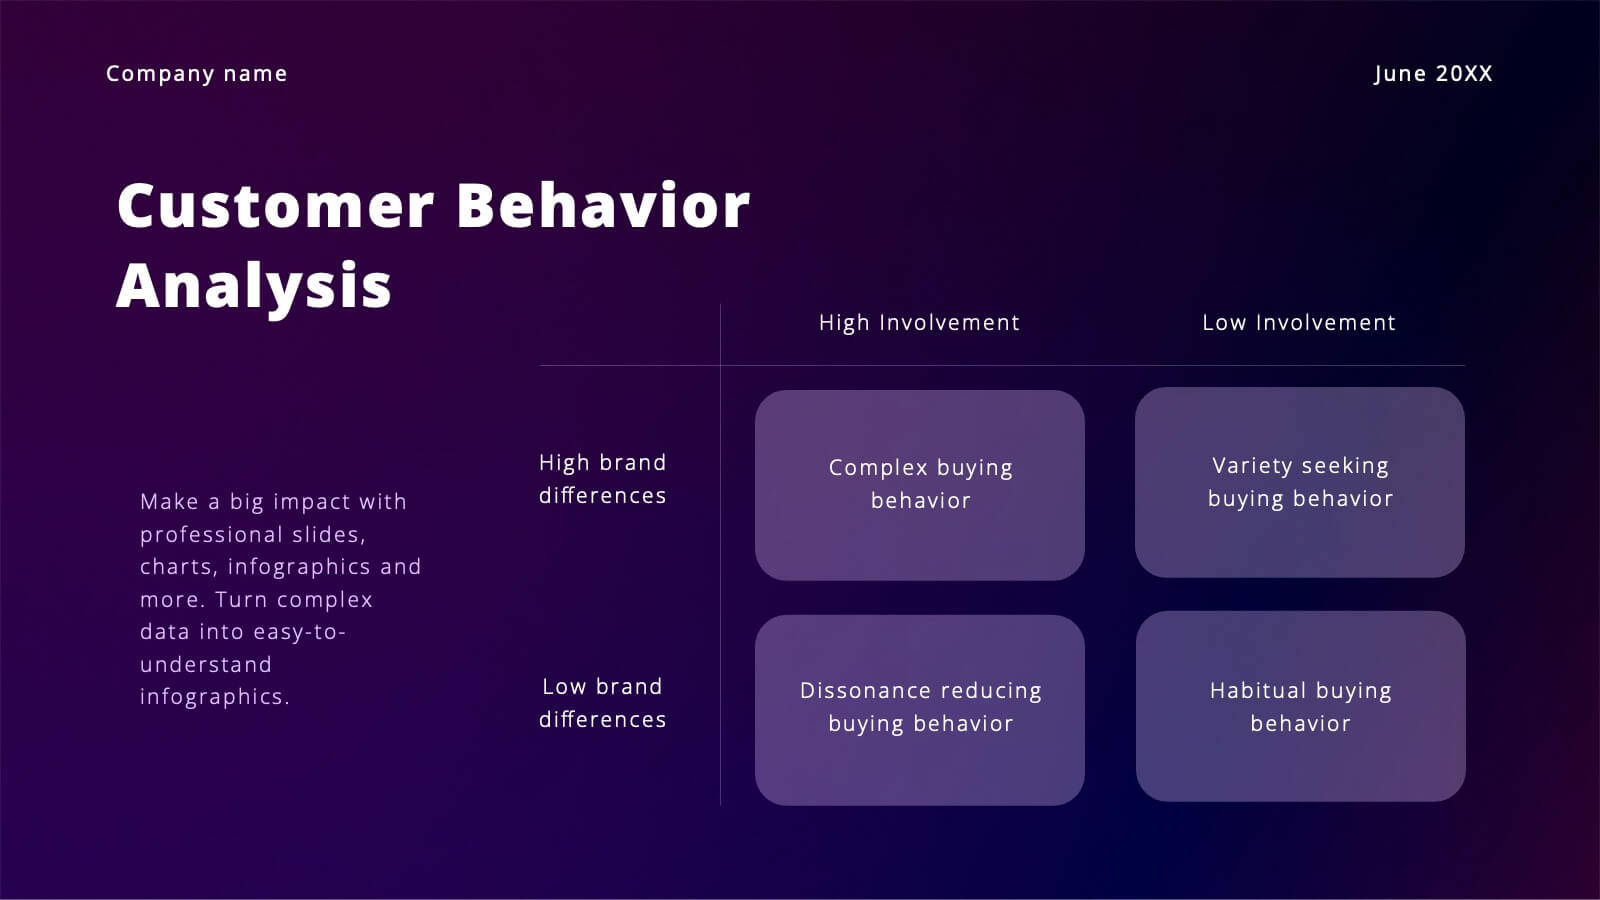
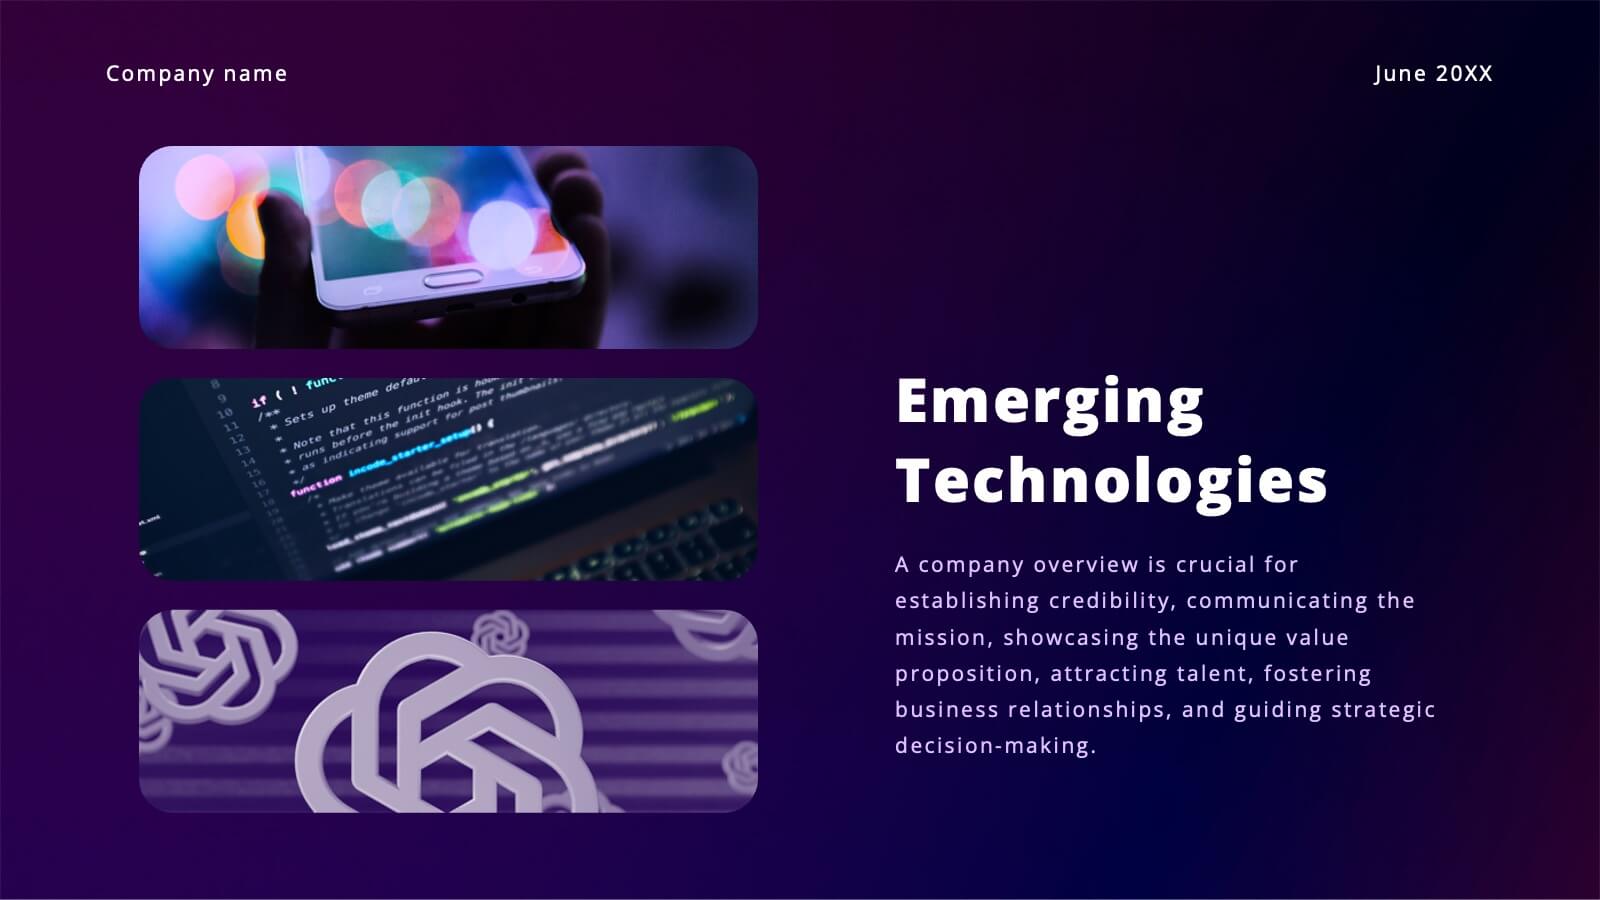
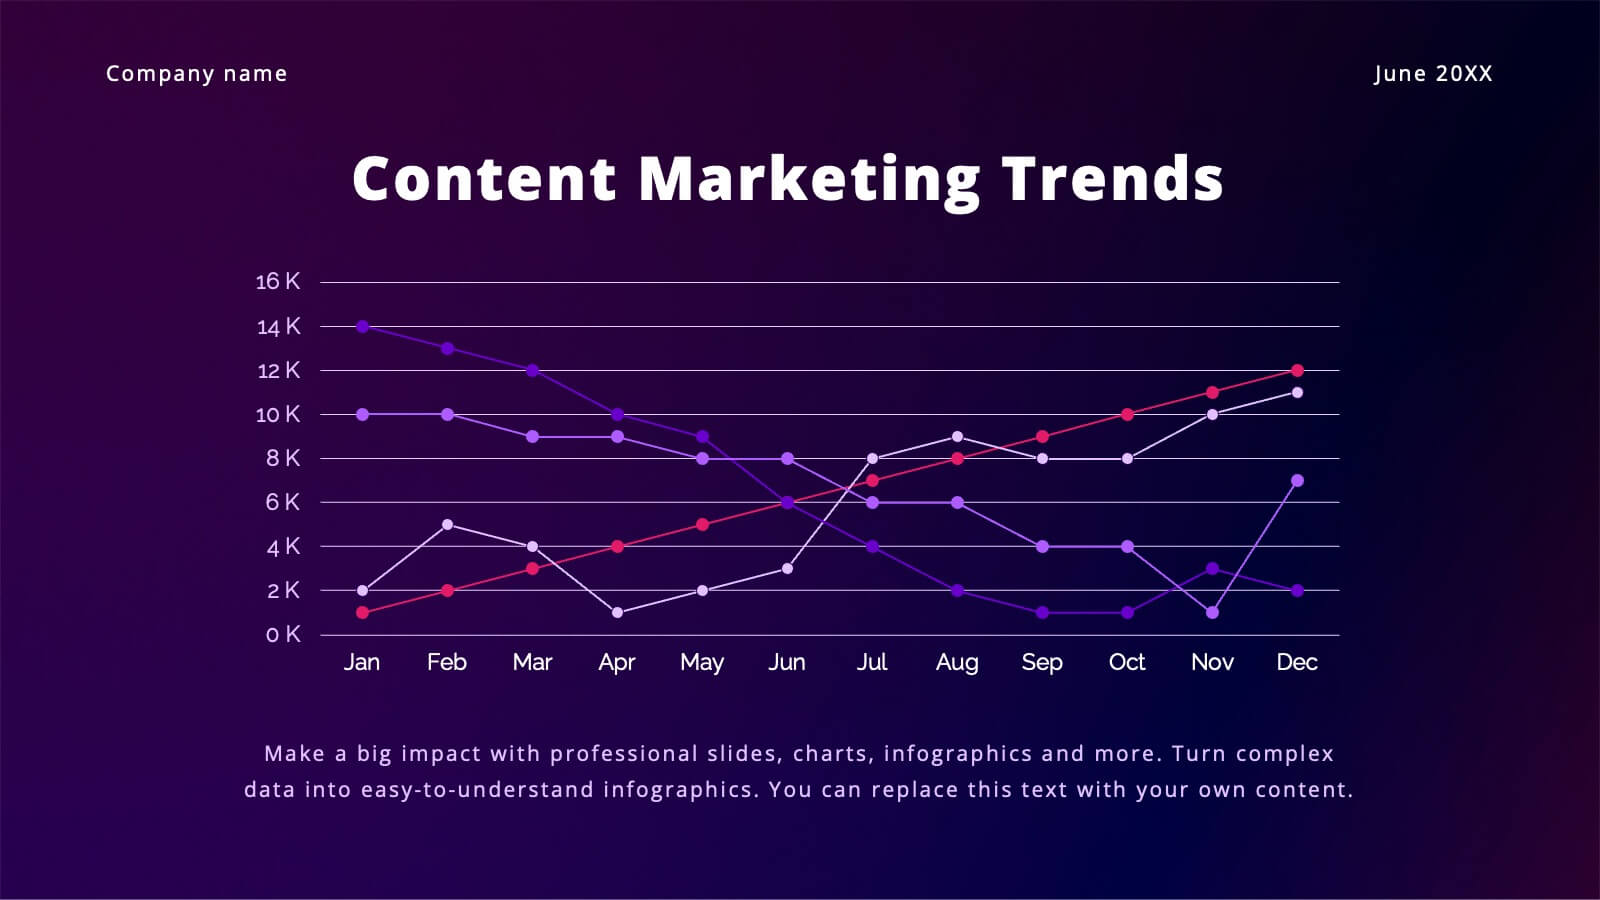
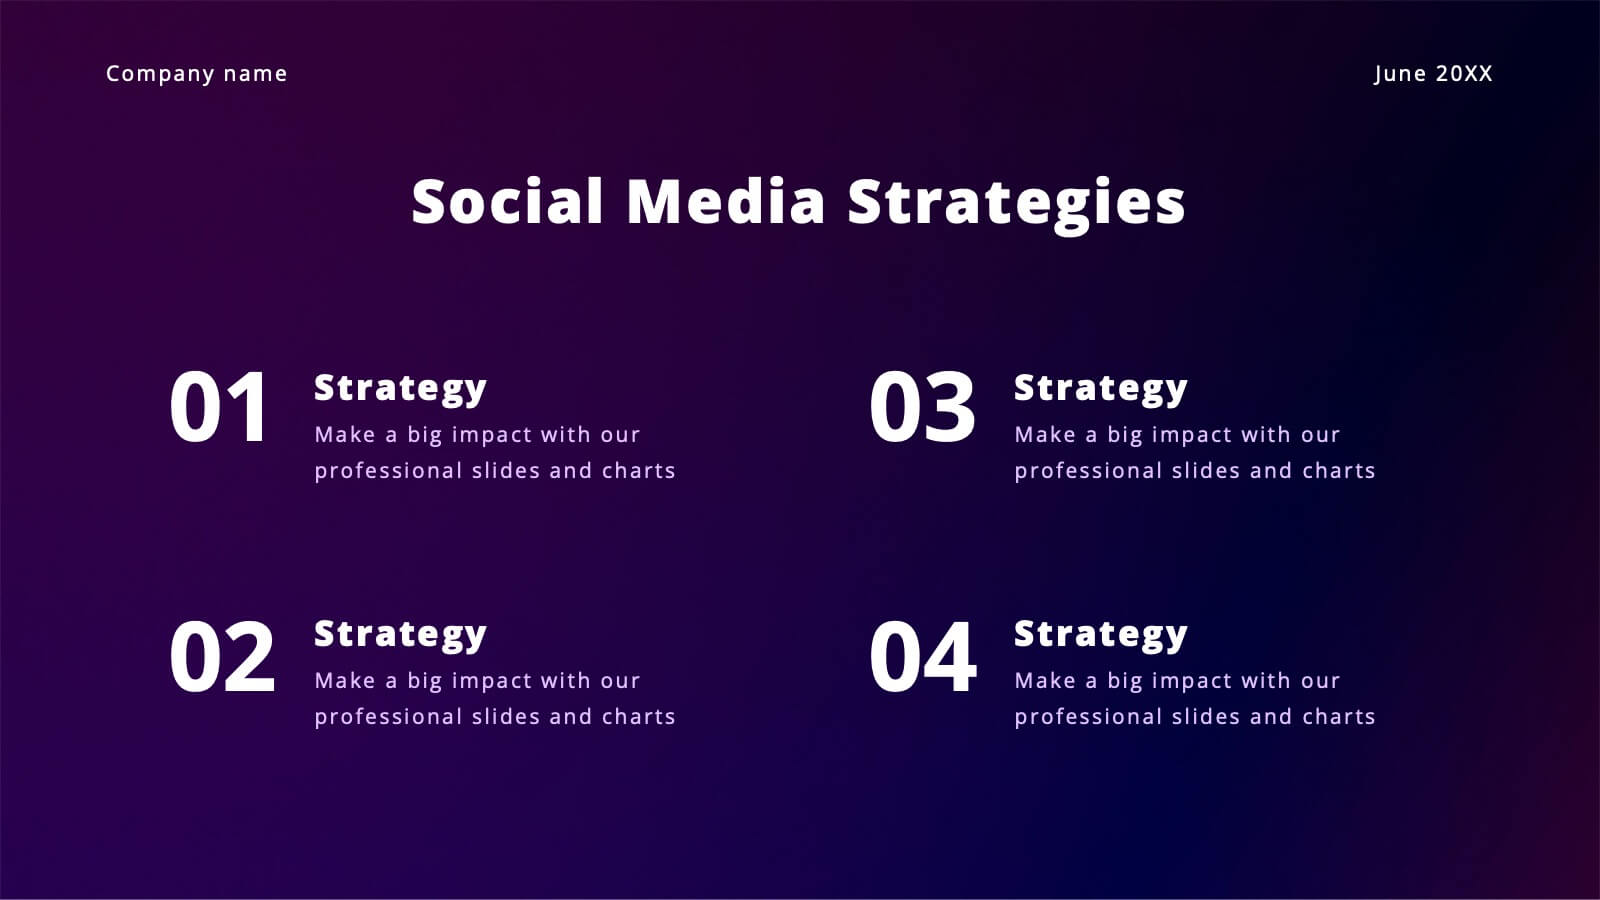
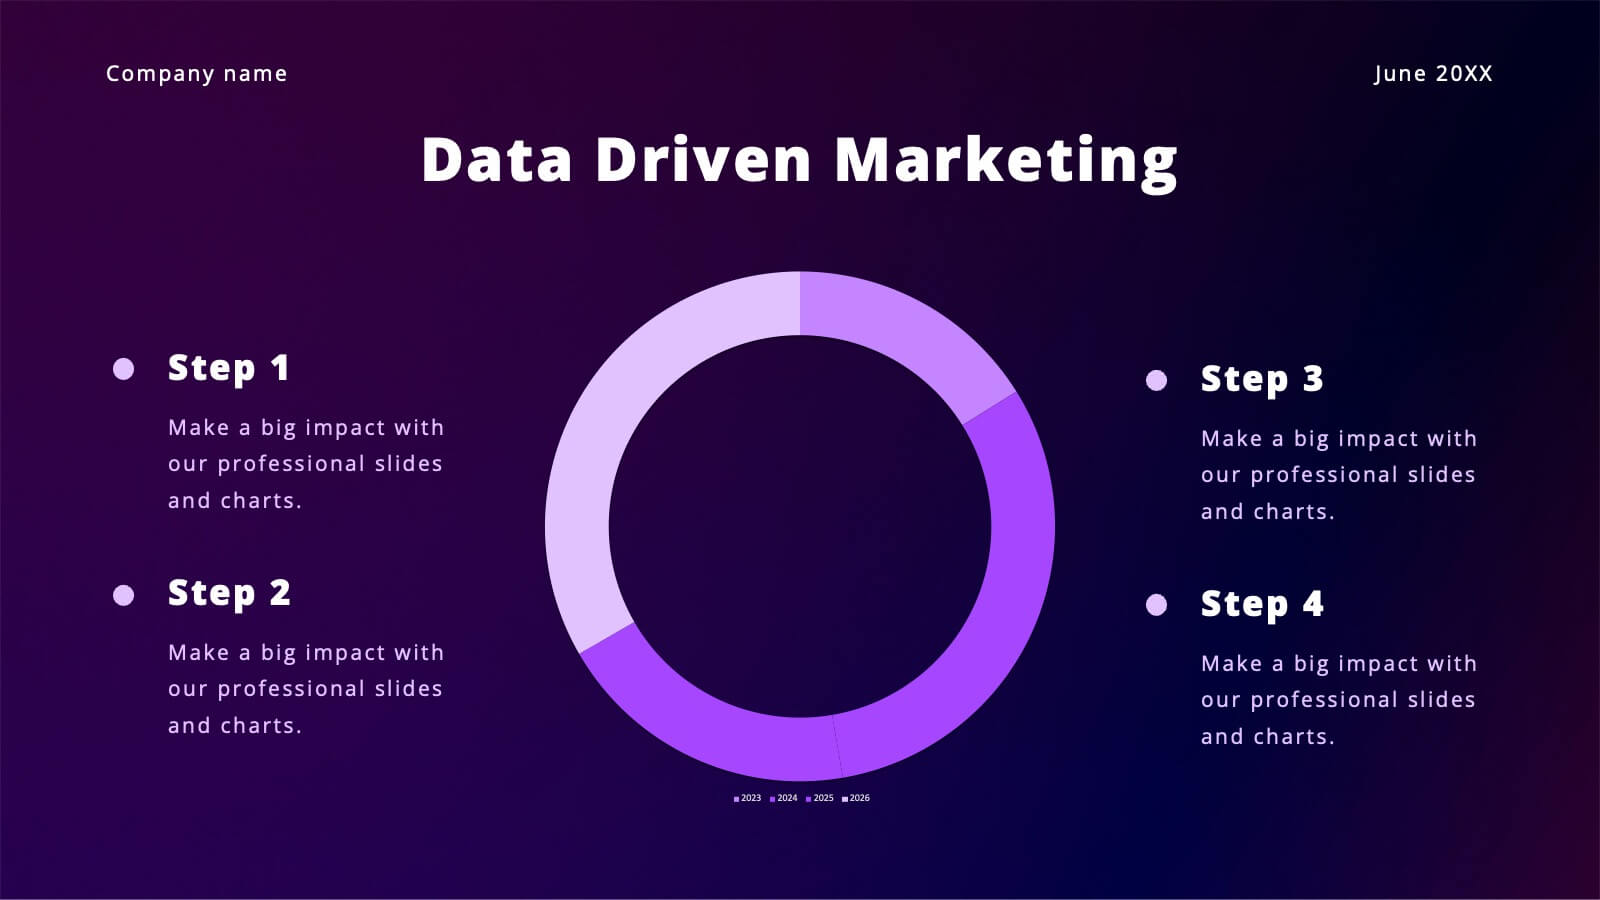
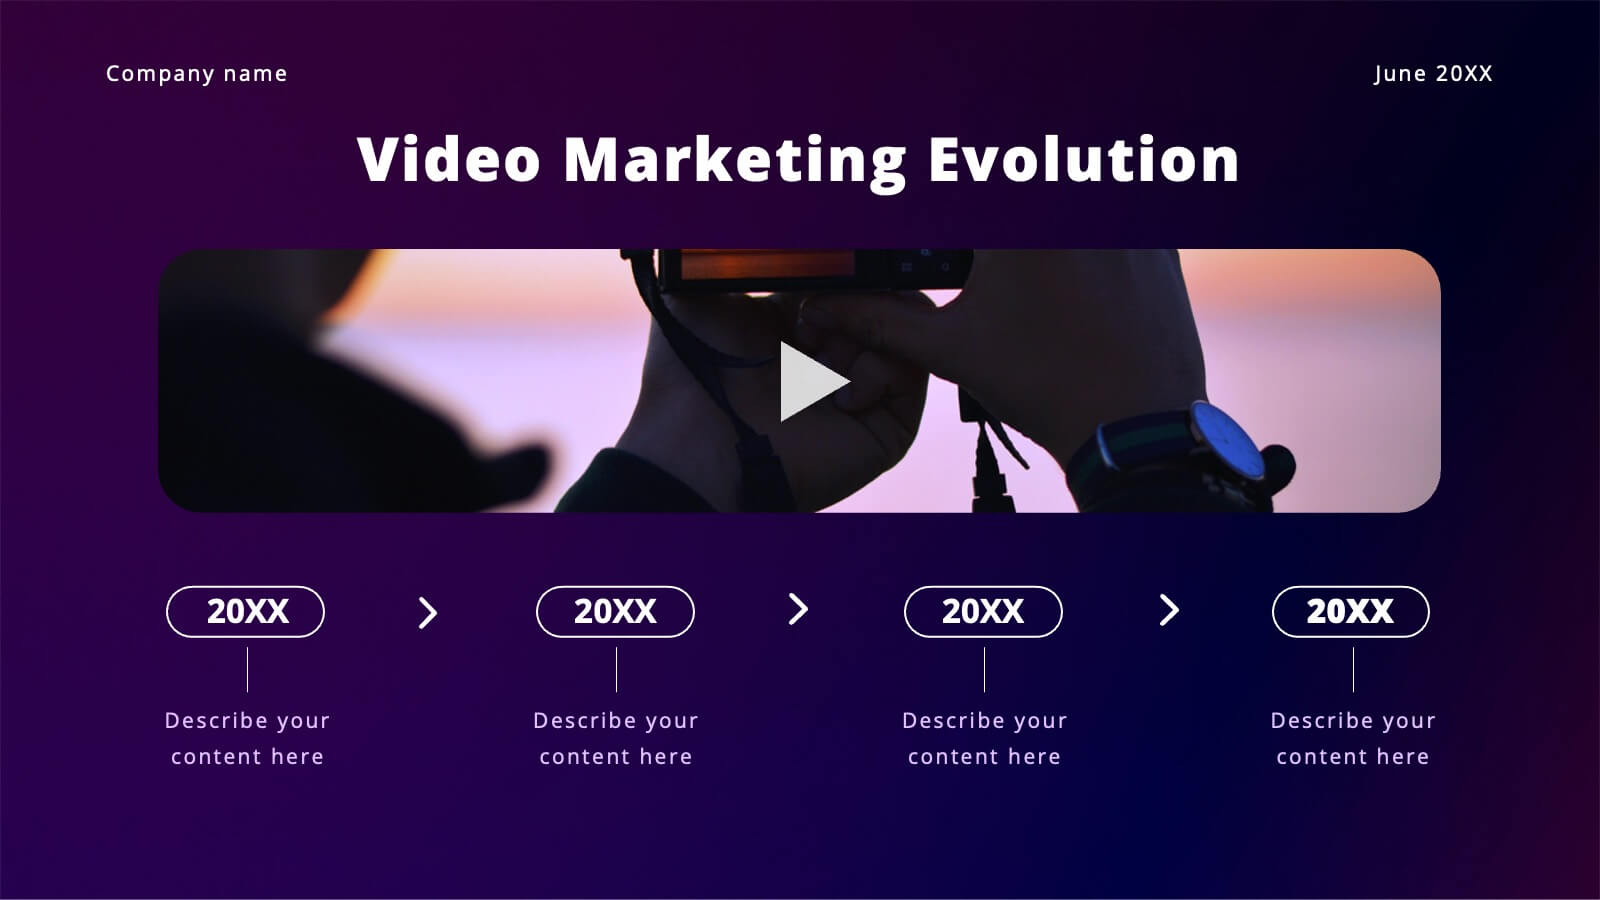
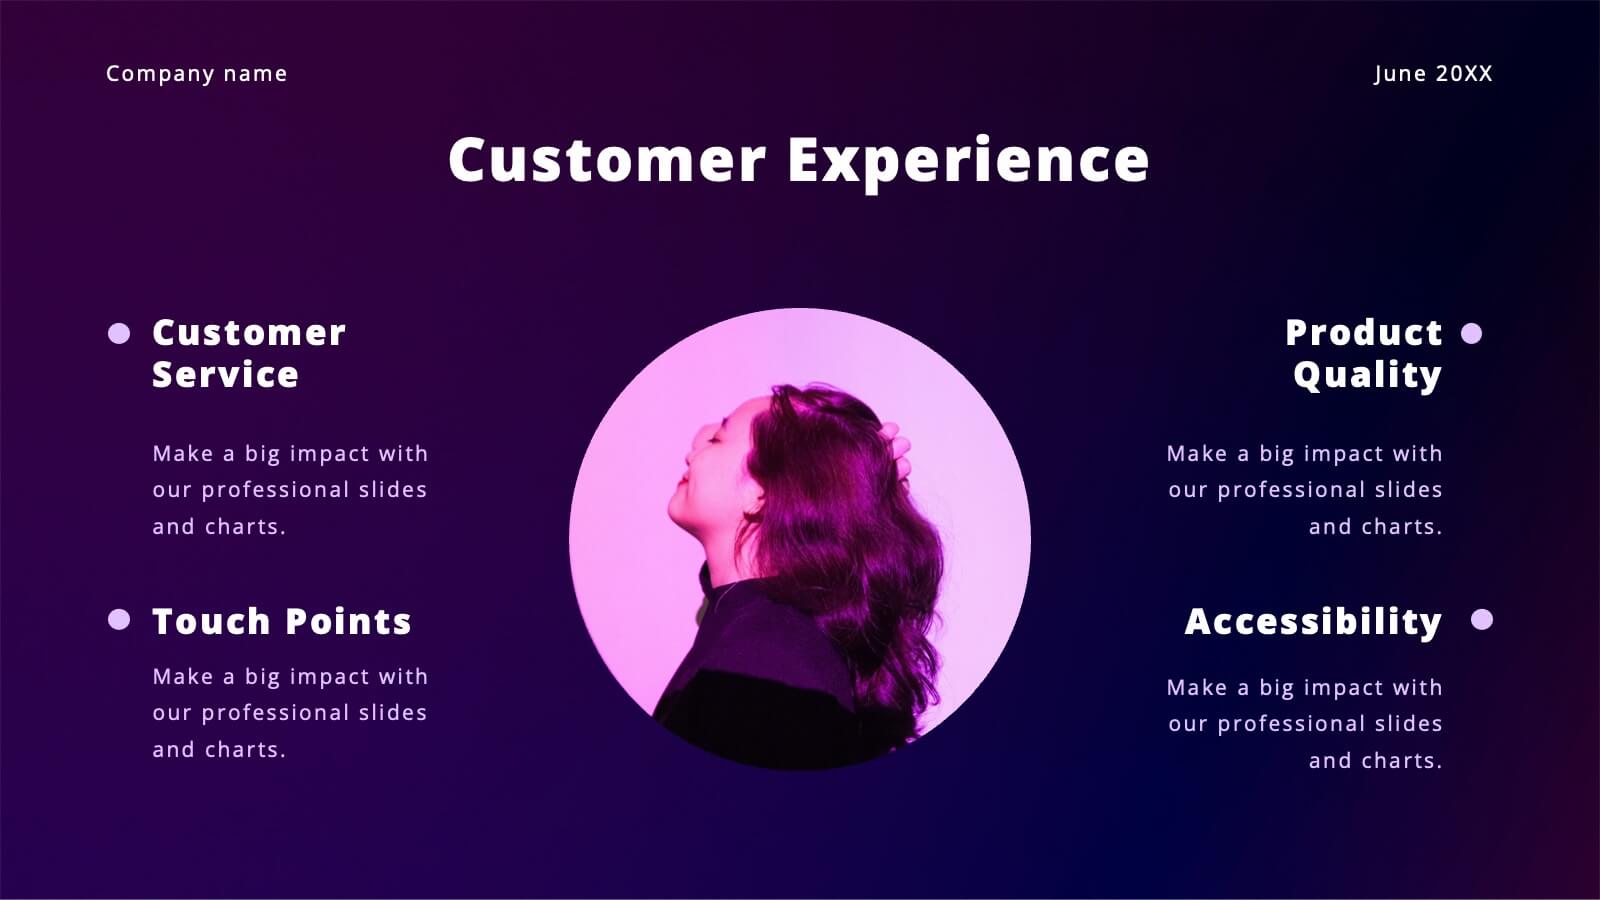
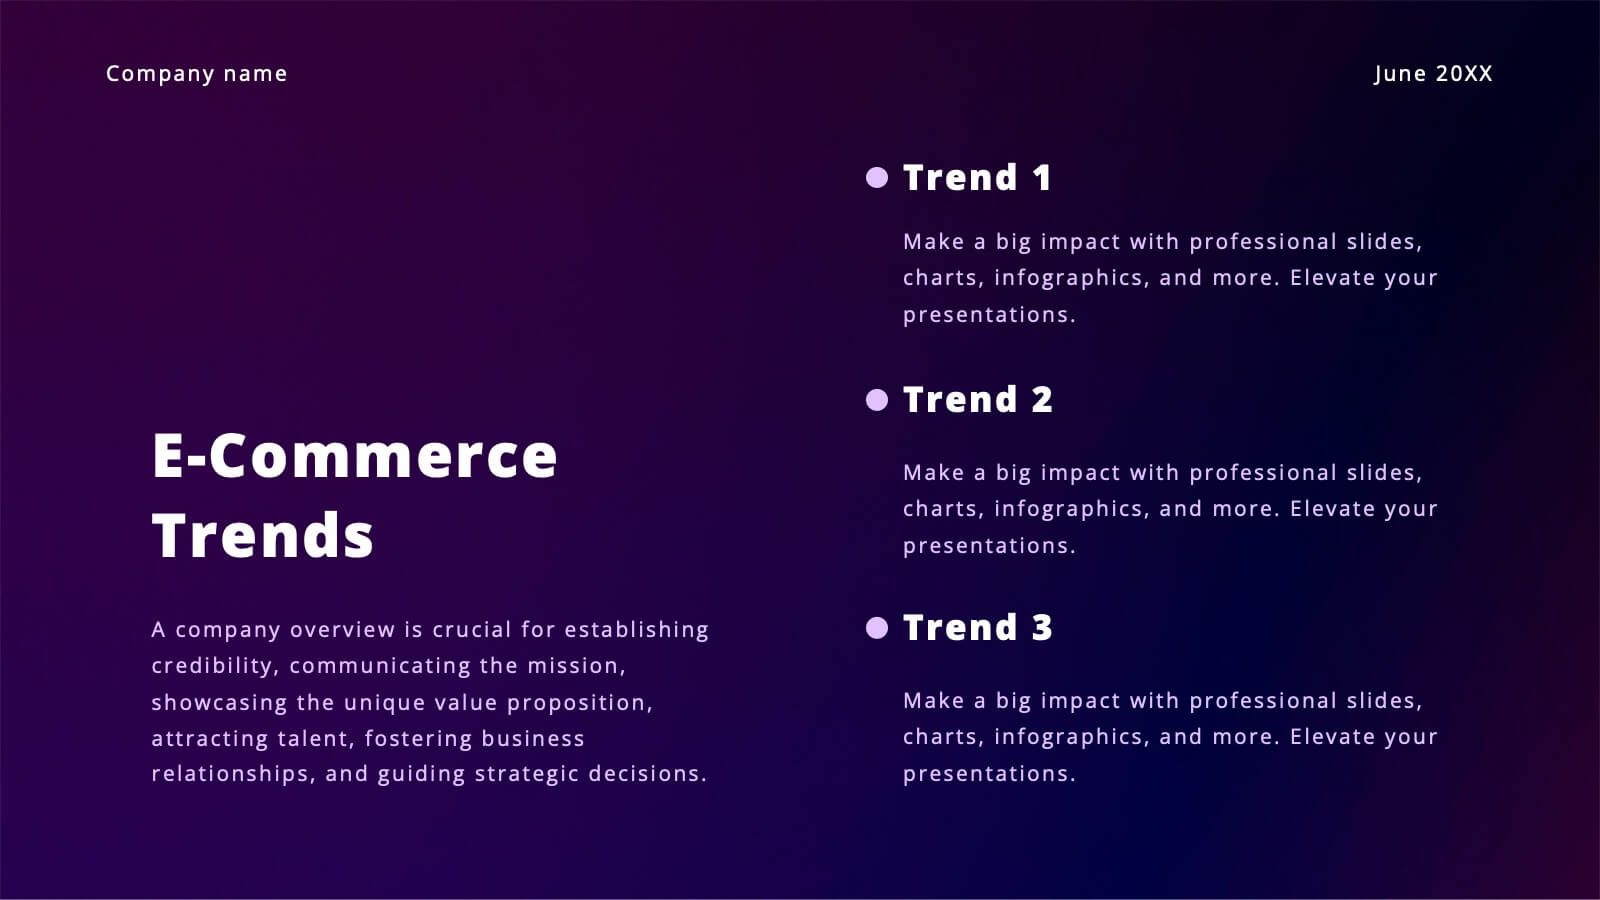
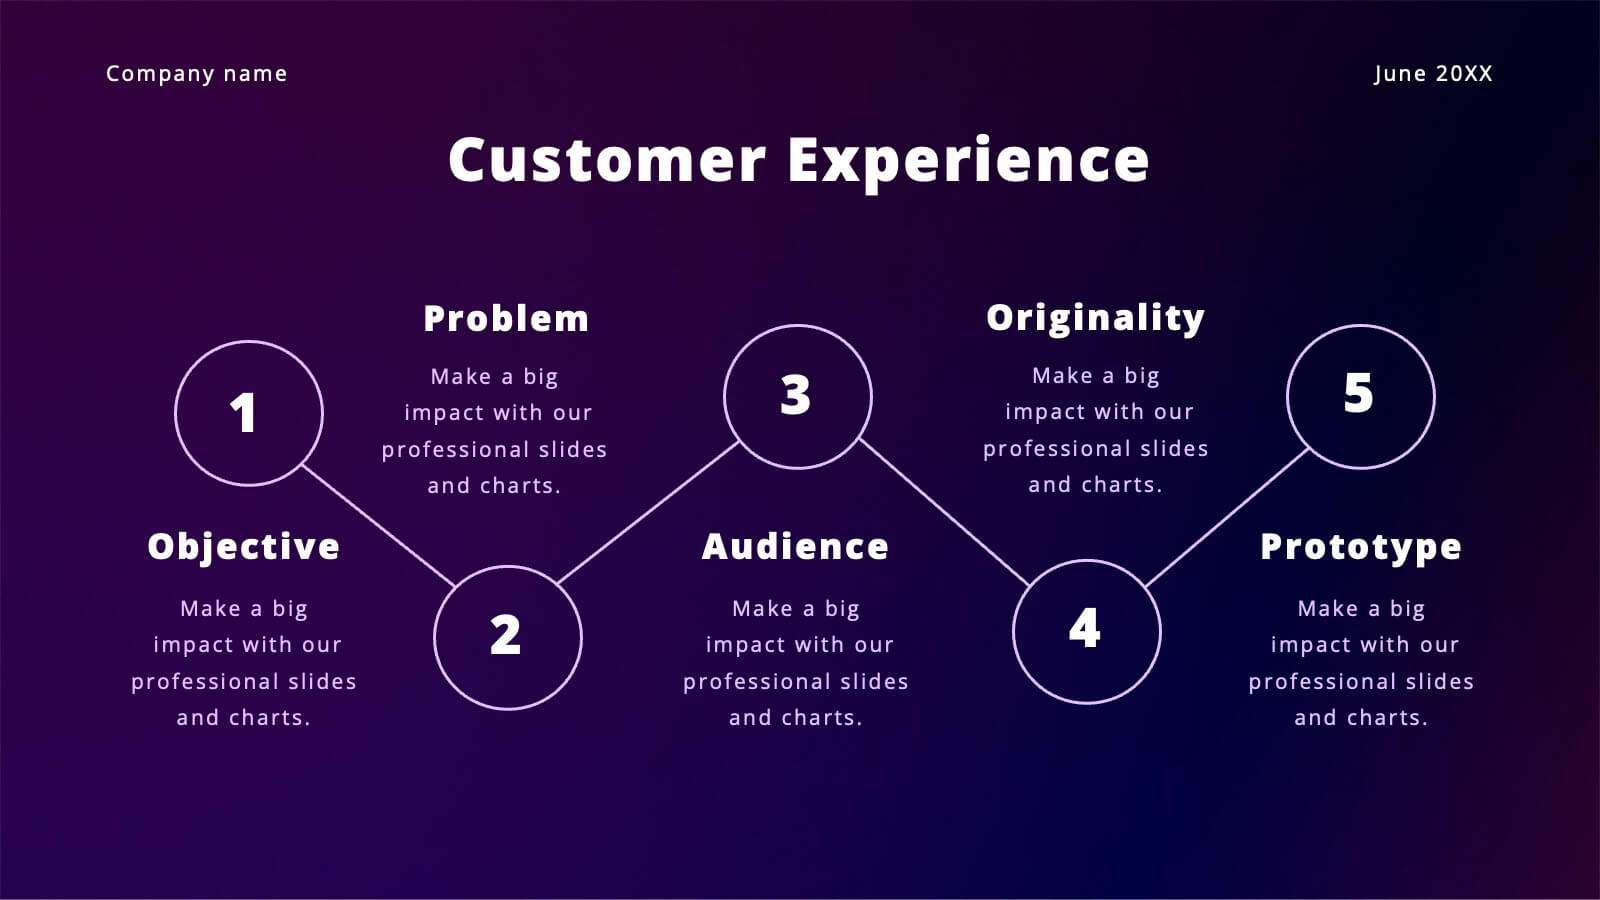
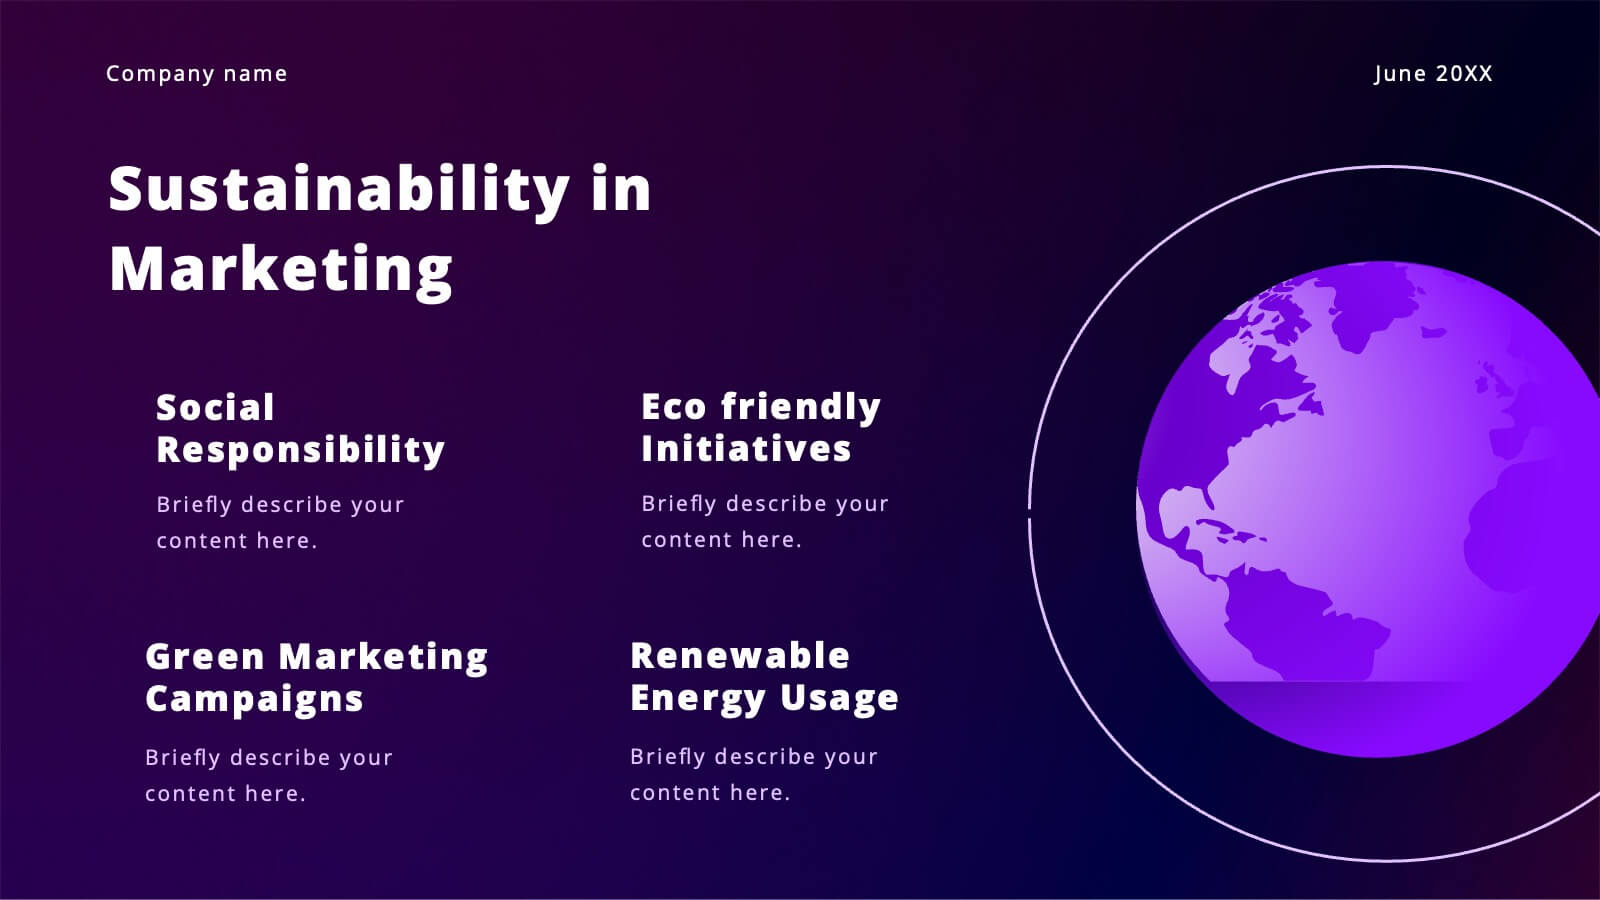
Vibrant Content Marketing Pitch Deck Presentation
Boost your marketing pitch with this vibrant deck! Covering industry overviews, customer behavior analysis, and emerging technologies, it’s designed to captivate your audience. Highlight social media strategies, data-driven marketing, and e-commerce trends effortlessly. Perfect for presenting a comprehensive marketing plan. Compatible with PowerPoint, Keynote, and Google Slides. Make your next pitch stand out!


3 diapositivas
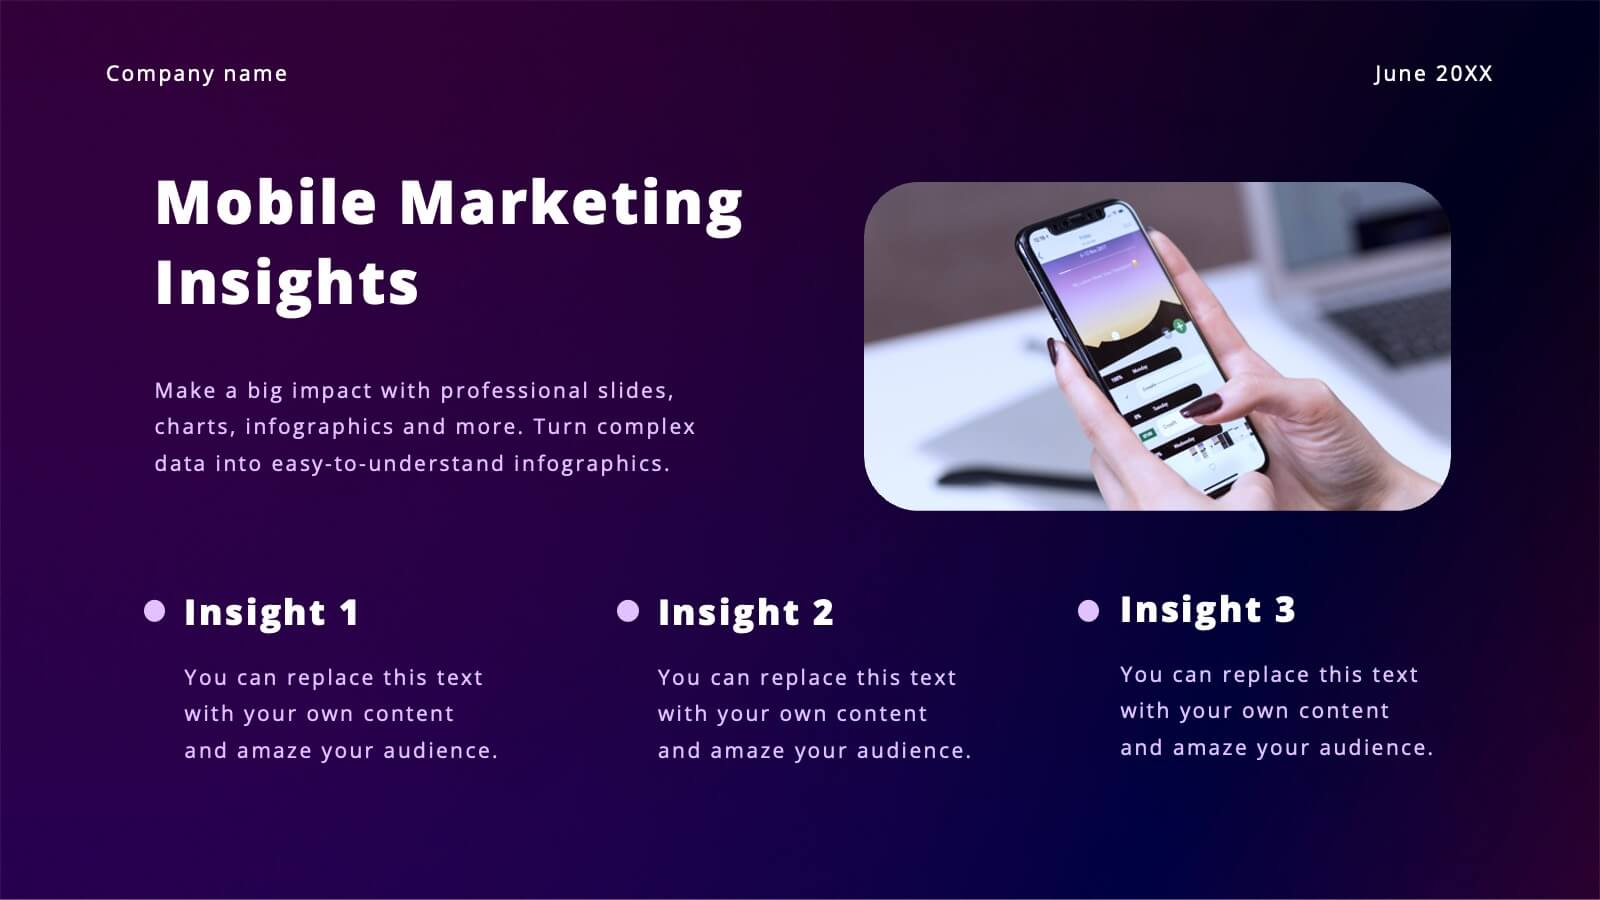
Company Mission Overview Presentation
Bring your message to life with a bright, modern slide that highlights purpose, direction, and organizational goals in a clean, engaging layout. This presentation helps you communicate mission-driven insights with clarity and visual impact, making it ideal for internal teams or stakeholders. Fully compatible with PowerPoint, Keynote, and Google Slides.


21 diapositivas
Ruby Startup Funding Proposal Presentation
Get ready to pitch your startup in style with this vibrant and engaging presentation template! Perfect for showcasing your startup’s founding story, business model, market analysis, and financial overview, this template ensures you’ll impress potential investors. Fully customizable and compatible with PowerPoint, Keynote, and Google Slides, it’s ideal for securing funding and support.


6 diapositivas
Creative Alphabetic Infographic
Bring your message to life with a bright, alphabet-inspired layout that turns simple letters into eye-catching storytelling elements. This presentation is perfect for organizing steps, categories, or key ideas in a memorable way while keeping everything clear and structured. Fully editable and compatible with PowerPoint, Keynote, and Google Slides.


23 diapositivas
Volt Business Plan Presentation
The Business Plan Presentation Template offers 23 refined slides to convey goals, strategies, achievements, and action plans. Perfect for team updates, resource allocation, and collaboration opportunities. Designed for PowerPoint, Keynote, and Google Slides, its warm, professional layout ensures clarity while fostering effective communication for corporate or project presentations. Fully customizable.


5 diapositivas
Agricultural Business Strategy
Showcase your farming goals and plans with this circular, step-based strategy slide. Perfect for presenting agricultural business models, market planning, or farm-to-market strategies. The layout uses clean icons and an engaging central farm illustration to enhance clarity. Fully editable in PowerPoint, Keynote, and Google Slides.