


Características


¿Tienes alguna pregunta?
Recomendar


20 diapositivas
Momentum Business Proposal Presentation
Elevate your business proposals with this vibrant, dynamic template designed to impress and persuade. Featuring a sleek design and a structured layout, this template is perfect for outlining project summaries, methodologies, and pricing structures. It's ideal for conveying professionalism and clarity. Compatible with PowerPoint, Keynote, and Google Slides, it ensures seamless presentations across all platforms.


5 diapositivas
Business Model Canvas Overview Presentation
Streamline your business strategy with the Business Model Canvas Overview Presentation. Designed for entrepreneurs, startups, and strategists, this template visualizes key partners, activities, value propositions, customer segments, revenue streams, and more. Fully editable for PowerPoint, Keynote, and Google Slides, ensuring a structured and professional business plan presentation.


6 diapositivas
Work from Home Best Practices Presentation
The "Work from Home Best Practices" presentation template is thoughtfully designed to display metrics and insights for remote work effectiveness. Each slide provides visual elements like bar graphs, line charts, and icon grids to represent various data points such as weekly activity percentage, hours worked, and number of projects managed. This setup is ideal for illustrating best practices and benchmarks in remote work environments, enabling clear communication of goals, achievements, and areas for improvement. The template uses a clean and professional layout with plenty of space for customization, making it a versatile tool for remote teams looking to optimize their workflows and productivity.


21 diapositivas
Aetherial UX Research Report Presentation
A professional and modern template for UX research presentations. Highlight key elements such as user personas, journey mapping, wireframes, and testing processes. Includes slides for accessibility considerations, design systems, and feedback iteration. Fully customizable and compatible with PowerPoint, Keynote, and Google Slides to deliver impactful insights and research findings.


8 diapositivas
Process Flowchart Presentation
Visualize your workflows effortlessly with this Process Flowchart template. Designed for business presentations, it helps map out key steps with a structured, gear-based design. Fully editable with customizable colors, icons, and text for seamless adaptation. Compatible with PowerPoint, Keynote, and Google Slides for maximum flexibility and ease of use.


4 diapositivas
Turning Ideas into Impact Presentation
Showcase your transformation journey from concept to achievement with this bold visual layout. The three-step diagram—idea, action, success—makes it ideal for project planning, product development, or strategic execution. Easily editable in PowerPoint, Keynote, and Google Slides for pitch decks, business roadmaps, or innovation workflows. Clean, modern, and impactful.
20 diapositivas
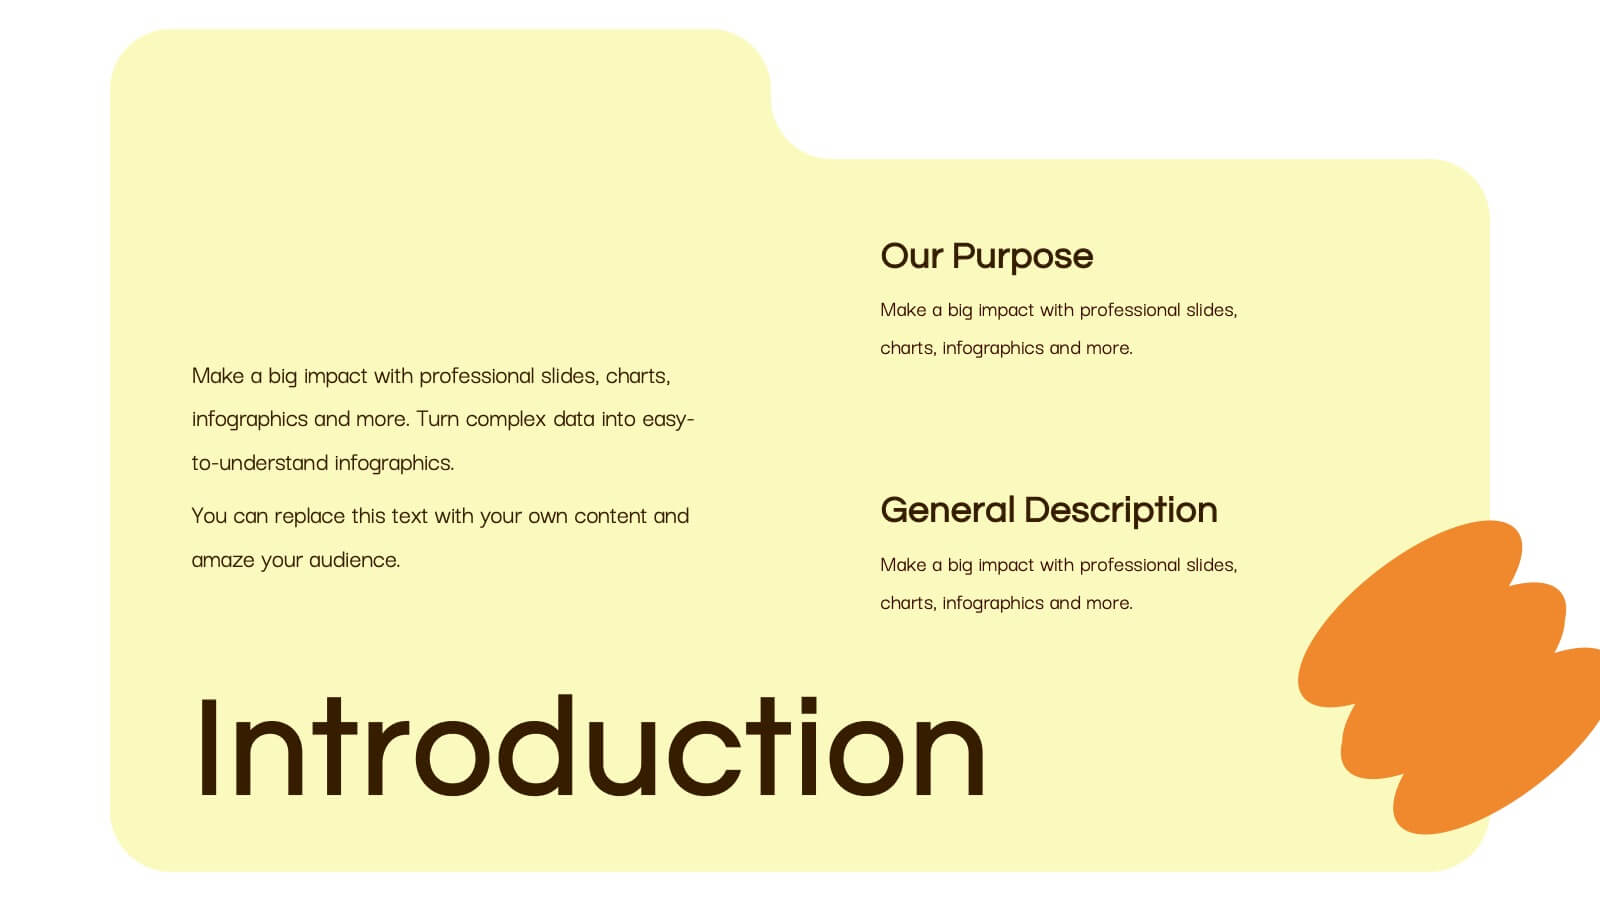
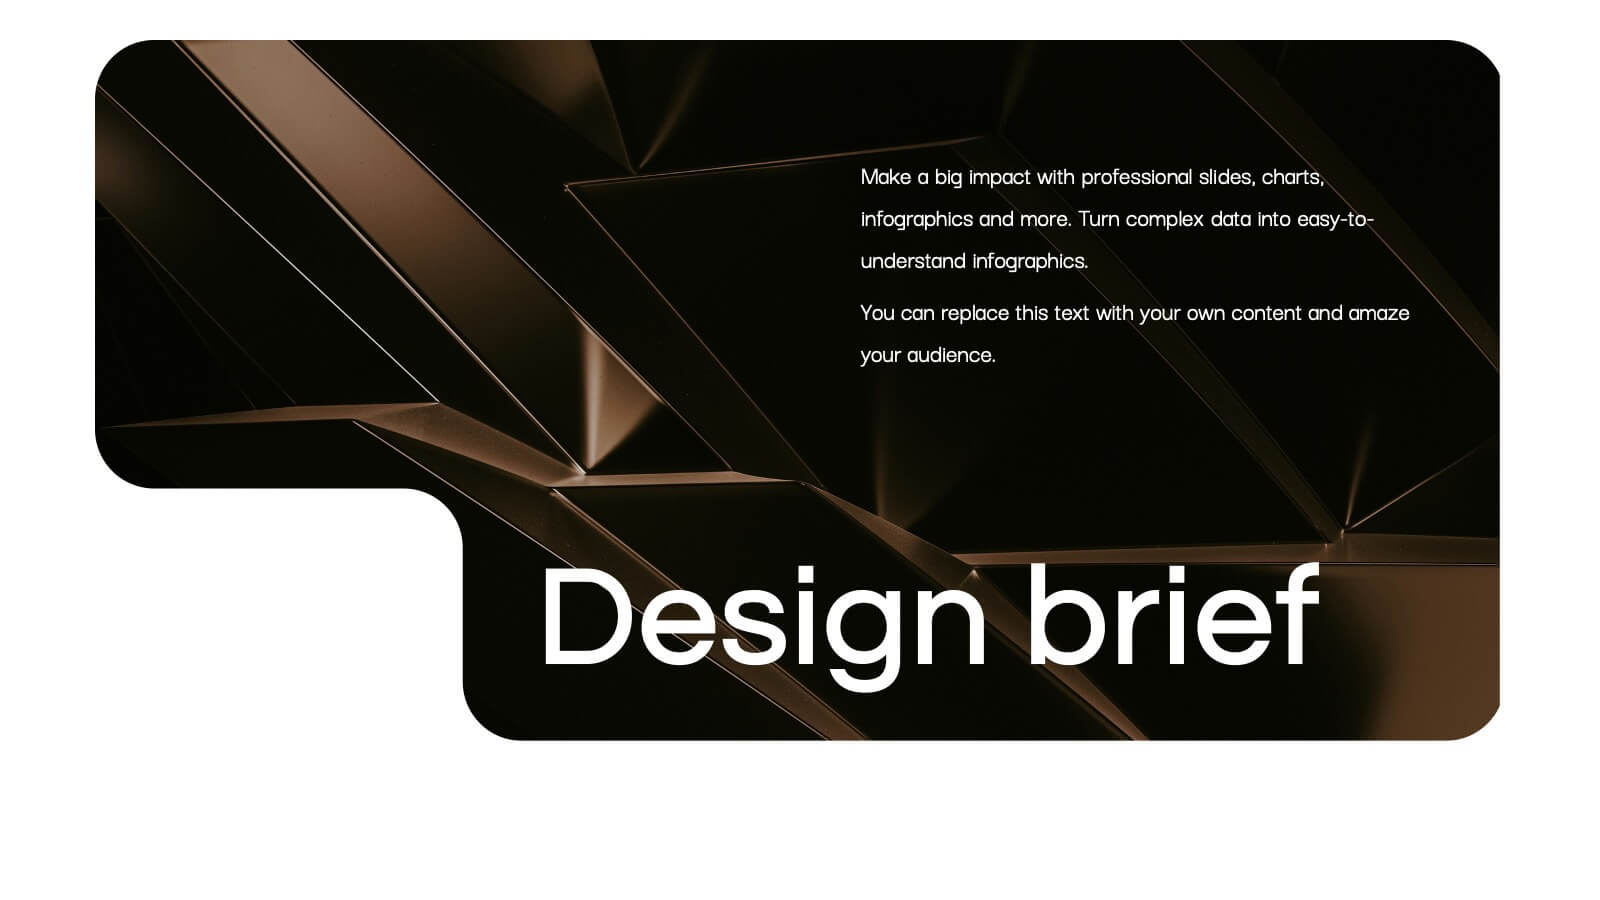
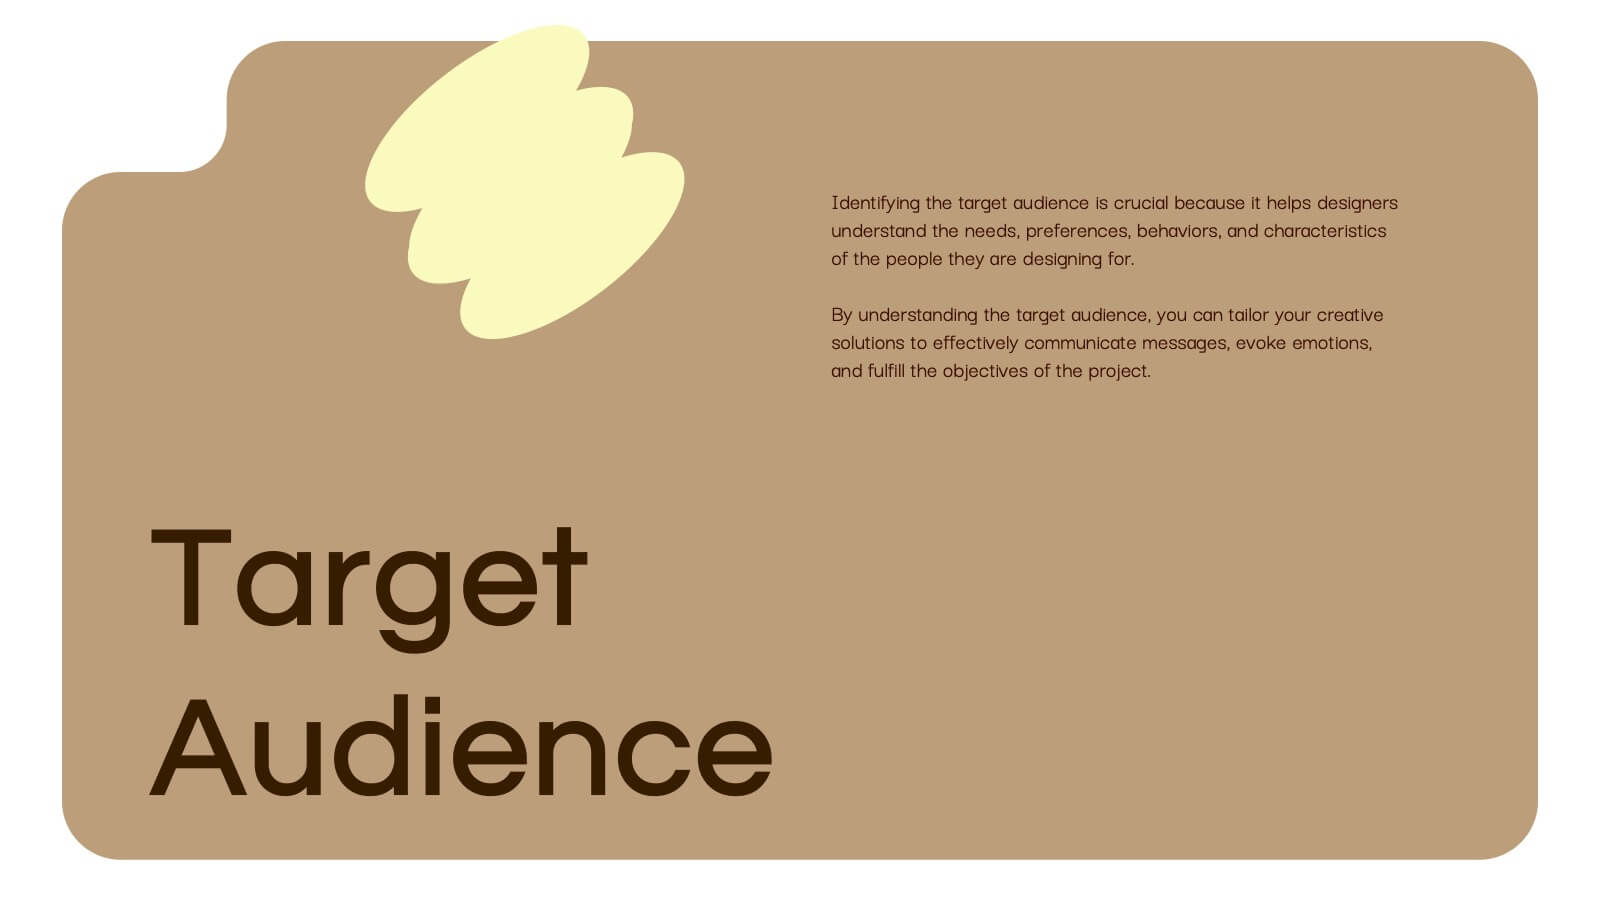
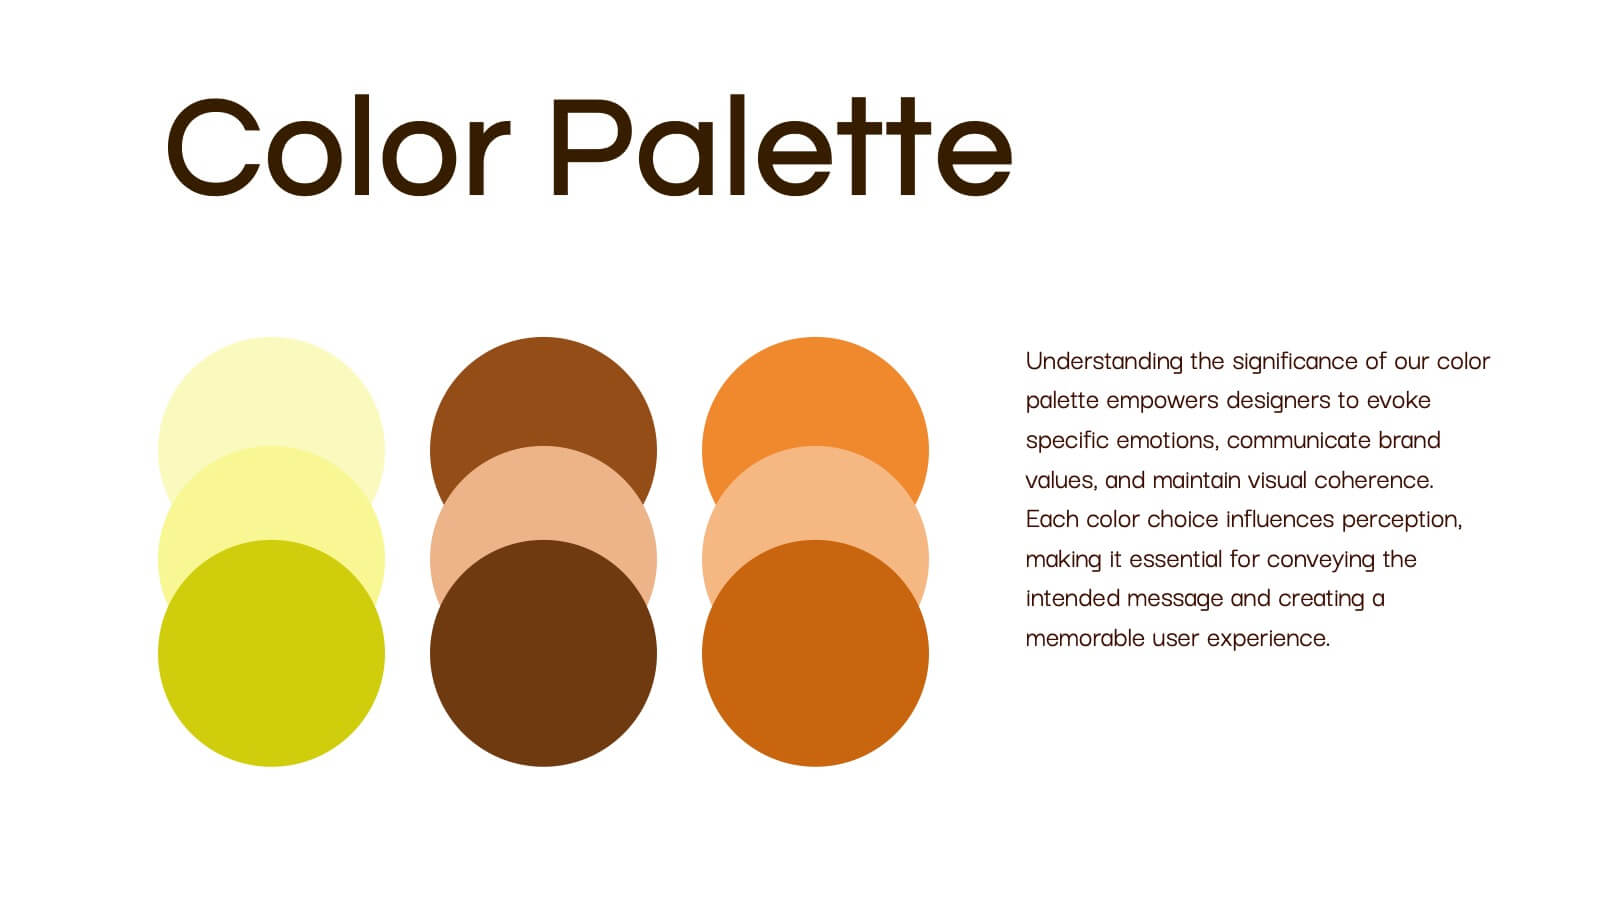
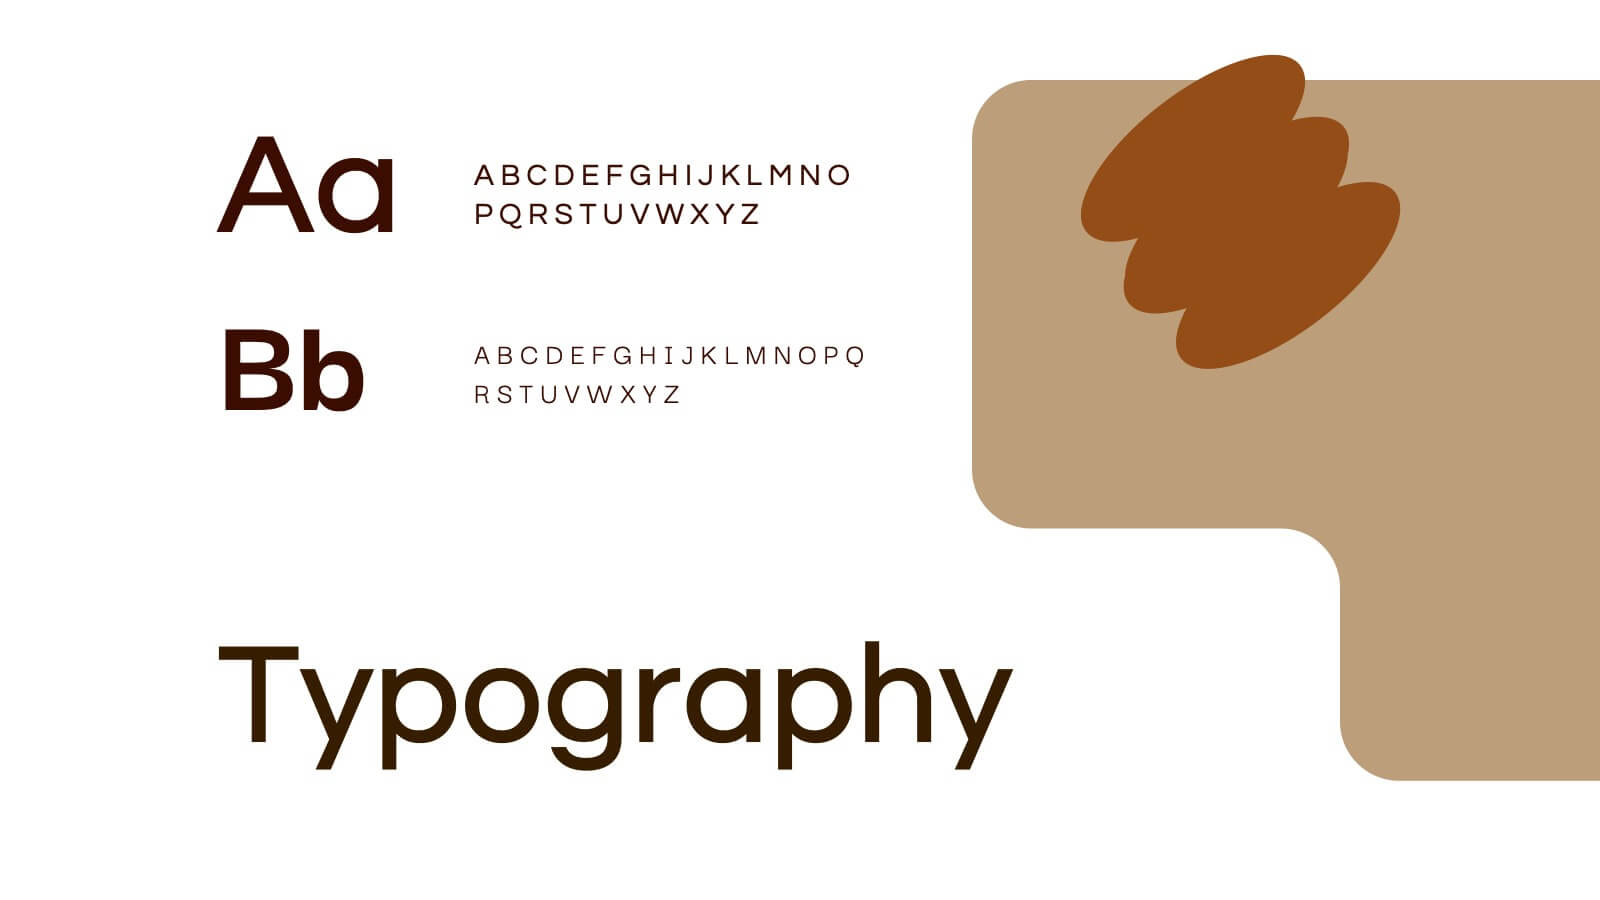
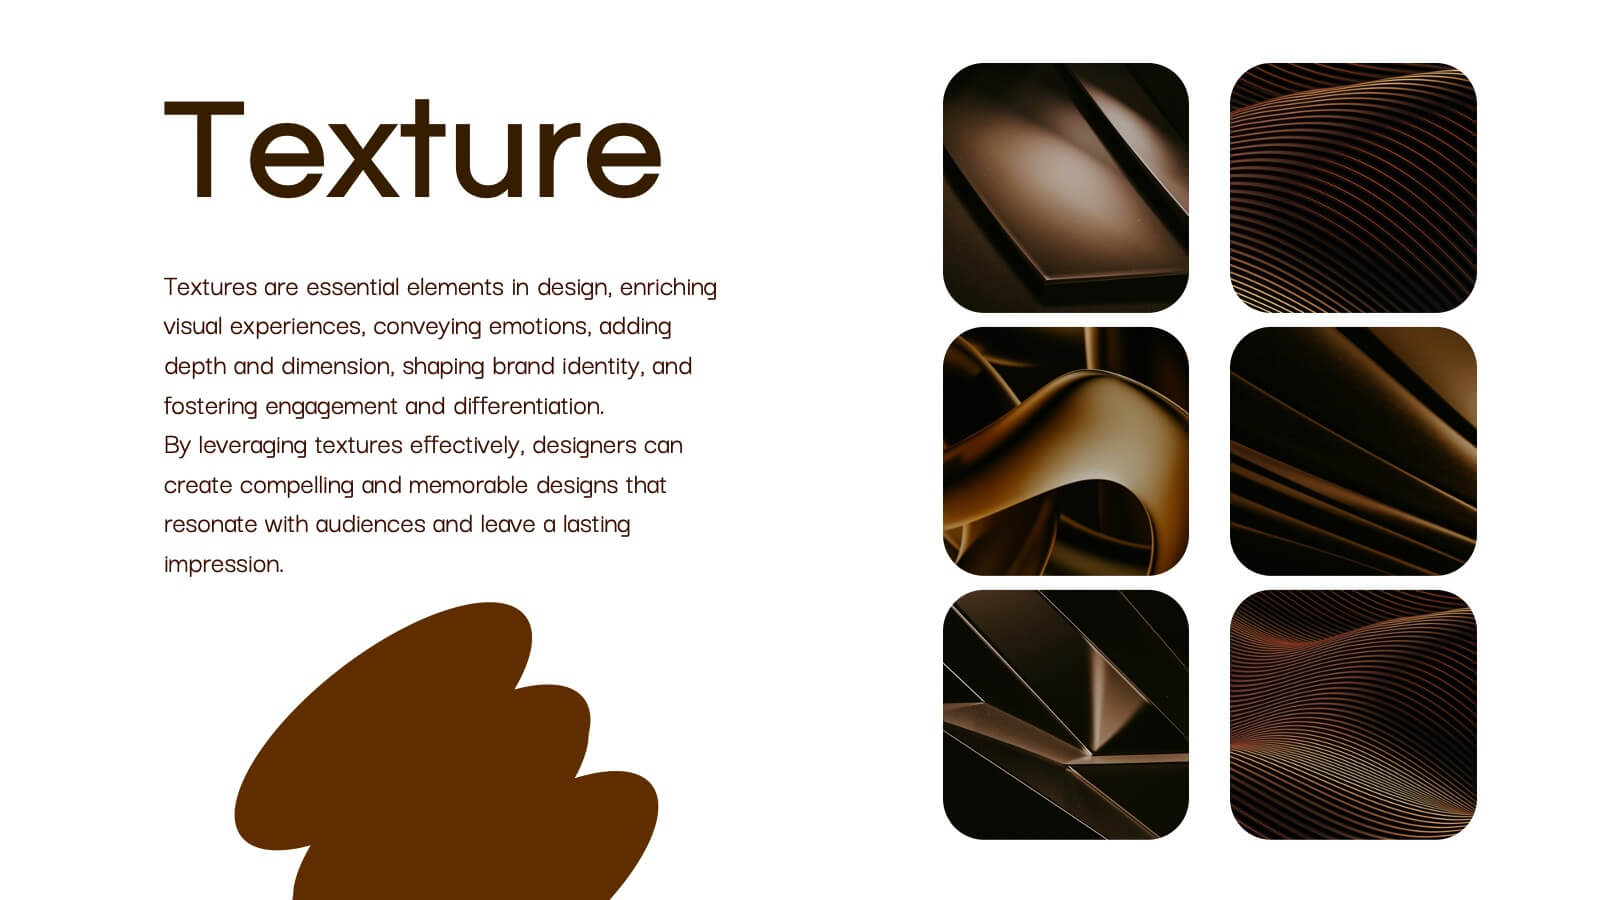
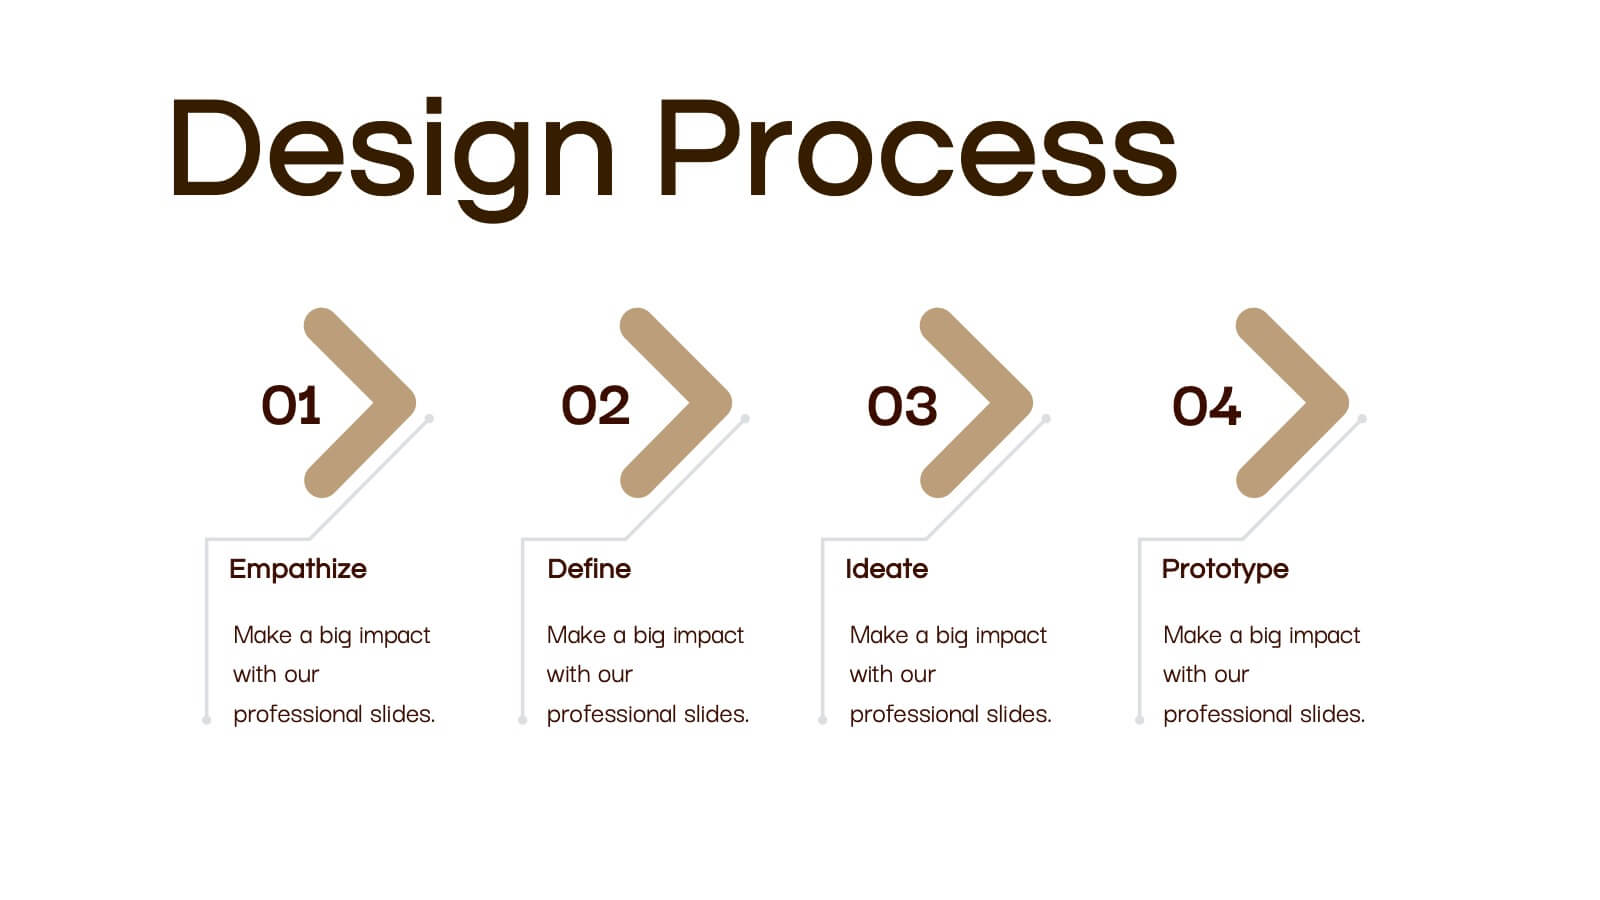
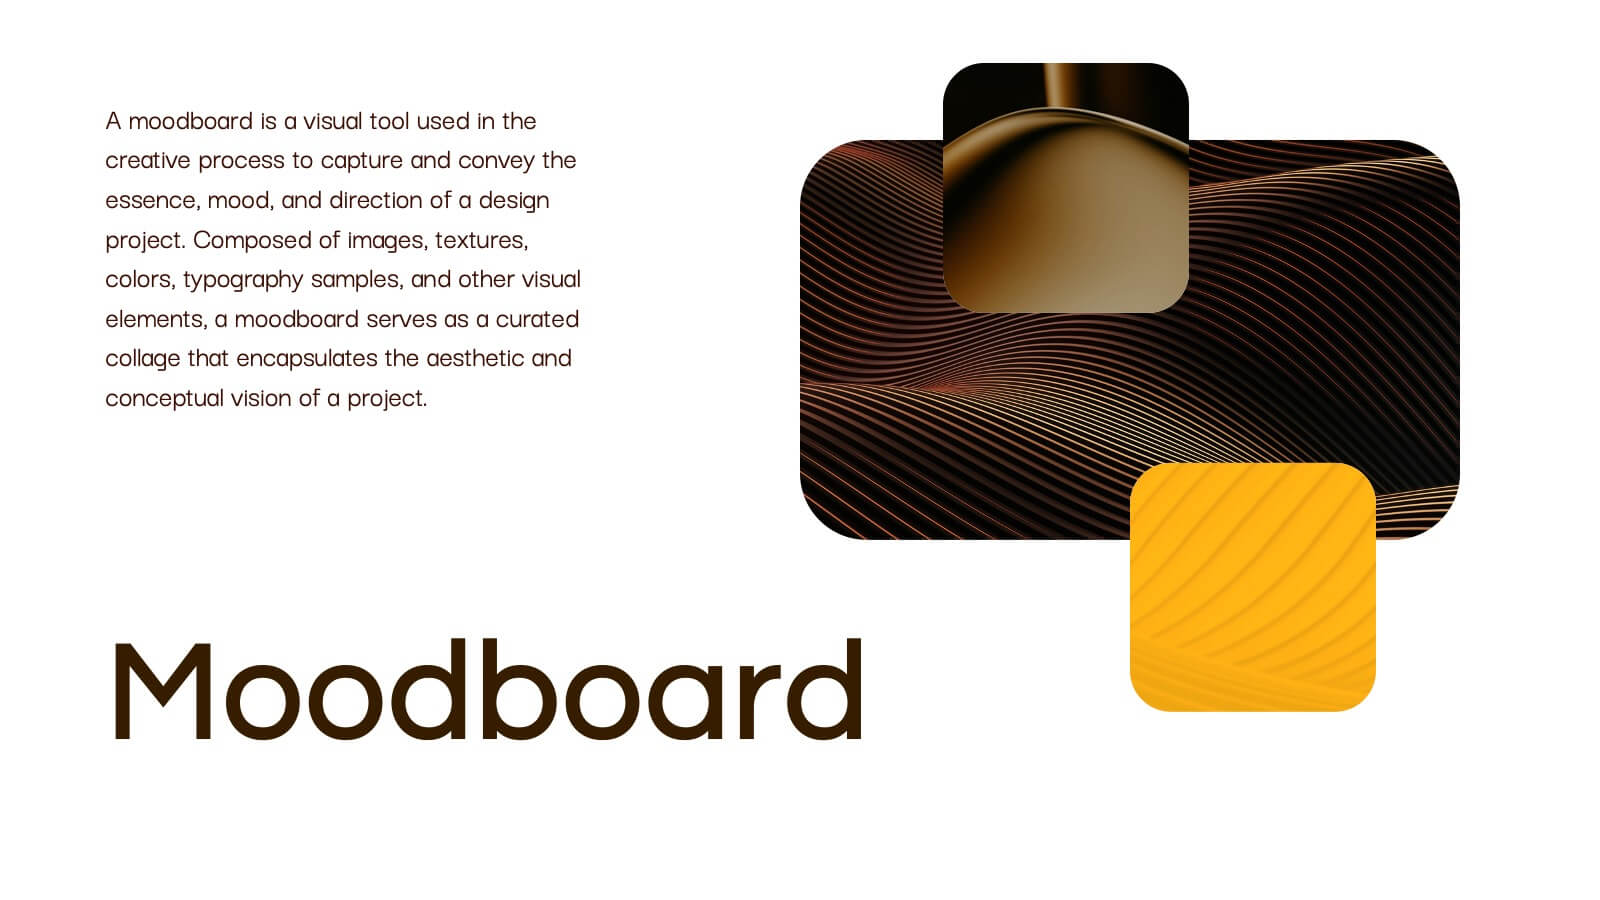
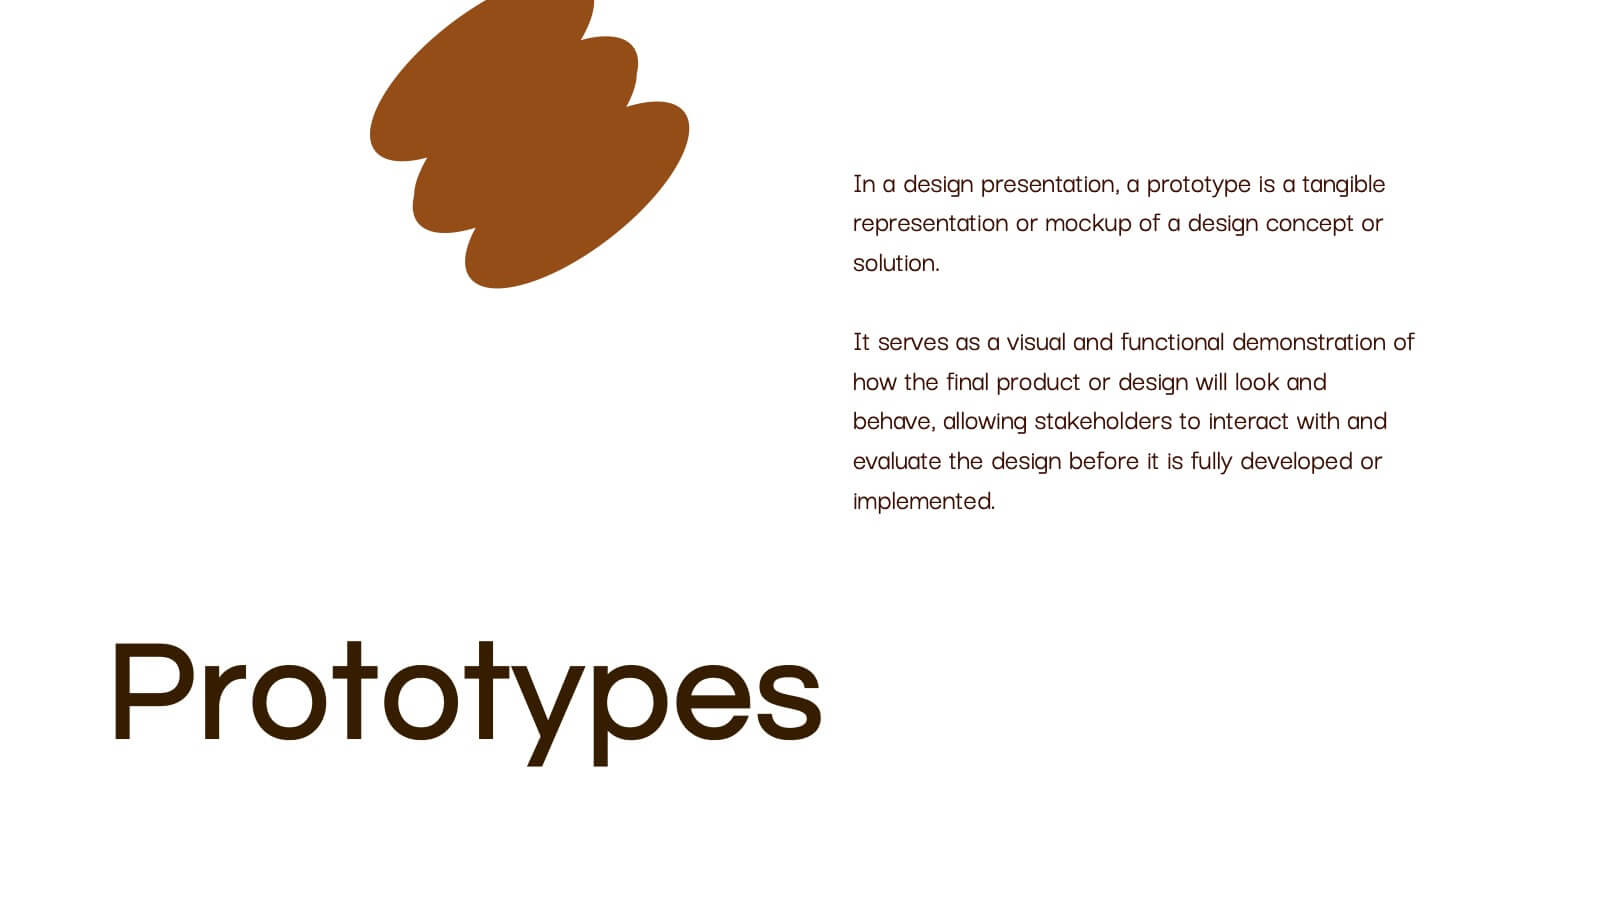
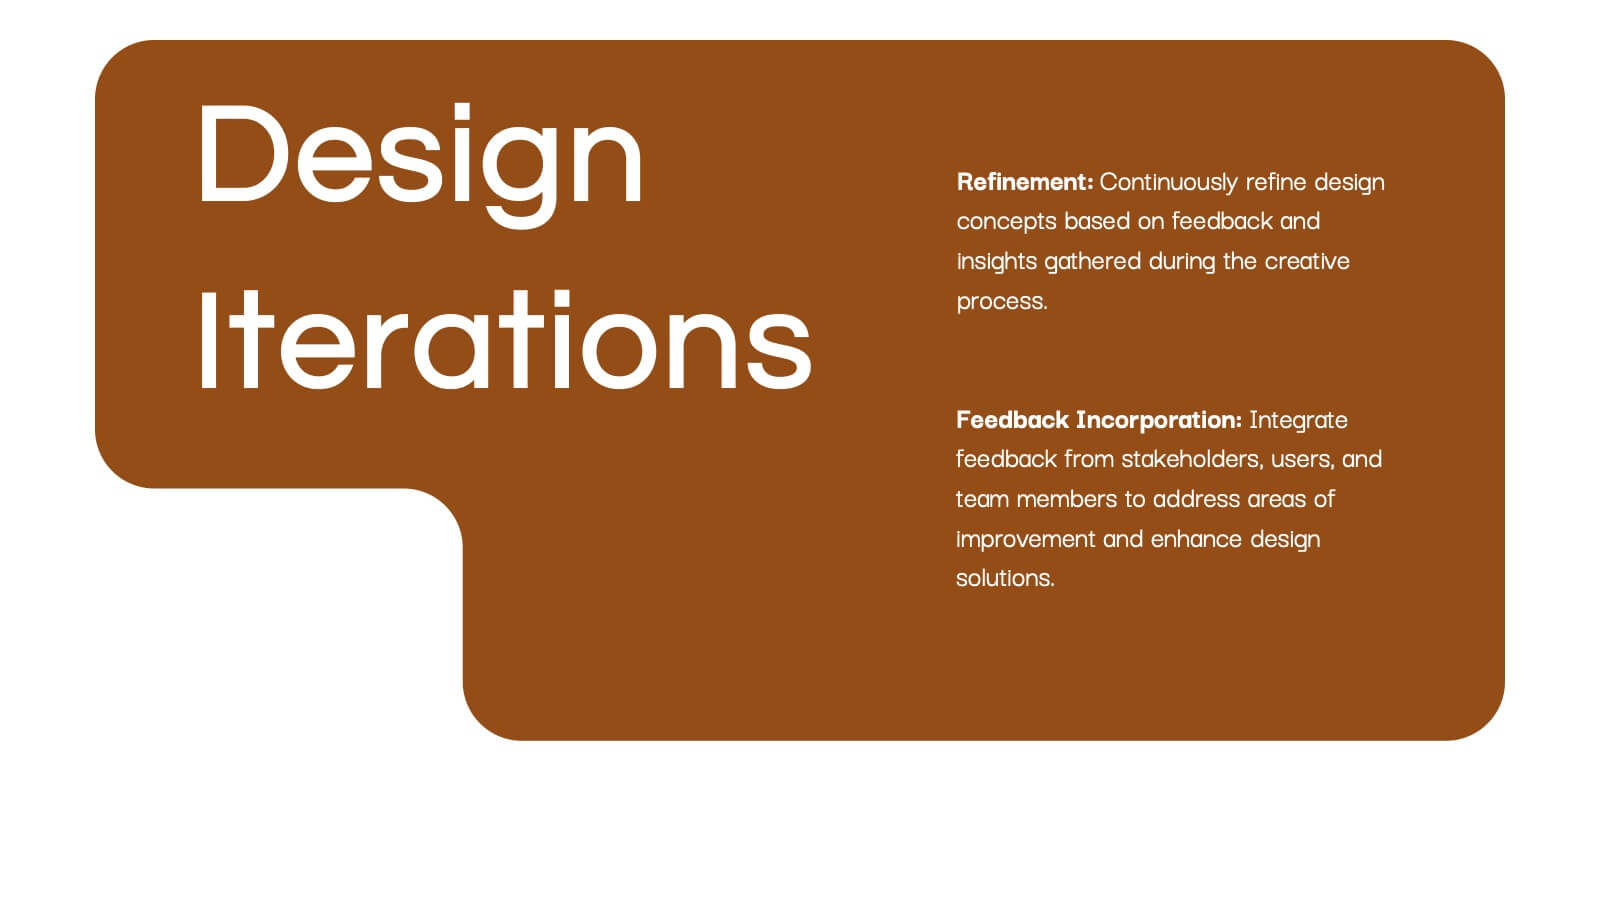
Obsidian Creative Design Report Presentation
Bring your creative vision to life with this stunning design presentation template! Perfect for showcasing your design process, from concept development and mood boards to typography and final assets. Ideal for creative professionals, this template offers clarity and style at every step. Compatible with PowerPoint, Keynote, and Google Slides, it’s your ultimate tool for design presentations.


6 diapositivas
Natural Food Infographics
The "Natural Food" infographic template is a fresh and appealing visual tool, meticulously designed for PowerPoint, Keynote, and Google Slides. This template is an excellent resource for nutritionists, food bloggers, and organic food marketers looking to present the benefits, sources, and variety of natural foods in an engaging manner. This template vividly showcases the spectrum of natural foods, including fruits, vegetables, grains, and proteins, emphasizing their health benefits, nutritional values, and sustainable sourcing. Its layout is perfect for educating audiences about healthy eating habits, organic farming, and the positive environmental impact of choosing natural foods. The design is as refreshing as the topic it represents, with a color scheme that is vibrant and earthy. This not only makes the presentation visually enticing but also resonates with the themes of health, vitality, and environmental consciousness. Whether used in a workshop, a marketing campaign, or an educational seminar, this template ensures that the wholesome goodness of "Natural Food" is presented in a visually stunning, informative, and appetizing manner.


21 diapositivas
Seaspray Design Proposal Presentation
Present your design proposal with confidence and clarity using this sleek, professionally crafted template. Tailored for designers and creatives, this presentation includes slides for a company overview, project summary, and a clear articulation of the problem statement with a proposed solution. Walk your audience through your objectives and goals, detailed scope of work, and structured methodology for implementation. Highlight key aspects with a timeline and milestones, and deliver value with dedicated slides for budget breakdowns and pricing structures. Build trust and credibility through client testimonials and showcase expertise with a team introduction. End your presentation with actionable next steps and a well-crafted conclusion to leave a lasting impact. Fully customizable for PowerPoint, Google Slides, and Keynote, this template is perfect for creative professionals aiming to win clients and projects with precision and style.


5 diapositivas
USA Trade Map Infographics
A USA Trade Map Infographic is a visual representation of the trade relationships that exist in the United States. This vertical infographic includes a vector or image of the United States map in a vertical orientation, with space for text or data to be included. This design features the maps in a bold, eye-catching color scheme allowing the data and text to stand out. The template also includes additional visual elements such as icons and illustrations to help present data and statistics related to different areas within the United States. Use this to present demographic data, election results, economic indicators, or travel and tourism information.


6 diapositivas
Agile Delivery Framework for Projects Presentation
Visualize agile project phases with this spiral delivery framework slide. Ideal for project managers and scrum teams to outline each step in a continuous delivery process. Features six clearly labeled stages, icons, and bold colors. Fully editable in PowerPoint, Keynote, and Google Slides for clear, structured agile workflow presentations.


8 diapositivas
Economic Impact on Stock Market Presentation
Illuminate your financial presentation with the "Economic Impact on Stock Market" template, ideal for displaying the interconnected influences of economic variables on market performance. These slides feature clear, visual representations through pie charts and percentage indicators, allowing for an engaging analysis of trends and impacts. This template is fully compatible with PowerPoint, Keynote, and Google Slides, ensuring versatility across different presentation platforms.


7 diapositivas
Lean Business Model Infographic
Step into the dynamic world of lean startup methodology with our lean business model infographic. Utilizing a striking palette of oranges, blacks, and other vivid colors, this infographic simplifies the intricate components of the lean canvas. It's an invaluable asset for entrepreneurs, business educators, and startup enthusiasts. By offering a bird's-eye view of a startup's proposition, it ensures stakeholders align their strategies efficiently. Regardless of the platform - be it PowerPoint, Keynote, or Google Slides - this infographic seamlessly adapts, enhancing your presentation's professional appeal.


6 diapositivas
Editable Puzzle Infographic
Piece together complex data with our Editable Puzzle Infographic, compatible with Powerpoint, Google Slides, and Keynote. This engaging infographic is designed to help presenters visually connect different pieces of information in a cohesive and understandable way. The puzzle pieces are a metaphor for how individual components fit into a larger strategy or concept, making it perfect for collaborative projects or educational models. The infographic is fully customizable, allowing you to adapt the colors, text, and arrangement to fit your specific needs. With this puzzle infographic, you can make your presentations more interactive ensuring your audience can see the big picture every time.


10 diapositivas
Cryptocurrency Market Trends
Highlight key movements in the crypto space with this 5-step 3D bar chart layout. Ideal for financial analysts, fintech startups, and blockchain professionals. Fully editable in PowerPoint, Keynote, or Google Slides—customize colors, text, and data to reflect your insights with precision.


5 diapositivas
4-Stage Gap Identification Presentation
A clear, engaging way to map progression, this presentation helps you illustrate each stage of identifying business gaps with structure and clarity. It guides audiences through challenges, priorities, and opportunities in a simple step-by-step flow that’s easy to follow and present. Fully compatible with PowerPoint, Keynote, and Google Slides.


3 diapositivas
Short-Term and Long-Term Action Goals Presentation
Plan with purpose using the Short-Term and Long-Term Action Goals Presentation. This clear, side-by-side layout helps you organize initiatives by timeframe—perfect for project planning, strategy roadmaps, or goal tracking. Fully editable in Canva, PowerPoint, and Google Slides for easy customization across teams and presentations.