


Características


¿Tienes alguna pregunta?
Recomendar


20 diapositivas
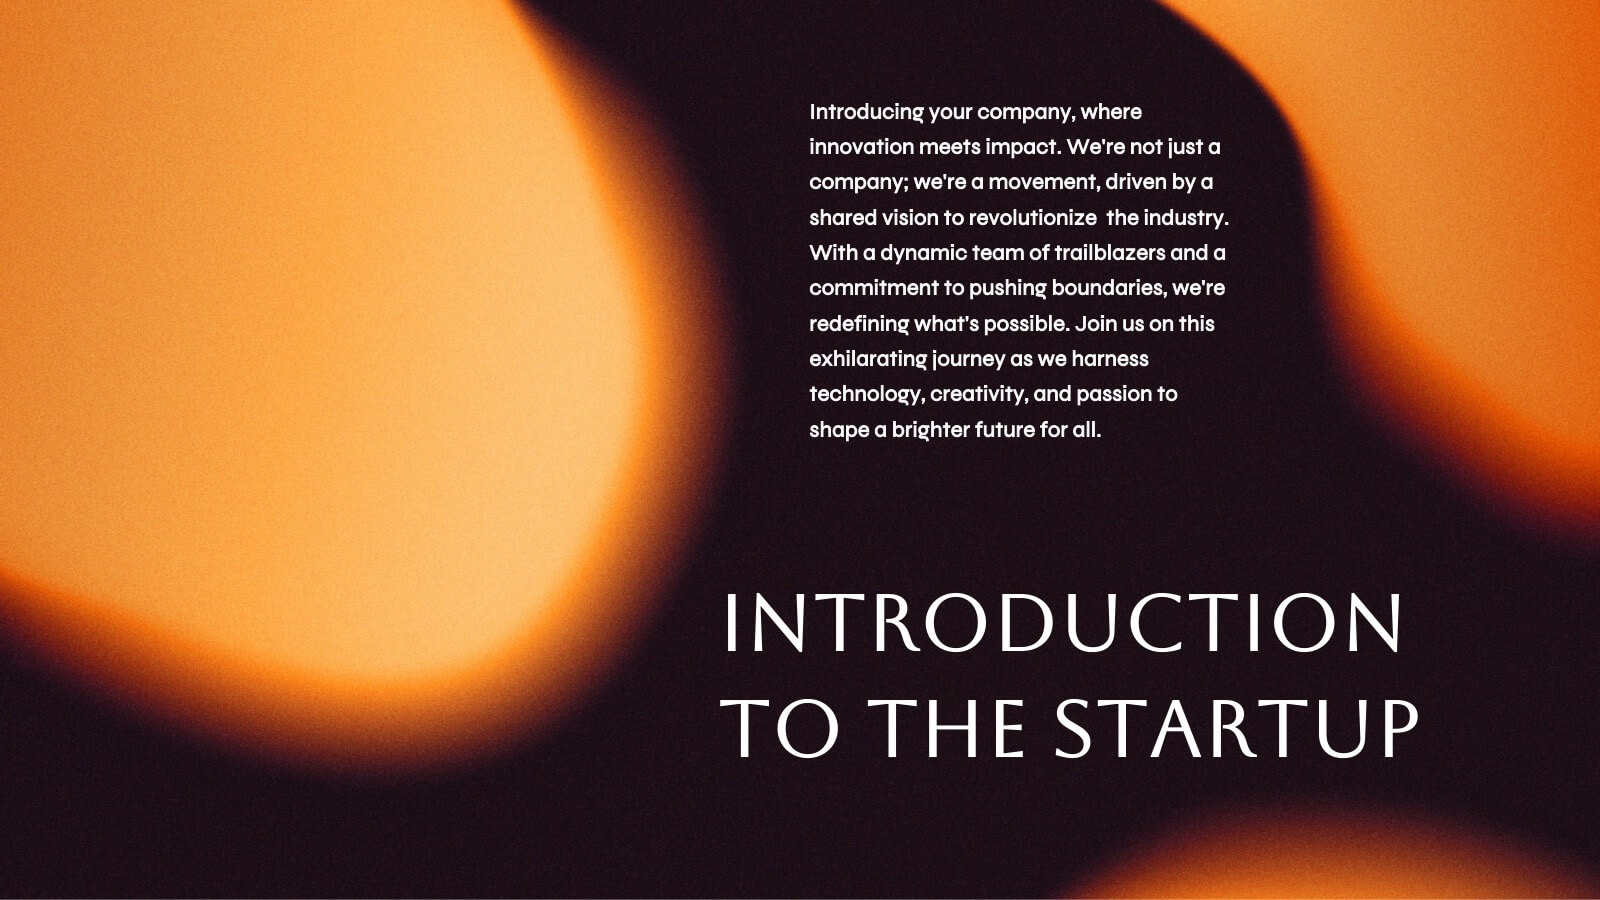
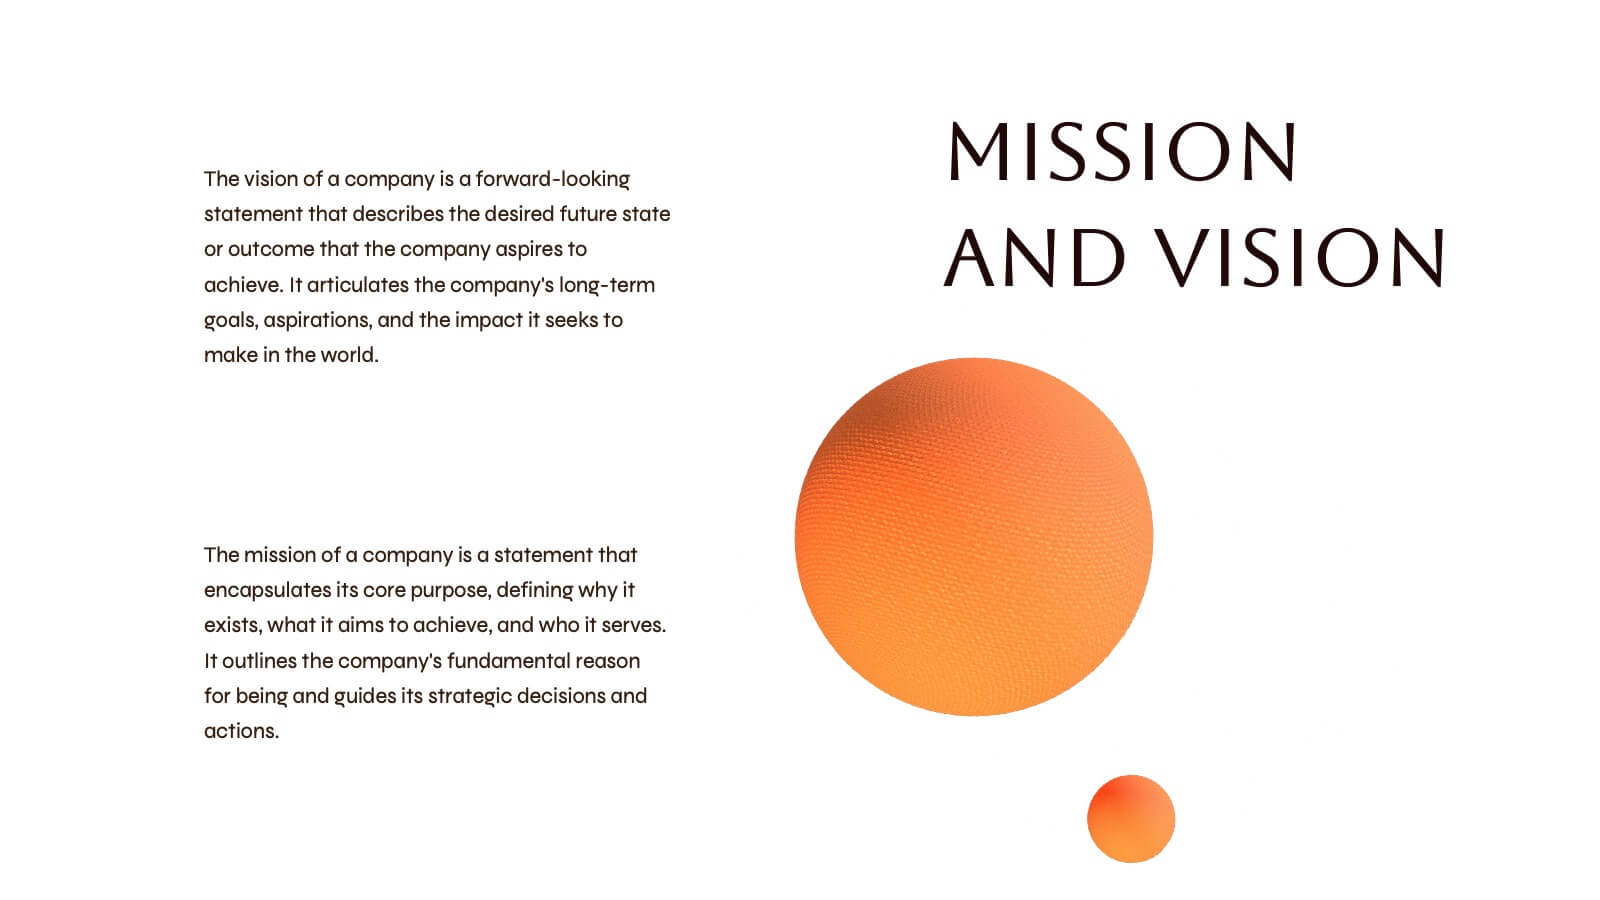
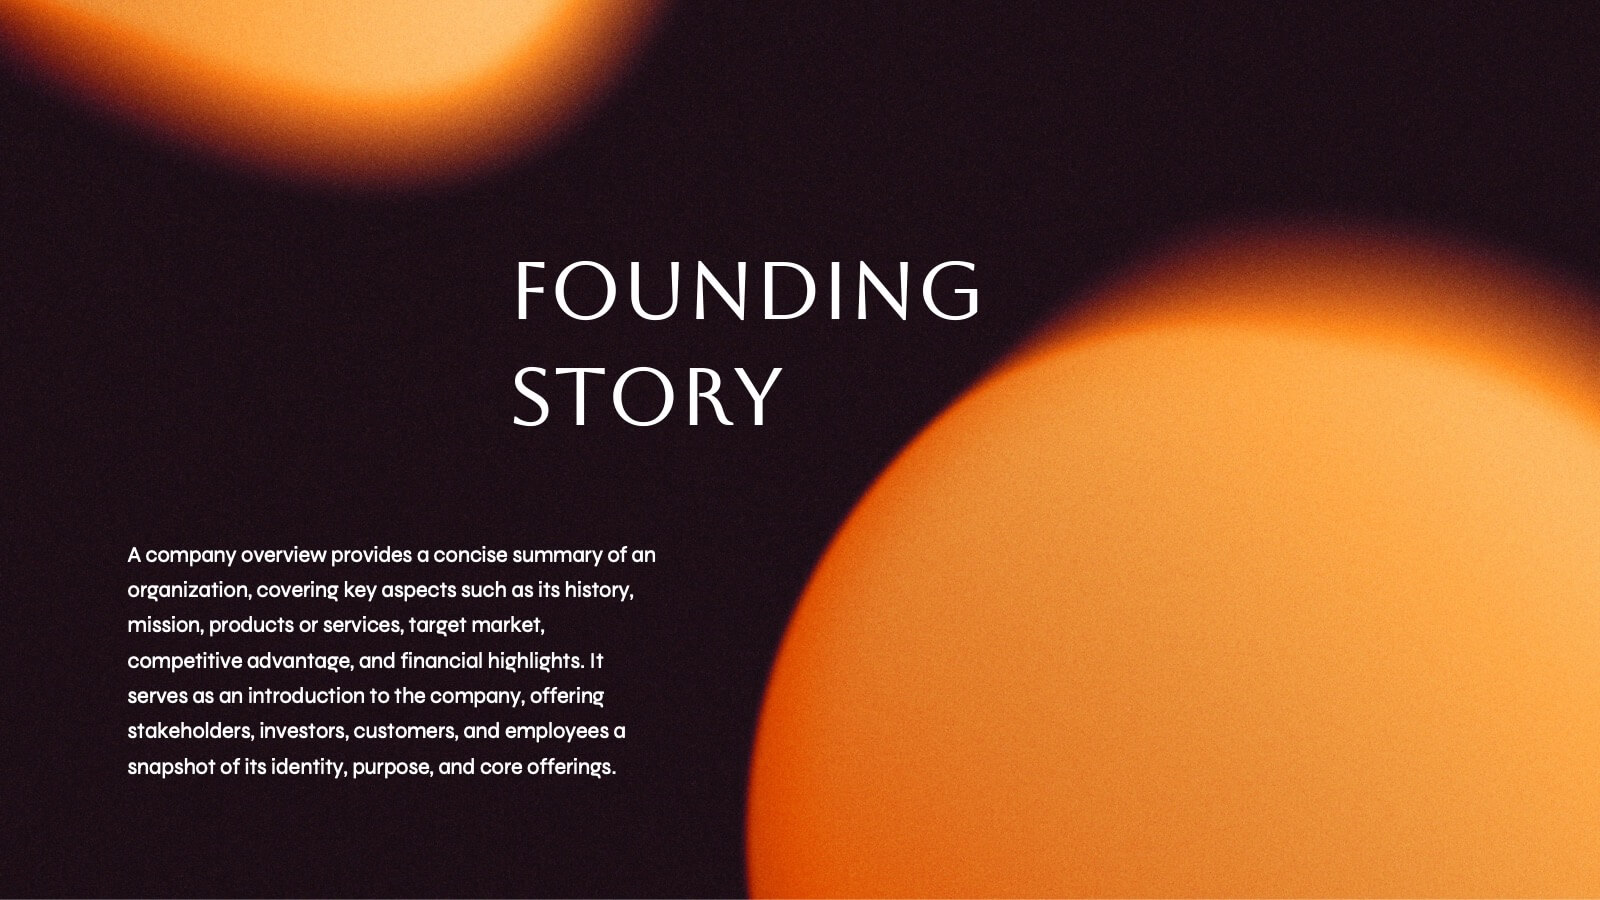
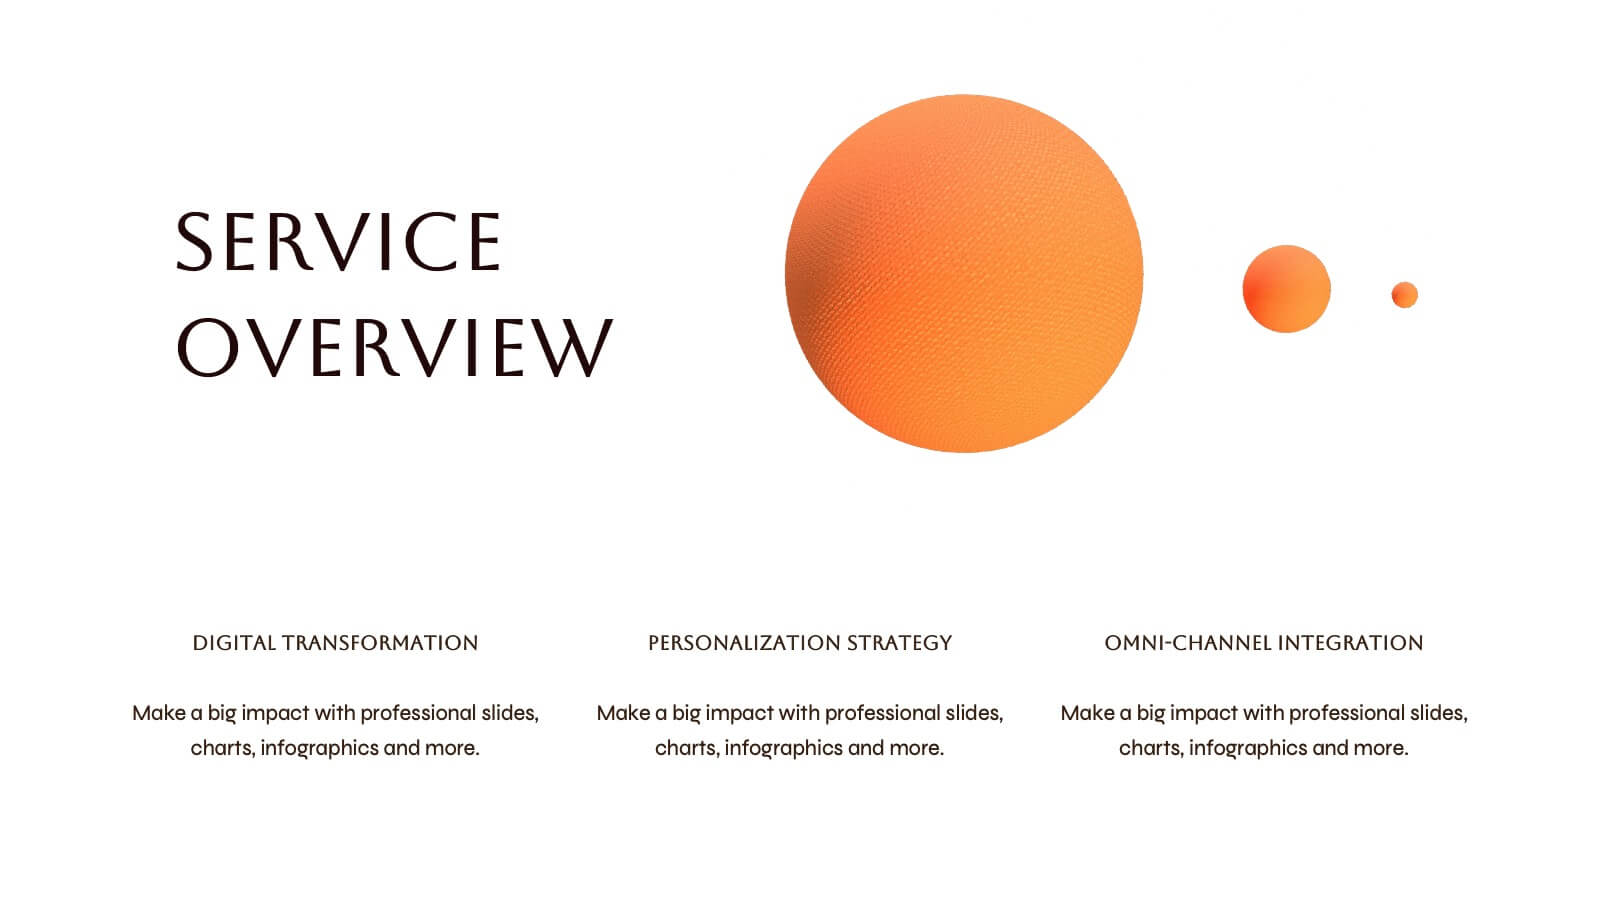
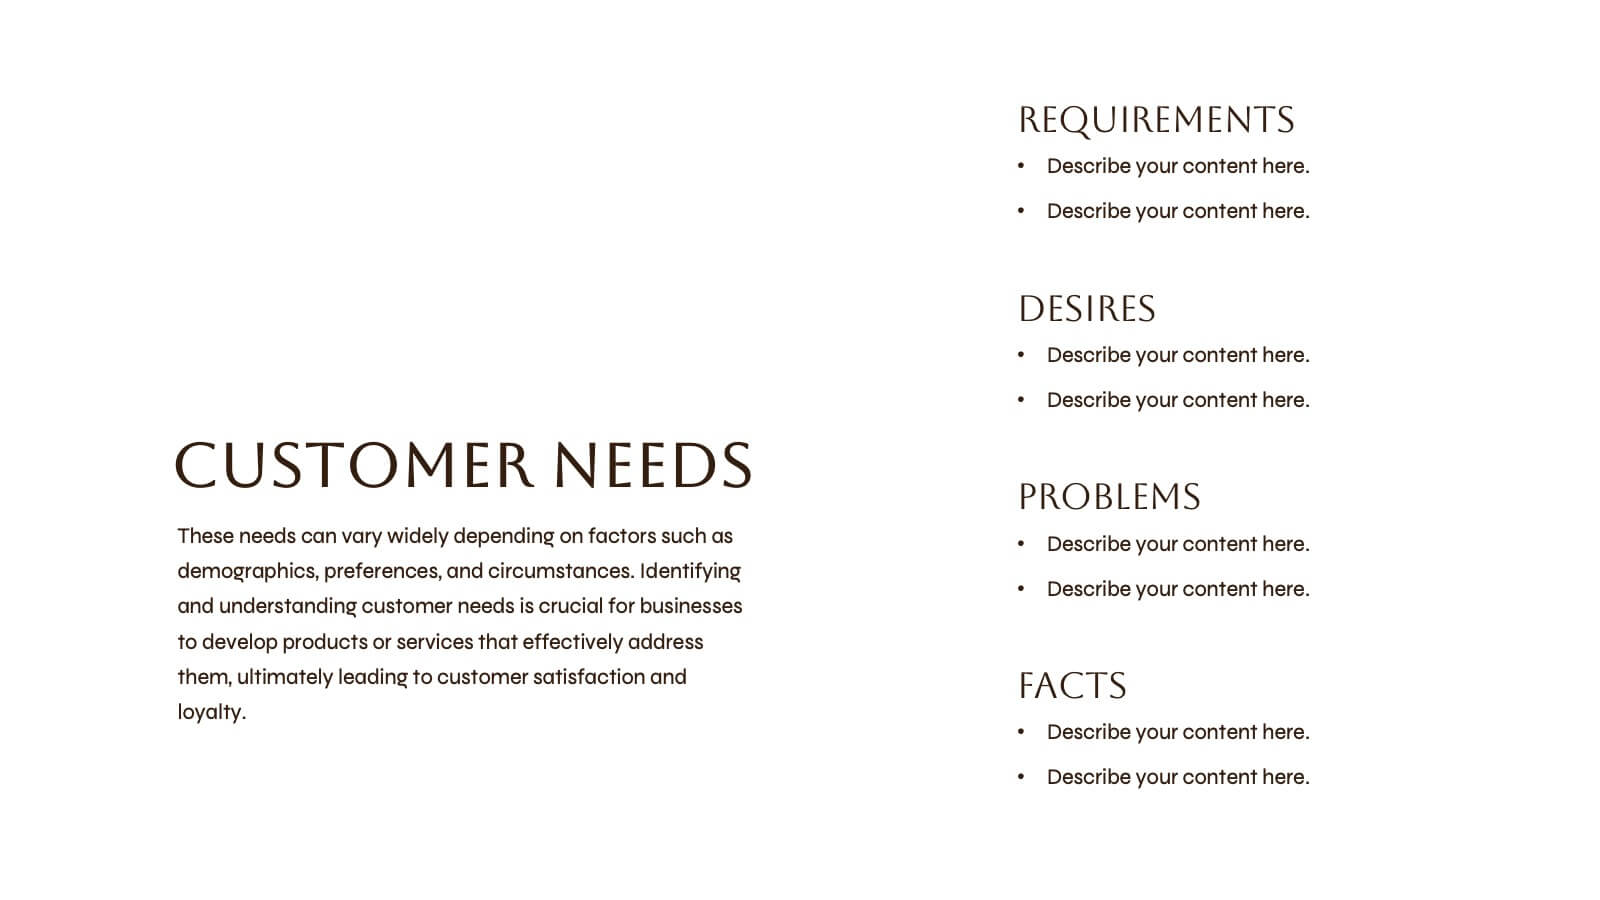
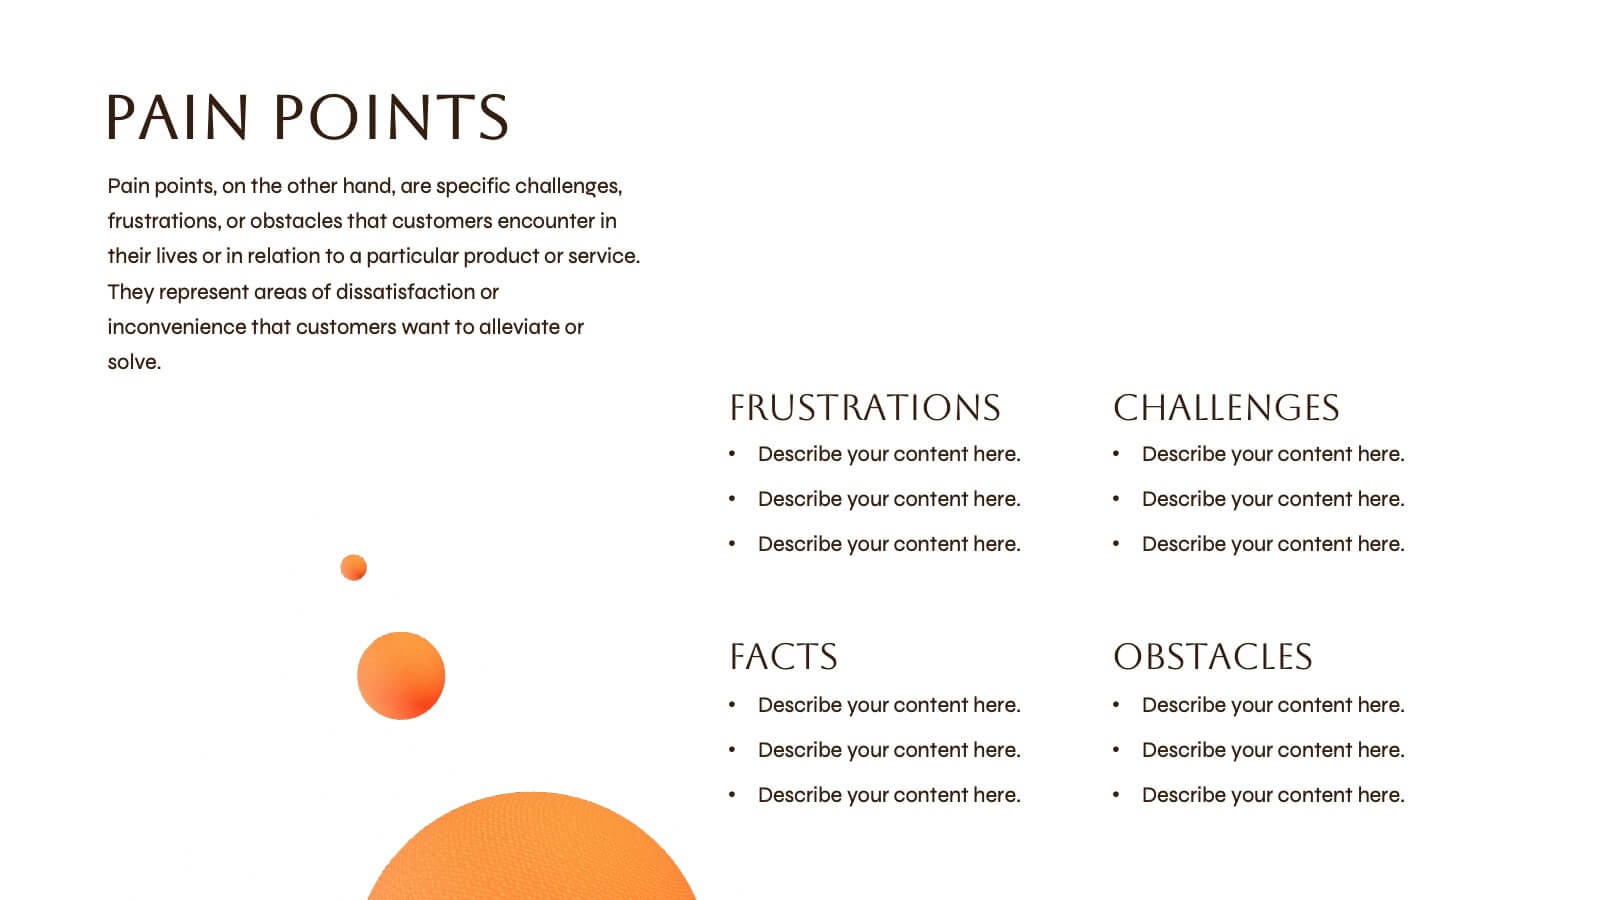
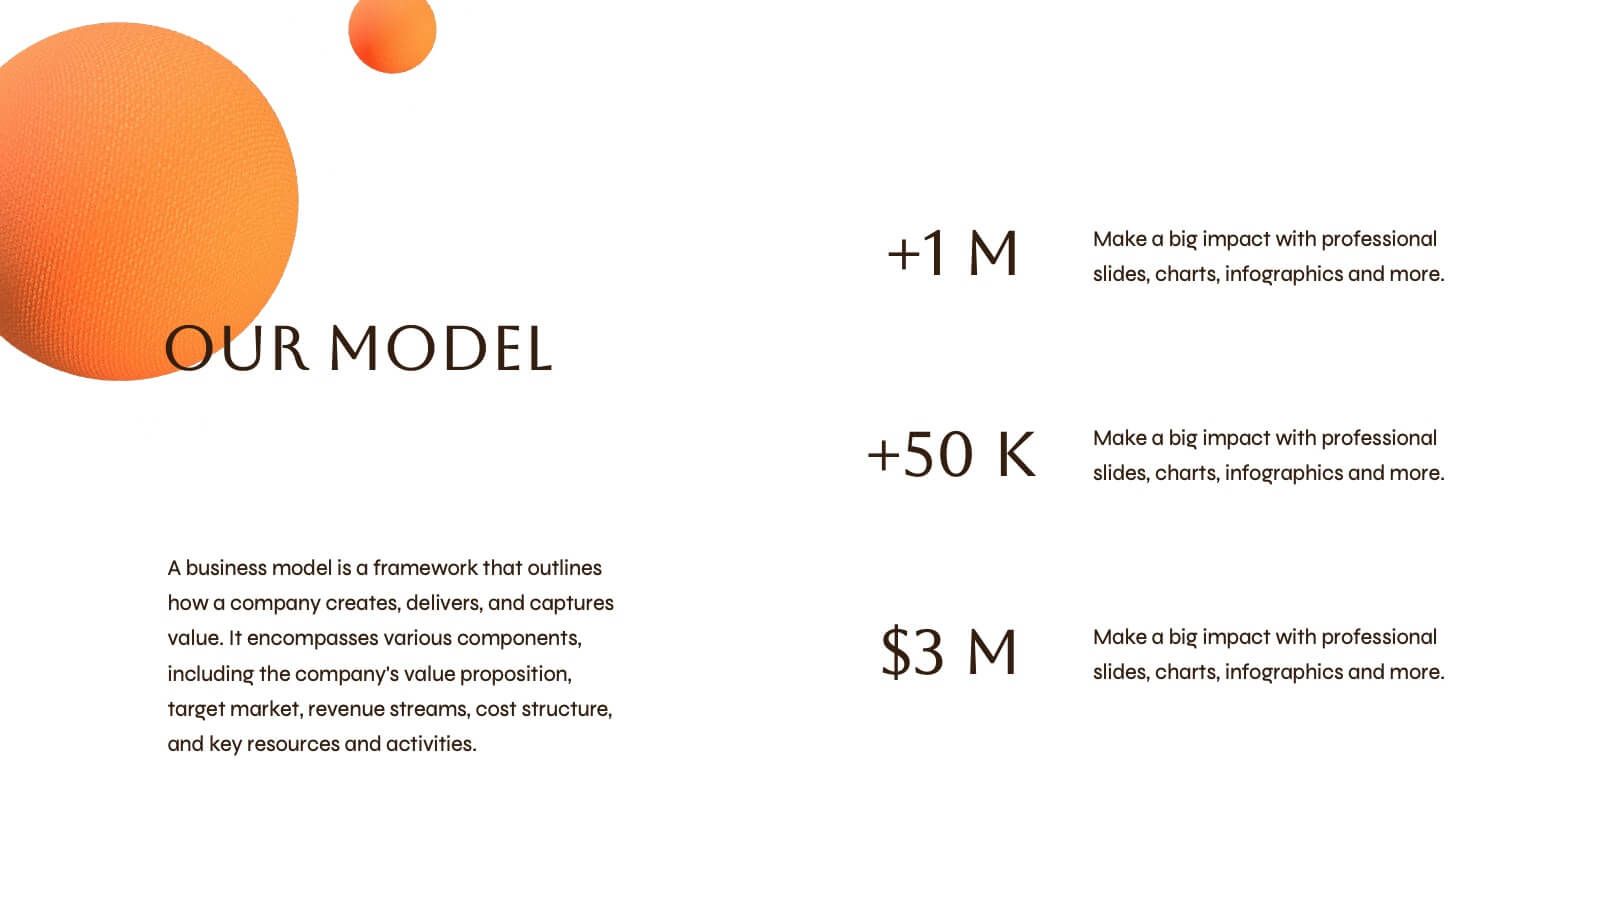
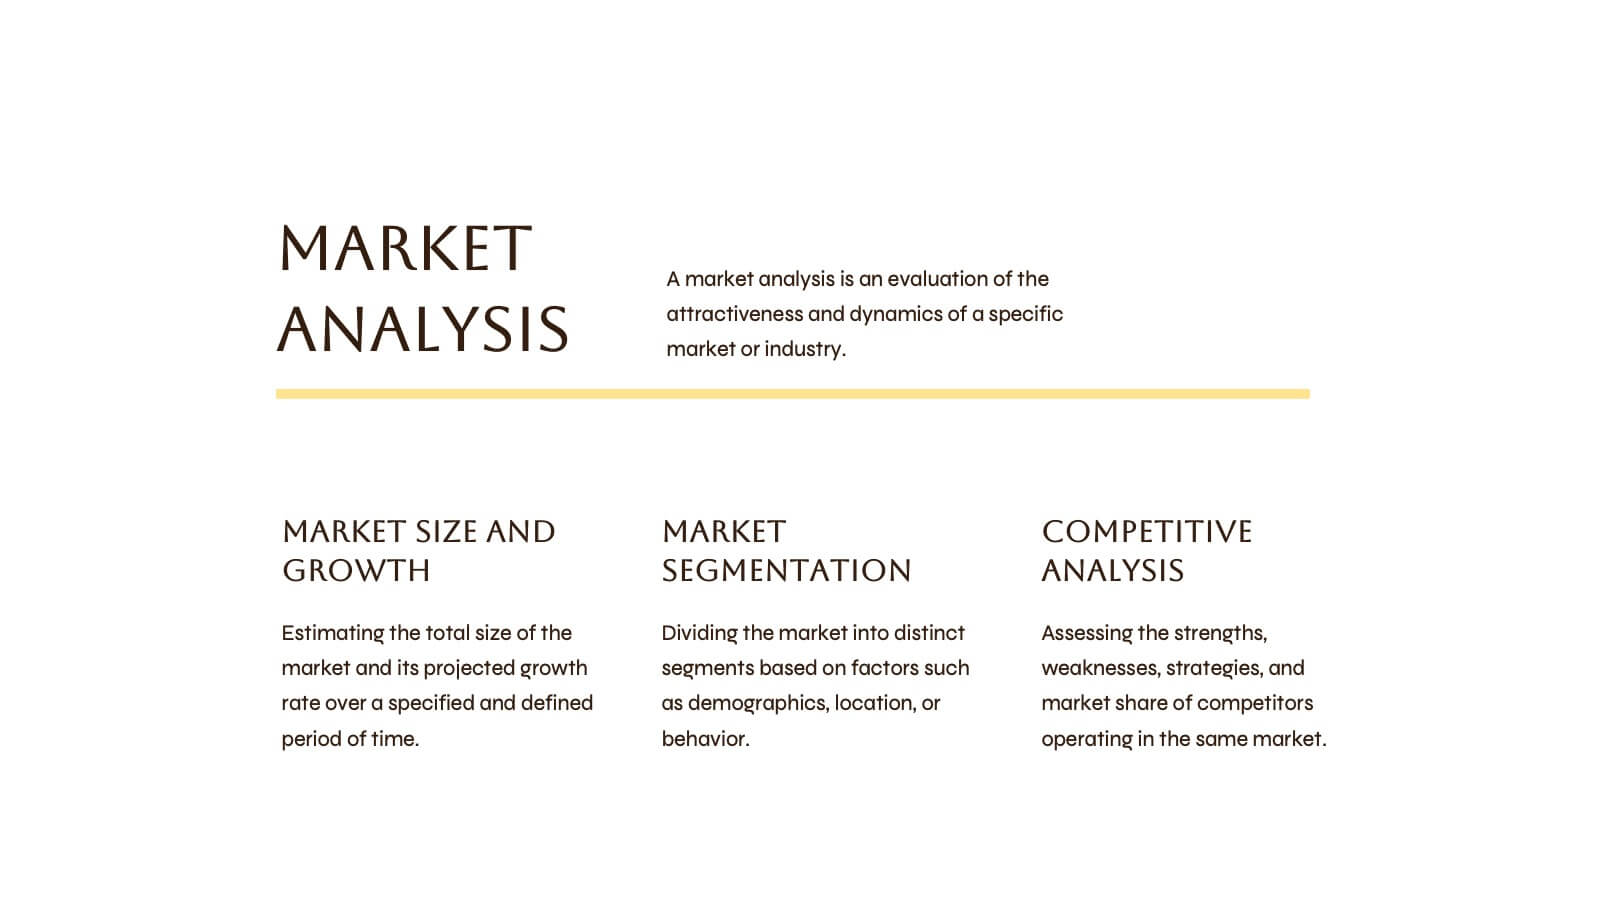
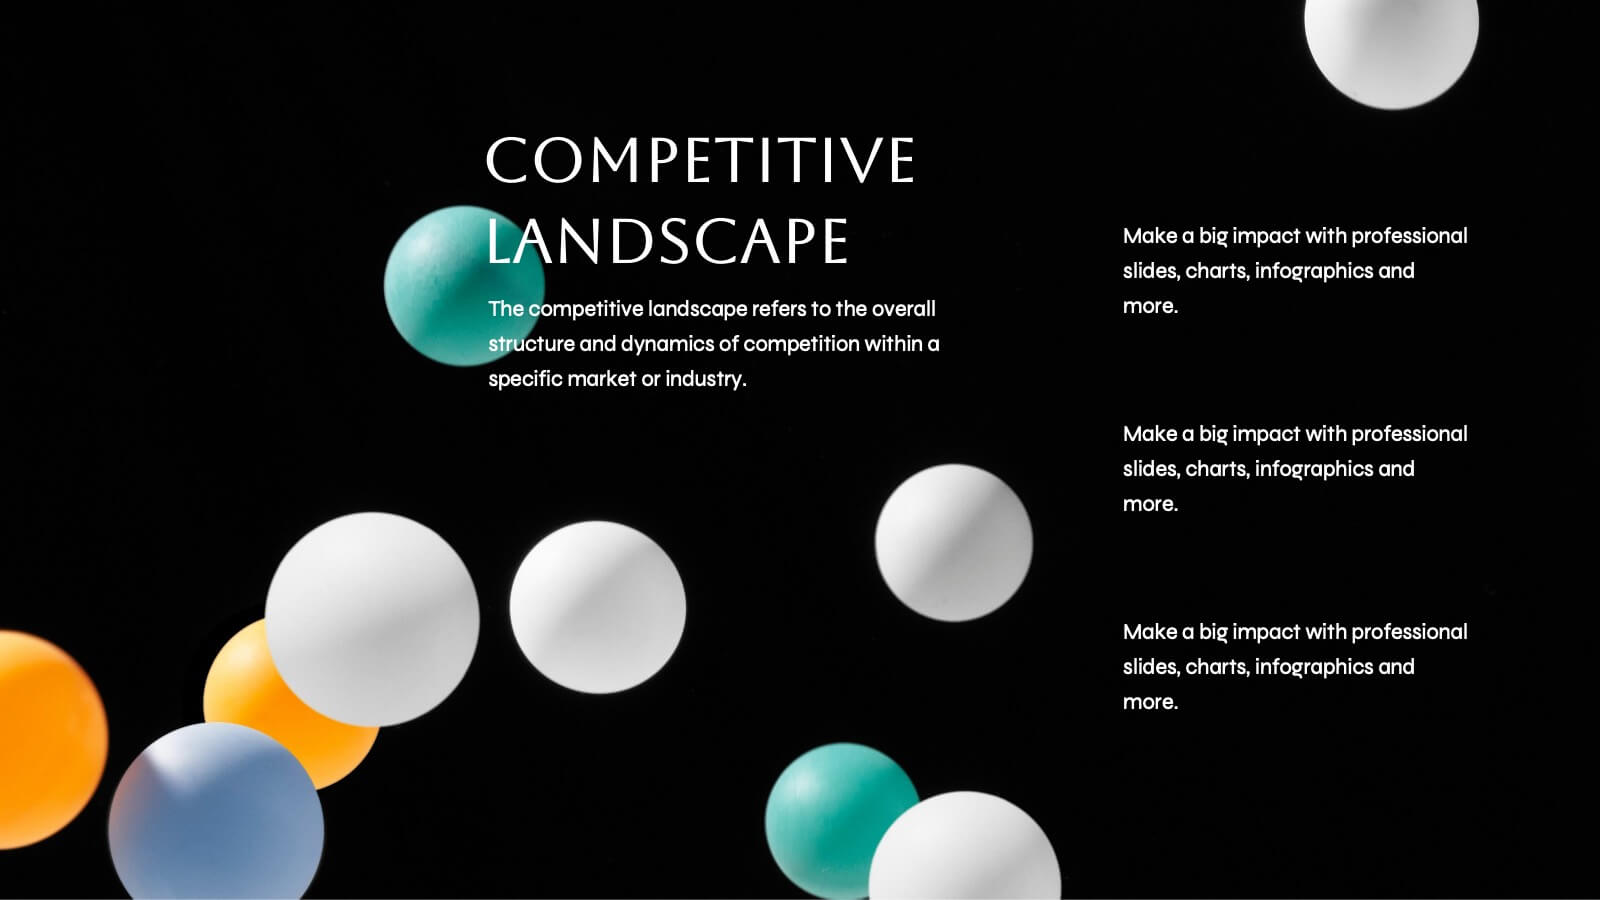
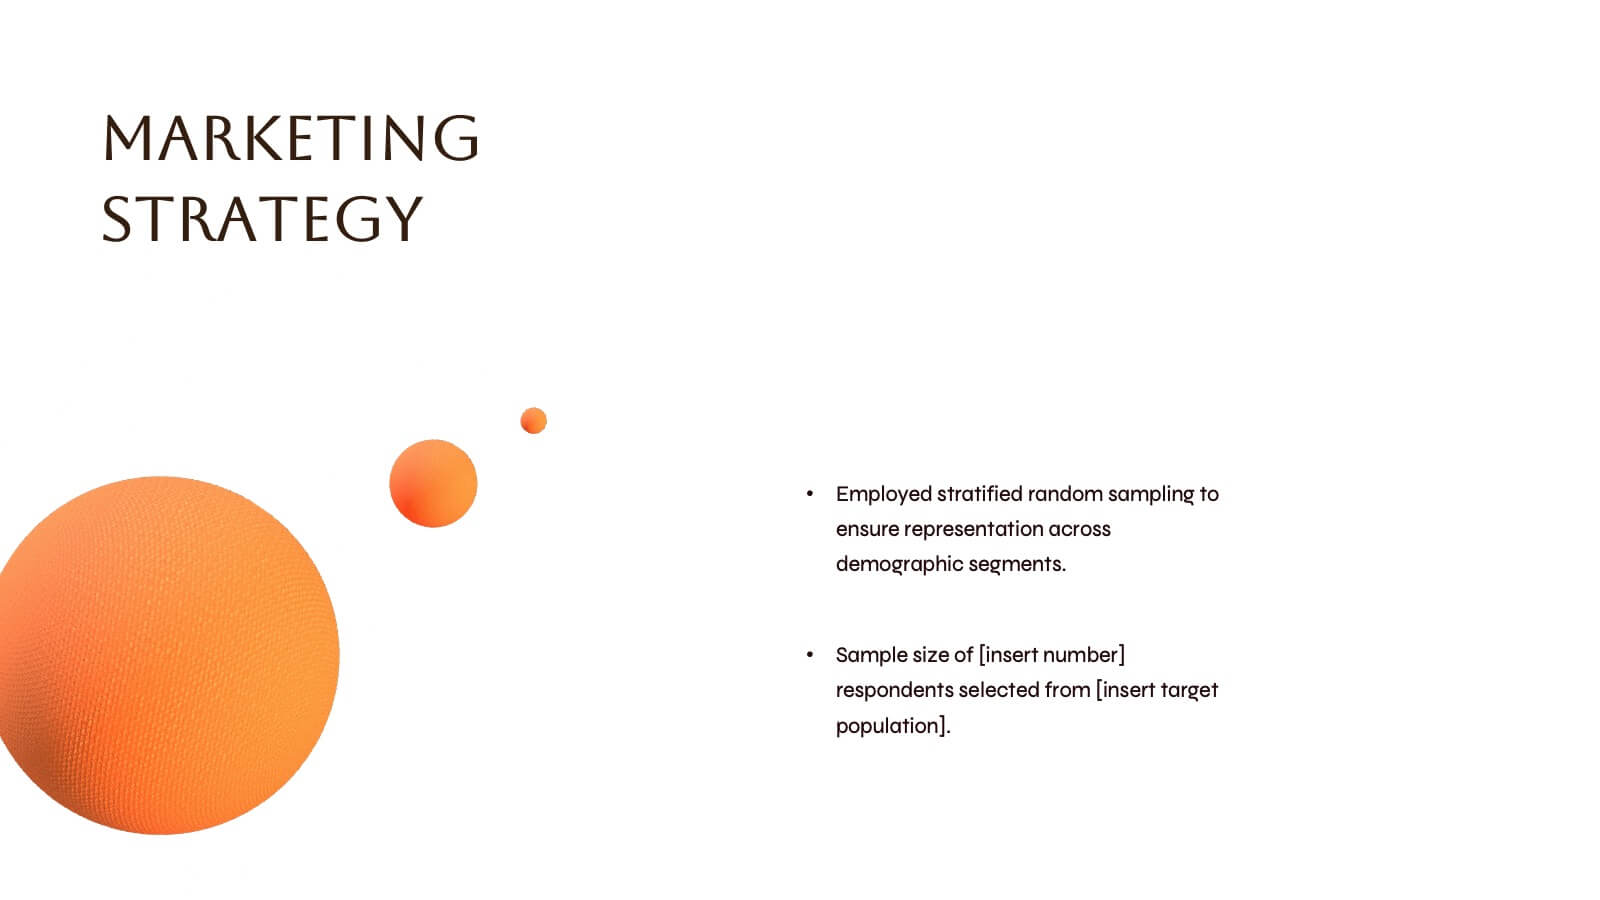
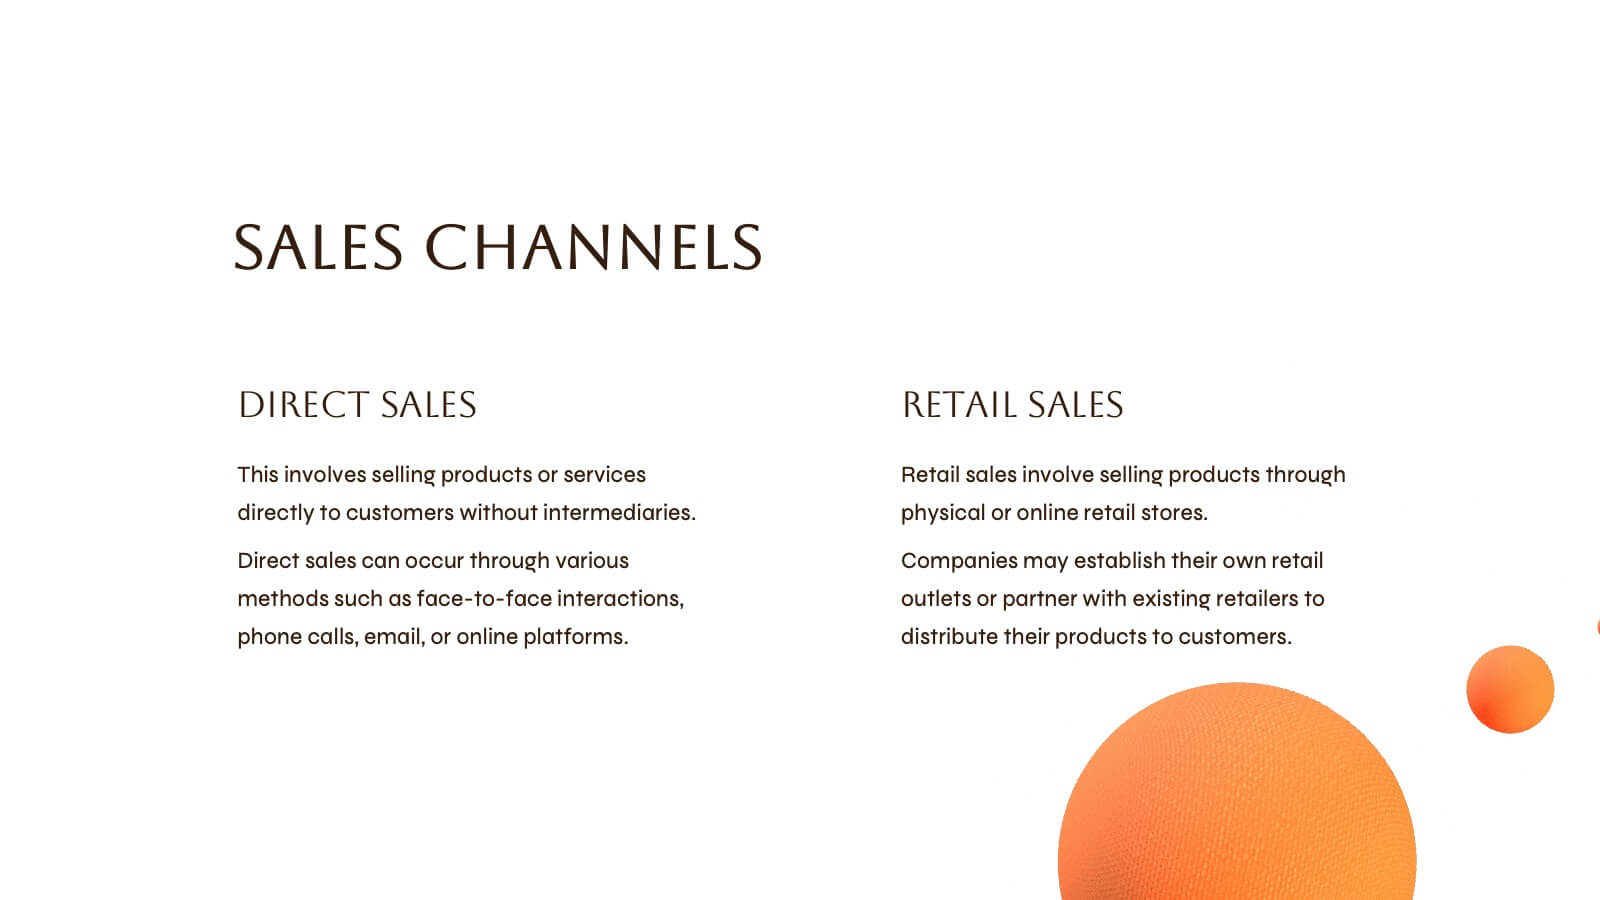
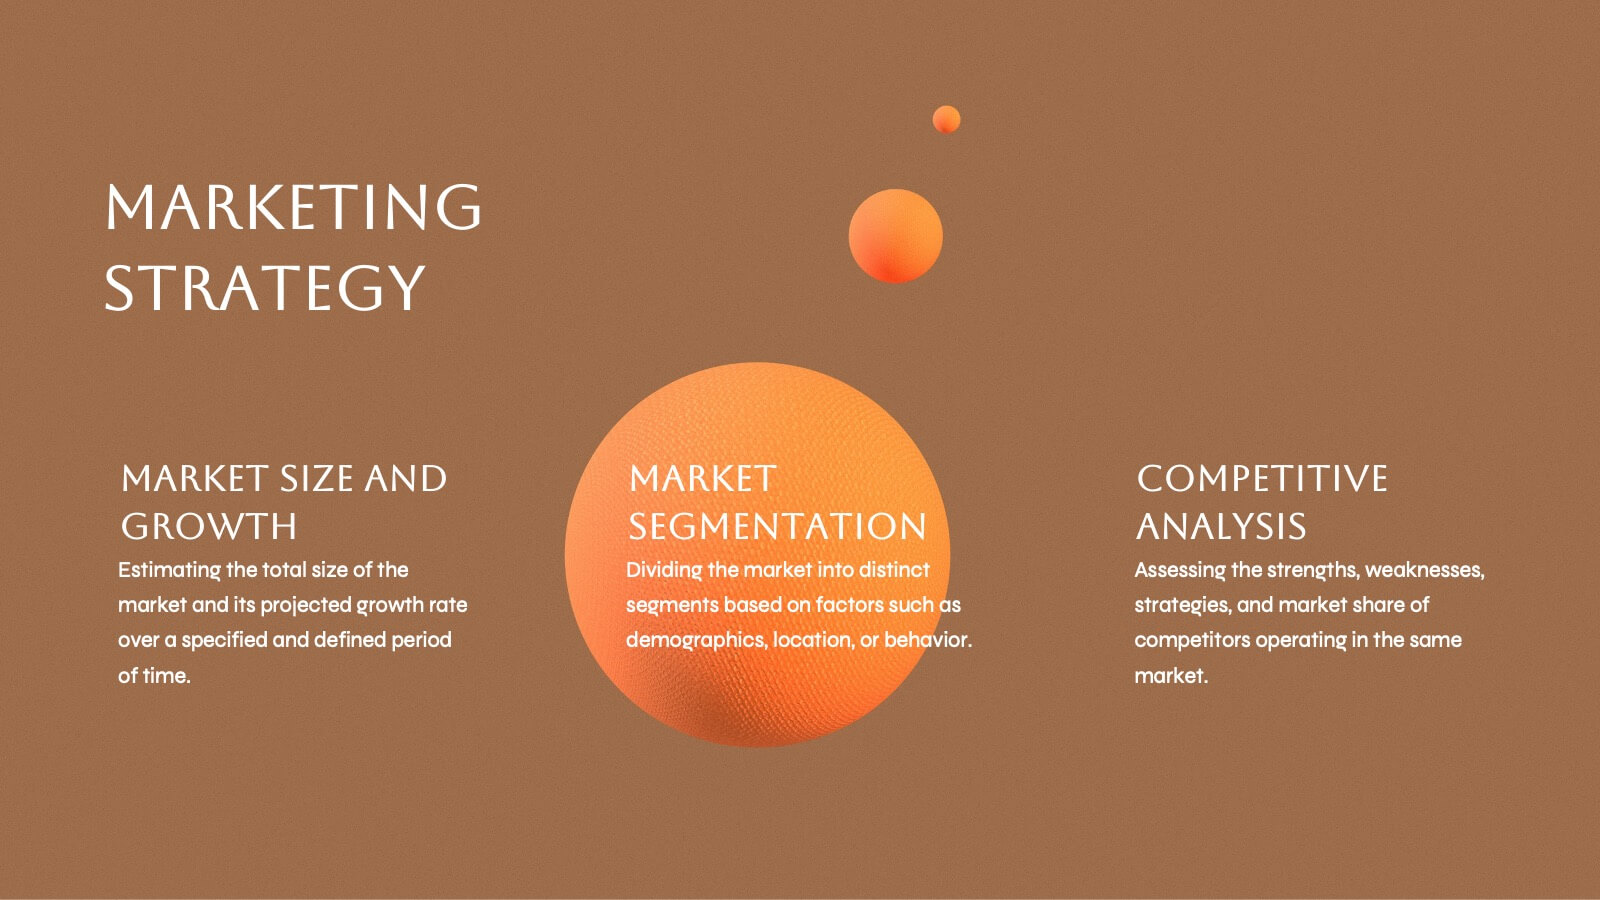
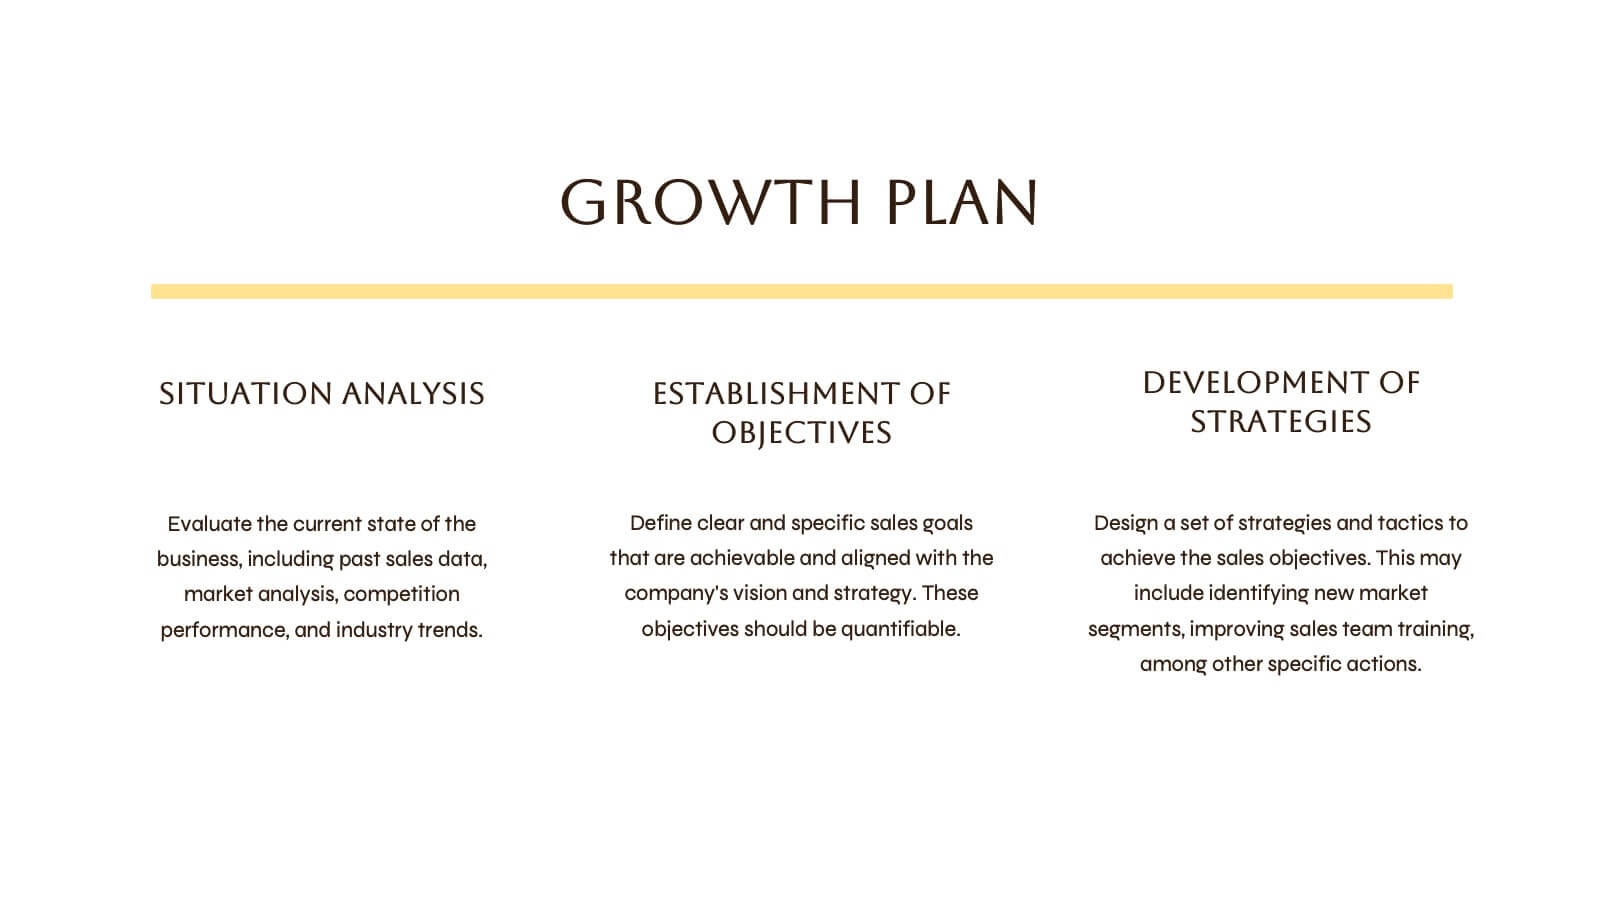
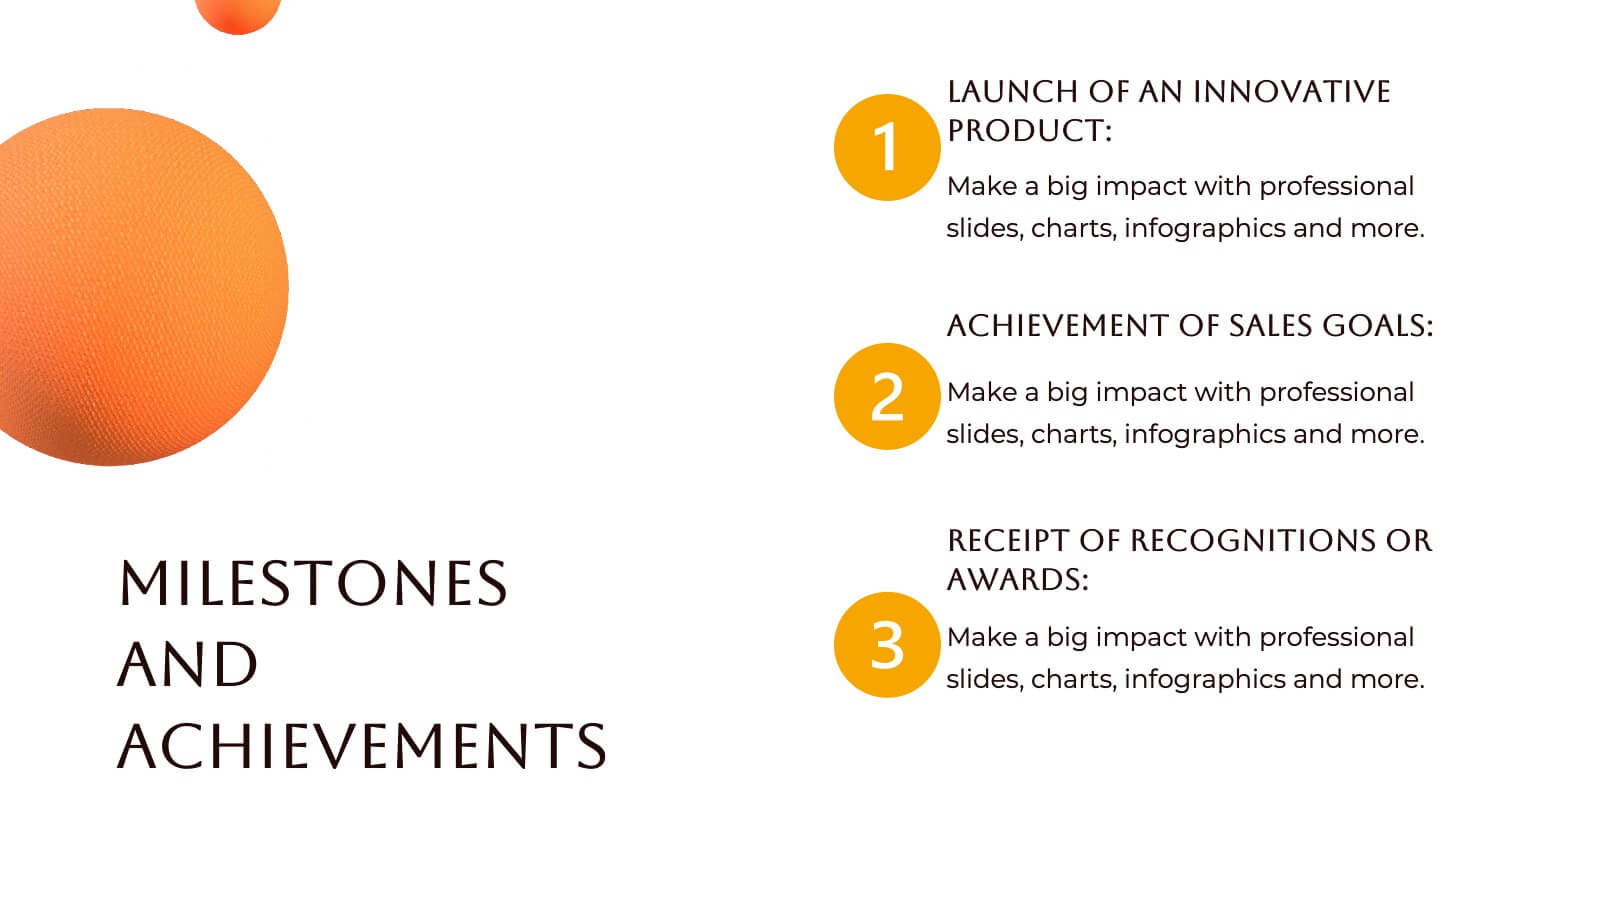
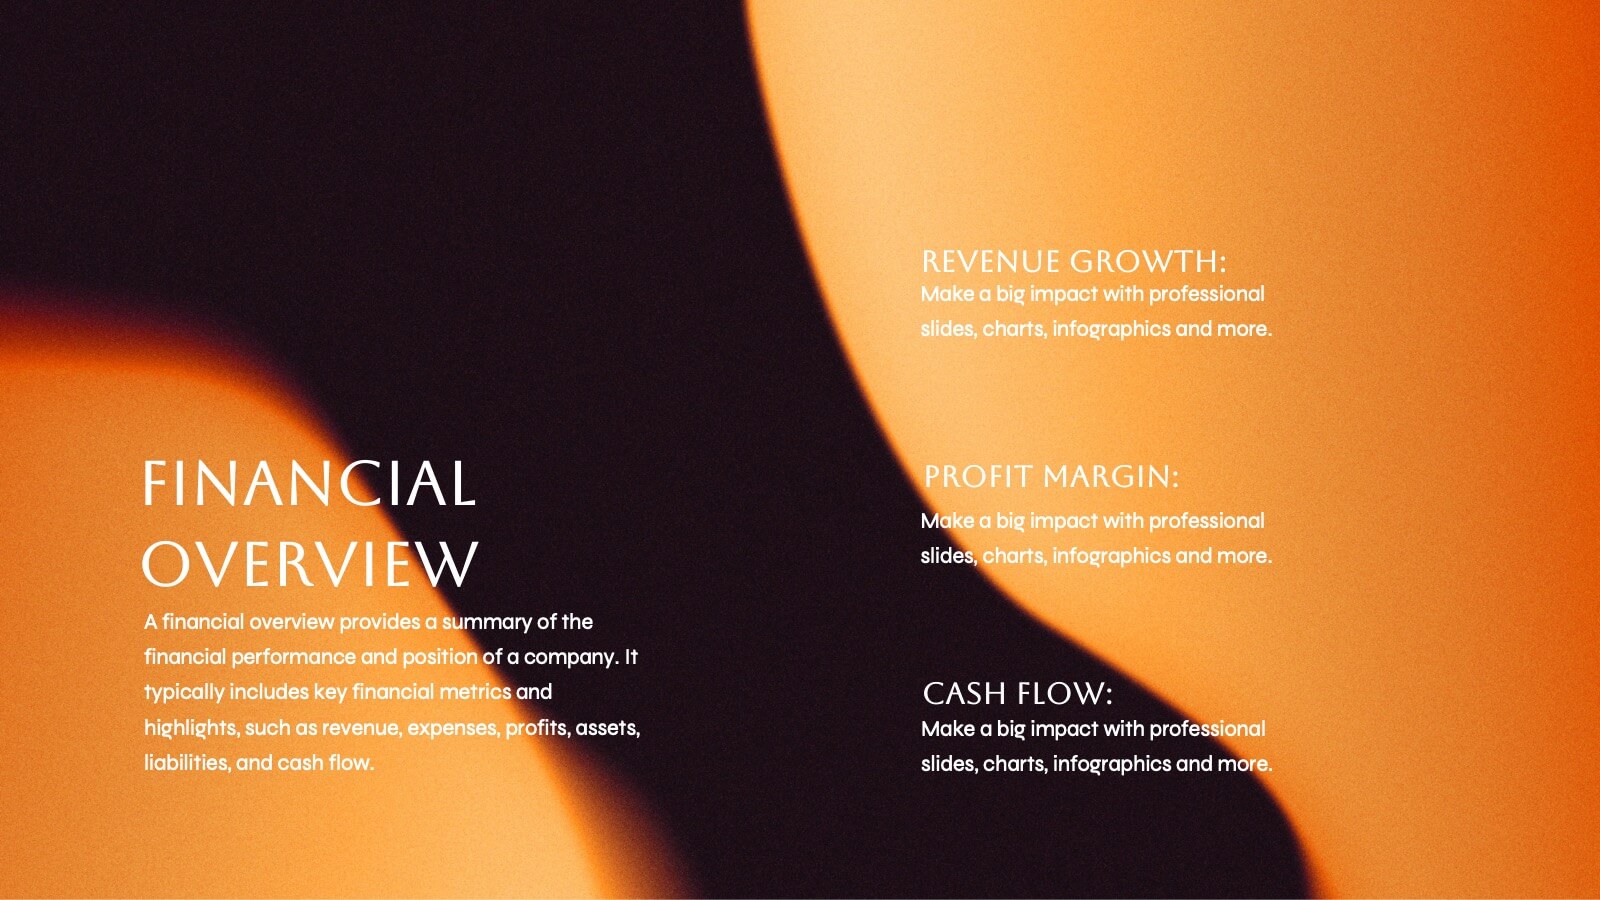
Fire Spin Startup Pitch Deck Presentation
Ignite your pitch with this bold, fire-inspired presentation template, perfect for showcasing your startup’s potential! This deck helps you present key business elements like market research, revenue models, and growth strategies in a dynamic, visually engaging format. Stand out from the competition. Compatible with PowerPoint, Keynote, and Google Slides.


6 diapositivas
5 Forces Market Strategy Framework Presentation
Visualize your competitive strategy with this 5 Forces Market Framework. Highlight key elements like Buyer, Supplier, New Entry, Substitutes, and Competitive Rivalry using a clean, circular layout. Ideal for strategic analysis, business planning, or investor pitches. Fully editable in PowerPoint, Keynote, and Google Slides for seamless customization.


23 diapositivas
Solarae Investor Pitch Presentation
This Investor Pitch Deck Presentation is designed to impress potential investors with a modern, professional layout. Covering key topics like company overview, financials, competitive landscape, and milestones, it's fully customizable and easy to edit in PowerPoint, Keynote, and Google Slides. Perfect for startups seeking funding opportunities.


6 diapositivas
Internal Communication Framework Presentation
Foster stronger collaboration with this visual internal communication framework template. Ideal for showcasing how information flows within departments, this layout helps clarify messaging channels, responsibilities, and feedback loops. Whether you're streamlining communication strategies or presenting team structures, it’s fully editable and works seamlessly with PowerPoint, Keynote, and Google Slides.


4 diapositivas
Healthcare Medical Infographic Presentation
Bring your healthcare insights to life with a clean, calming design that makes complex medical data easy to follow. This presentation highlights key health metrics, patient information, and wellness topics using simple visuals and structured layouts for clarity. Fully compatible with PowerPoint, Keynote, and Google Slides.


4 diapositivas
Product & Pricing Plan Matrix Presentation
Simplify complex pricing and product details with the Product & Pricing Plan Matrix Presentation. This structured grid layout is ideal for comparing multiple service tiers, packages, or feature sets side-by-side. Easily customizable, each block allows you to highlight key offerings, benefits, and pricing strategies. Compatible with Canva, PowerPoint, Keynote, and Google Slides.


6 diapositivas
Business Structure Outline Presentation
Visualize your company’s framework with this modern business structure slide. Perfect for showcasing team roles, departments, or organizational functions, it helps simplify complex relationships into a clear overview. Easily editable in Canva, PowerPoint, and Google Slides—ideal for presentations, planning sessions, or onboarding new employees with a professional, easy-to-follow design.


4 diapositivas
Harvey Ball Chart Business Analysis
Simplify your data-driven storytelling with this Harvey Ball chart slide—perfect for consultants, analysts, and strategy teams. Visualize percentage-based insights across four categories using clean, easy-to-read circular progress visuals. Fully editable in PowerPoint, Keynote, and Google Slides to match your branding and message.


20 diapositivas
Solstice Startup Funding Proposal Presentation
This sleek startup funding proposal deck showcases your company’s objectives, services, sales process, and pricing strategy. Perfect for pitching investors or stakeholders, its modern design ensures a professional presentation. Compatible with PowerPoint, Keynote, and Google Slides, it's ideal for making a strong impression with minimal effort.


19 diapositivas
Eclipse Detailed Project Execution Plan Presentation
Get ready to wow your audience with this mesmerizing project plan template! With its captivating eclipse design, every slide exudes professionalism and creativity. Perfect for showcasing project objectives, timelines, and deliverables, this template will keep your viewers engaged from start to finish. Compatible with PowerPoint, Keynote, and Google Slides!


5 diapositivas
Population Segmentation by Demographic Factors Presentation
Break down audience demographics with this segmented infographic slide. Featuring a vertical figure illustration divided into color-coded percentage bars, it’s ideal for showcasing traits like age, gender, or location. This layout offers a clear visual summary, making it perfect for reports, marketing briefs, or investor presentations. Fully editable in Canva.


6 diapositivas
Break-Even Point Financial Analysis
Simplify financial planning with this modern break-even analysis diagram. Ideal for startups, project managers, and finance teams, this circular layout visually tracks six key financial stages. Use it to illustrate cost structures, revenue goals, and profitability timelines. Fully editable in PowerPoint, Keynote, and Google Slides.


6 diapositivas
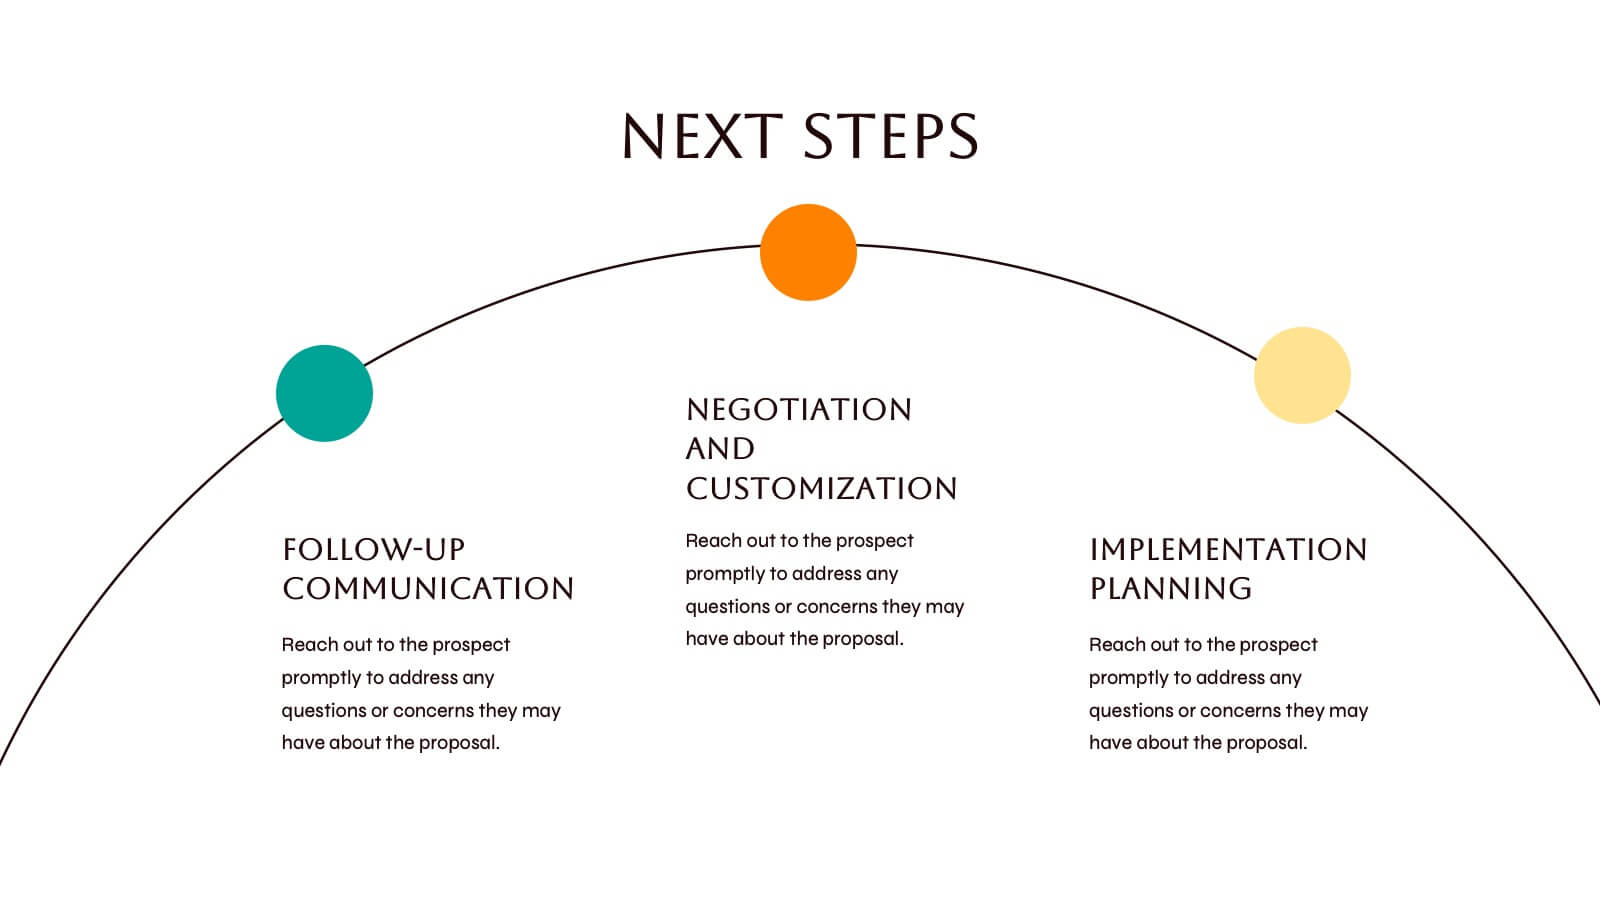
Numbered Steps Diagram Presentation
Watch your workflow come to life as each step rises in a clean, structured path that makes progress easy to follow. This presentation guides audiences through sequential actions with clarity, helping simplify processes, plans, or instructions. Perfect for business, training, or project teams. Fully compatible with PowerPoint, Keynote, and Google Slides.


6 diapositivas
Connection and Relationship Strategy Presentation
Present your workflow or relationship journey with clarity using the Connection and Relationship Strategy Presentation. This linear hexagon path is ideal for visualizing sequences, strategies, or stages in professional relationships. Fully customizable for PowerPoint, Keynote, and Google Slides—perfect for consultants, marketers, or project managers.


22 diapositivas
Arcflare Digital Agency Strategy Plan Presentation
Create a powerful strategy with this digital agency plan presentation! It features key sections like market analysis, industry trends, campaign execution, and client testimonials, helping you communicate your approach clearly. Perfect for strategy meetings or client pitches, this template is fully compatible with PowerPoint, Keynote, and Google Slides.


8 diapositivas
Cycle of Continuous Improvement Deck Presentation
Highlight iterative progress and strategic refinement with the Cycle of Continuous Improvement Deck. This template is ideal for quality management, agile planning, or operational excellence sessions. Fully editable and visually dynamic, it presents circular workflows in clean layouts. Compatible with PowerPoint, Keynote, and Google Slides—great for teams and consultants.


4 diapositivas
Data Analytics Heat Map Presentation
Turn complex data into clear insights with this dynamic heat map template! Ideal for visualizing trends, risks, or performance metrics, this design enhances decision-making at a glance. With fully customizable elements, it simplifies data analysis for business, finance, or research. Compatible with PowerPoint, Keynote, and Google Slides for seamless use.