


Características


¿Tienes alguna pregunta?
Recomendar


5 diapositivas
Business Pillars and Core Values Presentation
Showcase your organization's foundational strengths with our Business Pillars and Core Values presentation template. This versatile tool visually represents your key principles and commitments, ensuring your audience clearly understands the essence of your corporate identity.


24 diapositivas
Petricor UX Strategy Plan Presentation
This UX Strategy Presentation offers a structured approach to user experience design, covering key aspects such as user research, wireframing, prototyping, and usability guidelines. With sections on branding, responsive design, and accessibility, this template is ideal for UX professionals. Fully editable and compatible with PowerPoint, Keynote, and Google Slides.


4 diapositivas
Simple Title Page Design Presentation
Make a memorable first impression with a clean, modern title design that instantly draws attention. Ideal for creative portfolios, business reports, or marketing decks, this layout combines strong typography with sleek visuals for a professional look. Fully editable in PowerPoint, Keynote, and Google Slides for complete flexibility.


21 diapositivas
Fluorion Startup Strategy Presentation
Kickstart your business with this modern and professional Startup Strategy Presentation Template. Designed to help entrepreneurs, startups, and business owners present their vision, goals, and strategies effectively. This template includes 21 fully customizable slides covering essential sections such as mission and vision, market analysis, business model, financial overview, and growth plan. Compatible with PowerPoint, Keynote, and Google Slides for seamless editing and presentation.


6 diapositivas
Corporate Foundation and Pillars Presentation
Highlight your company's core principles with this visually impactful pillar-style slide. Designed to illustrate business frameworks, strategies, or guiding values, this layout helps communicate stability and growth. Fully customizable in PowerPoint, Keynote, and Google Slides for seamless brand alignment.


4 diapositivas
Case Study Insights and Outcomes Presentation
Showcase real-world takeaways with the Case Study Insights and Outcomes Presentation. This modern, folder-style infographic layout guides your audience through three key stages of a case study—process, insight, and results. Ideal for highlighting lessons learned, performance reviews, or client success journeys. Fully editable in PowerPoint, Keynote, and Google Slides.


7 diapositivas
Flow Chart Diagram
A flowchart diagram is a visual representation that illustrates a process or system by using different symbols and shapes to depict the steps, decisions, and actions involved. Our flow chart diagram infographic is the compass to navigate your concepts into concrete actions. It's a visual roadmap that simplifies complex processes, helping you illustrate the steps in a sequence. This Infographic is your trusted tool for transforming processes into a visually appealing and understandable journey. This tool is designed to be used in various fields, including software development, business process analysis, education, and more, to depict the logical flow.


4 diapositivas
E-Learning LMS Deployment Strategy Presentation
Break down your LMS rollout with clarity and style using this collaborative e-learning strategy visual. With its unique pencil-and-laptop layout, this infographic is perfect for trainers, course creators, and EdTech professionals mapping out a deployment process. Fully compatible with PowerPoint, Keynote, and Google Slides for flexible customization.


2 diapositivas
Minimalist Cover Page Design Presentation
A clean, modern visual instantly sets the tone, giving your audience a polished start before your message even begins. This presentation introduces your content with a bold, minimalist layout that feels intentional and professional. Perfect for business, creative, or academic use. Fully compatible with PowerPoint, Keynote, and Google Slides.


5 diapositivas
Banking Benefits Infographics
Banking offers several benefits that contribute to the efficient functioning of the economy and the financial well-being of individuals and businesses. These vertical infographics highlight the advantages and benefits of banking services. They are designed to help you communicate the value of banking to your audience in a clear and engaging manner. With these templates you can effectively communicate the value of banking services to your audience. The infographics are compatible with Powerpoint, Keynote, and Google slides, making them easily customizable to match your brand and data.


20 diapositivas
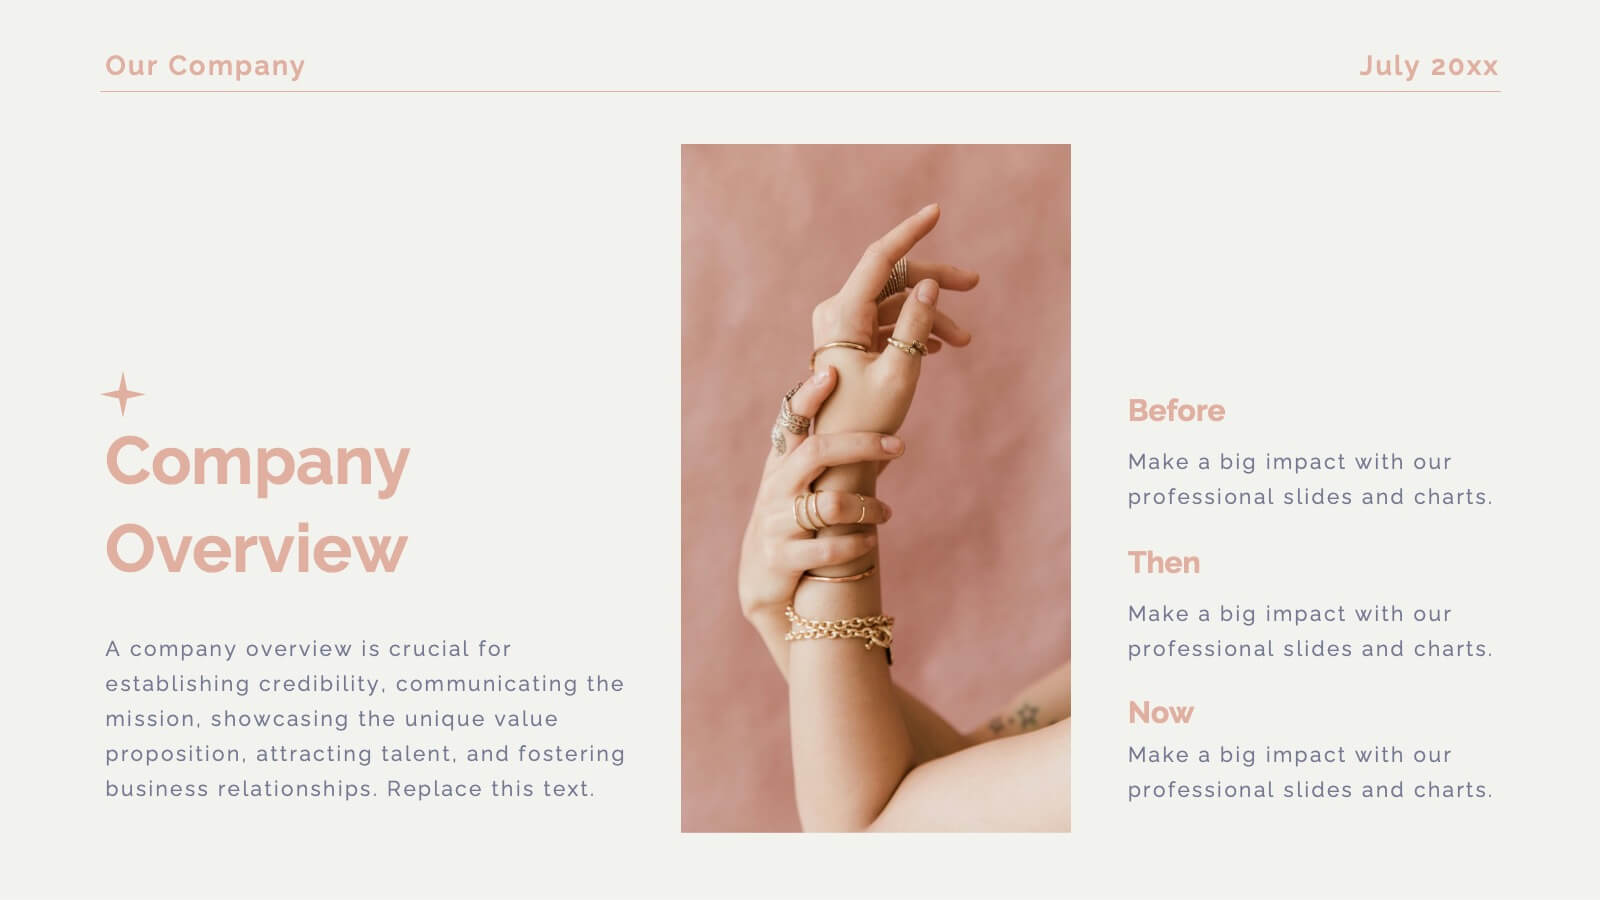
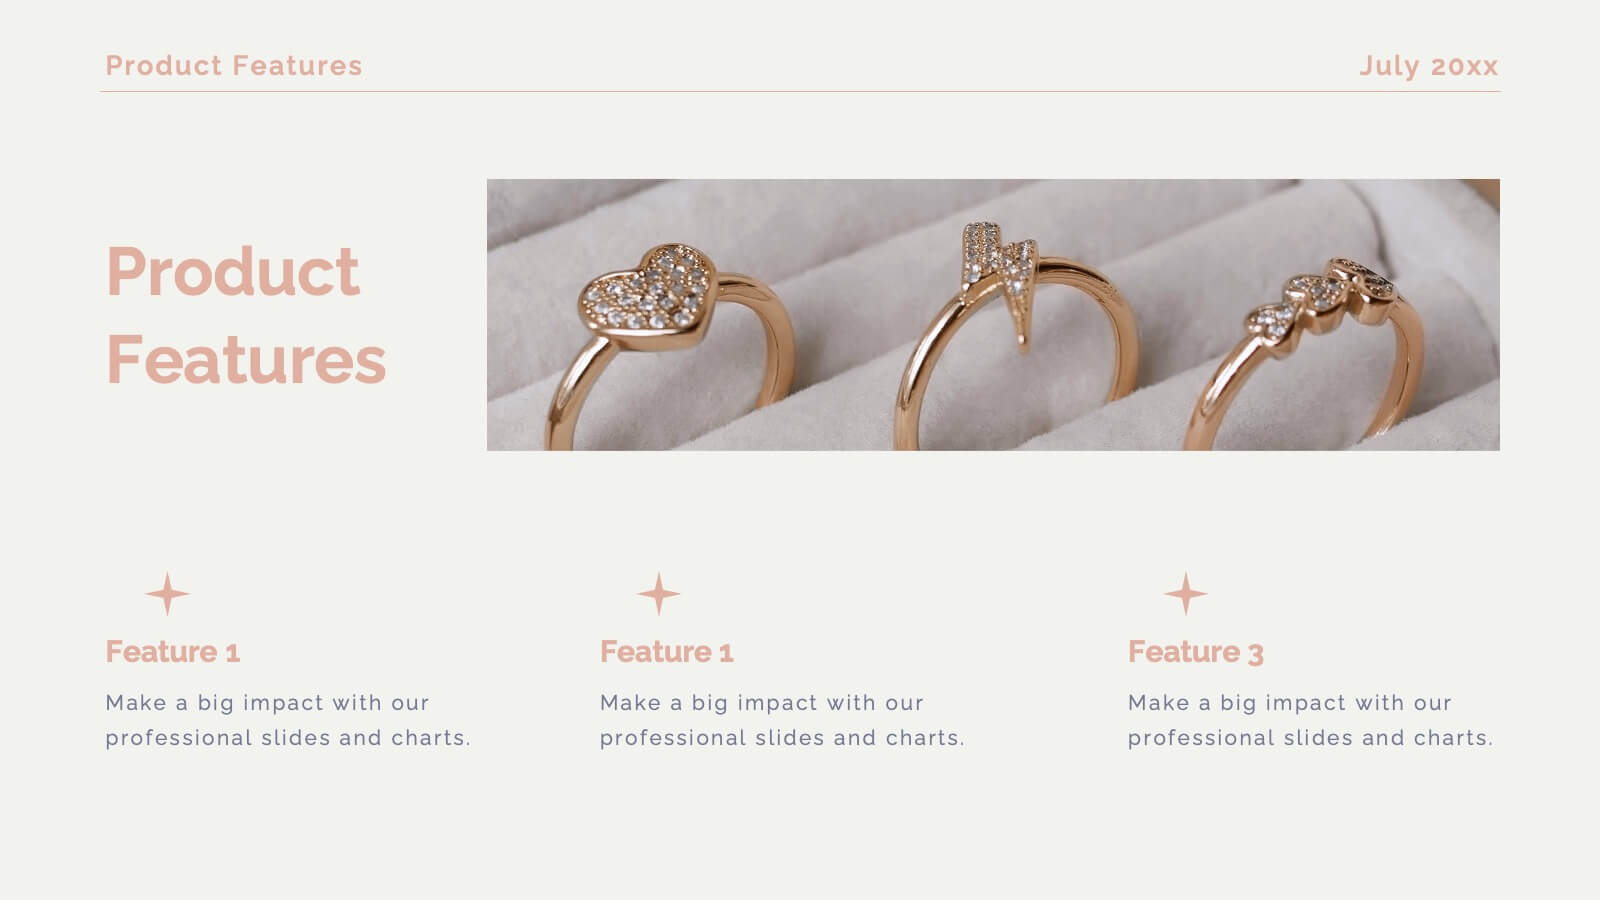
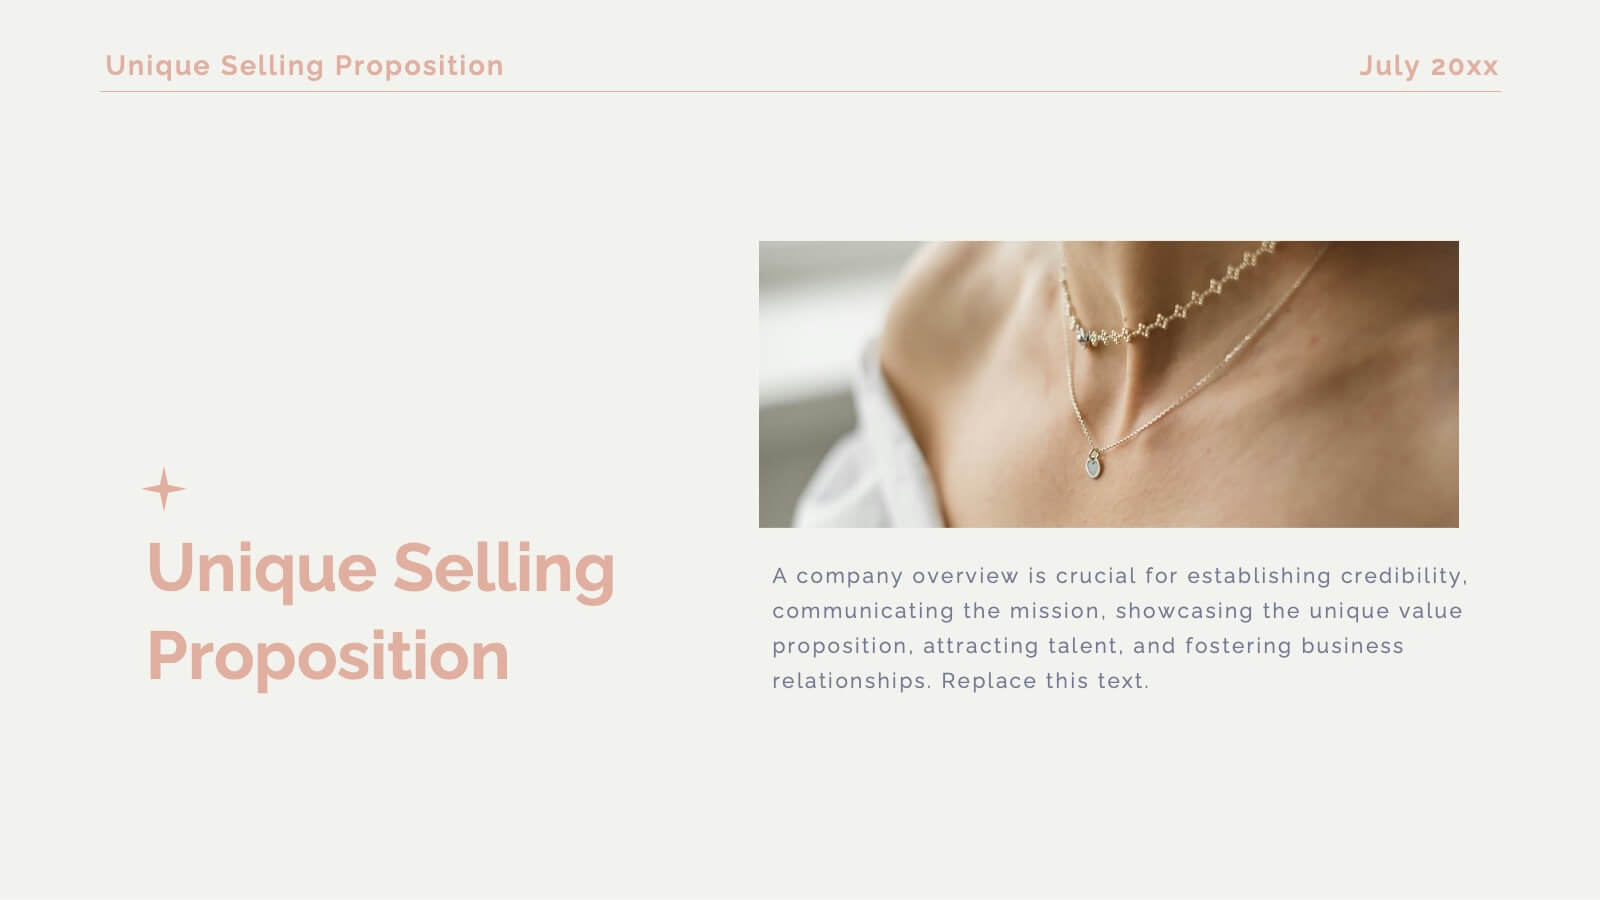
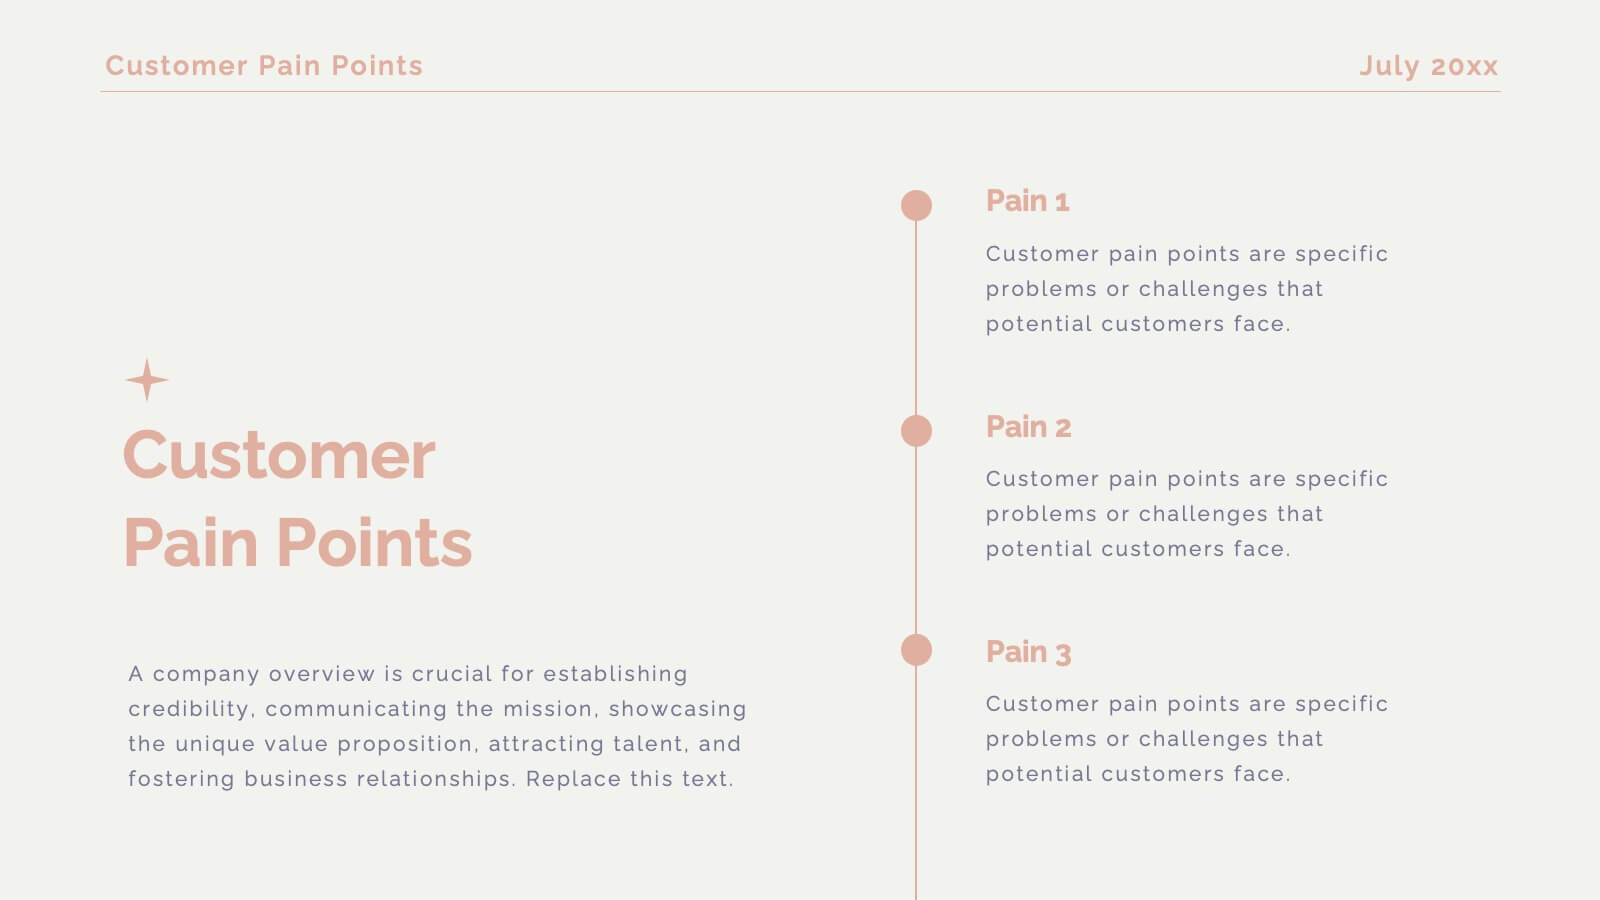
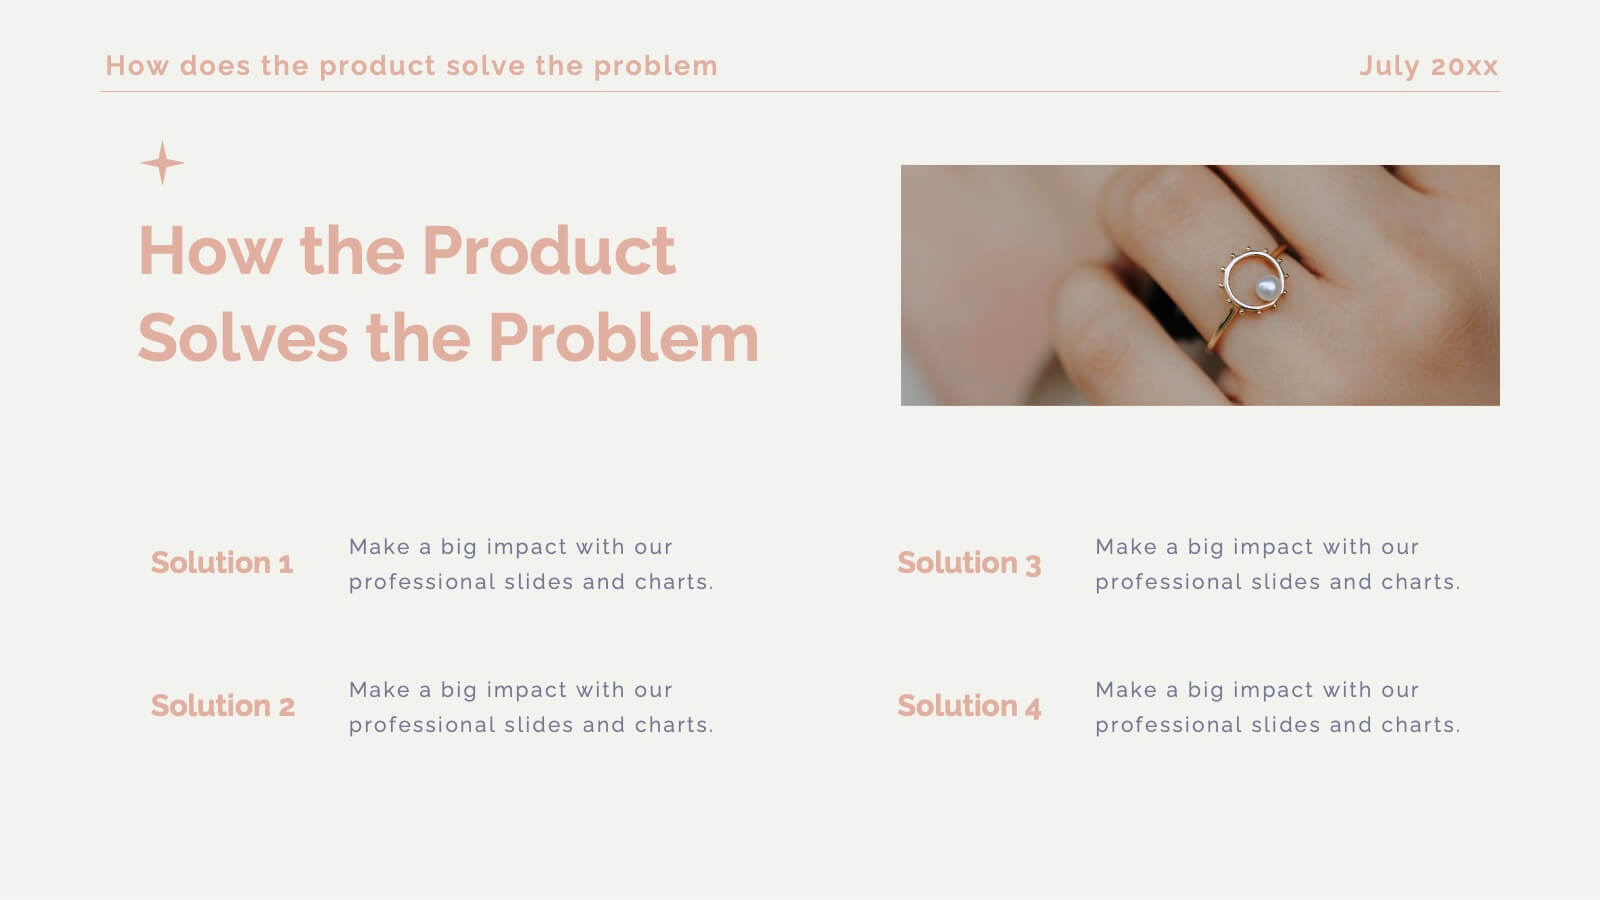
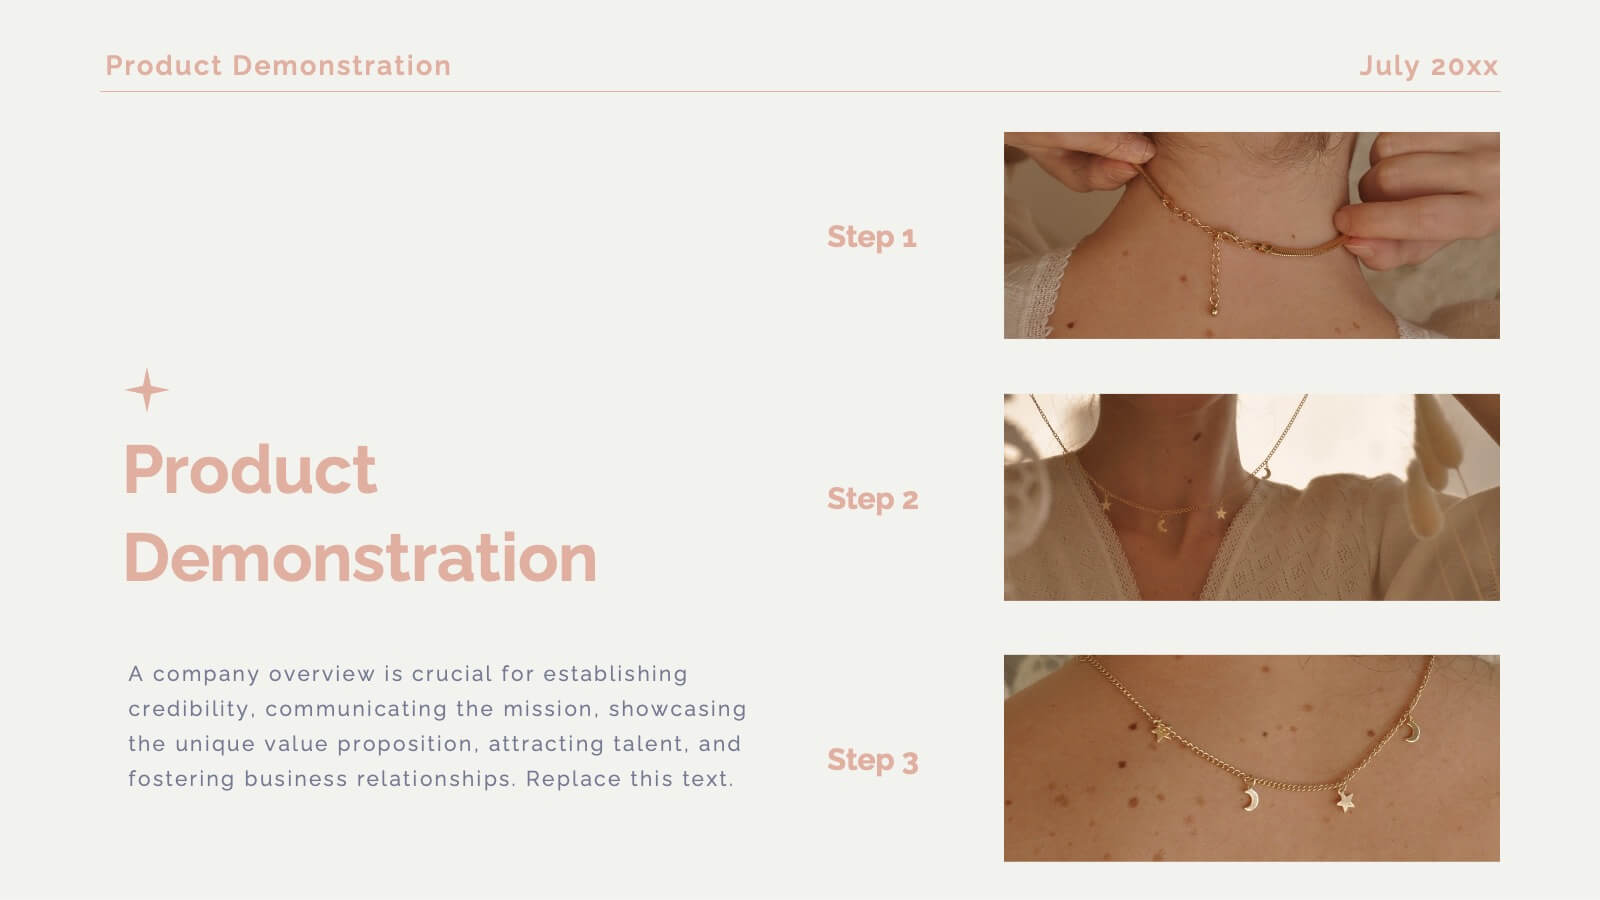
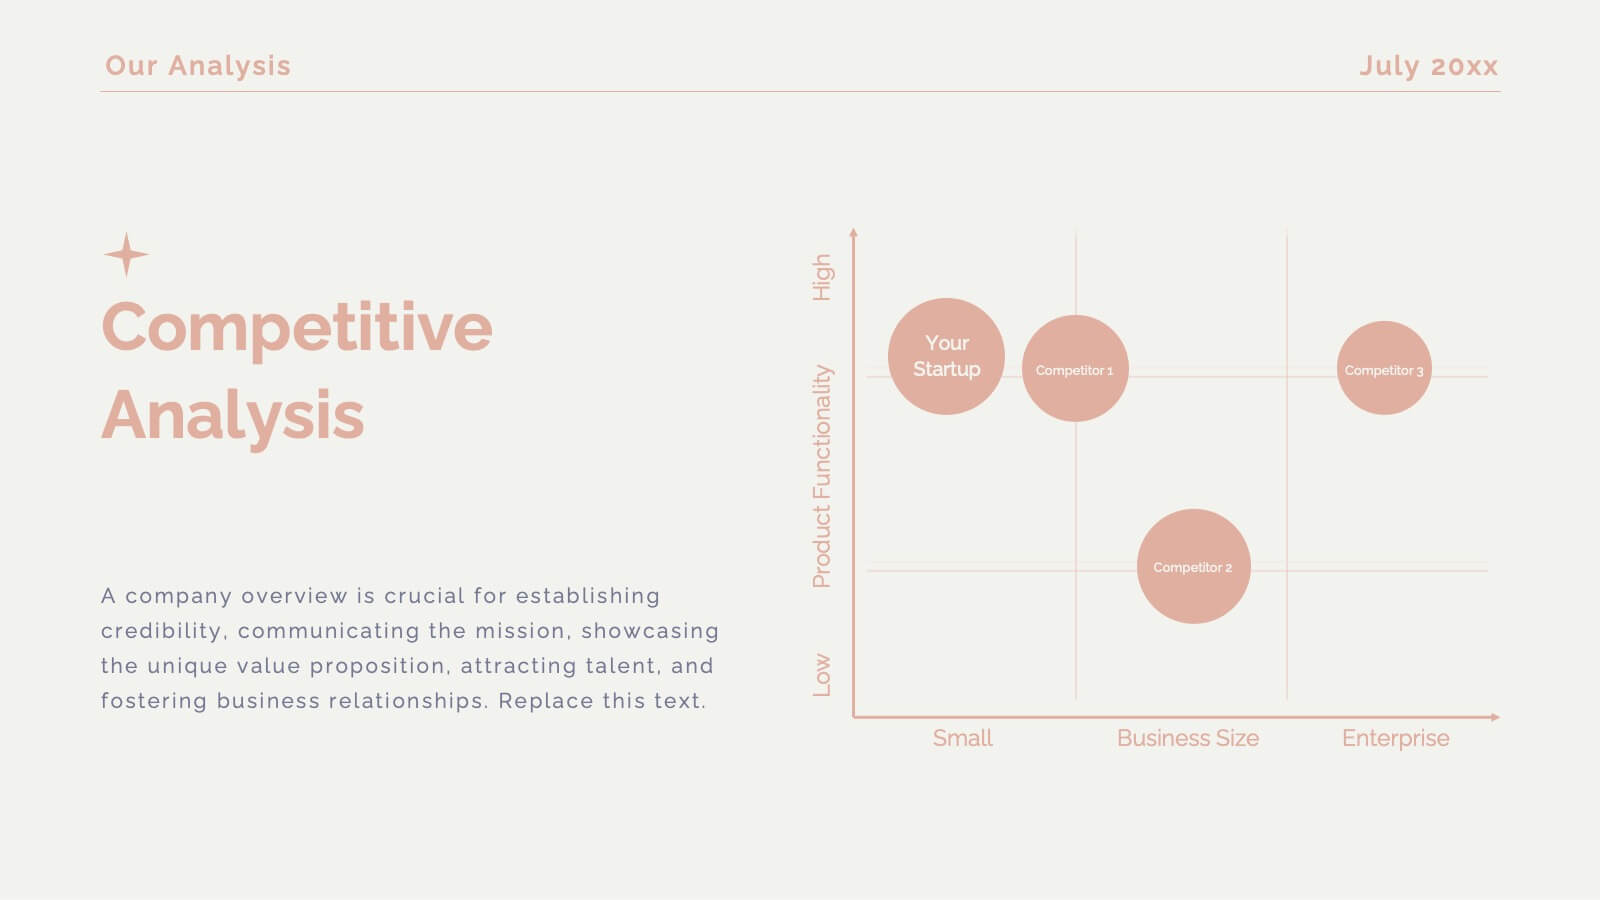
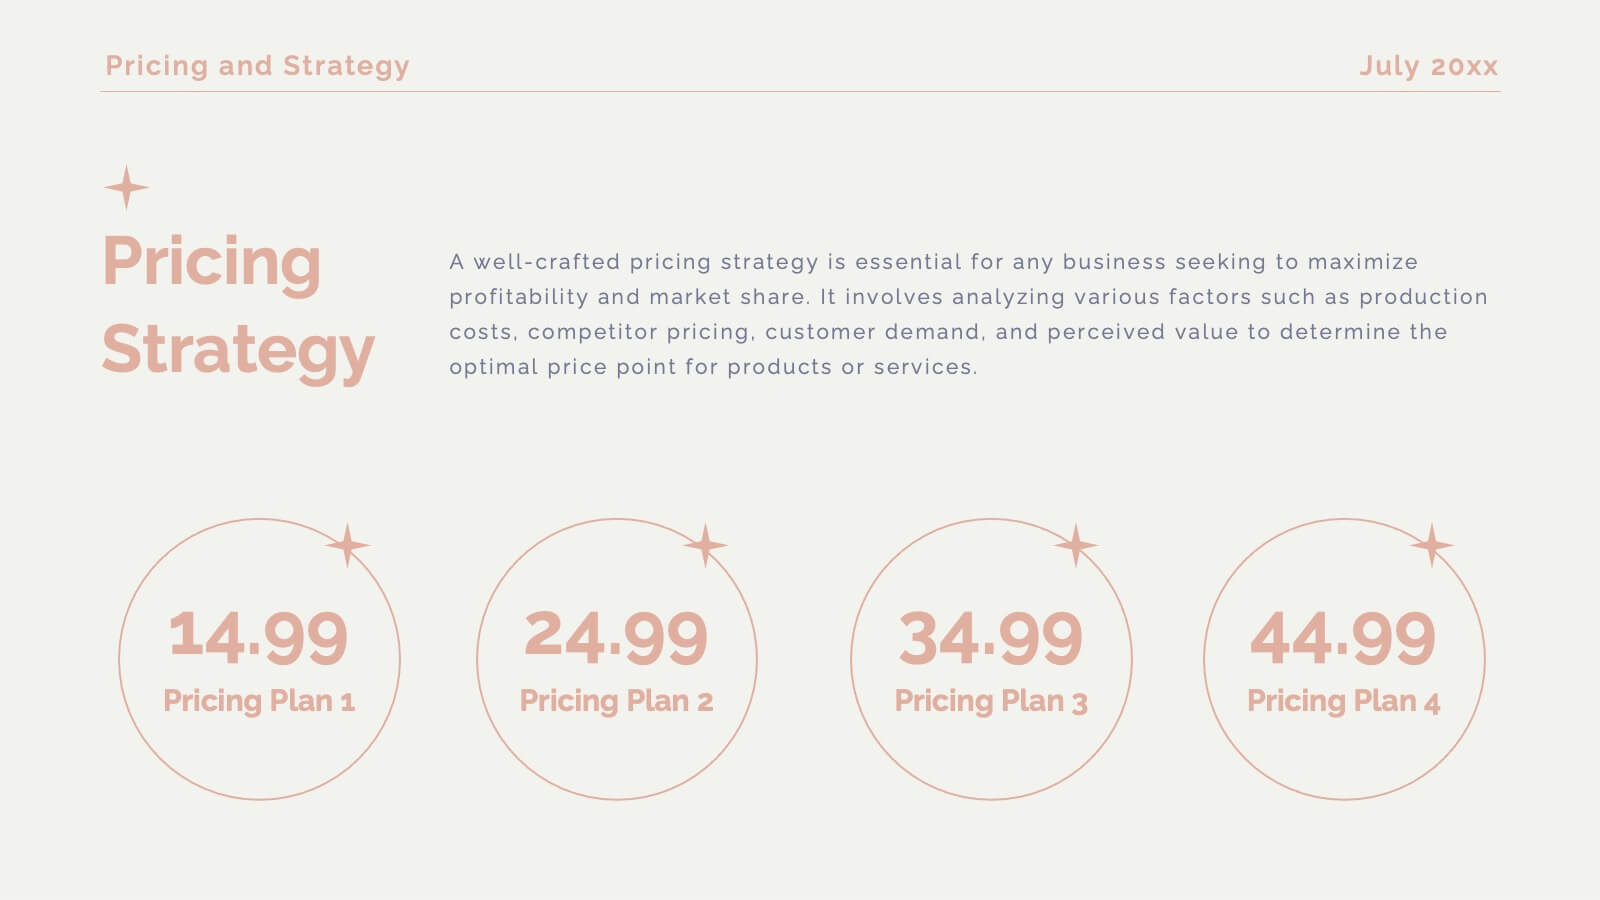
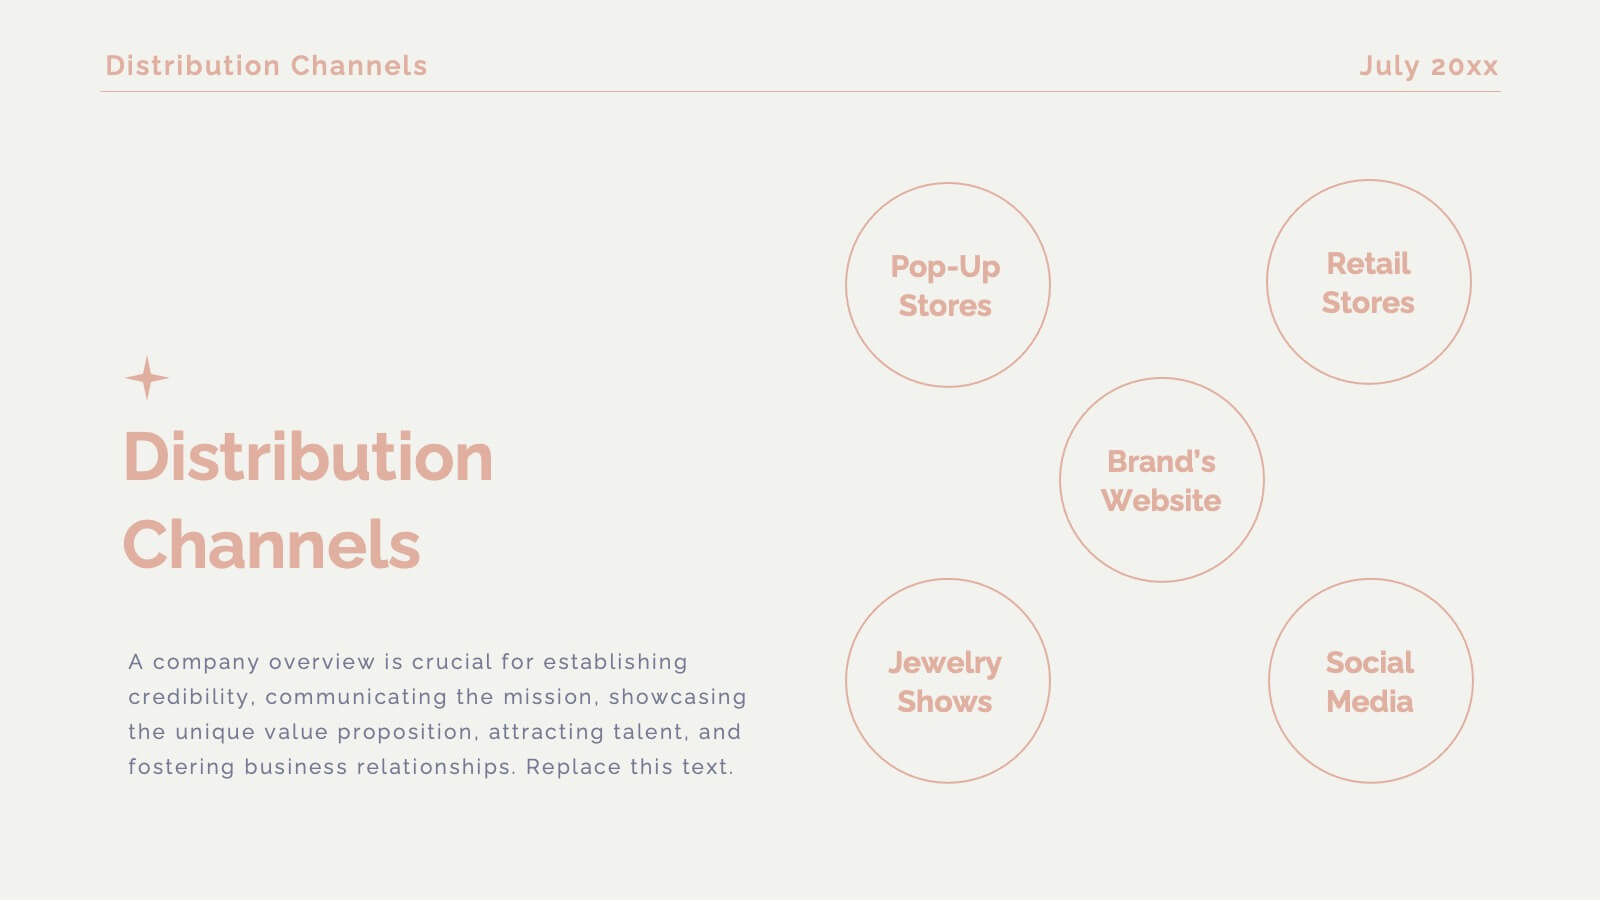
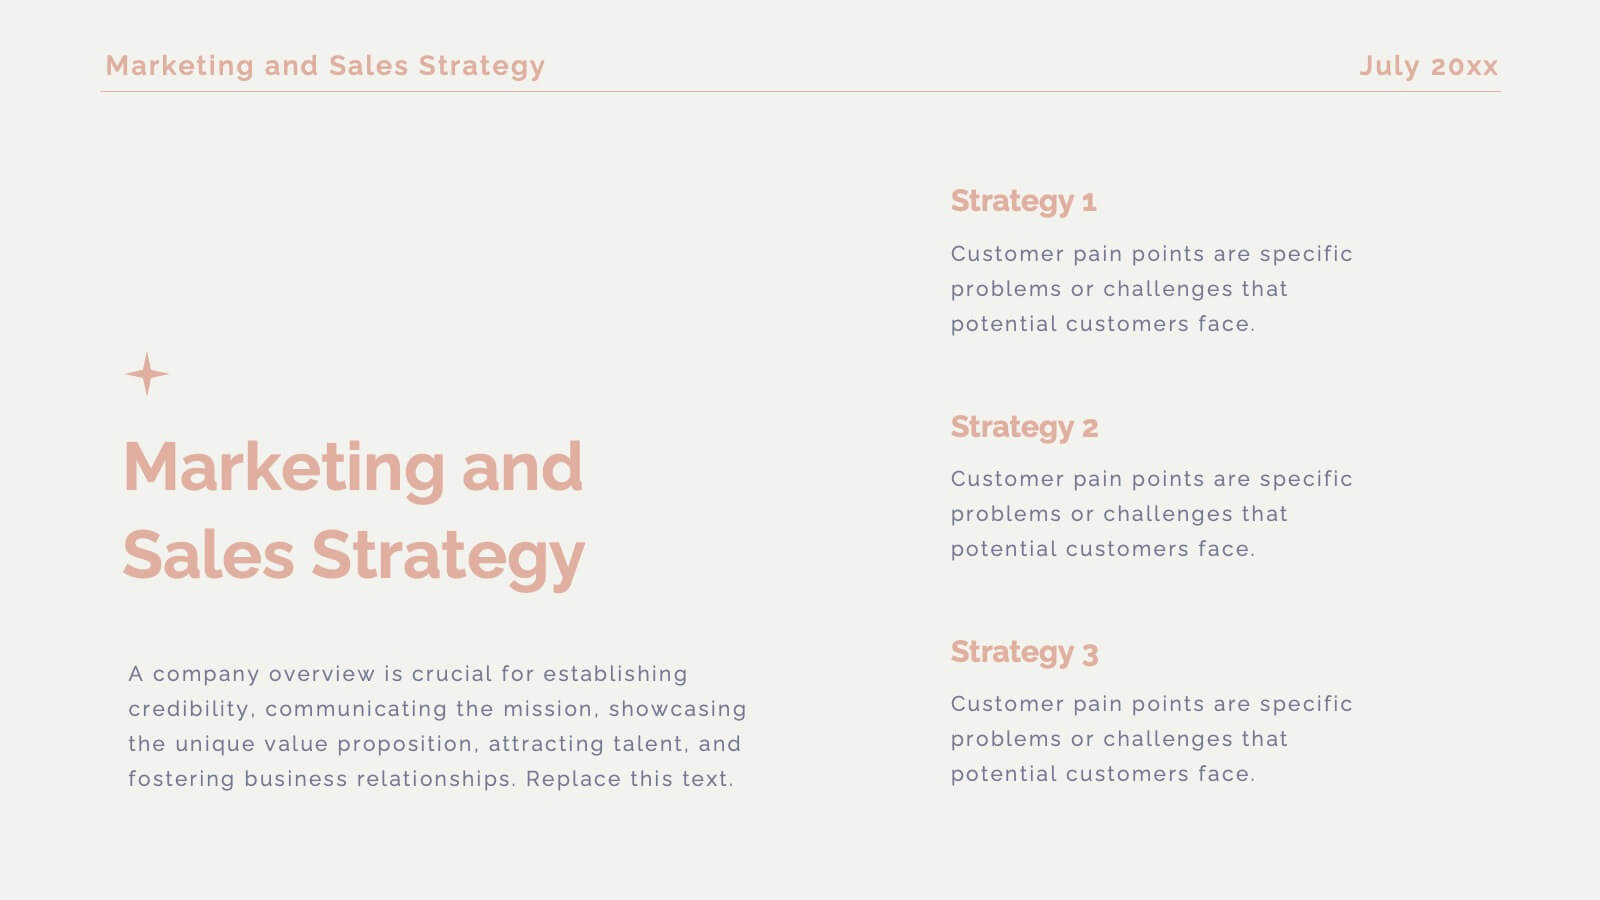
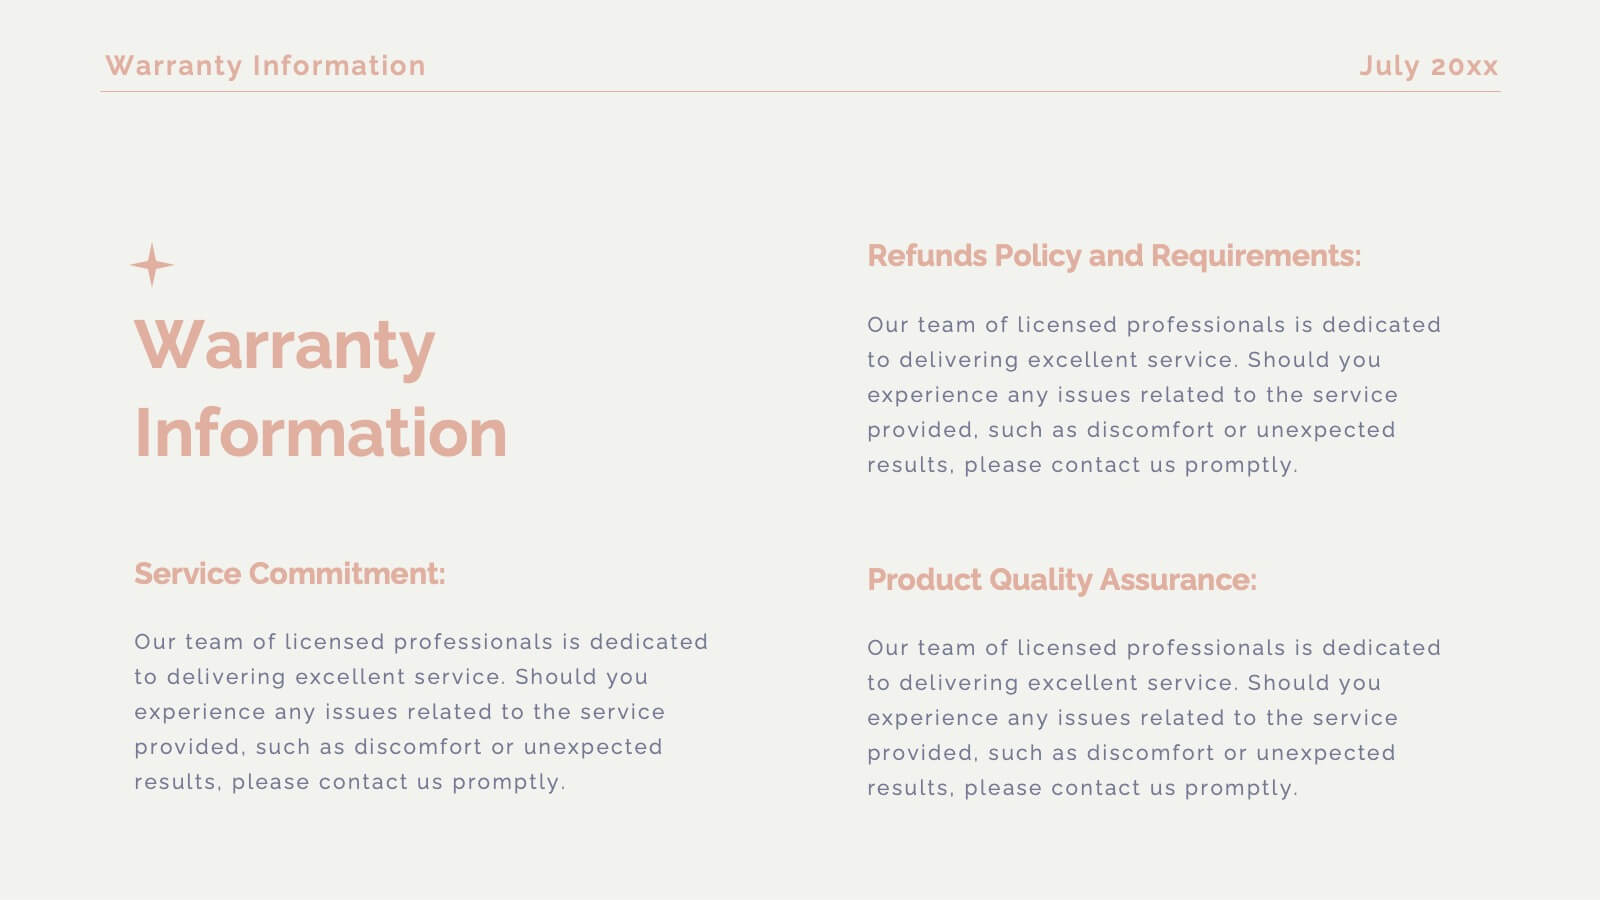
Legacy Product Launch Presentation
Get ready to unveil your product with a stunning and sophisticated launch template designed to captivate and convert! This template offers everything you need to present your product in the most compelling way possible, from an inviting welcome slide to an in-depth company overview that sets the stage for your brand’s story. The sleek design highlights key product features, unique selling propositions, and a thorough competitive analysis that positions your product as the market leader. With sections dedicated to customer pain points, solutions, and a powerful product demonstration, this template ensures your audience understands the value and impact of your offering. It also includes critical details like pricing strategy, distribution channels, and manufacturing processes, giving a full picture of your product’s journey from concept to market. Compatible with PowerPoint, Keynote, and Google Slides, this template is your ultimate tool for a successful product launch that leaves a lasting impression!


7 diapositivas
Abstract Business Diagrams in Geometry
Showcase your ideas with visual impact using the Abstract Business Diagrams in Geometry Presentation. This modern layout features a six-part hexagonal structure, ideal for presenting categories, segments, or processes. Each shape is numbered, icon-supported, and color-coded for clarity and emphasis. Perfect for strategy, planning, or data overviews. Fully editable in PowerPoint, Keynote, and Google Slides.


8 diapositivas
Cognitive Psychology and Decision Making
Unlock the logic behind human choices with this eye-catching presentation template that puts cognitive puzzles into perspective—literally. Dive into how thought patterns, mental shortcuts, and biases influence decision making, all illustrated through clean visuals and digestible layouts. Easily customizable for PowerPoint, Keynote, and Google Slides.


8 diapositivas
Large-Scale Data Processing Tools Presentation
Simplify the complexity of data processing with this sleek and modern template for mapping large-scale tools and systems. Ideal for tech teams, data analysts, and IT professionals, this slide helps you explain how data flows through cloud-based infrastructures. Fully customizable and compatible with PowerPoint, Keynote, and Google Slides.


5 diapositivas
Business SWOT Infographics
Dive deep into organizational analysis with our business SWOT infographics. Crafted in engaging shades of blue and pink, this collection is an essential tool for businesses aiming to uncover their strengths, weaknesses, and threats. This template, brimming with creative graphics and icons, is specifically designed for business strategists, educational instructors, and company executives who are keen to present SWOT analysis with clarity. Compatible with Powerpoint, keynote, and Google Slides. Its vertical, creative styling makes complex information digestible, fostering understanding and strategic thinking in your business planning sessions.


6 diapositivas
Letter Recognition and Phonics Training Presentation
Make early learning visual and interactive with this clean, A-to-F phonics layout. Each letter icon is paired with editable text for sound associations, learning milestones, or steps in a language program. Great for educators, speech therapists, or early childhood presentations. Fully editable in PowerPoint, Keynote, and Google Slides.


26 diapositivas
Briarfall Rebranding Project Plan Presentation
This Brand Presentation Template offers a modern and structured approach to showcasing your brand identity, values, and strategic direction. Covering essential elements like audience personas, brand positioning, touchpoints, and performance metrics, it's fully customizable and perfect for businesses looking to strengthen their brand presence. Compatible with PowerPoint, Keynote, and Google Slides.