


Características


¿Tienes alguna pregunta?
Recomendar


5 diapositivas
Health Care Infographics
Taking care of your health is an investment in your future self and can lead to a happier and more fulfilling life. These vertical health care infographics are visual representations of information related to health care. They can cover a wide range of topics, such as disease prevention, medical treatments, and patient care. These are designed to be easily understandable and engaging for a general audience. They use colorful graphics and illustrations to convey complex information in an eye-catching manner. These also include graphs, diagrams text boxes, and other design elements to highlight key information.


7 diapositivas
Medical Center Infographic
A medical center, often referred to as a healthcare center, is a facility or establishment where a range of medical services and care are provided to individuals in need of medical attention. This infographic template is designed to provide a comprehensive overview of the medical center, emphasizing its services, healthcare professionals, facilities, patient satisfaction, and community engagement. This infographic is fully customizable and compatible with Powerpoint, Keynote, and Google Slides. Easily customize and design this to align with your specific medical center's brand and message.


6 diapositivas
Venn Diagram
A Venn diagram is a visual representation of the relationships between different sets or groups. This infographic template consists of overlapping circles, each representing a specific set, and the overlapping parts indicates the elements that belong to multiple sets. Use this infographic to illustrate the relationships between different sets of data or concepts. The main components of the infographic are the circles or ellipses that represent the sets being compared. The size and position of the circles can be adjusted to reflect the data accurately. This infographic is fully customizable and compatible with Powerpoint, Keynote, and Google Slides.


28 diapositivas
Legacy Brand Development Pitch Deck Presentation
Elevate your brand presentations with this sleek, modern template. Perfect for outlining brand identity, market analysis, and unique selling propositions, it features a stylish design with vibrant colors. Highlight your brand's voice, tone, and positioning to captivate your audience. Compatible with PowerPoint, Keynote, and Google Slides, it ensures seamless presentations on any platform.


6 diapositivas
Demographic Data Analysis Presentation
The "Demographic Data Analysis" presentation effectively visualizes demographic splits using a simple yet engaging pie chart. The template features a clean layout with distinct sections labeled for different demographic metrics, represented by the percentage splits of 35% and 65%. Each section includes placeholder text for inserting detailed insights, making it an excellent tool for presentations that need to communicate demographic data clearly and attractively. The design is versatile and can be adapted for various analysis needs in business or research contexts.


4 diapositivas
Business Development Roadmap Presentation
Visualize your growth journey with this Business Development Roadmap Presentation. Featuring a winding road design with four milestones, it’s perfect for showcasing project phases, strategic goals, or quarterly plans. Each checkpoint is color-coded and icon-based for easy comprehension. Fully editable in PowerPoint, Keynote, and Google Slides.


4 diapositivas
Internal vs External Stakeholder Strategy Presentation
Clarify your stakeholder landscape with the Internal vs External Stakeholder Strategy Presentation. This slide features a clean quadrant design to distinguish internal and external stakeholders by priority or role. Ideal for strategy meetings, corporate communications, and stakeholder planning sessions. Fully customizable in PowerPoint, Keynote, and Google Slides.


24 diapositivas
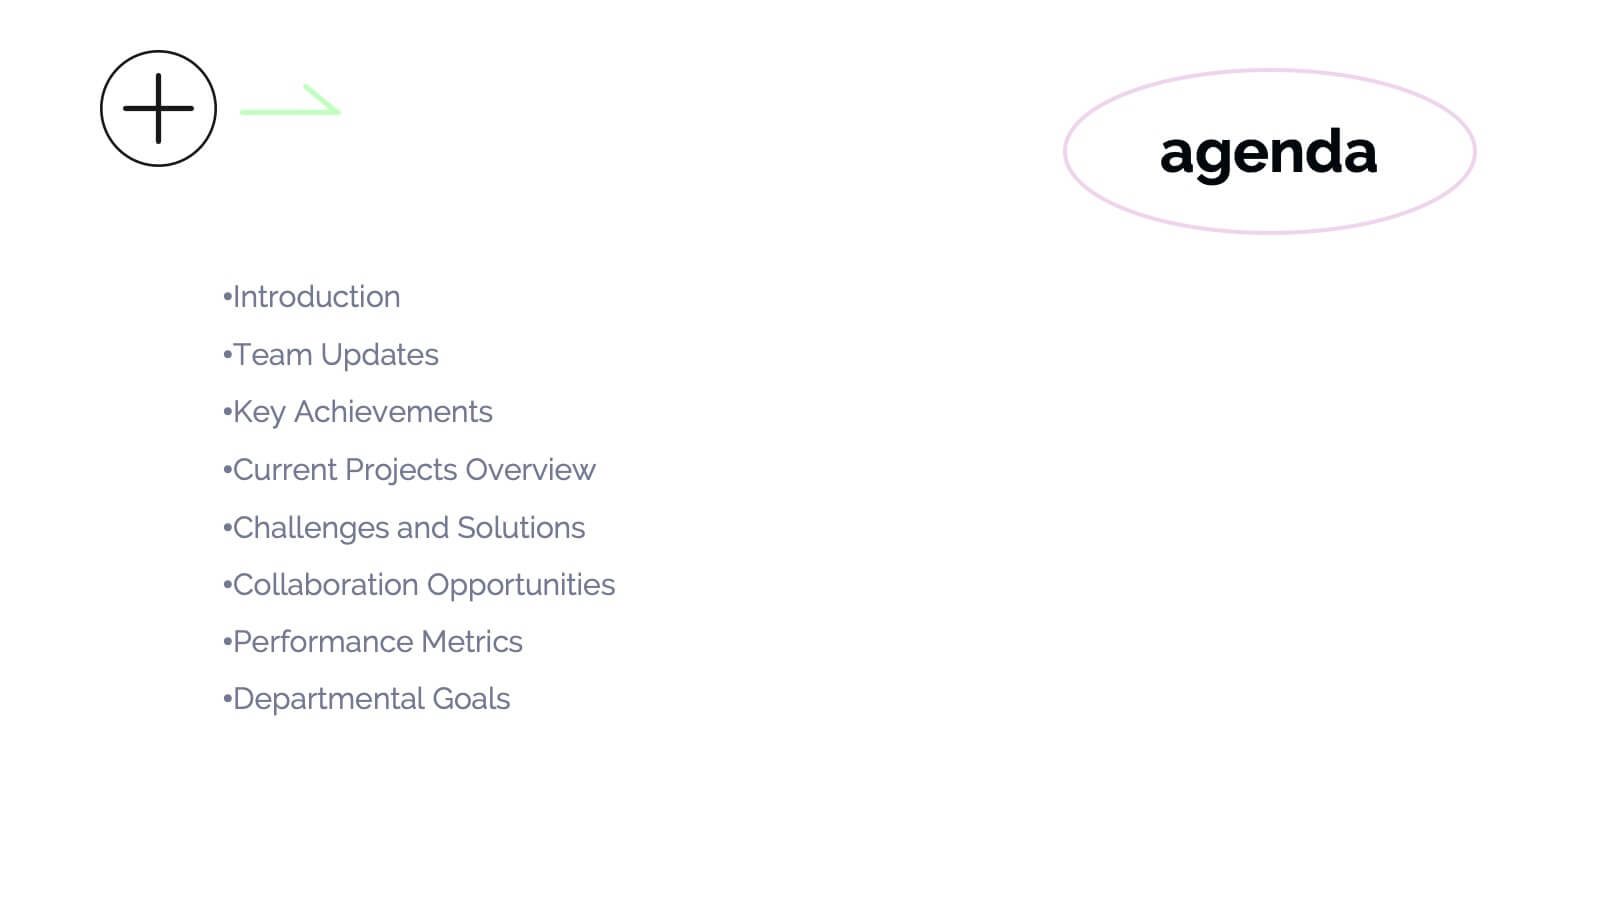
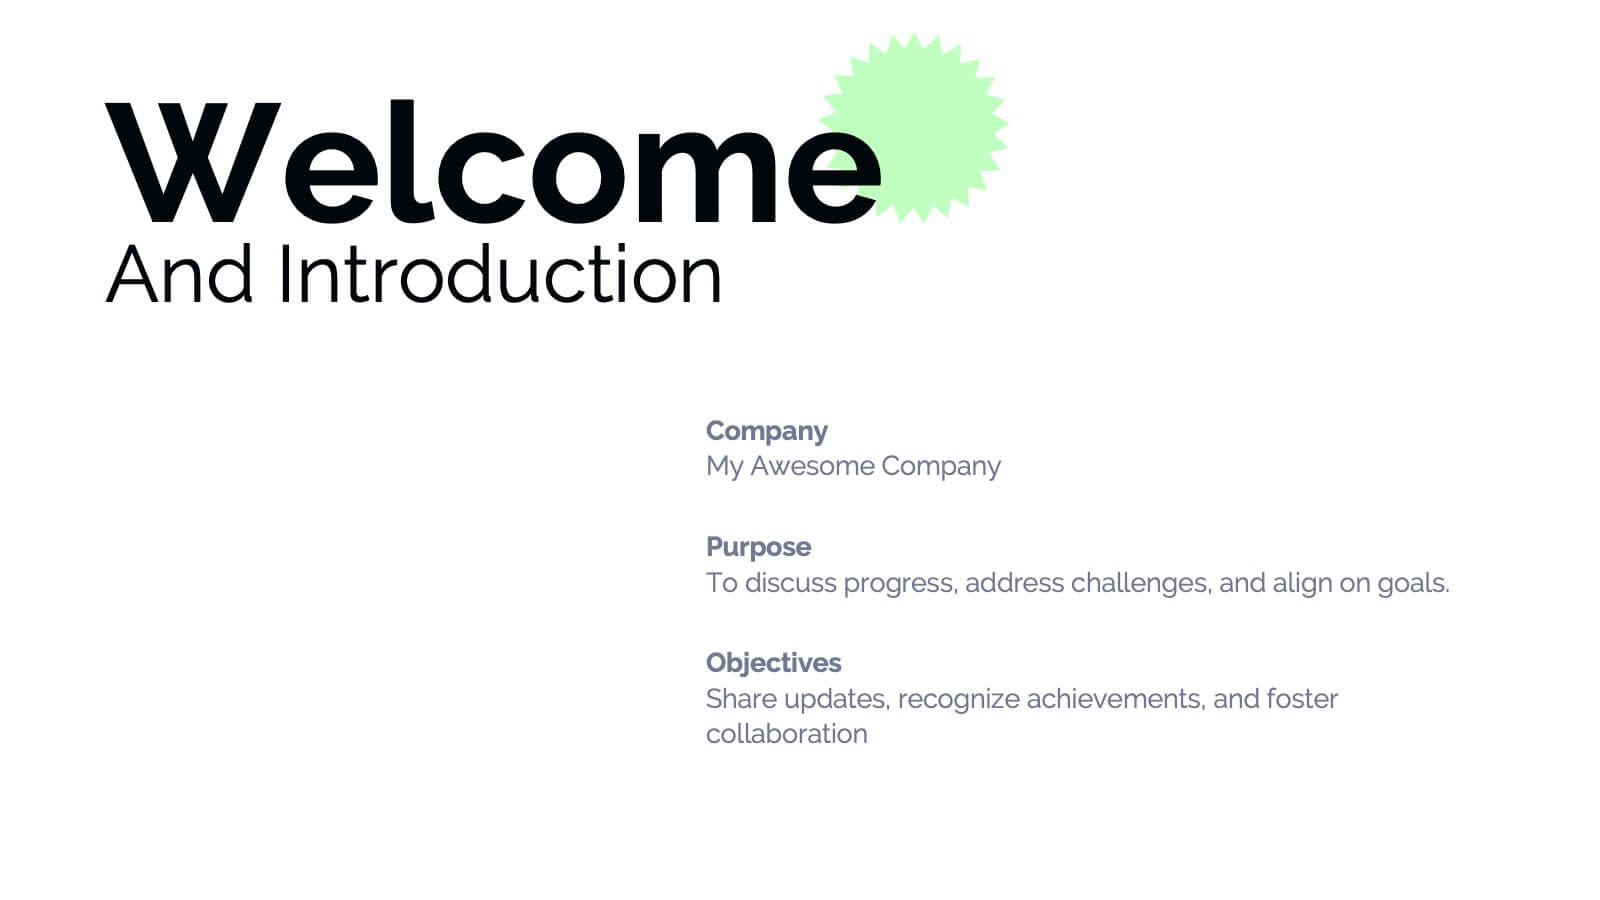
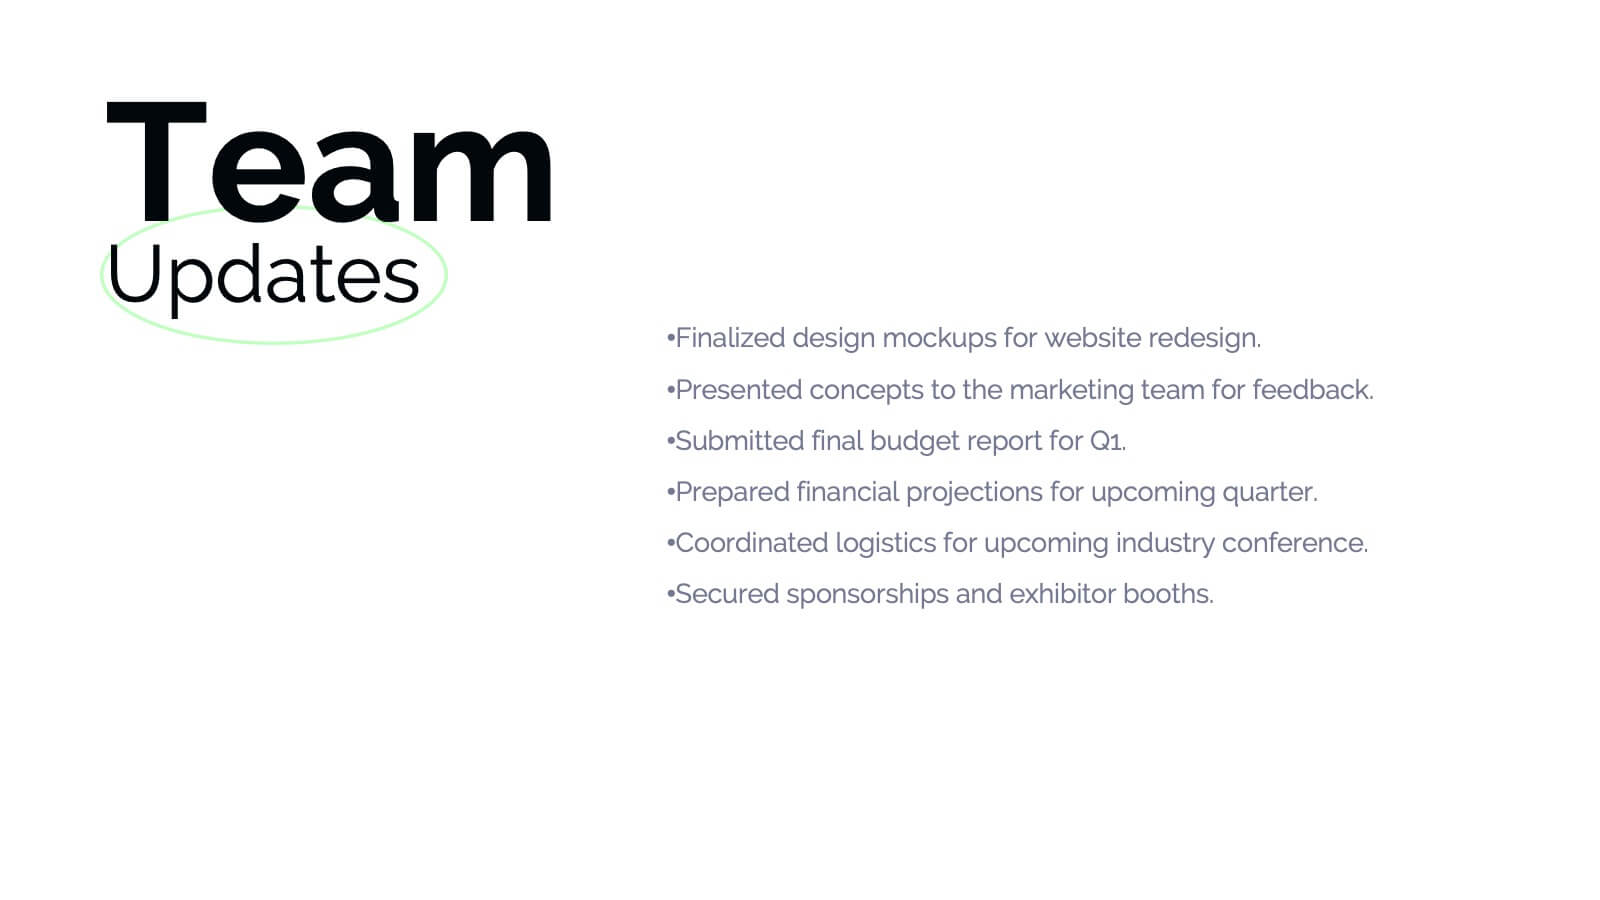
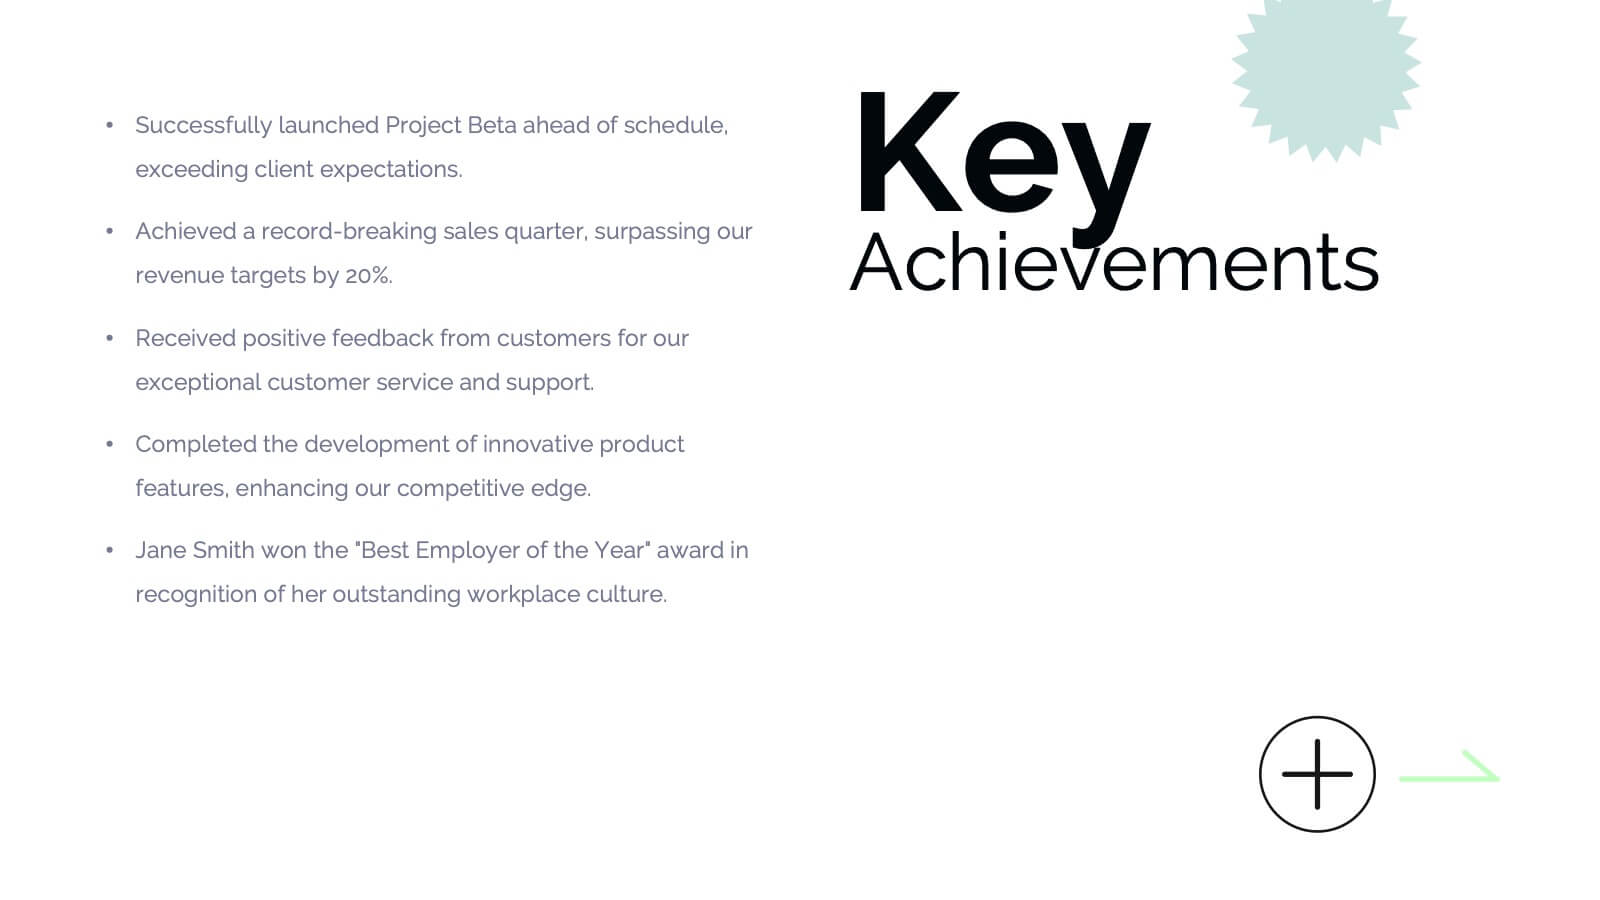
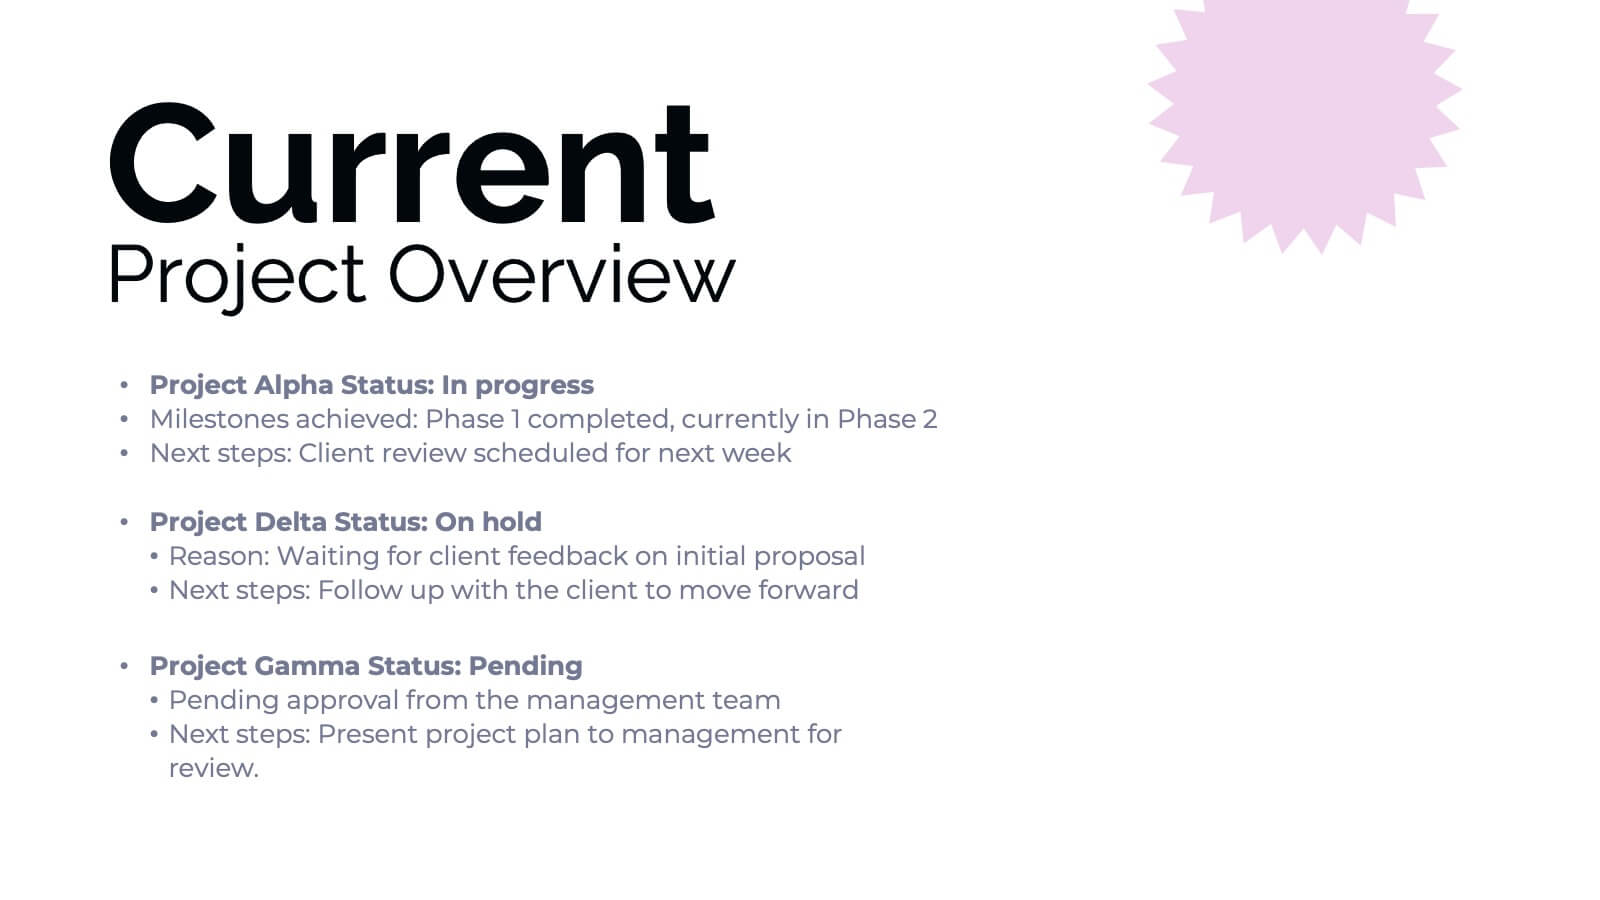
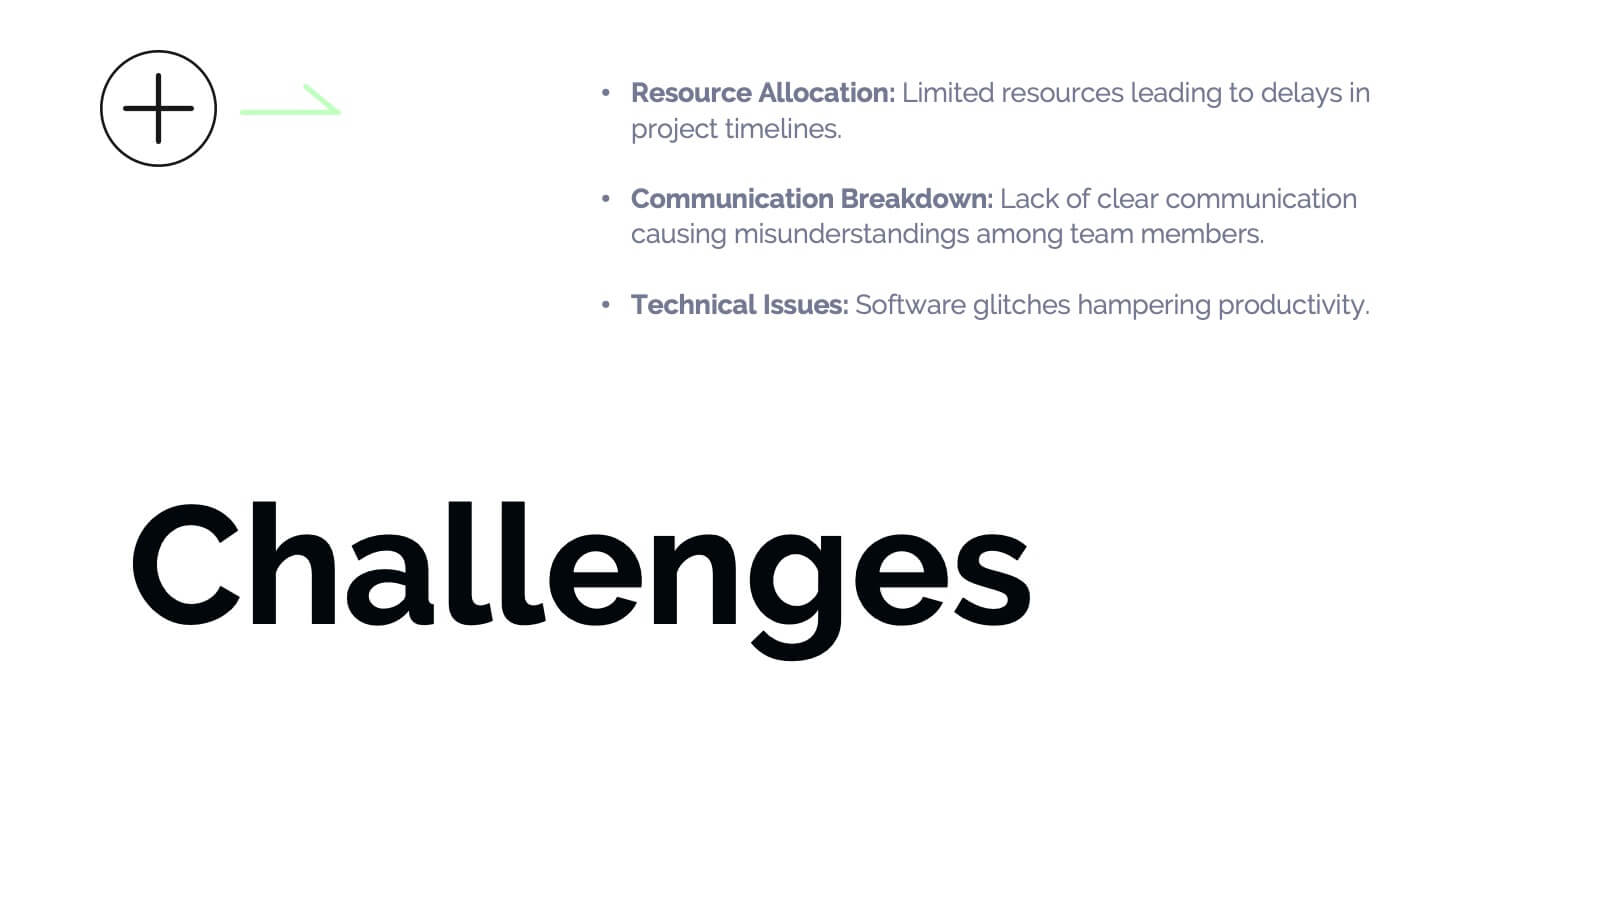
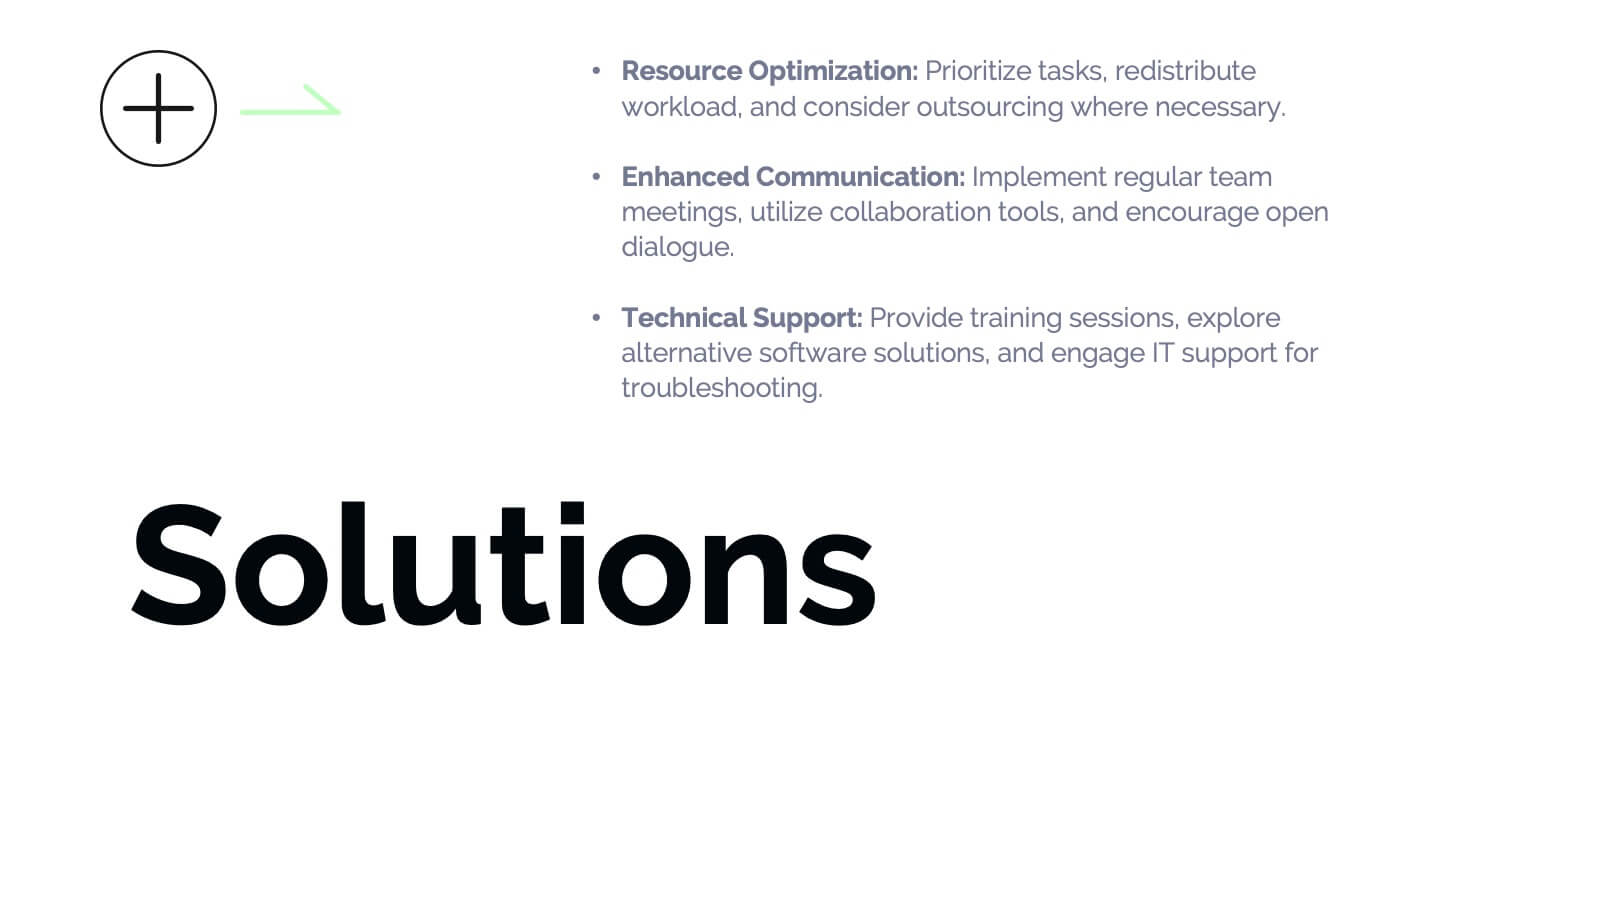
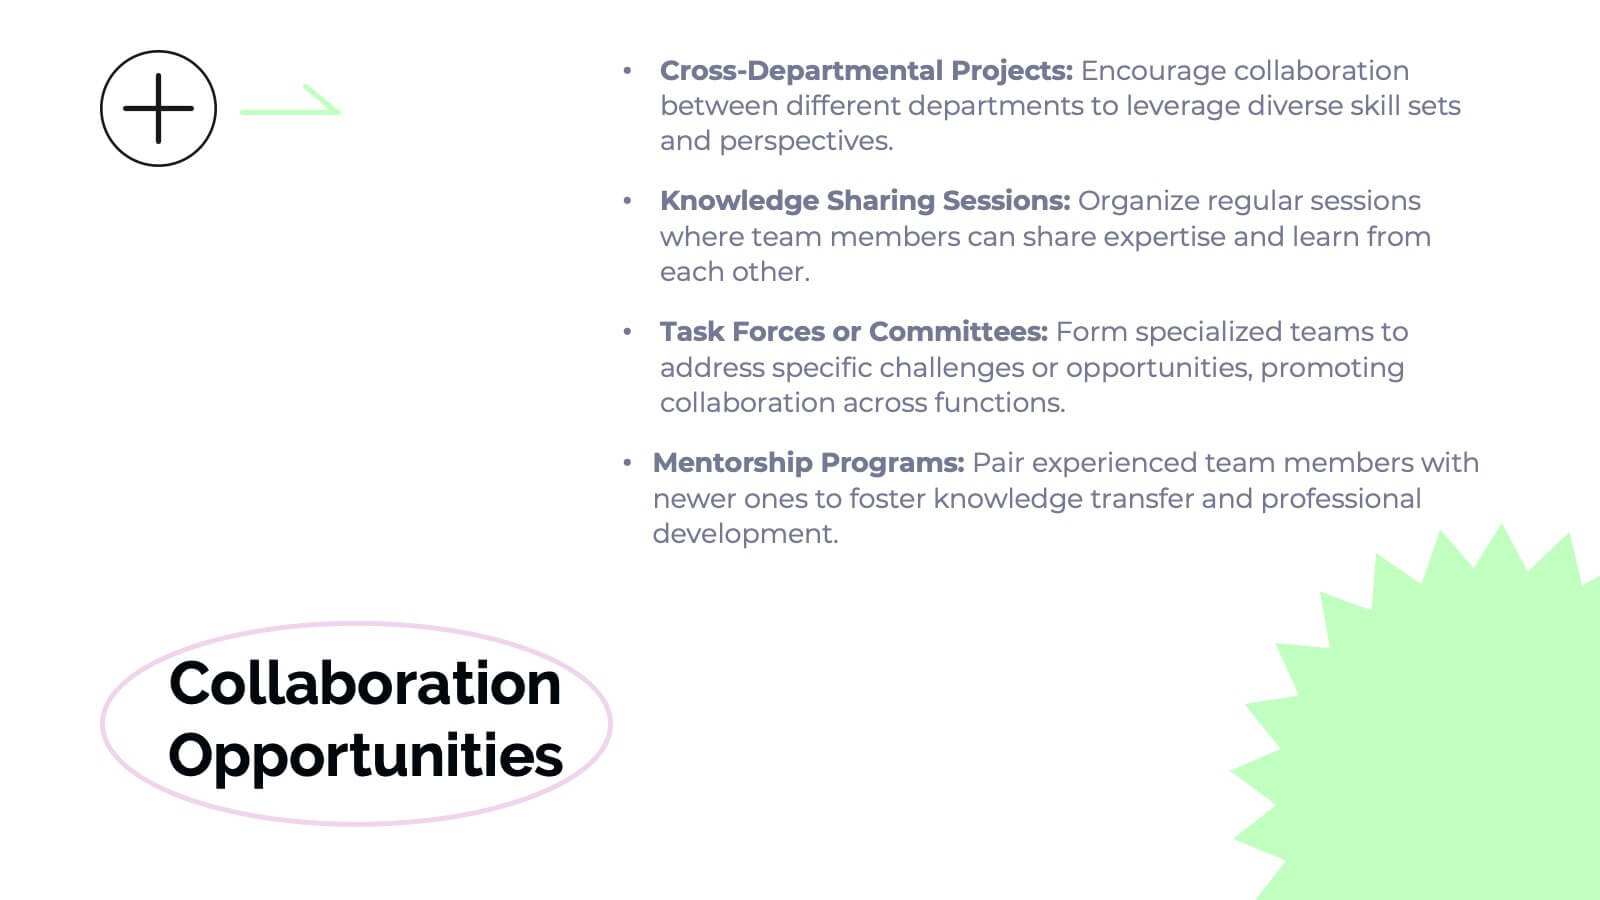
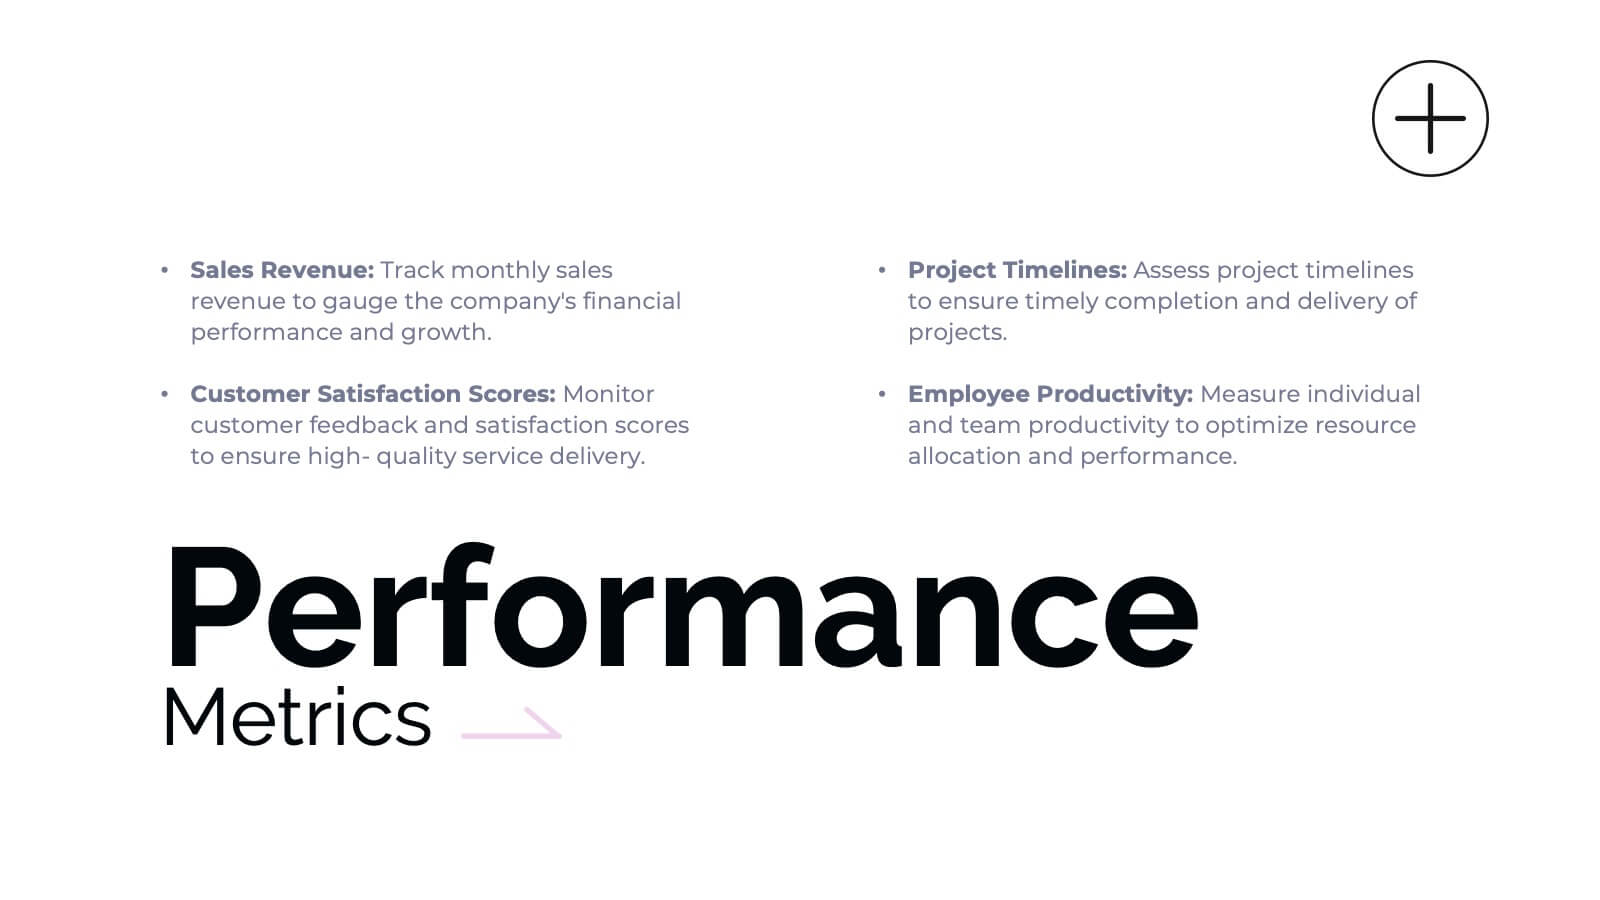
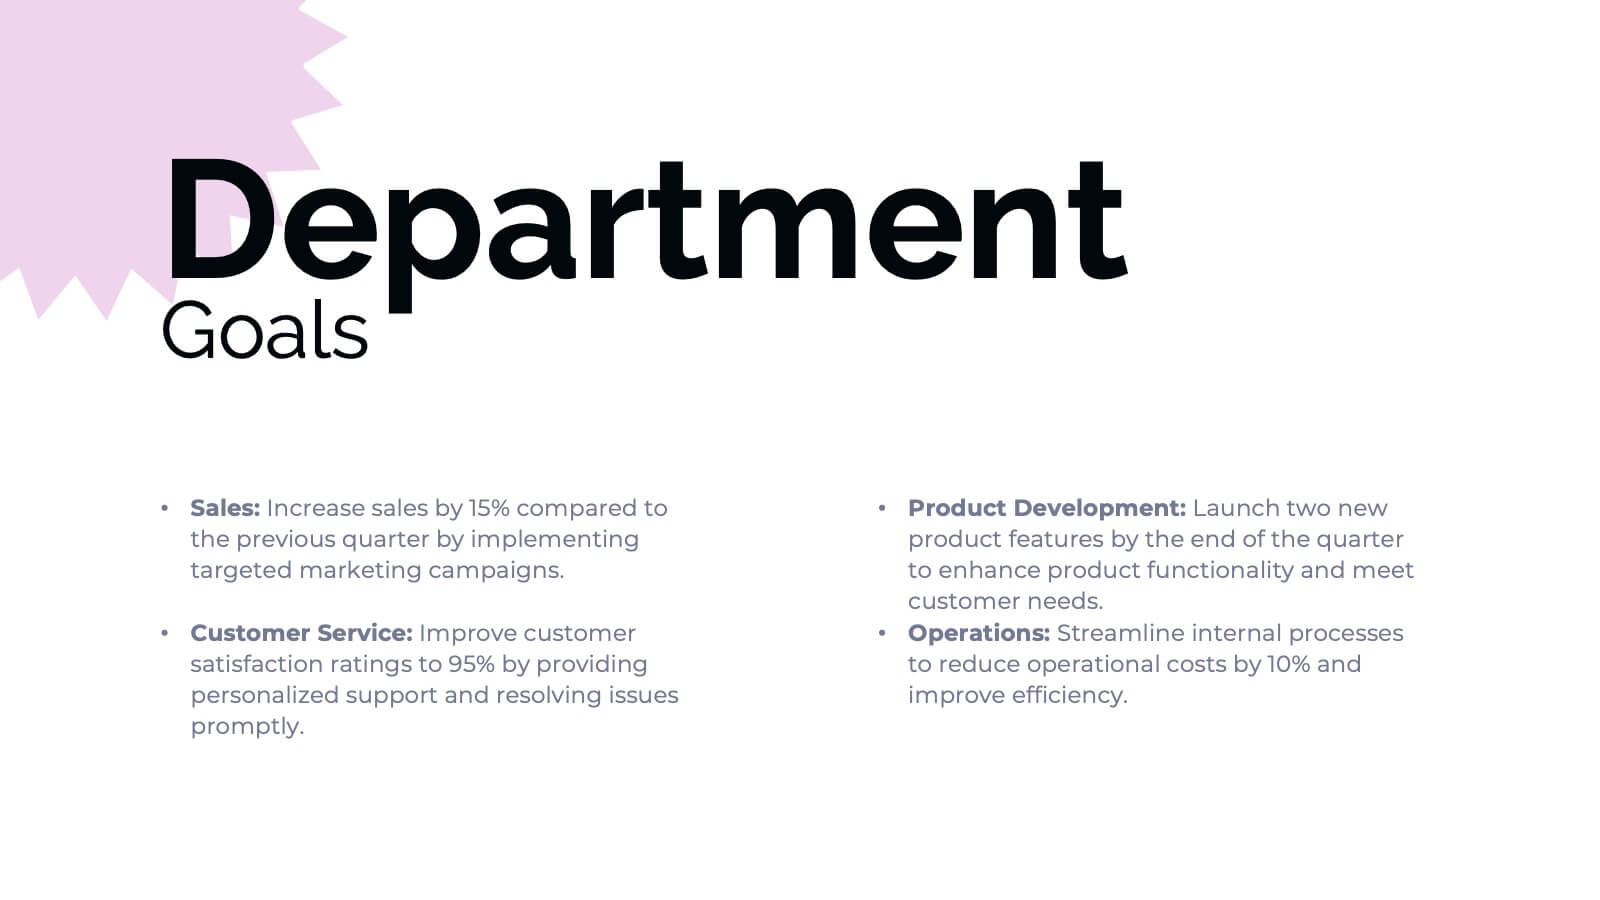
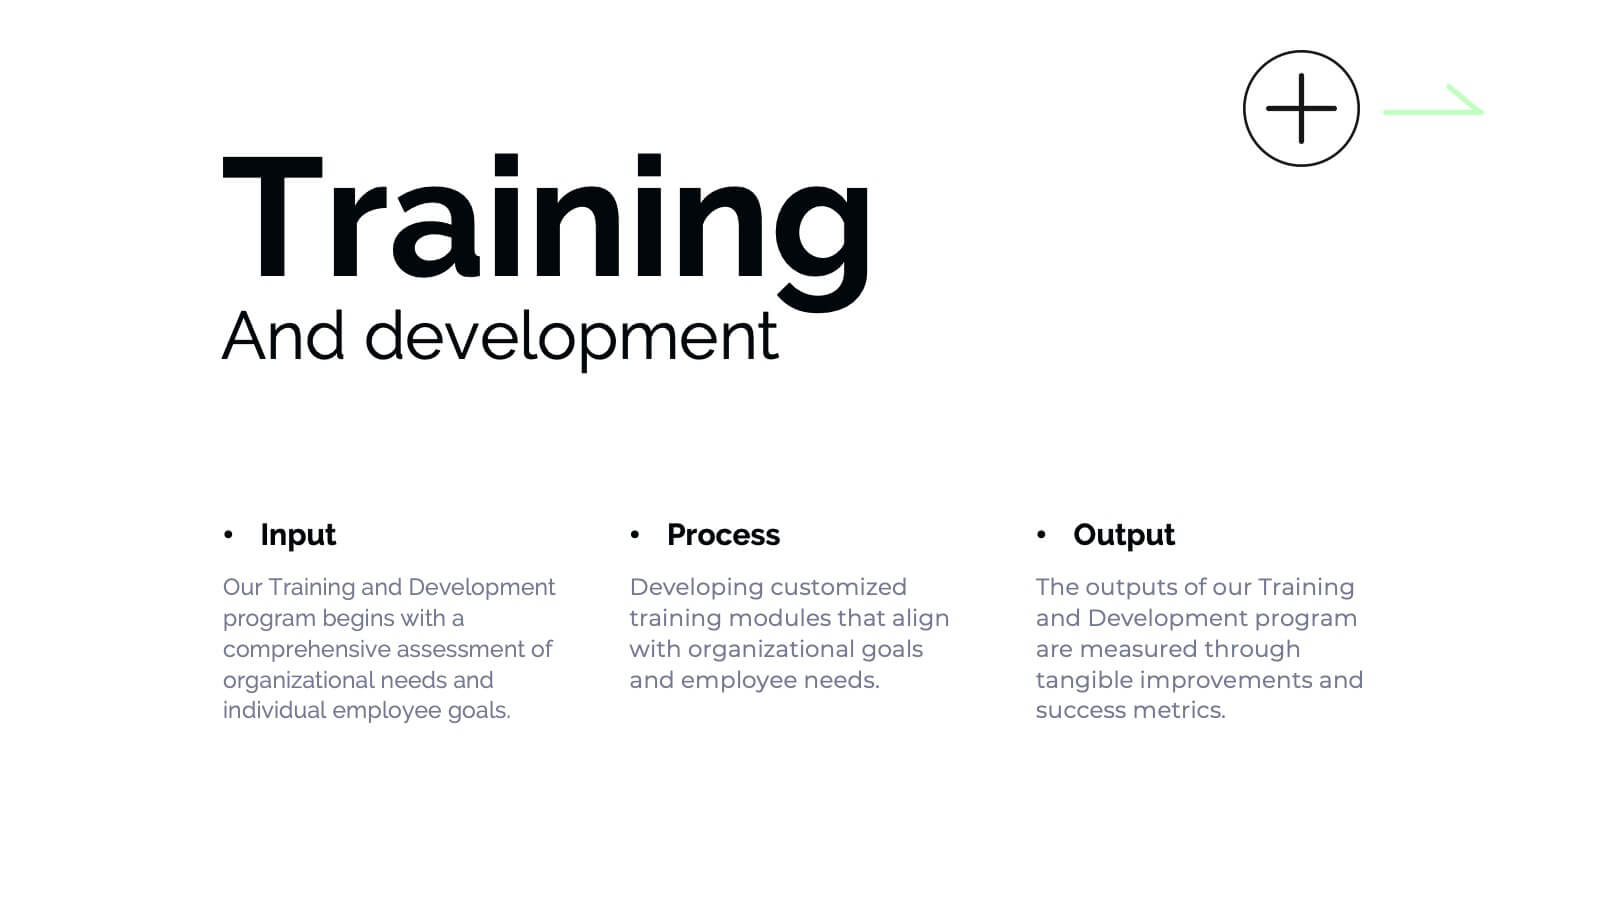
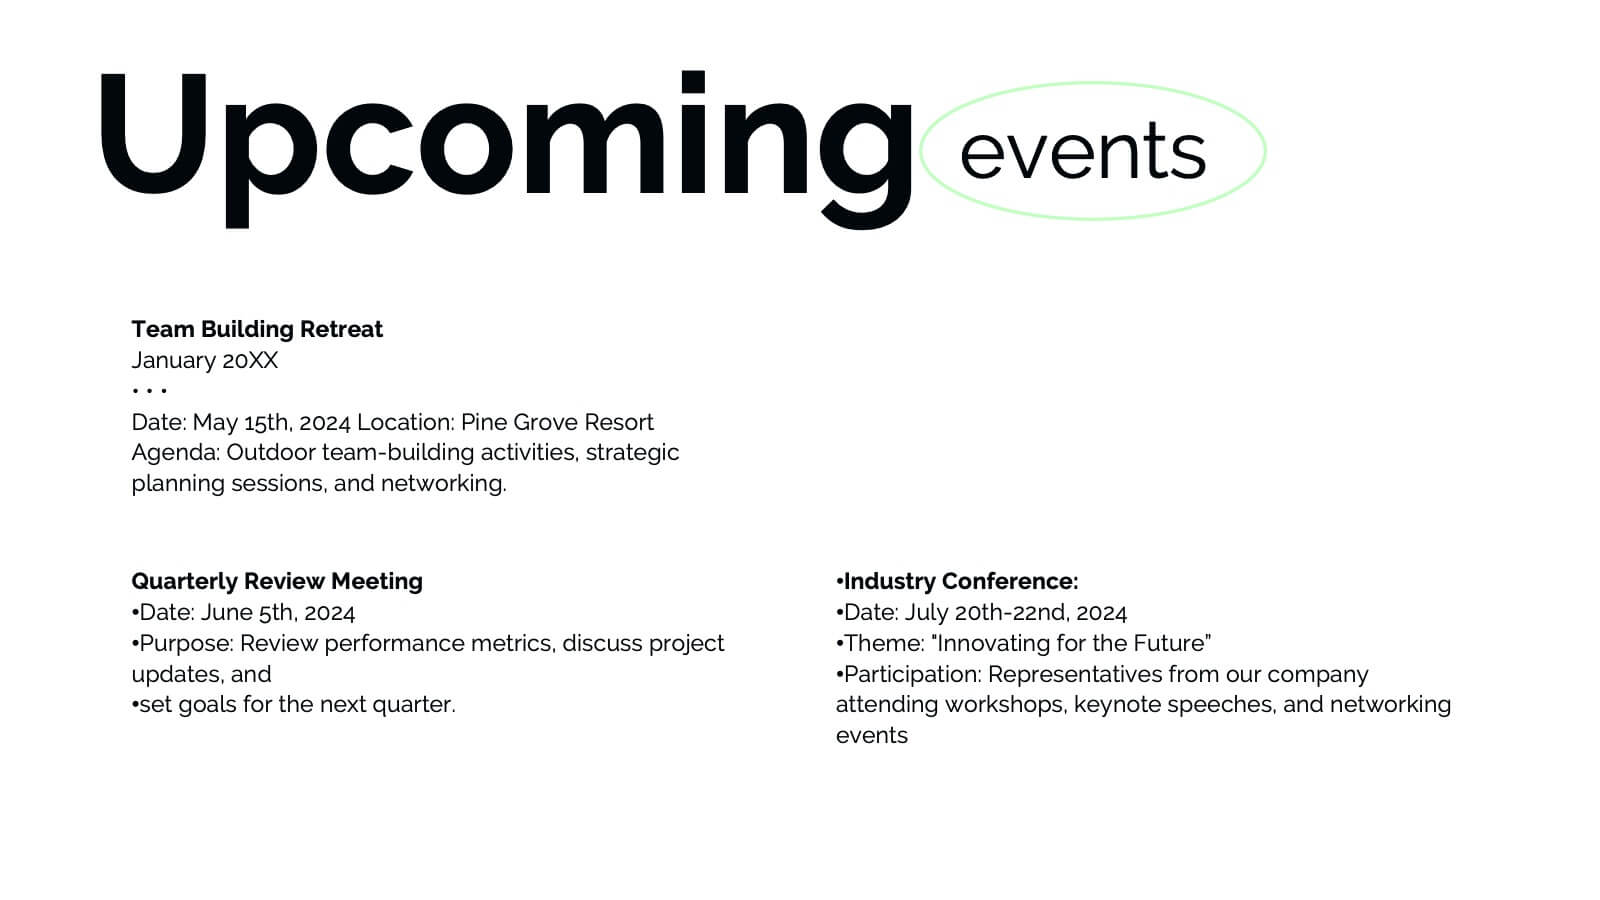
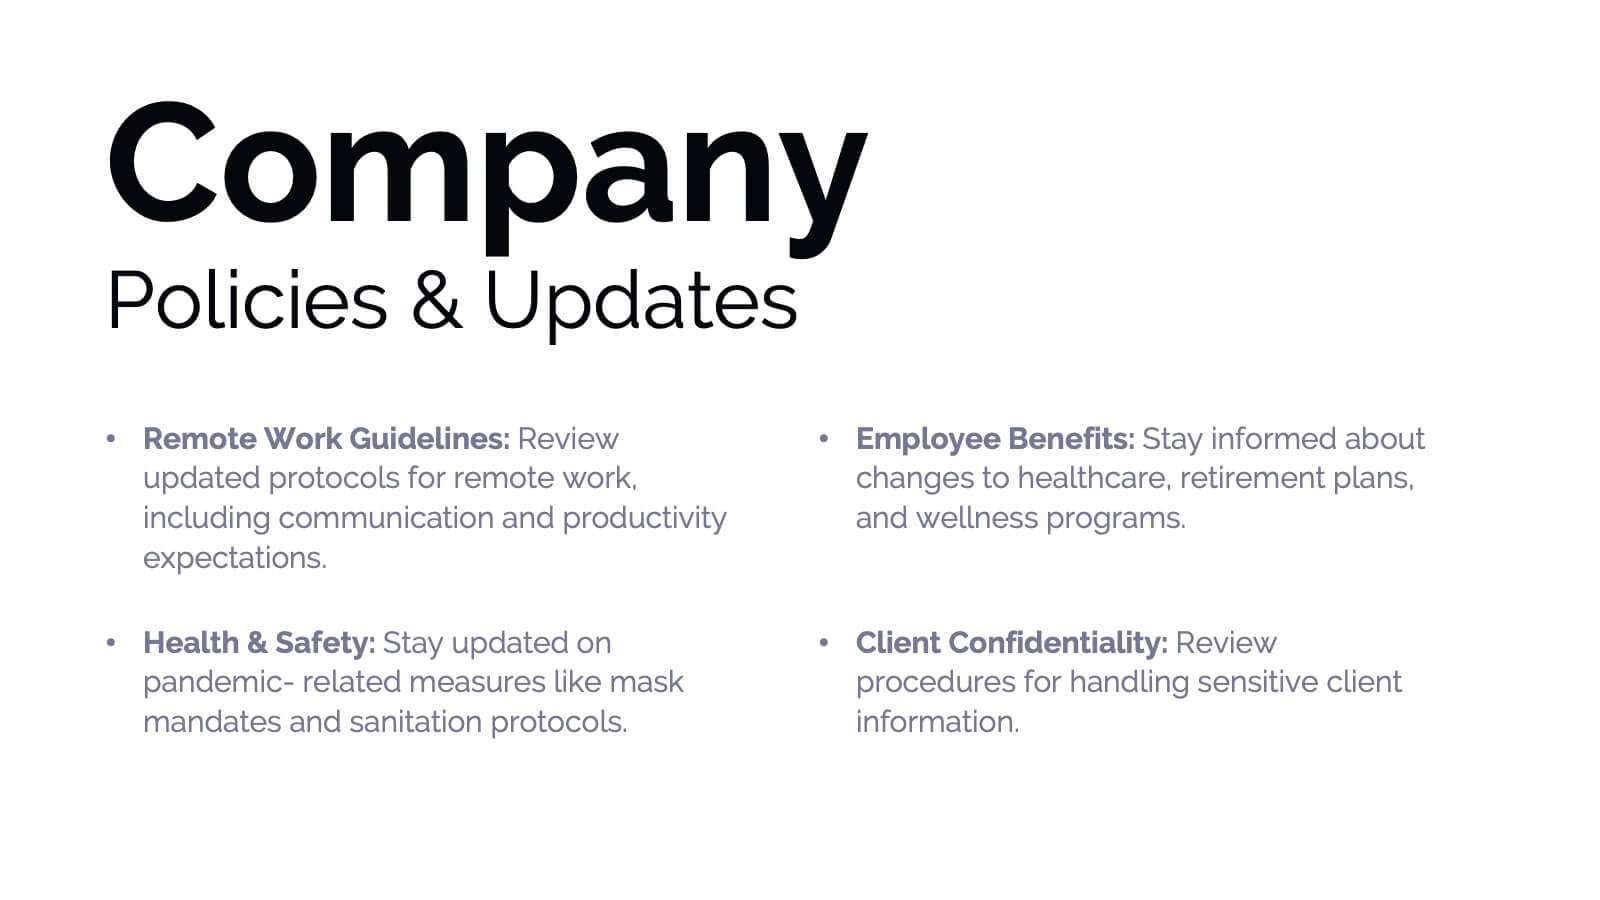
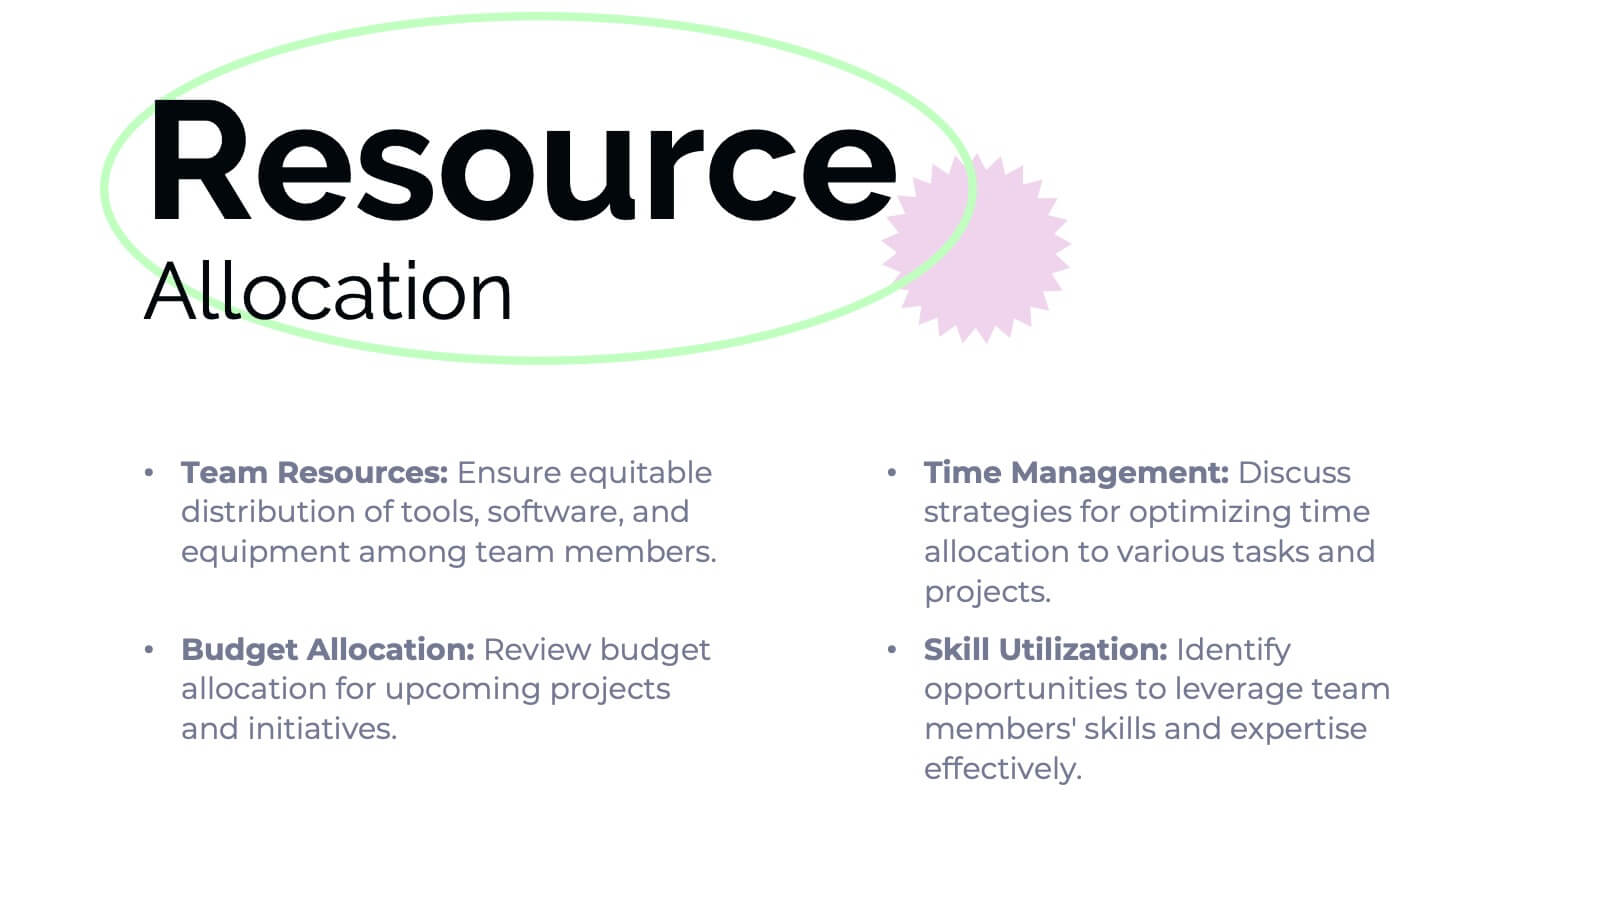
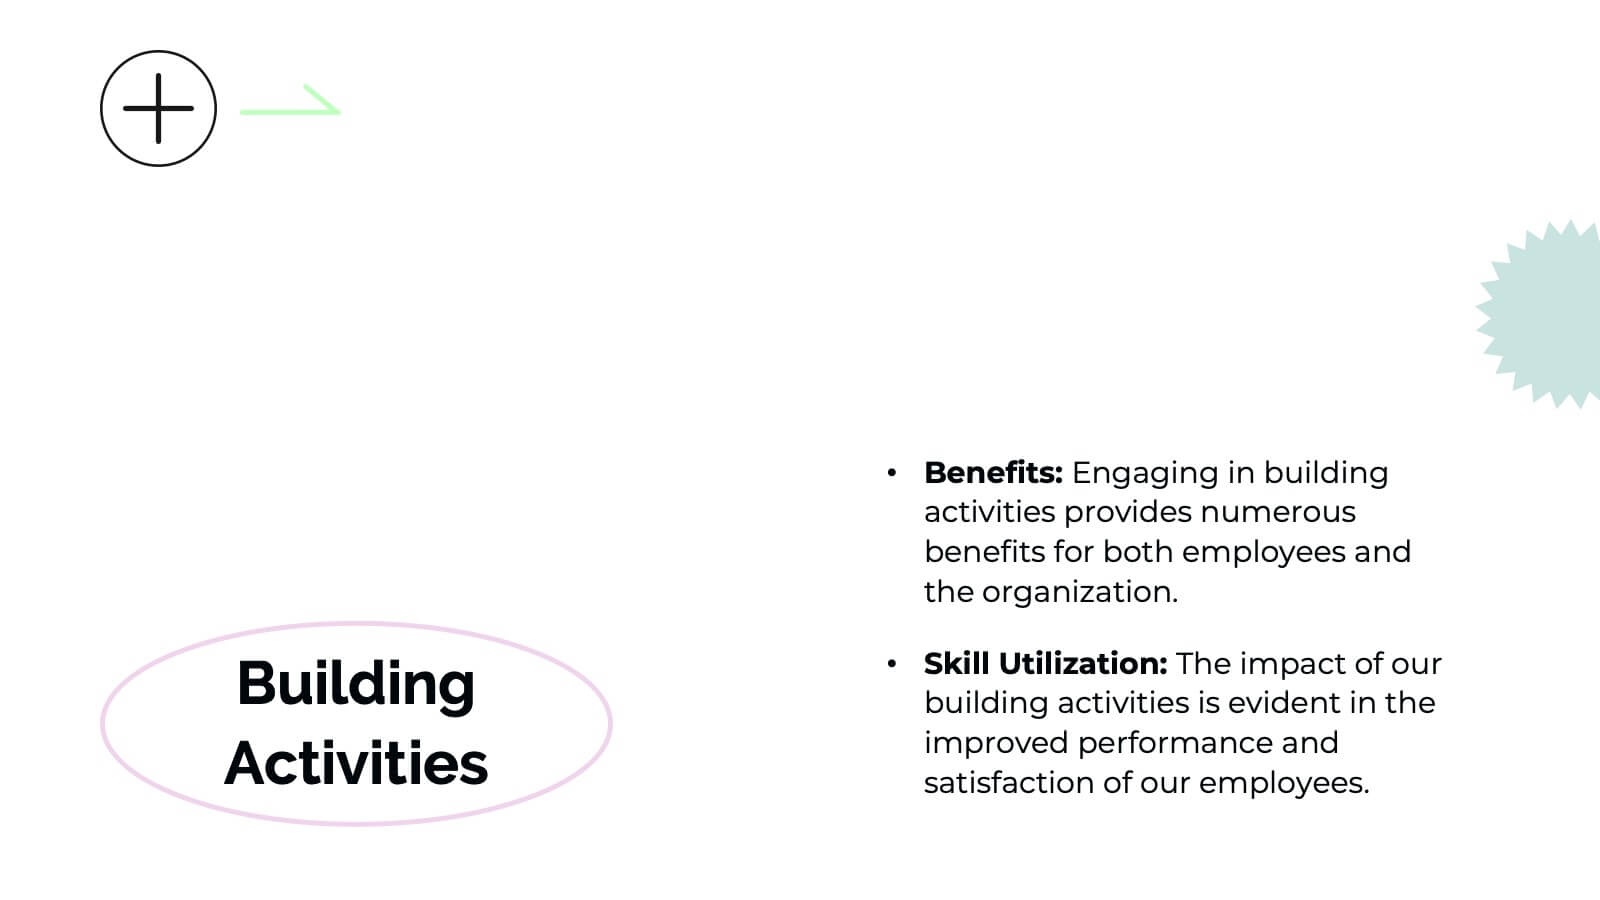
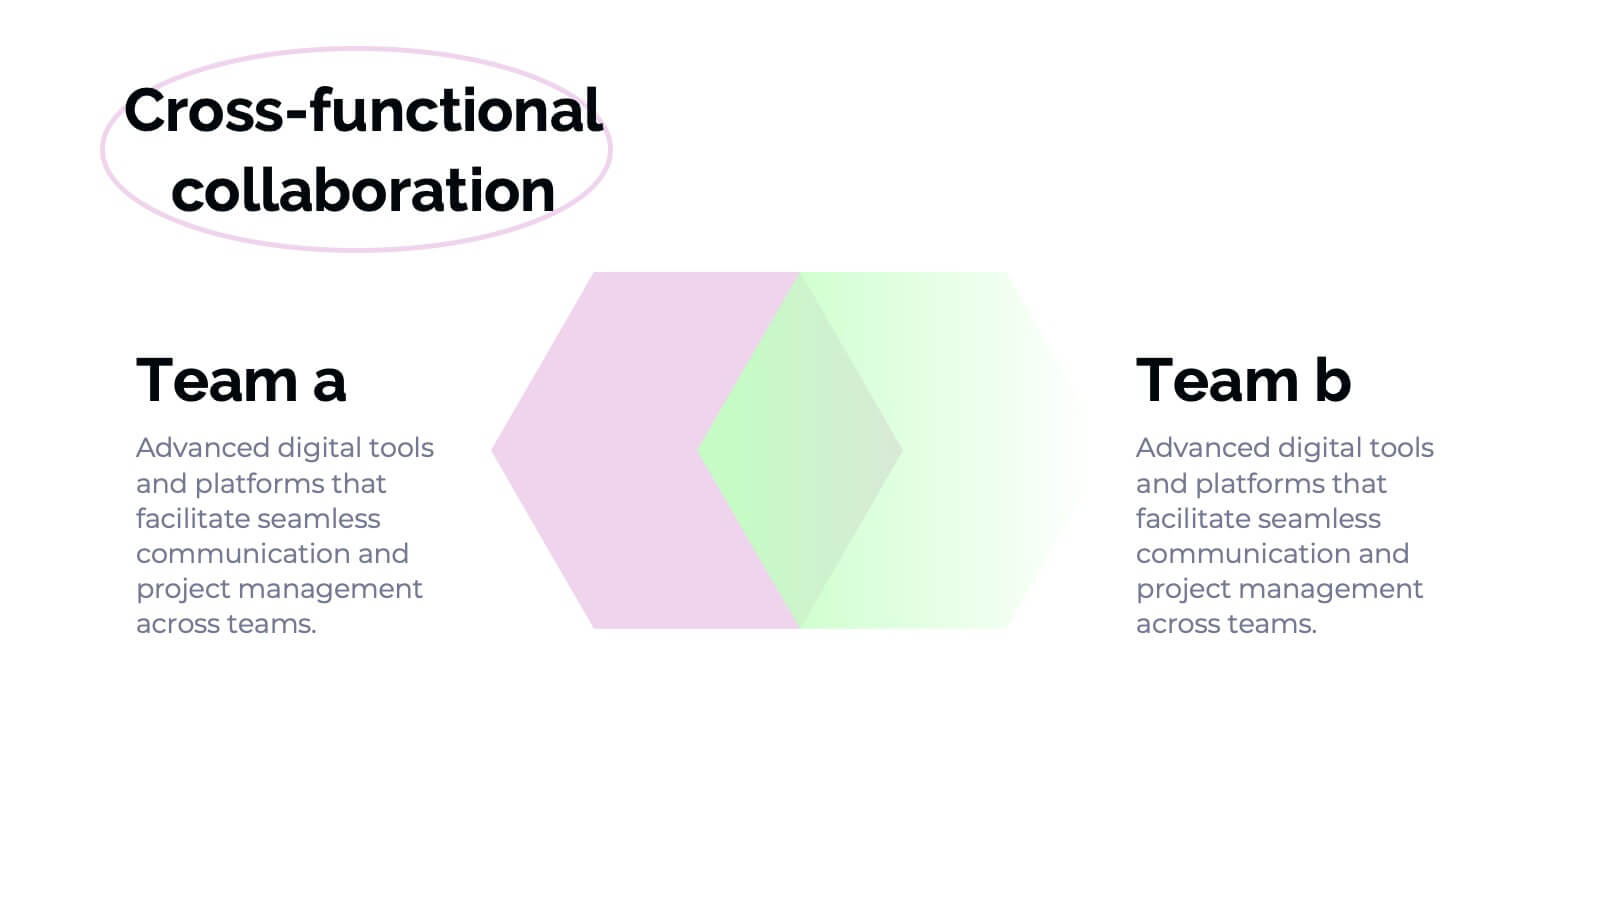
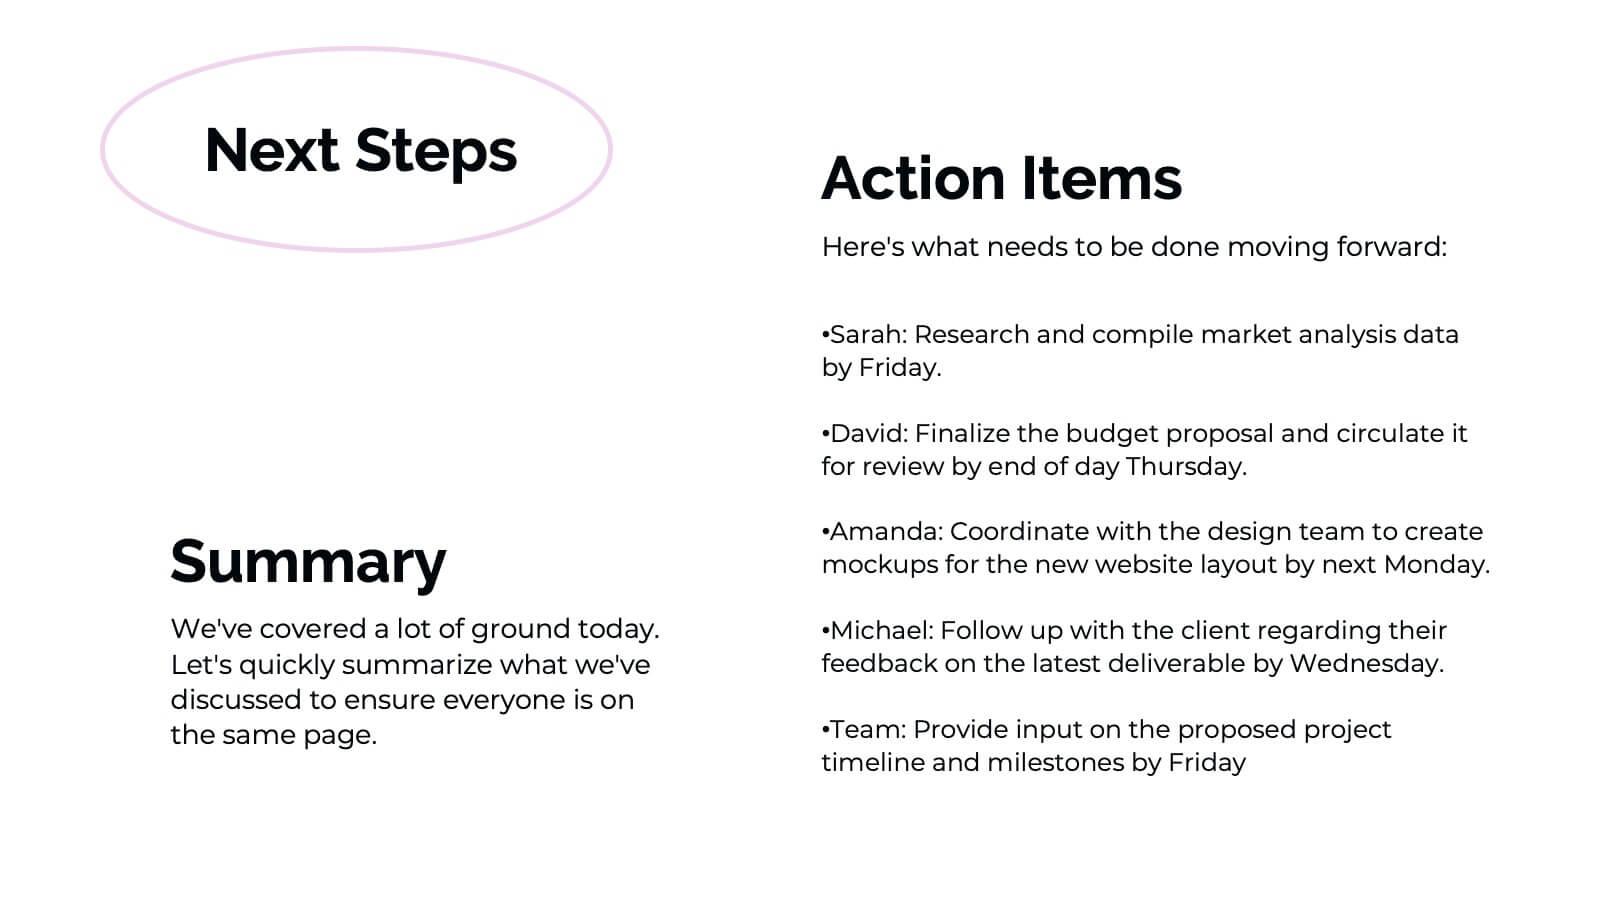
Banshee Business Operations Plan Presentation
Streamline your business operations with this comprehensive presentation template! From team updates and key achievements to challenges and solutions, every aspect of your business plan is covered. Ideal for tracking performance metrics, resource allocation, and upcoming events, this design keeps your operations organized and efficient. Compatible with PowerPoint, Keynote, and Google Slides for seamless integration.


6 diapositivas
Corporate Training Plan Layout Presentation
Bring structure and clarity to your business training process with this clean and professional layout. Each gear-shaped section highlights a key stage in your program, allowing you to present goals, skills, and milestones with precision. Ideal for planning sessions or executive briefings, this template is fully compatible with PowerPoint, Keynote, and Google Slides.


5 diapositivas
Agile and Waterfall PM Models Presentation
Compare two popular project methodologies with ease using the Agile and Waterfall PM Models Presentation. This side-by-side layout highlights key differences in structure, flexibility, and delivery approach—perfect for client briefings, team onboarding, or stakeholder reviews. Fully editable in PowerPoint, Google Slides, Keynote, and Canva for seamless customization.


5 diapositivas
Corporate Case Study Analysis Presentation
Enhance your business presentations with the Corporate Case Study Analysis Presentation template. This structured design helps visualize case studies, success stories, or business challenges in a clear, step-by-step format. Ideal for consultants, business analysts, and executives, this slide simplifies complex data into an easy-to-follow journey. Fully customizable in PowerPoint, Keynote, and Google Slides to align with your brand and insights.


5 diapositivas
Organizational Management Frameworks Overview Presentation
Clarify reporting lines and decision-making roles with the Organizational Management Frameworks Overview Presentation. This clean and color-coded hierarchy chart helps visualize team structure, leadership levels, or departmental breakdowns. Ideal for organizational design, onboarding, or strategic alignment discussions, each placeholder is fully customizable to reflect your company’s framework. Compatible with PowerPoint, Keynote, and Google Slides—perfect for HR professionals, managers, and consultants seeking structure and clarity.


6 diapositivas
Organizational Change Process Presentation
Make complex transitions look simple with this modern visual template. Perfect for illustrating every stage of organizational change, this infographic-style design helps communicate key steps with clarity and focus. Easily editable and professionally designed, it's compatible with PowerPoint, Keynote, and Google Slides for seamless integration into your workflow.


5 diapositivas
Types of Vaccine Infographics
Vaccines are biological substances that stimulate the body's immune system to develop immunity against specific diseases. These vertical infographics provide essential information about different types of vaccines. This infographic serves as a valuable educational resource to raise awareness about vaccines and their role in preventing infectious diseases. The infographic is organized into clear sections, each representing a category of vaccines. Each vaccine category is accompanied by illustrations or icons that represent the type of vaccine being discussed. Compatible with Powerpoint, Keynote, and Google Slides.


4 diapositivas
Current Project Health and Status Report Presentation
Track progress with clarity using the Current Project Health and Status Report presentation slide. Featuring a modern clipboard layout with checkboxes and project tools like a pencil, magnifier, and ruler, this slide is perfect for highlighting task completion, pending issues, and project milestones. Ideal for weekly updates, stakeholder reviews, or status dashboards. Fully editable in PowerPoint, Keynote, and Google Slides.


4 diapositivas
Team and Department Setup Structure Presentation
Organize your team with clarity using the Team and Department Setup Structure Presentation. This template is perfect for showcasing internal team hierarchies, departmental layouts, or functional groupings in a clean and professional layout. Each slide is fully customizable, allowing you to edit icons, titles, and structure to suit your organization. Compatible with Canva, PowerPoint, Keynote, and Google Slides.


7 diapositivas
Porter's Five Forces Analysis Infographic
Unveil the key elements influencing your industry with Porter's Five Forces Analysis Infographic. Drenched in vibrant shades of yellow, blue, and white, this template offers a lucid visualization of the five crucial forces that determine the competitive intensity in the market. Ideal for business analysts, strategy planners, or management students, it offers a nuanced understanding of market dynamics. Its engaging design captures attention while facilitating comprehensive discussions on potential opportunities or threats. With compatibility across PowerPoint, Keynote, and Google Slides, it promises smooth transitions during presentations.