


Características


¿Tienes alguna pregunta?
Recomendar


4 diapositivas
Project Responsibility RACI Matrix Presentation
The "Project Responsibility RACI Matrix" presentation effectively delineates the responsibilities associated with different roles in a project. Each slide visually encodes the responsibilities as Responsible, Accountable, Consulted, or Informed for various tasks across different roles, enhancing clarity and promoting a thorough understanding of who is involved in each phase of project execution. This format is particularly useful for complex projects where multiple stakeholders need clear communication about their roles and contributions.


4 diapositivas
Global Market Overview with World Map Presentation
Present international data visually with this world map slide layout. Ideal for showcasing market reach, regional insights, or global performance metrics. Each pin can be customized with location-specific information and iconography. Perfect for business overviews, sales reports, and investor decks. Editable in PowerPoint, Keynote, and Google Slides.


7 diapositivas
Vacations Travel Infographic
Are you ready to embark on a journey around the world? Our Vacations Travel Infographic is your ultimate guide to thrilling destinations, exotic experiences, and memorable adventures. Whether you're a passionate traveler seeking new horizons or an explorer at heart, this infographic is designed to ignite your wanderlust and set your vacation dreams on fire. Compatible with Powerpoint, Keynote, and Google Slides. Dive into the world of travel with this vivid infographic that sparks excitement and eagerness to discover what lies beyond. This template is not just a visual delight, it's a roadmap to your dream vacation!


5 diapositivas
Business Strategy Decision Tree Presentation
Streamline your strategic decisions with this Business Strategy Decision Tree template. Designed to visually map out options, outcomes, and key choices, this slide is perfect for business analysts, consultants, and executives. Featuring hierarchical branching with clear icons and customizable sections, it helps illustrate strategic planning, problem-solving, and risk assessment. Fully compatible with PowerPoint, Keynote, and Google Slides for seamless presentation integration.


26 diapositivas
Financial Literacy Simple Presentation
Our "Financial Literacy" template is a must-have for anyone teaching money management, savings, and investment strategies. Compatible with PowerPoint, Keynote, and Google Slides, it makes financial education accessible and engaging. Introduce the basics with "Financial Literacy: Creating a Smarter Tomorrow" and outline your agenda with the "Table of Contents." The "Meet Our Team" slide can spotlight your financial experts, and the "Three Option Slide" breaks down key concepts like budgeting, saving, and investing. The "This is your big image slide" can visualize financial goals, while "Earn, Save, Invest, Protect." reinforces sound financial habits. Use "This is your Chart Slide" to present data on spending patterns and "Brain Infographic" to explore the psychology of spending. The template's clean design and customizable features make it easy to tailor your financial literacy presentation to any audience, ensuring that your message on smart money management is clear and impactful.


3 diapositivas
Search Engine Optimization Strategy Presentation
Stand out in your next presentation with this dynamic visual breakdown of digital visibility tactics. Perfect for marketers, business owners, or SEO specialists, this colorful circular infographic highlights the key pillars of a search strategy in a way that's both professional and easy to follow. Compatible with PowerPoint, Keynote, and Google Slides.


7 diapositivas
North America Language Map Infographic
Embark on a visual odyssey across the vast terrains of North America with our expertly crafted map infographic. Painted in the expansive blue, the lush green, the vibrant yellow, and the warm orange, our template captures the essence of North America's diverse geographies and cultures. Adorned with accurate infographics, distinct icons, and region-specific image placeholders, it provides a panoramic view of the continent's multifaceted landscape. Flawlessly tailored for Powerpoint, Keynote, or Google Slides. An indispensable tool for educators, travelers, geographers, or businesses targeting the North American market. Navigate with purpose; let every slide be a step into North America's captivating expanse.


5 diapositivas
5 Whys Analysis Slide Presentation
Unlock problem-solving clarity with a vibrant, puzzle-style layout that helps teams dig deeper and uncover the true reason behind any challenge. This presentation guides viewers through each “why” step in a simple, structured flow, making root-cause insights easy to communicate. Fully compatible with PowerPoint, Keynote, and Google Slides.


7 diapositivas
Work From Home Online Infographic
Work from home online refers to a work arrangement where individuals can perform their job responsibilities remotely, usually from their homes, using internet-connected devices like computers, laptops, tablets, or smartphones. Unveil the modern realm of remote work with our work from home online infographic. This visually engaging and informative template takes you on a journey through the digital landscape of remote work, showcasing its advantages, best practices, and the tools that enable seamless virtual collaboration. This infographic isn't just a visual guide it's a roadmap to thrive in the evolving world of work.


7 diapositivas
Self-sufficient Environmental Infographic
In an era where sustainability is paramount, understanding self-sufficiency in environmental contexts has never been more crucial. Our refreshing infographic, adorned in crisp whites, lush greens, with subtle black nuances, delves deep into this pivotal subject. Crafted to be both educational and engaging, this infographic sheds light on the essentials of eco-friendly independence. It's a must-have tool for educators, environmental enthusiasts, policy-makers, and individuals aiming for a green footprint. Seamlessly integrated with PowerPoint, Keynote, and Google Slides, our infographic invites you to explore, educate, and empower for a more sustainable tomorrow.


23 diapositivas
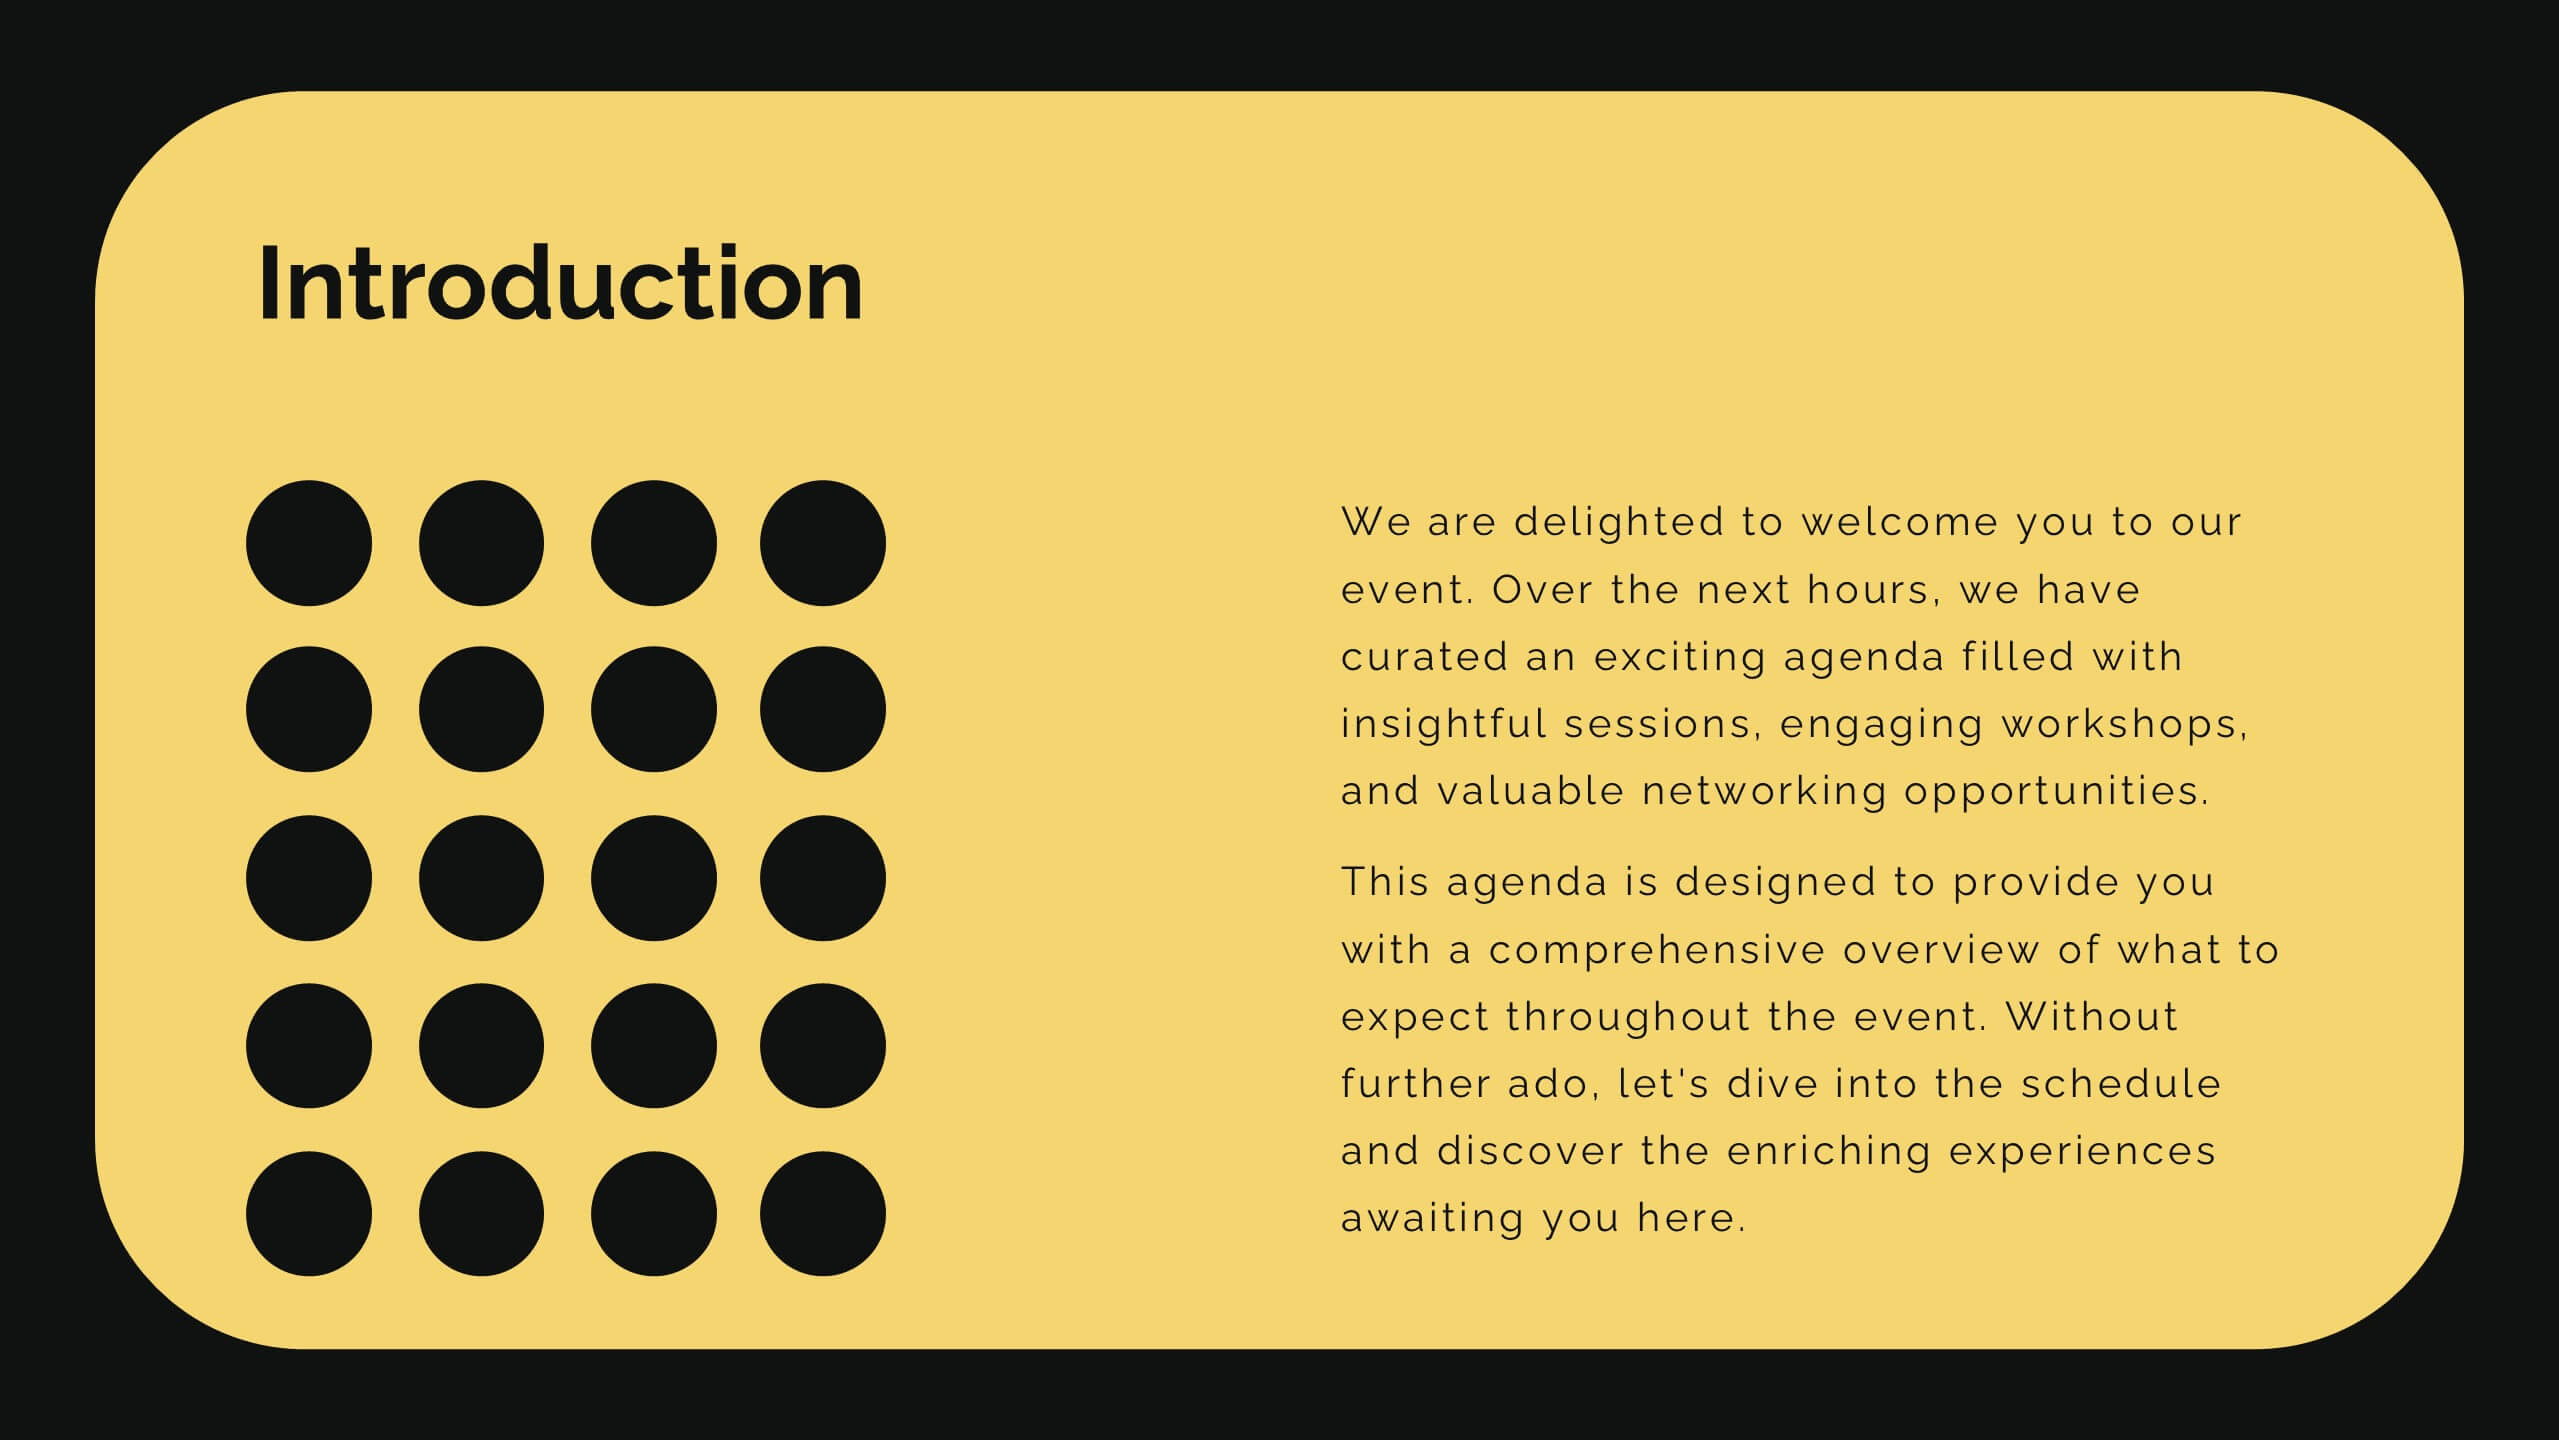
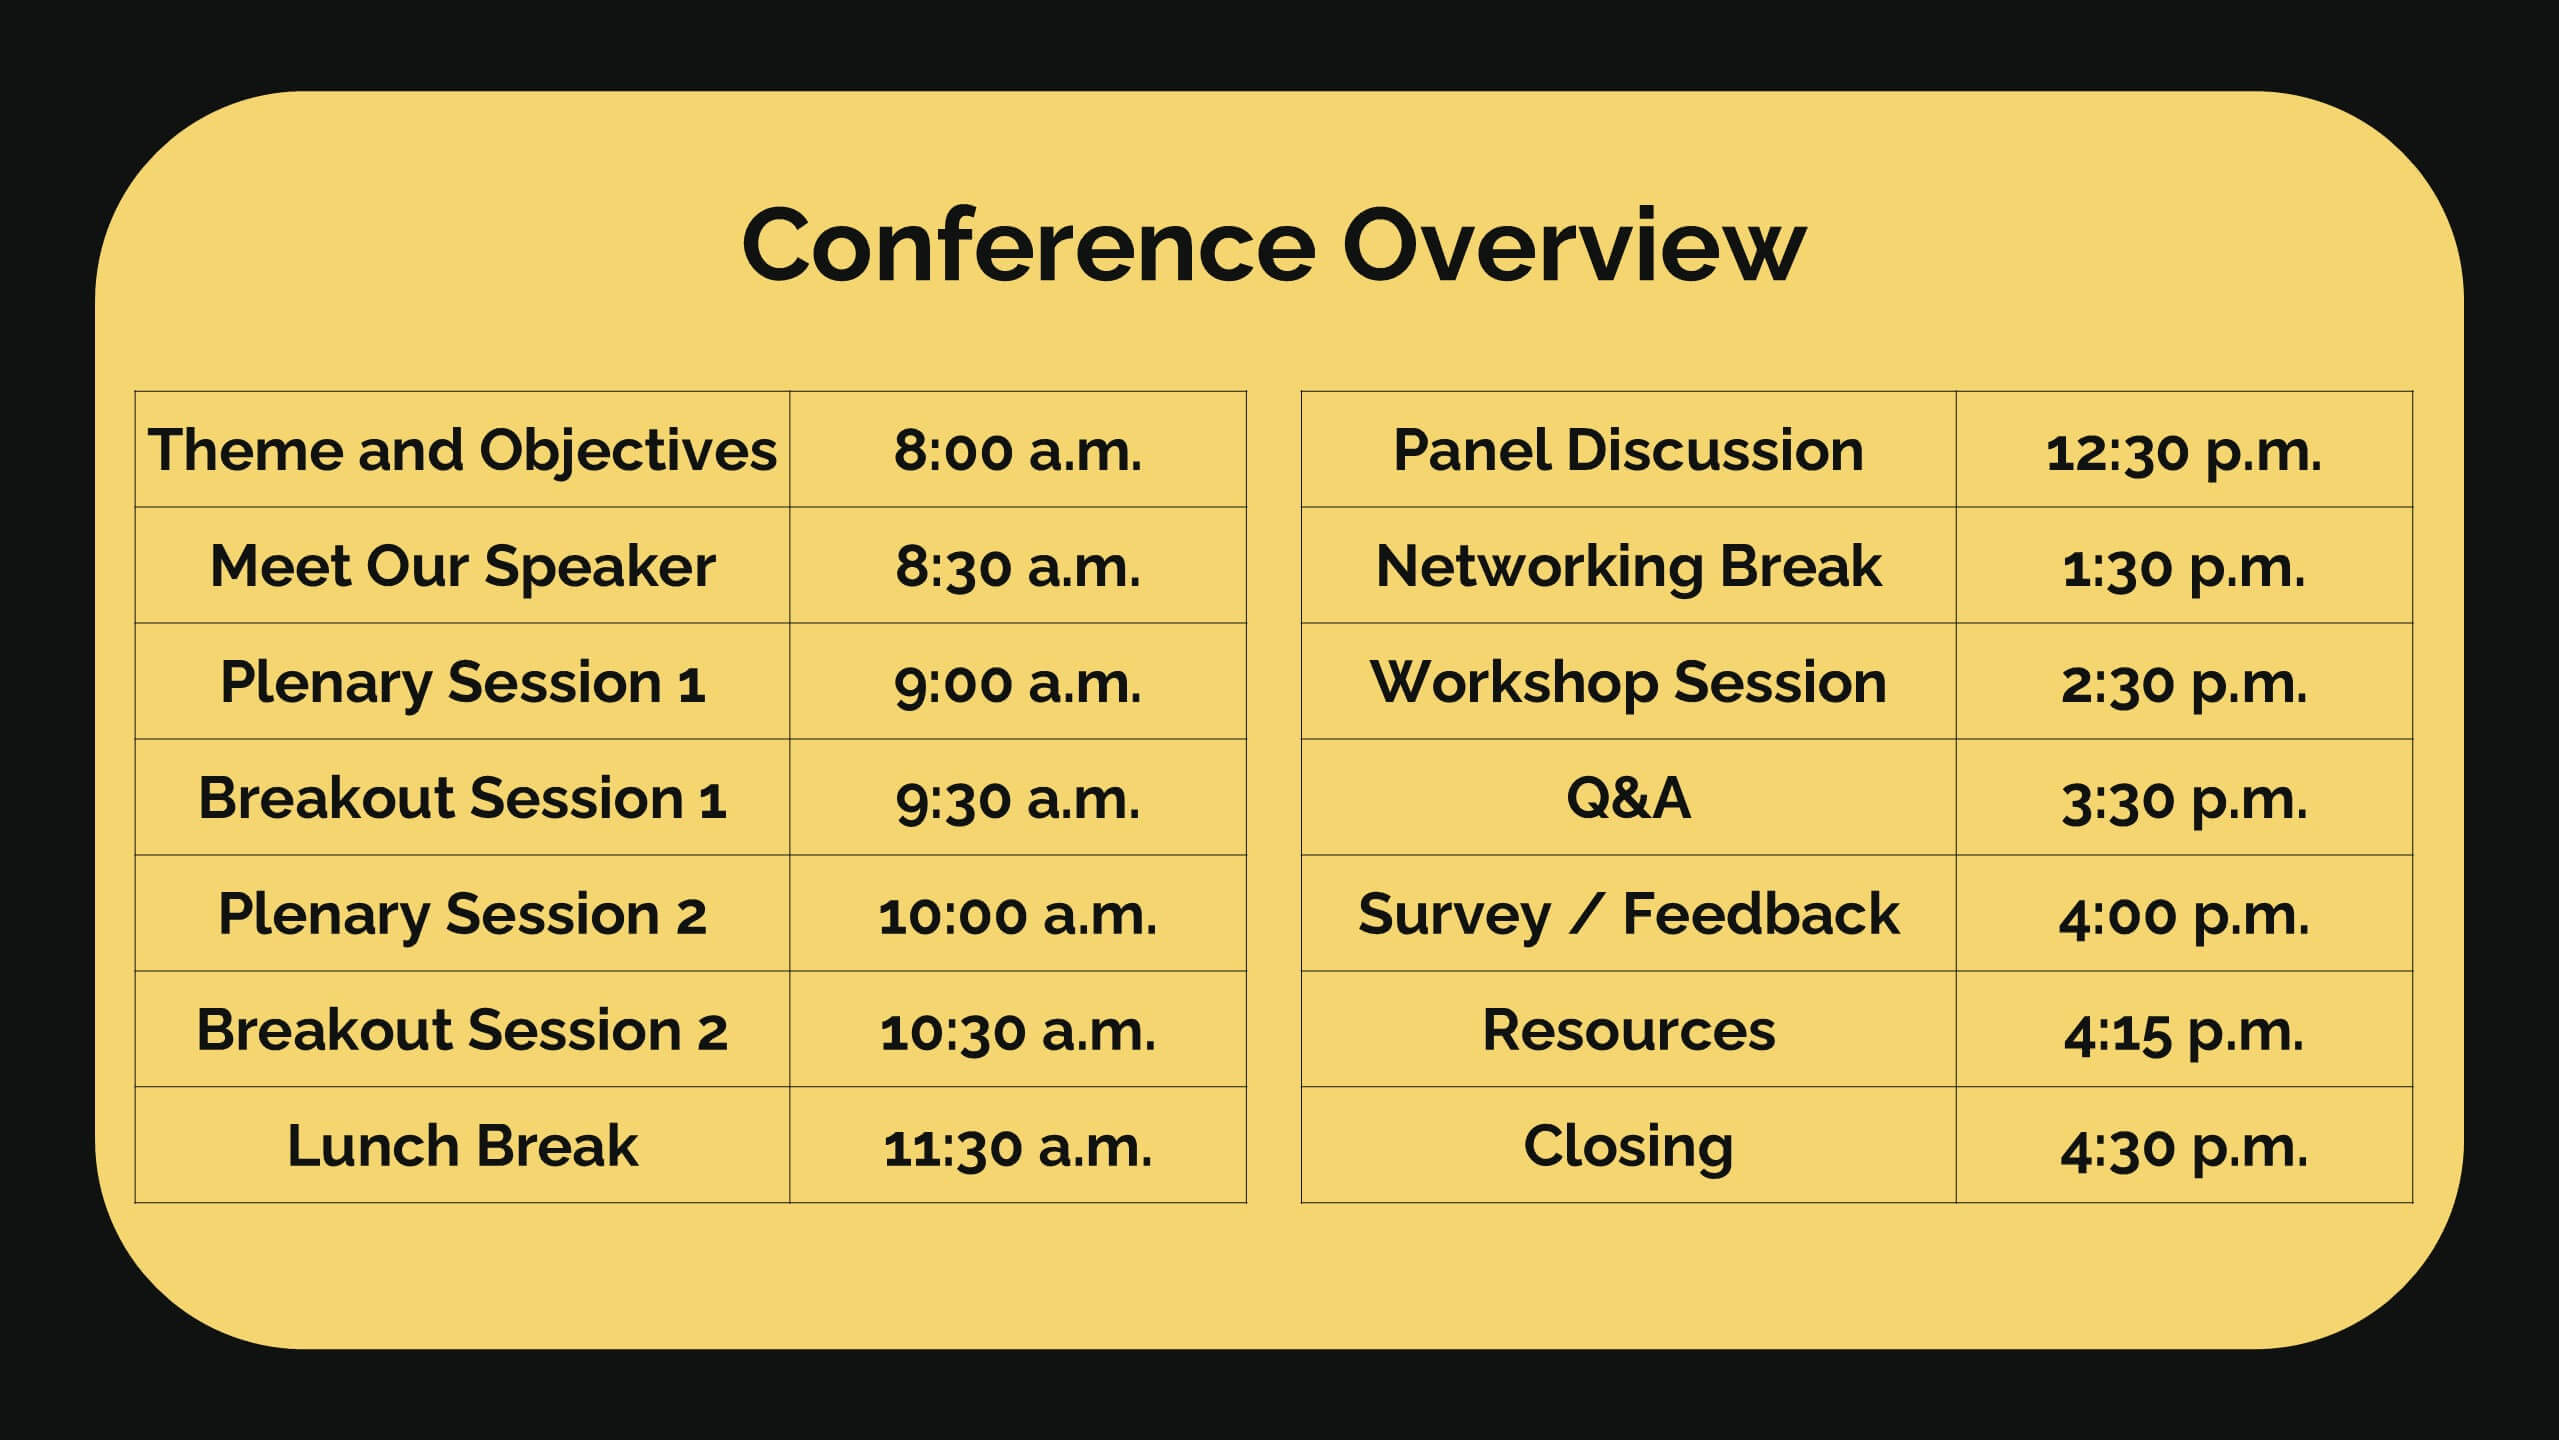
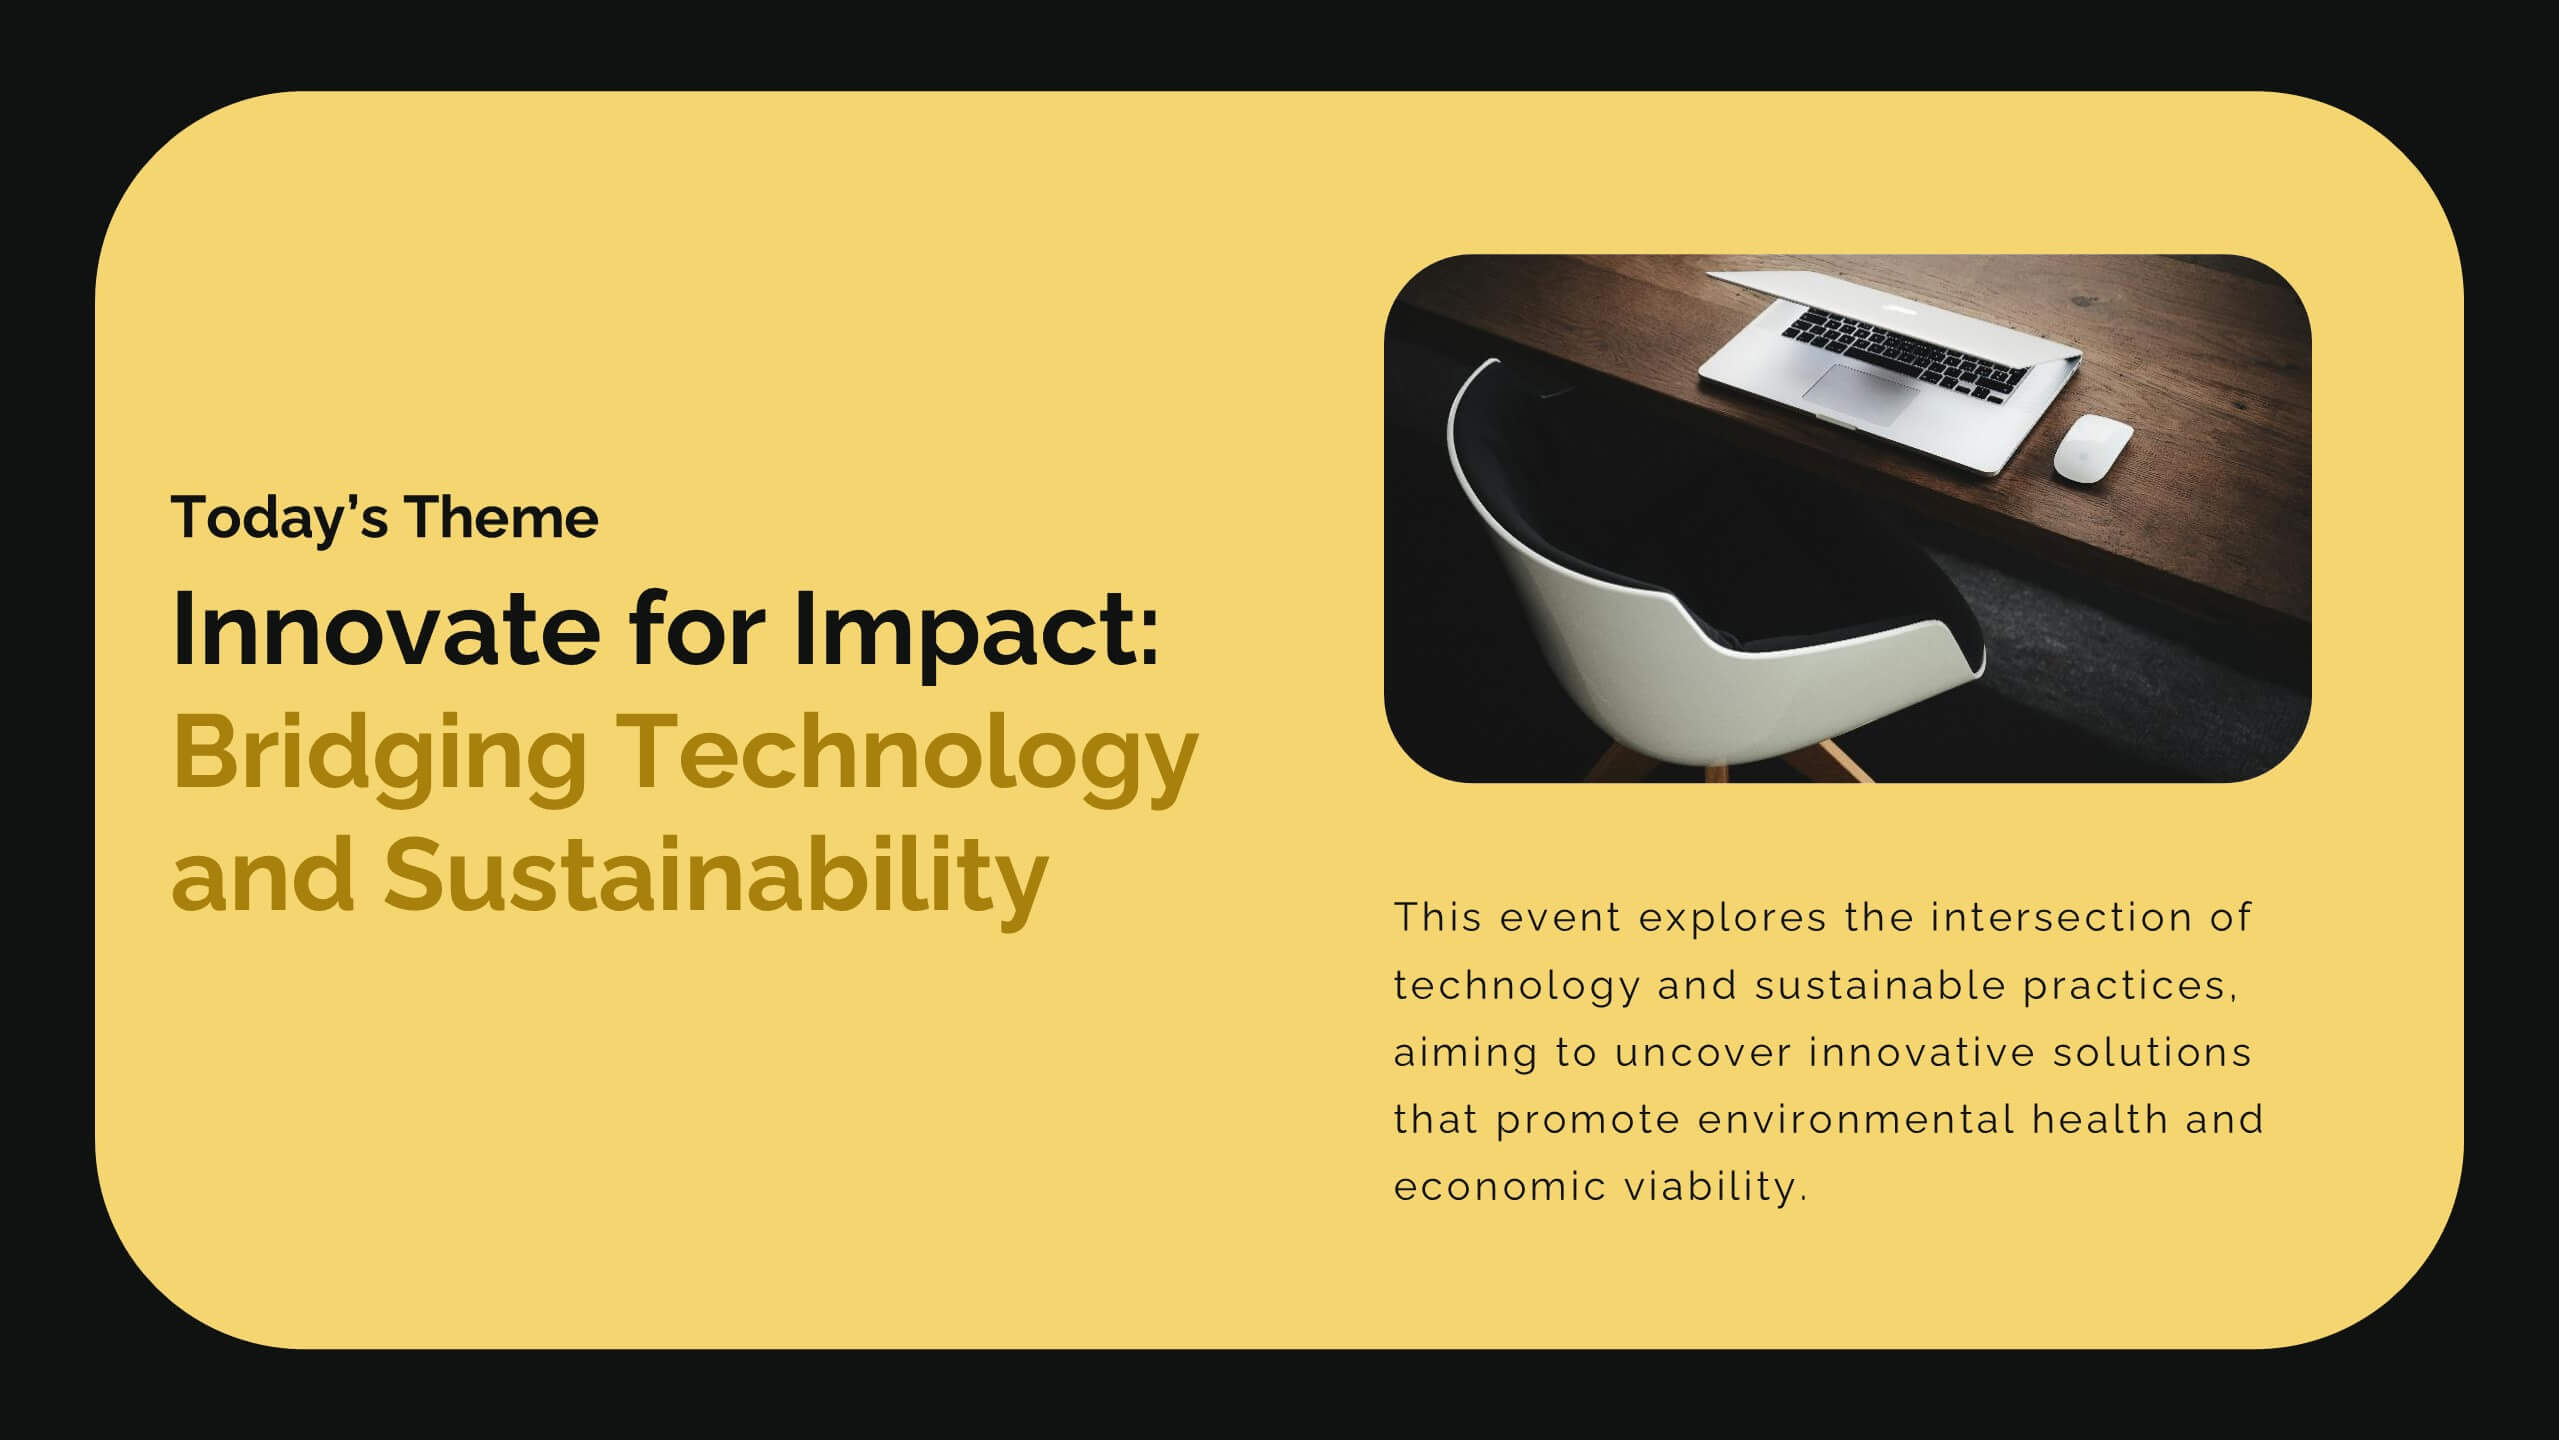
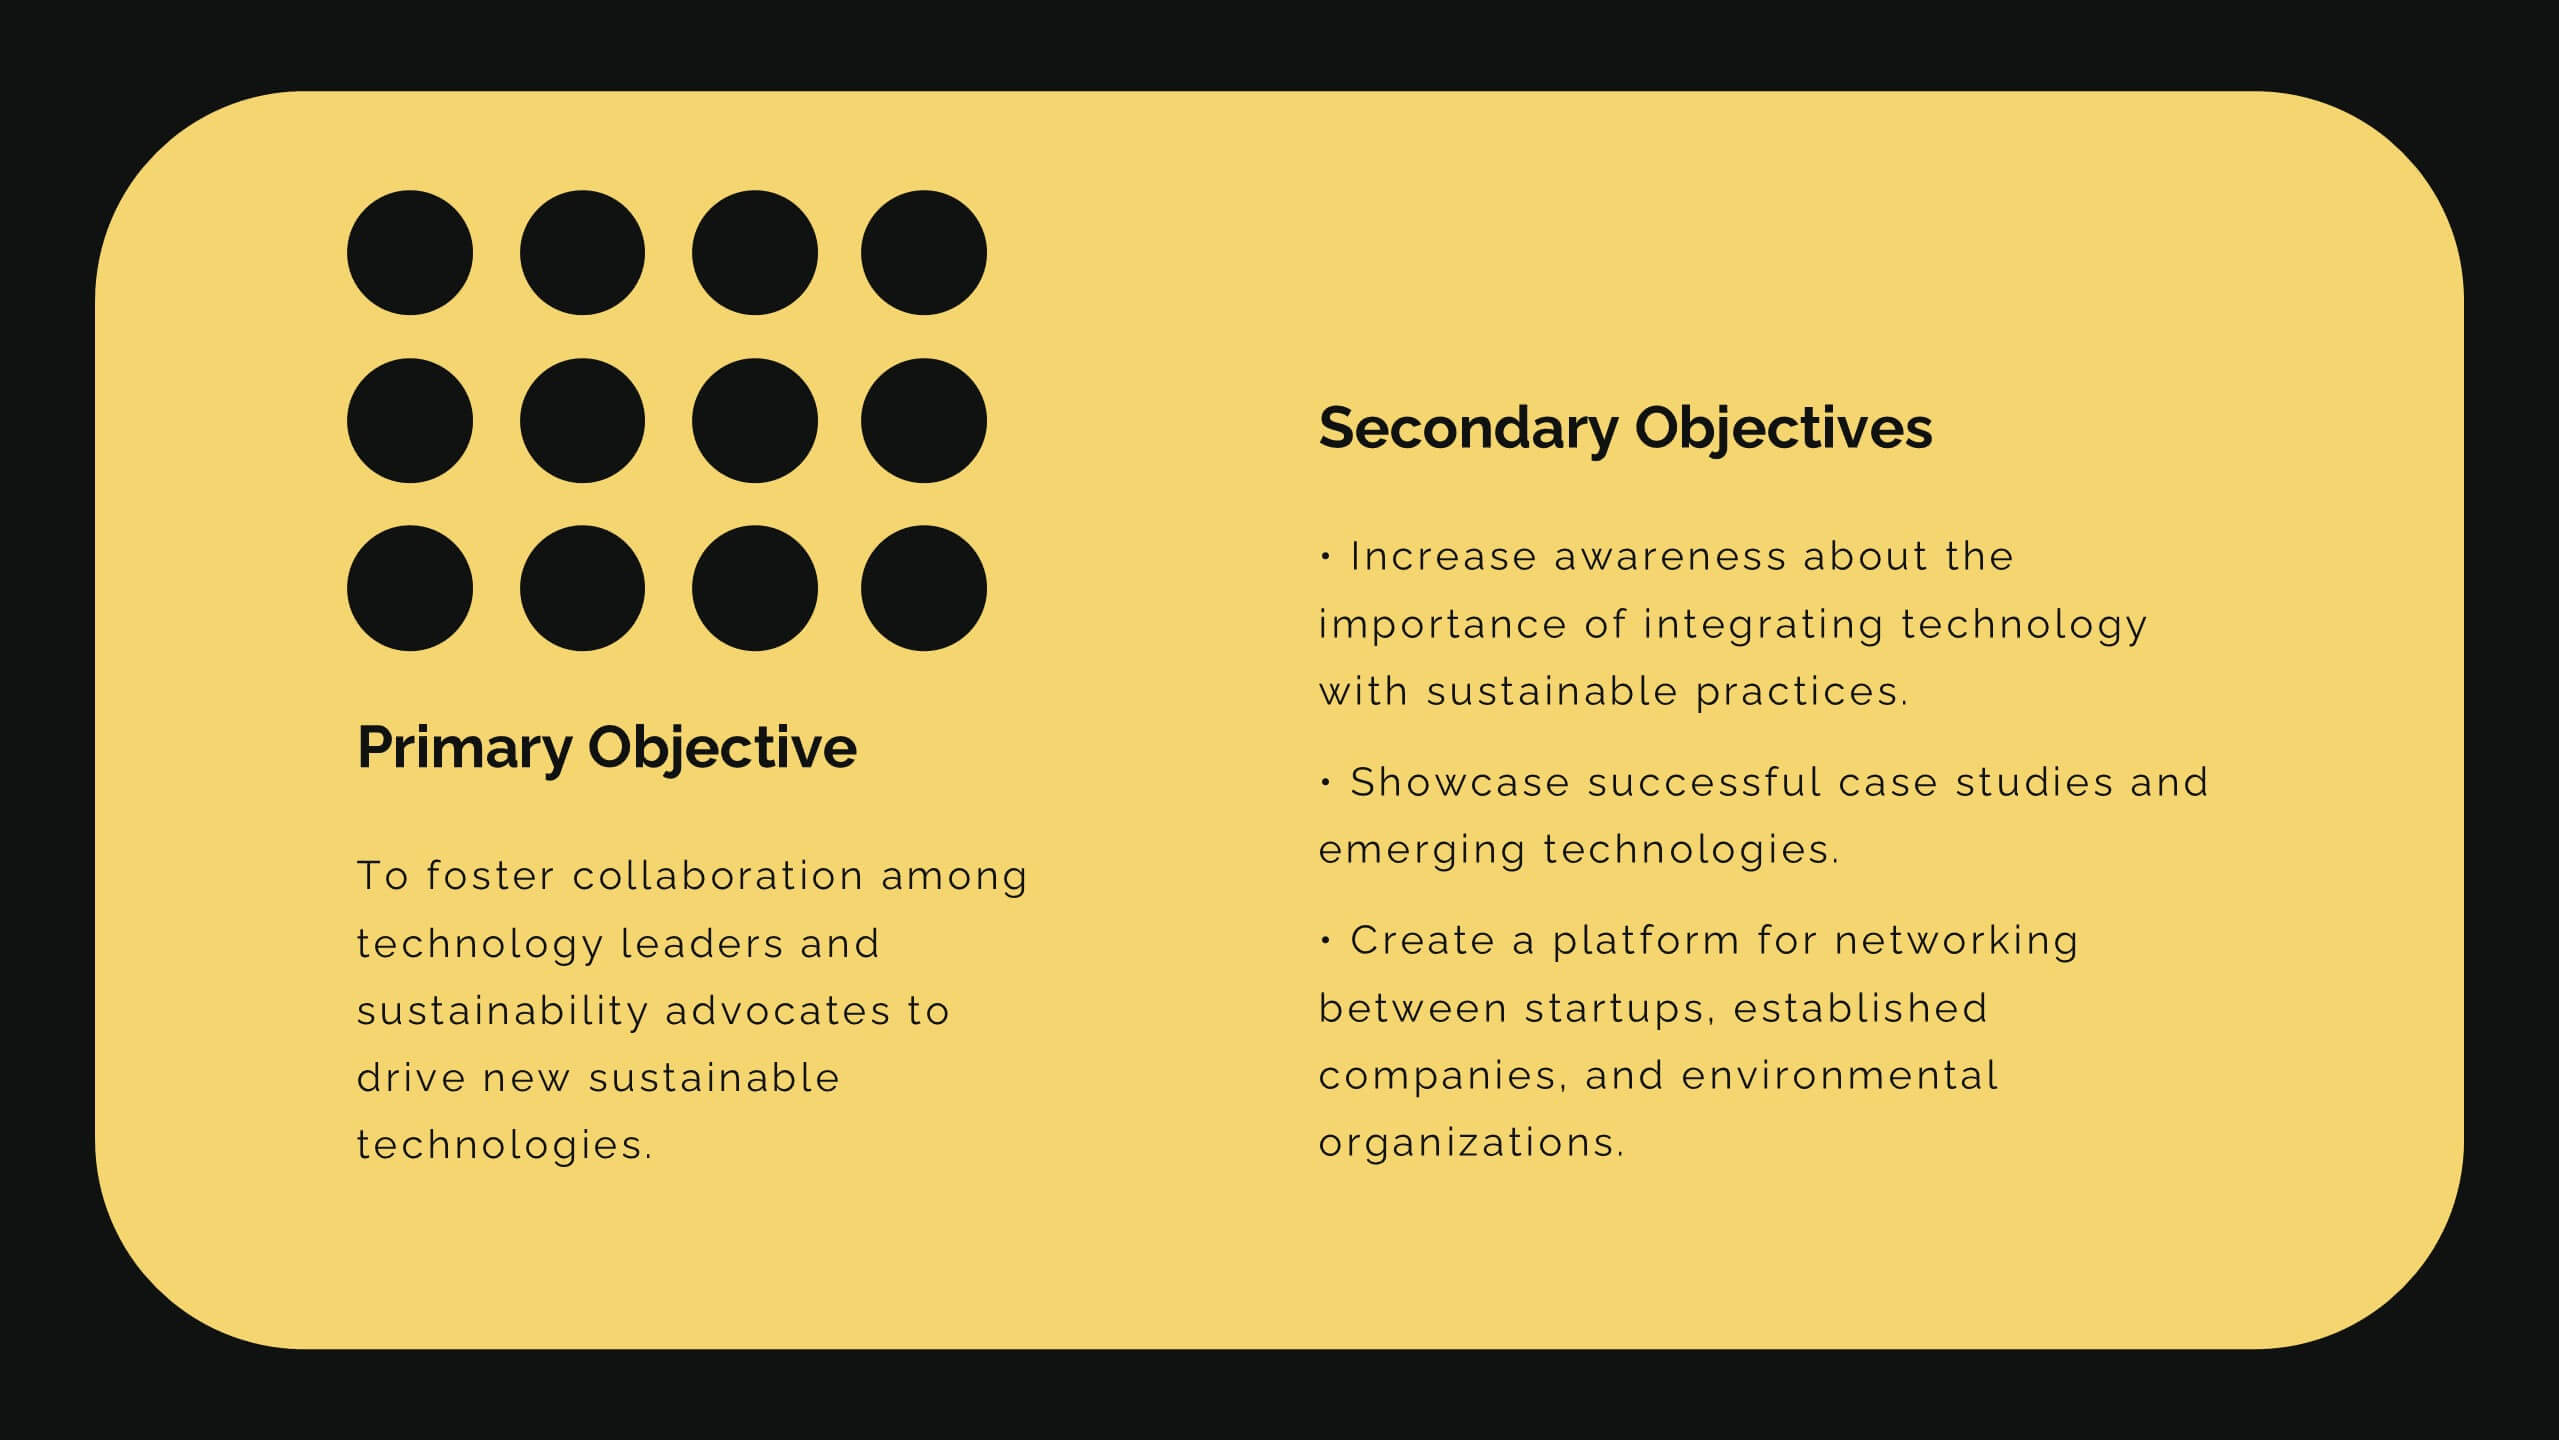
Diamond Business Development Proposal Presentation
Unlock the potential of your business proposals with this bold and engaging presentation template! Perfect for business development pitches, conferences, and workshops, it includes sections for speaker introductions, panel discussions, and session breakdowns. With its clean and professional design, this template ensures clarity and impact. Fully customizable and compatible with PowerPoint, Keynote, and Google Slides.


5 diapositivas
Employee and Team Performance Analysis Presentation
Visualize individual and team contributions with this clear and structured performance analysis template. Showcase key metrics, employee growth, and team achievements using easy-to-read layouts and progress indicators. Ideal for HR reports, performance reviews, and team evaluations. Fully editable in PowerPoint, Keynote, and Google Slides.


10 diapositivas
Business Growth and Market Statistics Presentation
Showcase key business growth trends and market insights with the "Business Growth and Market Statistics" presentation templates. These visuals are crafted to enhance clarity in communicating growth drivers, market dynamics, and performance metrics effectively. Ideal for corporate presentations, they're compatible with PowerPoint, Keynote, and Google Slides, ensuring a professional look across all platforms.


5 diapositivas
Video Games Industry Infographics
The Video Game Industry is a global and rapidly growing sector that encompasses the development and distribution of video games for various platforms, including consoles, PCs, and virtual reality. These infographic templates are perfect for presenting key information and statistics about the video game industry. If you need to deliver a presentation on the gaming market trends, industry analysis, or the impact of video games, this template will help you visually communicate the data, engage your audience, and create a memorable presentation experience. This template is completely customizable and designed to be compatible with PowerPoint, Keynote, and Google Slides.


7 diapositivas
Professional Project Management Infographic Presentation
Project management is the process of planning, organizing, and overseeing resources and tasks to achieve goals and objectives within a defined timeframe. This template includes a clean, eye-catching design with plenty of space to add your content. This infographic template provides a step by step explanation of project management. It's the perfect way to explain complex projects easily to clients and employees. This template is compatible with Powerpoint, keynote and google slides making it easily customizable and editable. Use this for next project management research paper, presentation, etc.


4 diapositivas
Corporate Growth and Strategy Map Presentation
Visualize your business development path with this layered strategy map. Ideal for showcasing organizational goals, strategic initiatives, and cascading growth stages. Each level is clearly structured for easy customization, making it perfect for leadership planning, corporate roadmaps, or strategic reviews in PowerPoint, Keynote, or Google Slides.


4 diapositivas
Elegant Watercolor Background Presentation
Add a touch of sophistication to your presentation with soft watercolor textures that create a calming, professional atmosphere. Perfect for creative projects, proposals, or portfolios, this elegant design blends artistry with clarity. Fully compatible with PowerPoint, Keynote, and Google Slides for seamless customization and a refined visual finish.