


Características


¿Tienes alguna pregunta?
Recomendar


28 diapositivas
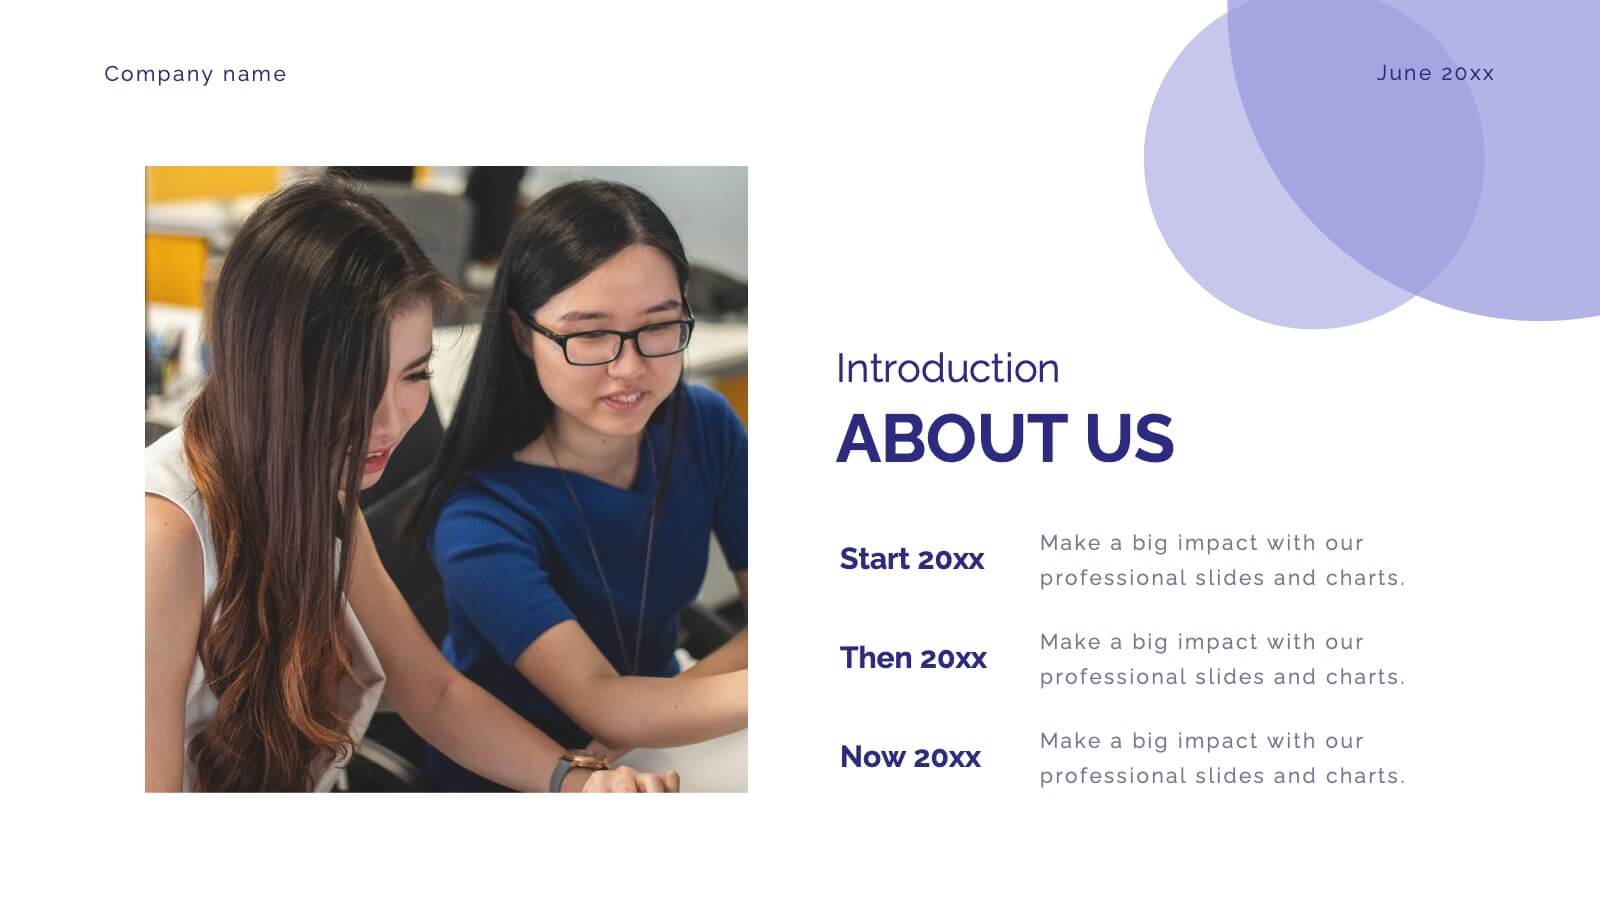
Pitch Deck Entrepreneur's Canvas Presentation
Sharpen your business presentation with this Pitch Deck template. It covers essential areas such as market opportunity, business model, and competitive analysis, designed for startups and entrepreneurs. Fully customizable and compatible with PowerPoint, Keynote, and Google Slides, it's ideal for impressing investors and partners with your business vision.


6 diapositivas
Environmental Scanning with PESTEL Model Presentation
Spot risks and opportunities early with the Environmental Scanning with PESTEL Model Presentation. Visually break down Political, Economic, Social, Technological, Environmental, and Legal factors using a modern, tree-style layout. Ideal for business forecasting, competitive analysis, or market entry reports. Easily customizable in PowerPoint, Canva, and Google Slides.


23 diapositivas
Cosmira Digital Strategy Presentation
This Digital Strategy Presentation provides a comprehensive framework for outlining business objectives, competitive analysis, and growth opportunities. It includes key sections such as SWOT analysis, performance metrics, and implementation plans. Ideal for businesses and marketers, the slides are fully editable and compatible with PowerPoint, Keynote, and Google Slides.


21 diapositivas
Ember Echo Graphic Design Project Plan Presentation
The Ember Graphic Design Project Plan template is the perfect canvas for your creative journey! Kickstart your project with a sleek and professional introduction that sets the tone for your design vision. This template is designed to guide you through every step of the design process, from the initial brief to the final presentation. Highlight your target audience, concept development, and design elements with beautifully crafted slides that capture the essence of your project. Dive into the specifics with dedicated sections for brand identity components, textures, and the design process itself, ensuring that every detail is covered. The template also includes mood boards, prototypes, and design assets, making it easy to showcase your work in progress. With feedback and testing slides, you can iterate and refine your designs before presenting the final product. This template is fully compatible with PowerPoint, Keynote, and Google Slides, making it versatile and easy to use for any creative project.


3 diapositivas
Break Even Financial Model Presentation
Bring your financial story to life with this sleek and professional presentation design. Ideal for illustrating profit margins, cost recovery, or growth potential, it helps visualize when investments start to pay off. Fully customizable and compatible with PowerPoint, Keynote, and Google Slides for effortless editing and impactful presentations.


10 diapositivas
Competitive Advantage Blue Ocean Strategy Presentation
Gain a competitive edge with this Blue Ocean Strategy presentation template! Designed to help businesses identify new market opportunities, this layout focuses on the four key actions: eliminate, reduce, raise, and create. Perfect for strategic planning, innovation workshops, and business growth discussions. Fully customizable and compatible with PowerPoint, Keynote, and Google Slides.


5 diapositivas
Poaching Effects Infographics
Navigate the critical issue of wildlife endangerment with our poaching effects infographics. Crafted in earthy tones of brown and tan, this informative and creatively styled vertical template sheds light on the harsh realities of illegal wildlife hunting. Whether you're an environmental activist, an educator, or part of an ecological research team, this infographic is structured to resonate with your audience, offering compelling visuals and thematic icons that starkly represent the consequences of poaching. It's more than a presentation; it's a call to global action, crucial for anyone advocating for wildlife preservation and aiming to inspire change through storytelling.


7 diapositivas
Budget Forecasting Spreadsheet Infographic
Step into the strategic realm of budget forecasting with our detailed infographic. Cast in the reliability of blue, the vibrancy of orange, and the optimism of yellow, our template is a beacon of financial foresight. Equipped with precise infographics, intuitive icons, and adaptable image placeholders, it transforms financial data into a predictive narrative. Flawlessly tailored for Powerpoint, Keynote, or Google Slides. An essential tool for financial analysts, business strategists, accountants, or any professional navigating the future financial terrains of their organization. Forecast with confidence; let every slide be a roadmap to financial prudence.


21 diapositivas
Cerberus Project Timeline Presentation
Bring your project vision to life with a well-structured plan that flows effortlessly. This presentation covers everything from objectives and timelines to budget breakdowns, team introductions, and next steps, helping you communicate key details with clarity. Perfect for internal or client presentations, and fully compatible with PowerPoint, Keynote, and Google Slides.


4 diapositivas
Pillar Strategy Framework Presentation
Turn complex strategies into clear, structured visuals with this elegant infographic design. Ideal for showcasing key principles, organizational foundations, or business frameworks, it helps communicate ideas with precision and balance. Fully customizable and compatible with PowerPoint, Keynote, and Google Slides for effortless editing and professional results.
26 diapositivas
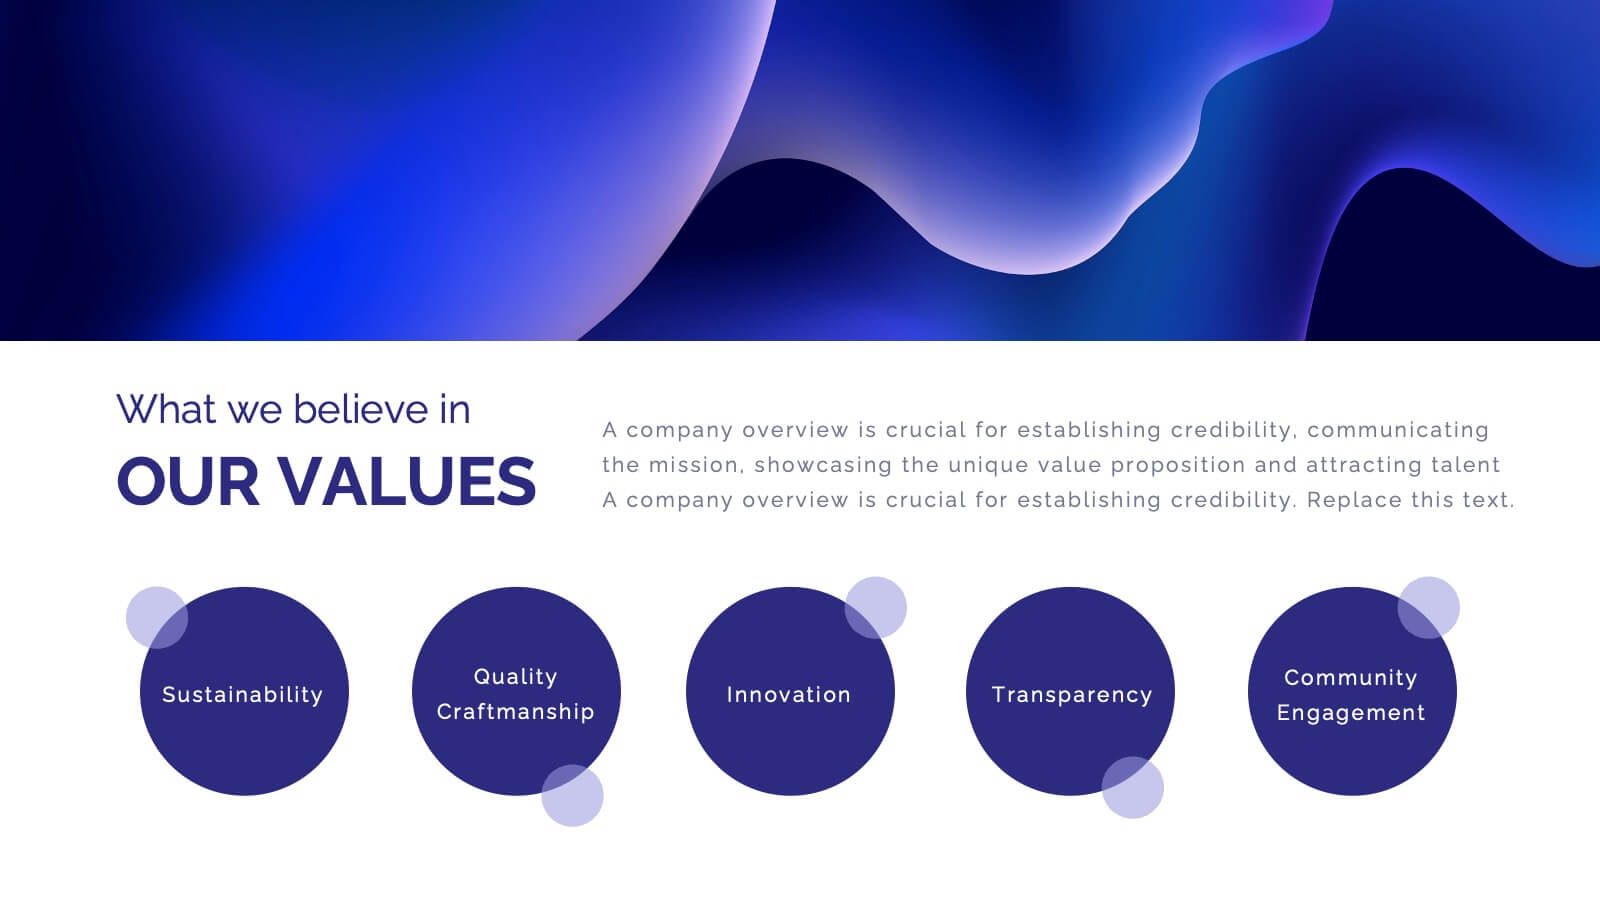
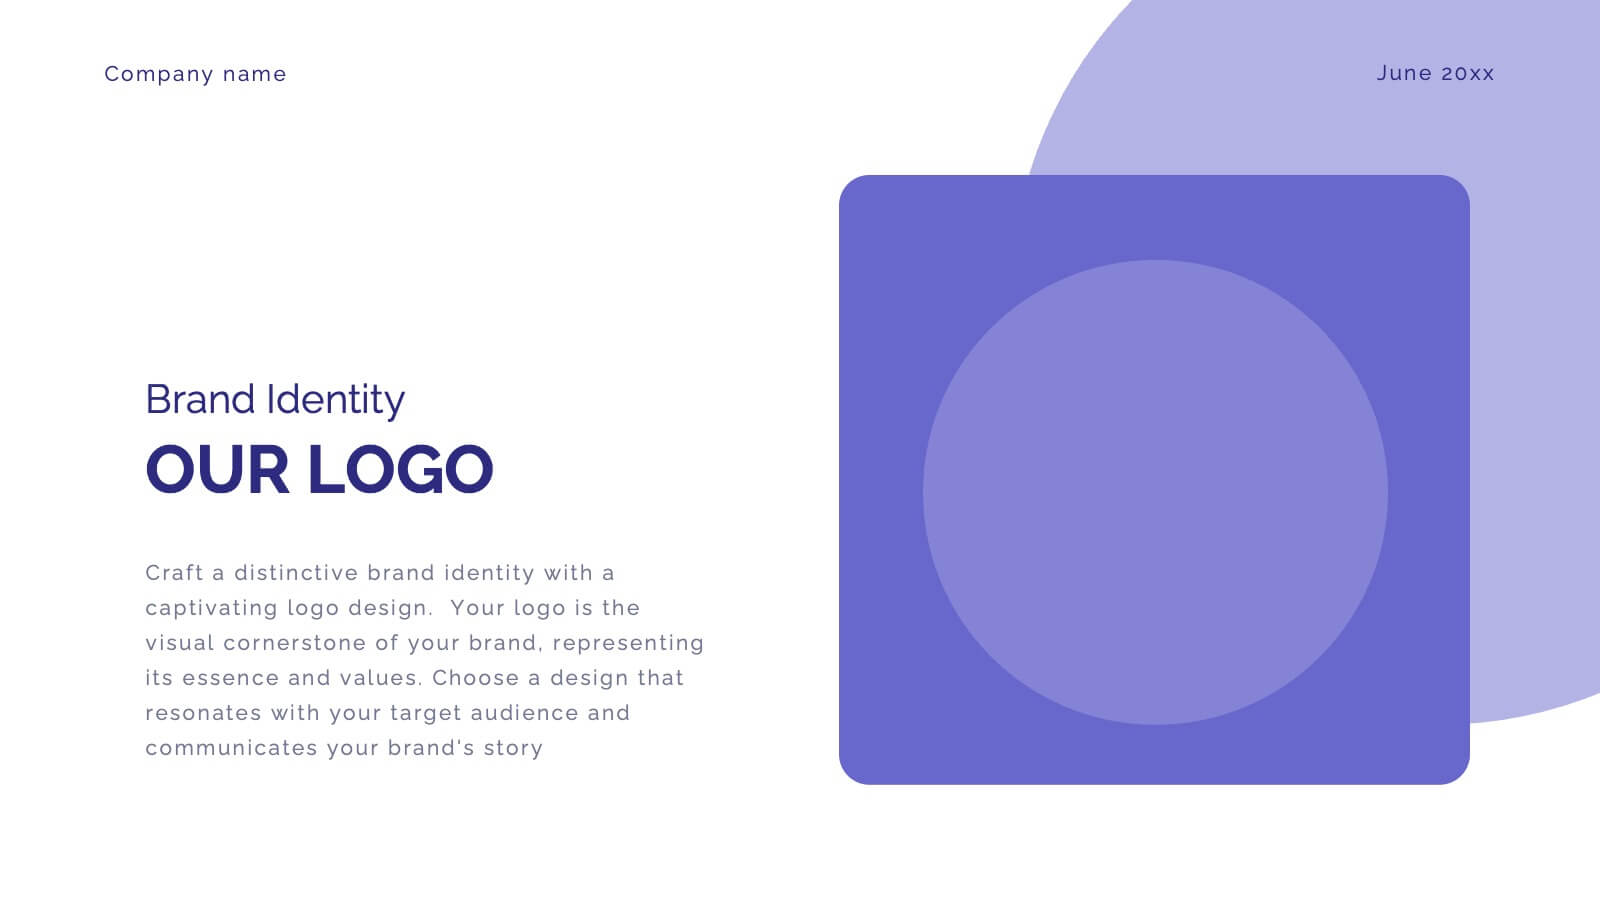
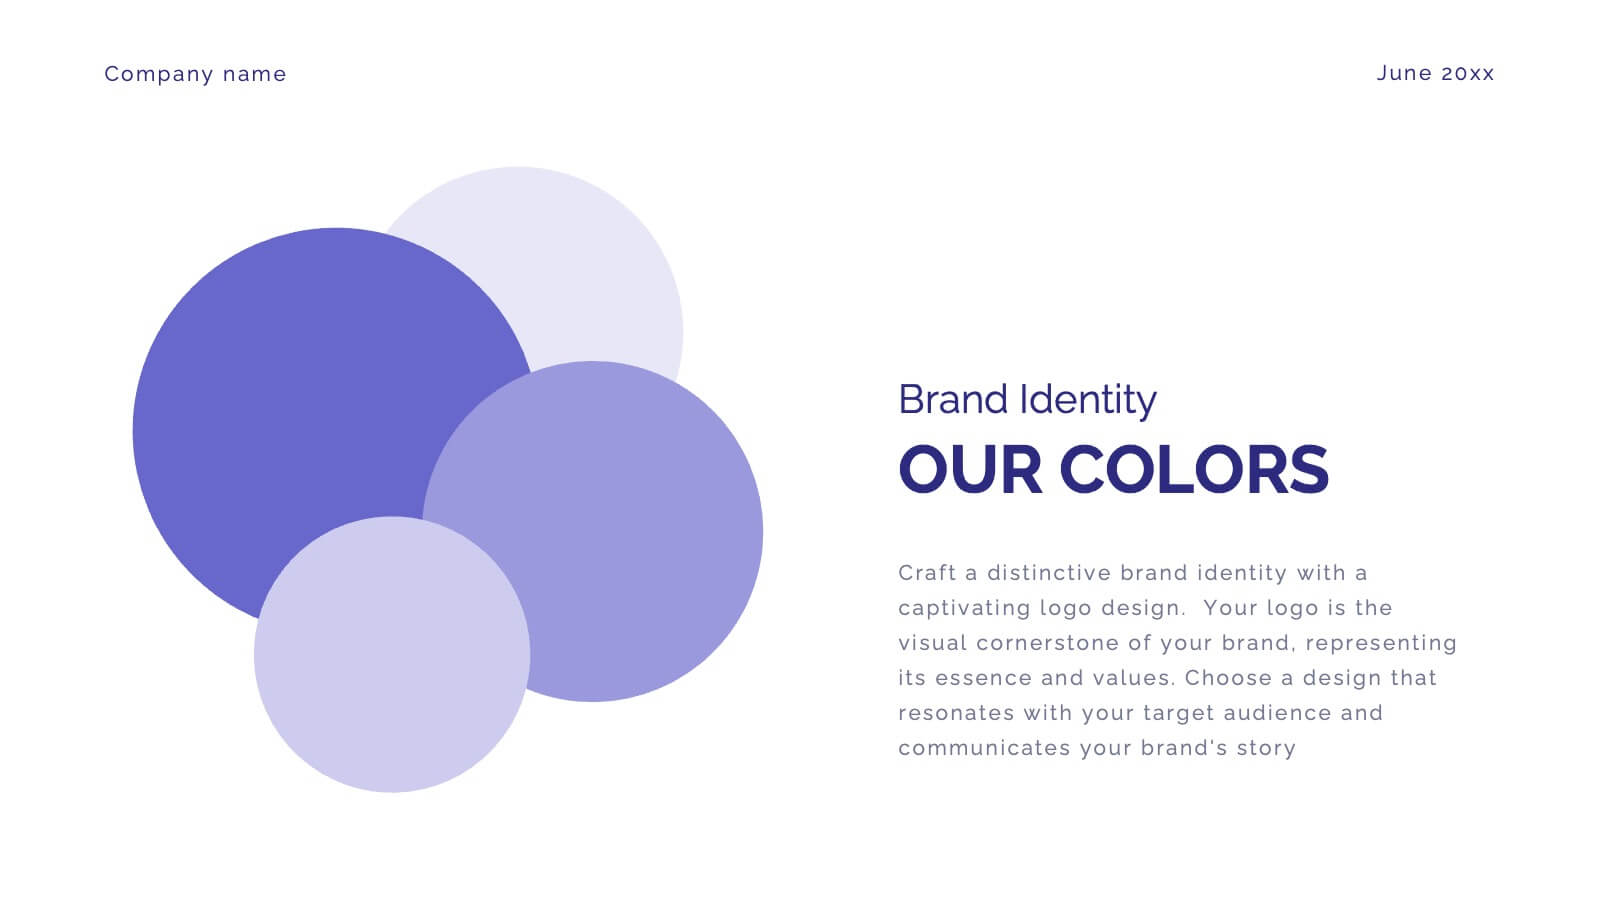
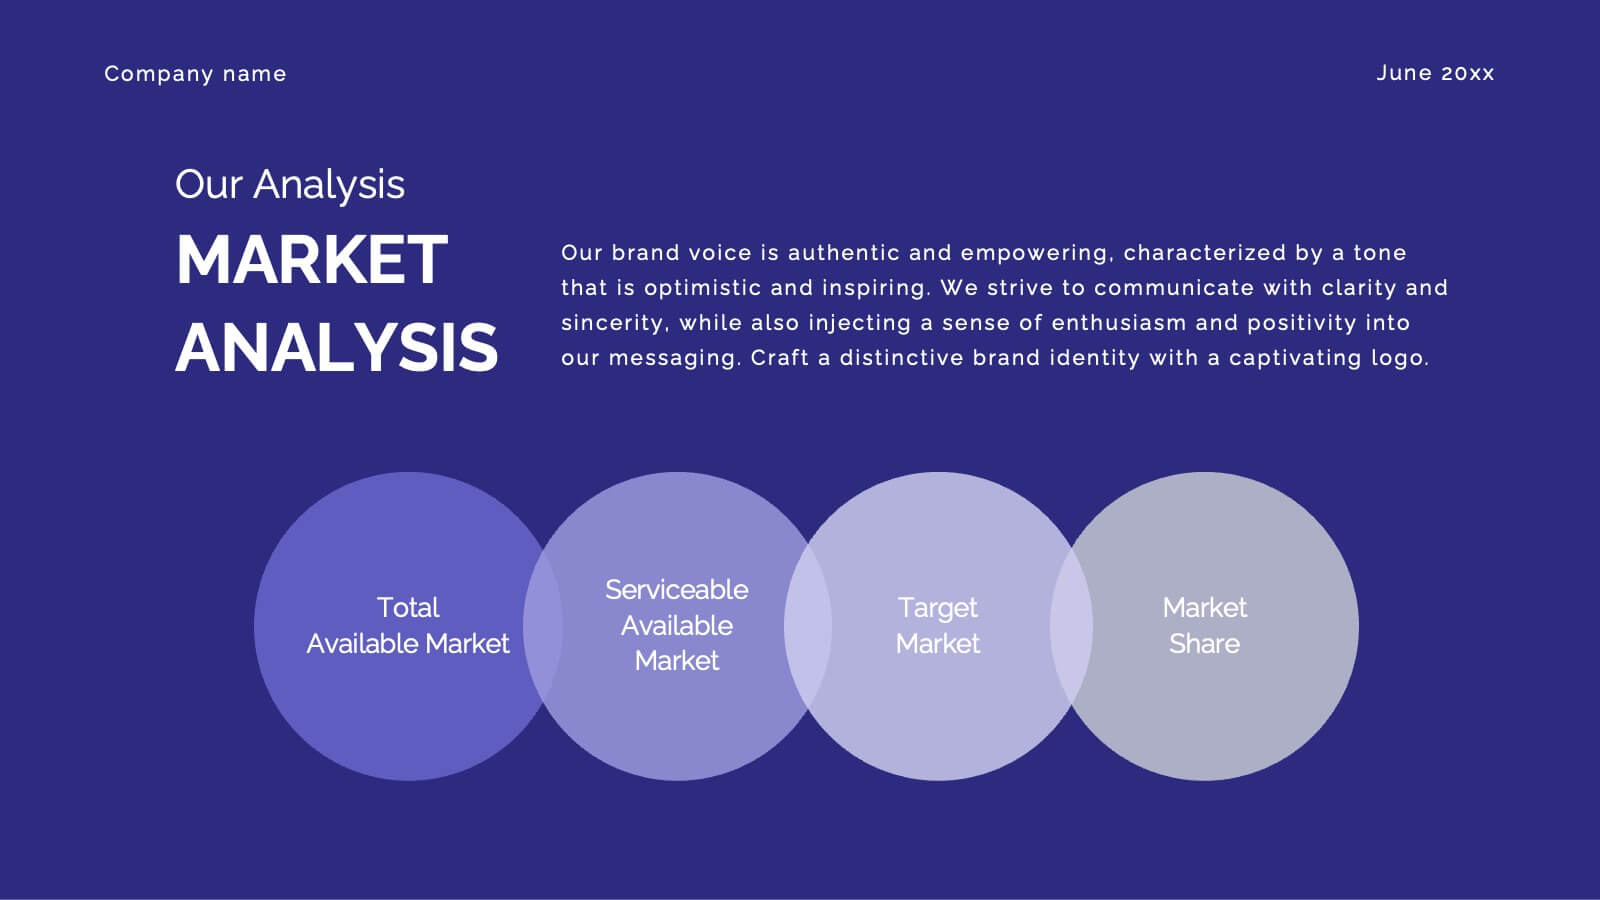
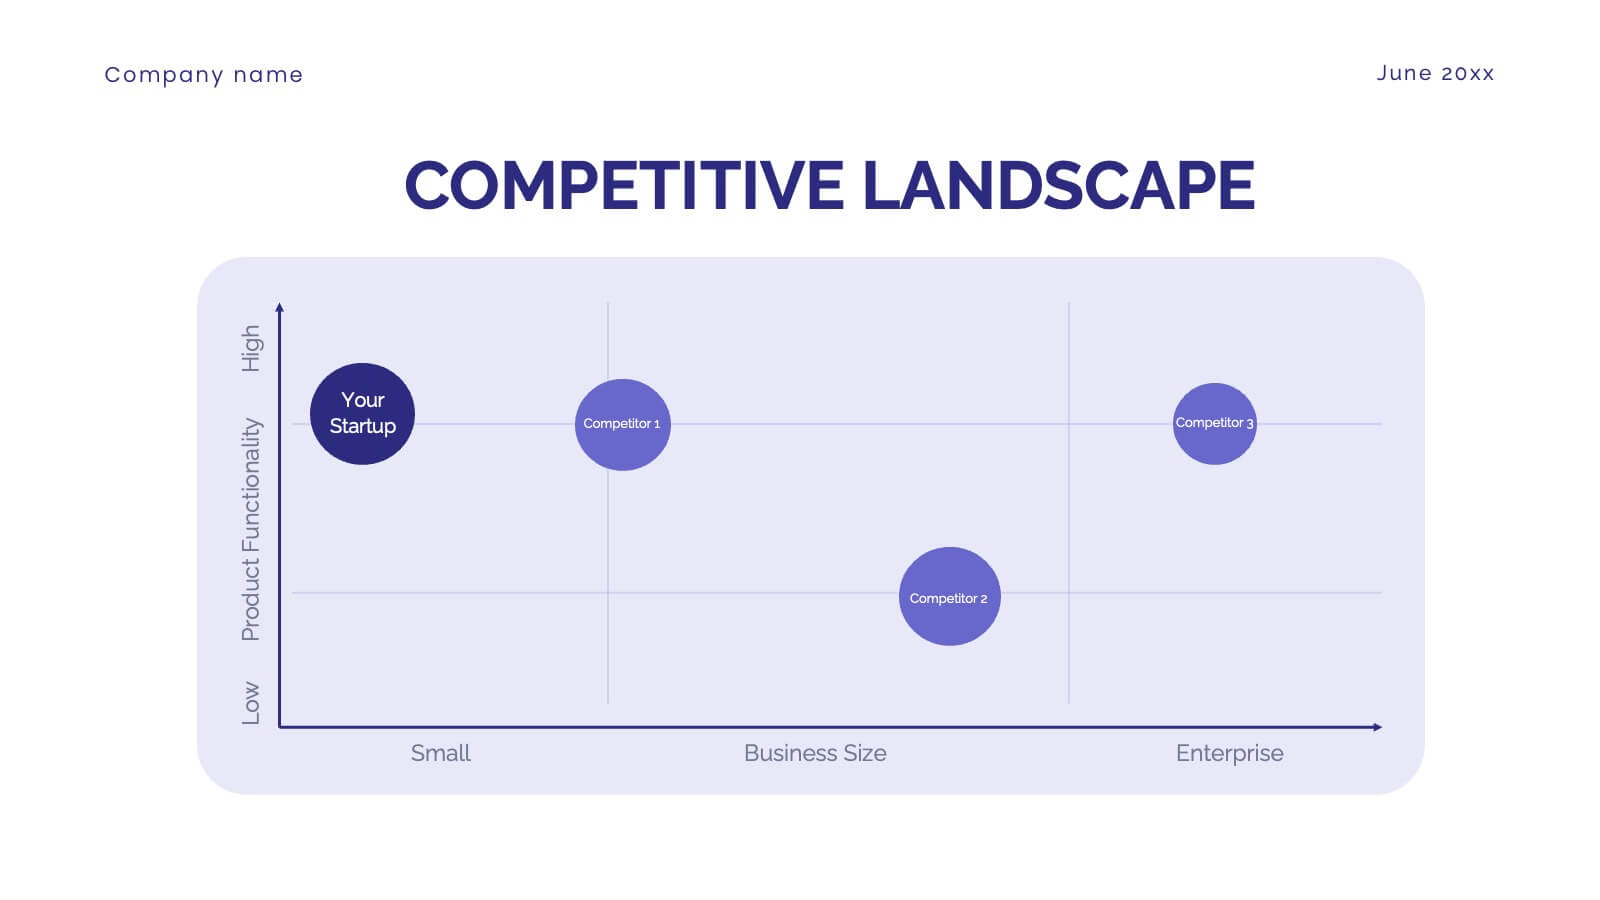
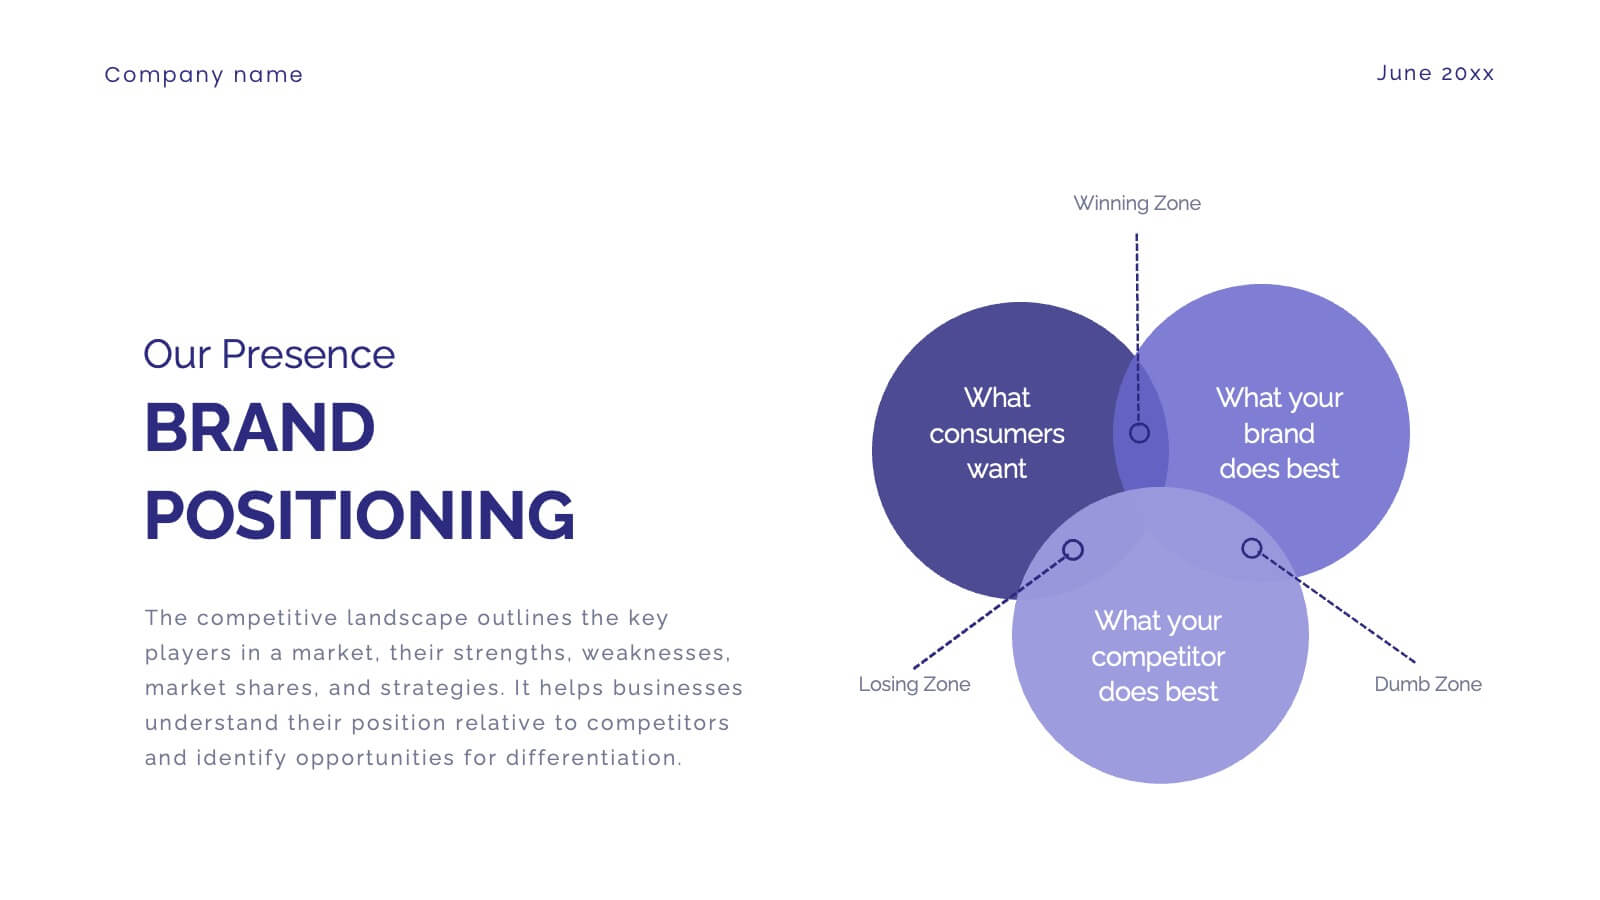
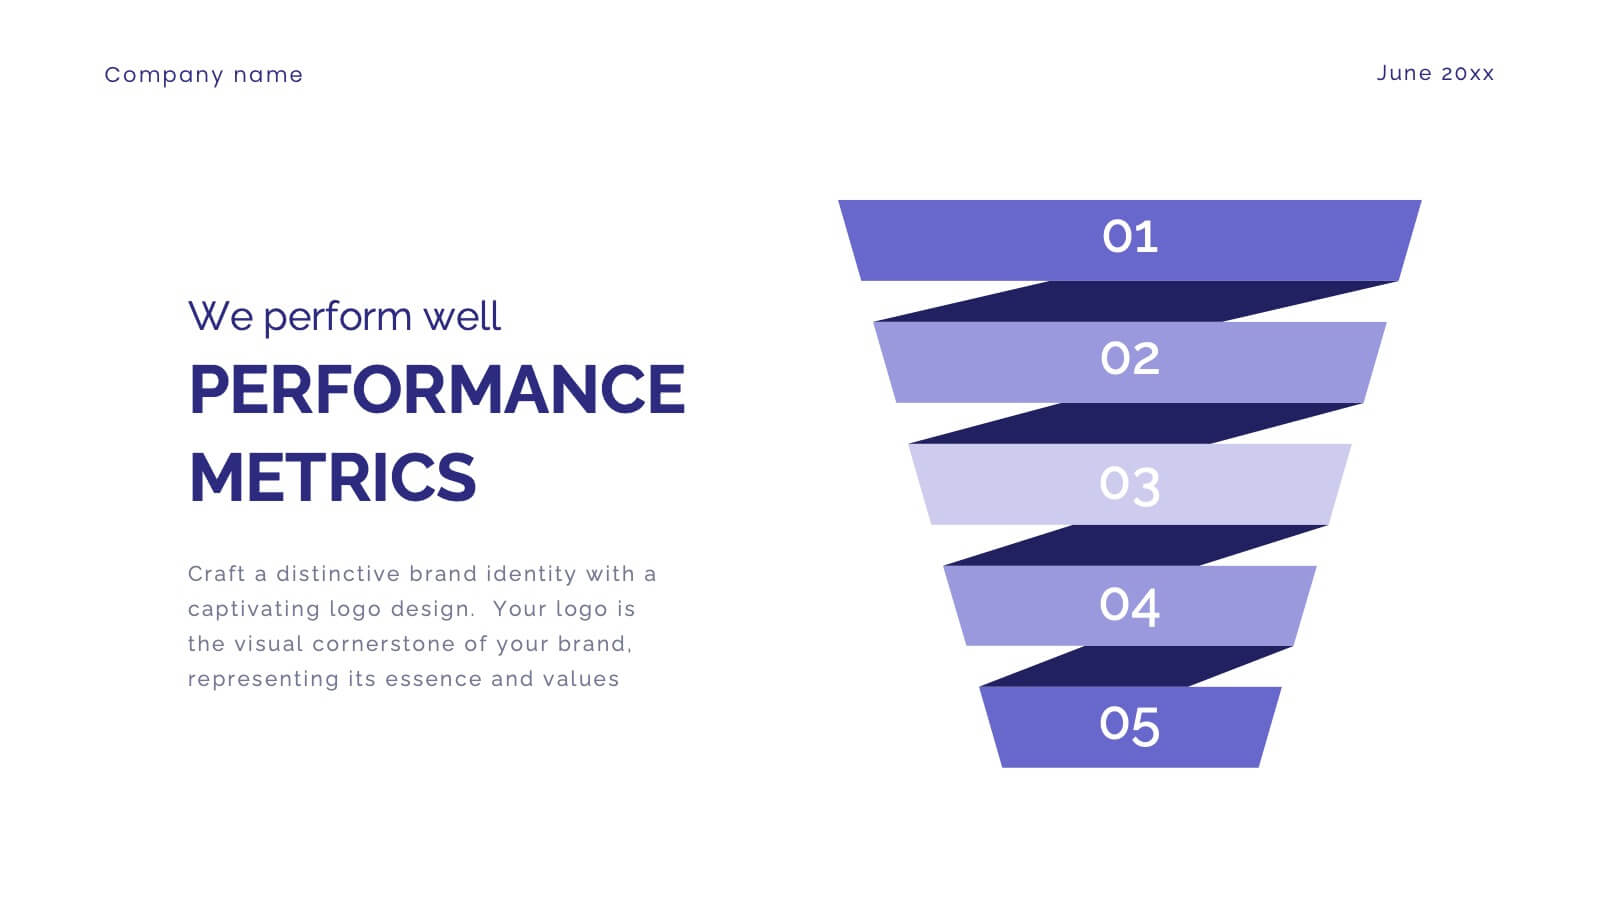
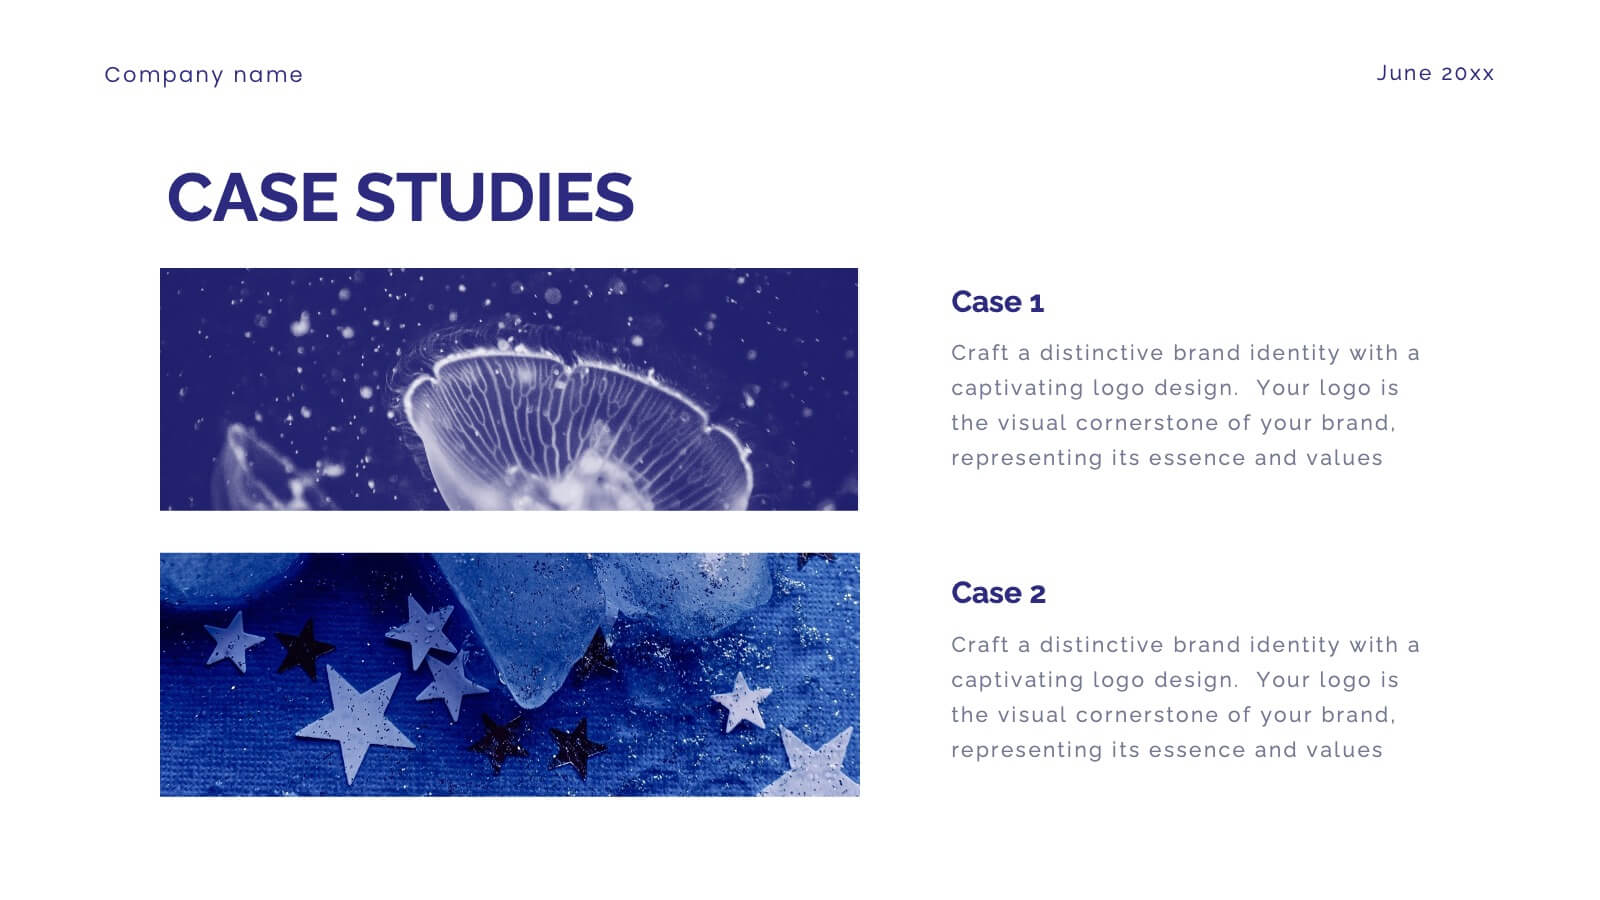
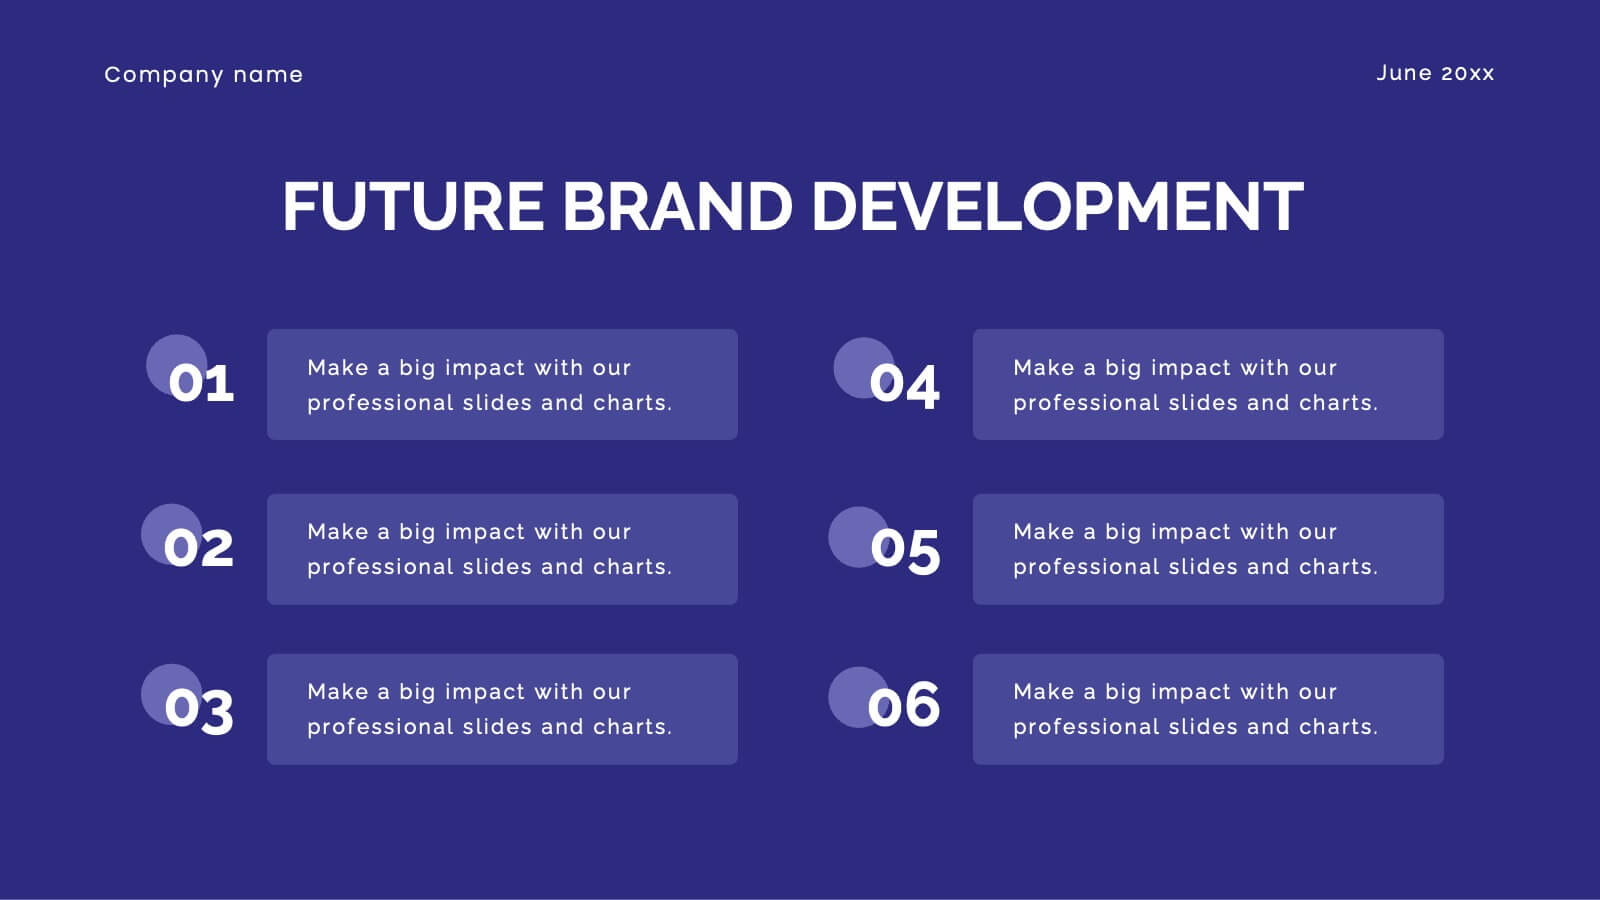
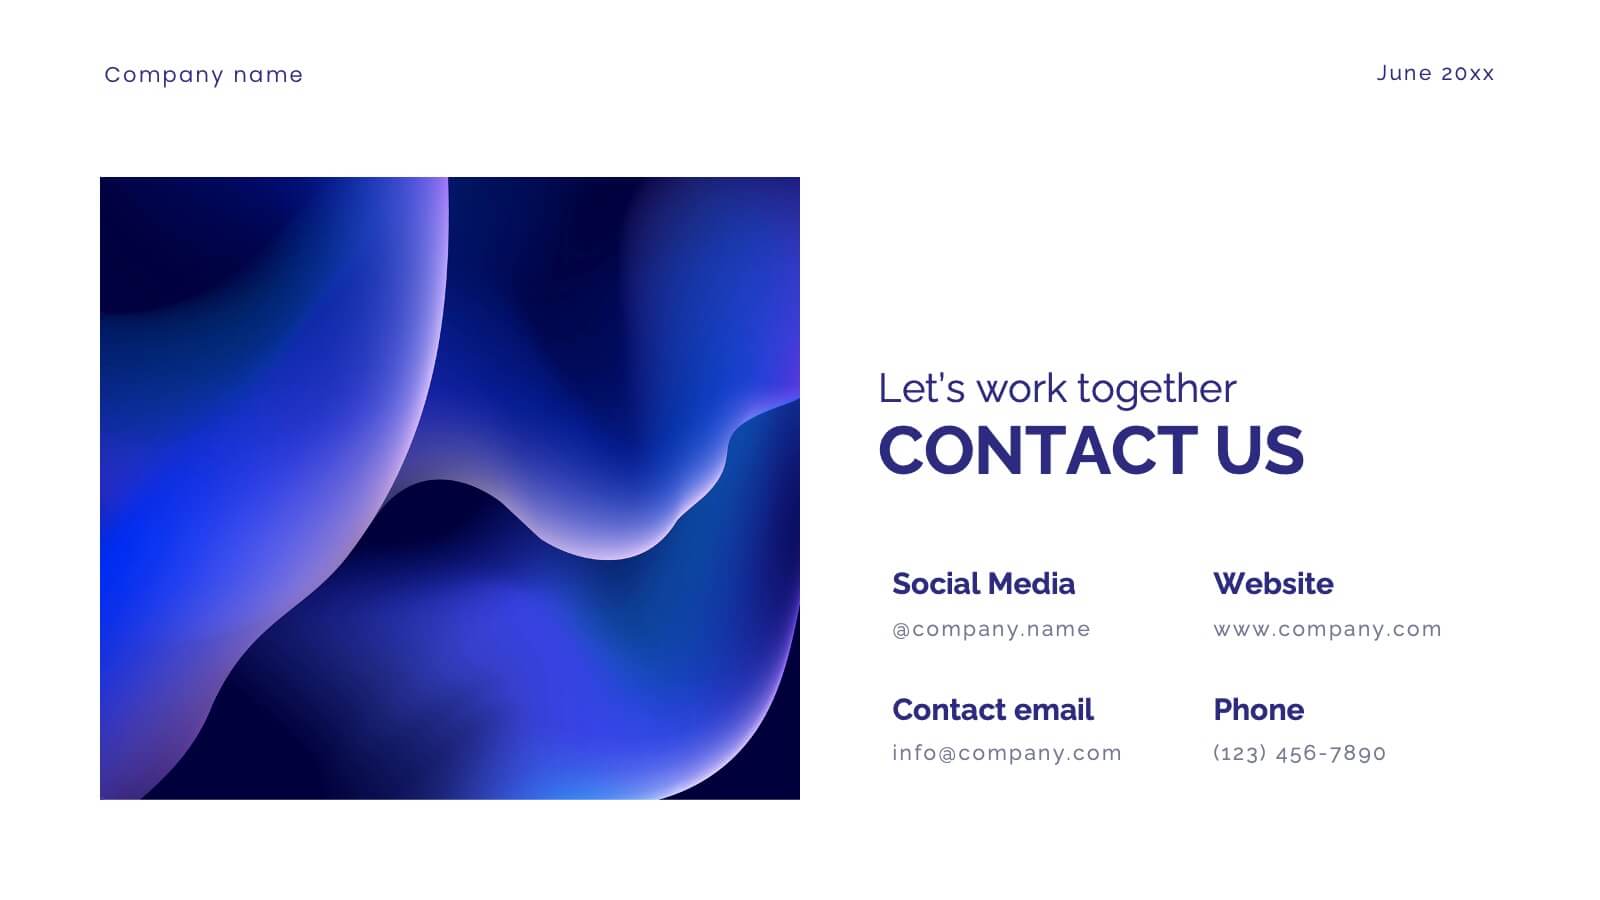
Glimmer Brand Development Pitch Deck Presentation
Elevate your brand with this comprehensive rebranding presentation template! Perfect for detailing your logo, color scheme, and market analysis, it includes slides for brand positioning, competitive landscape, and performance metrics. Engage your audience with clear visuals and structured content. Compatible with PowerPoint, Keynote, and Google Slides for seamless presentations on any platform.


31 diapositivas
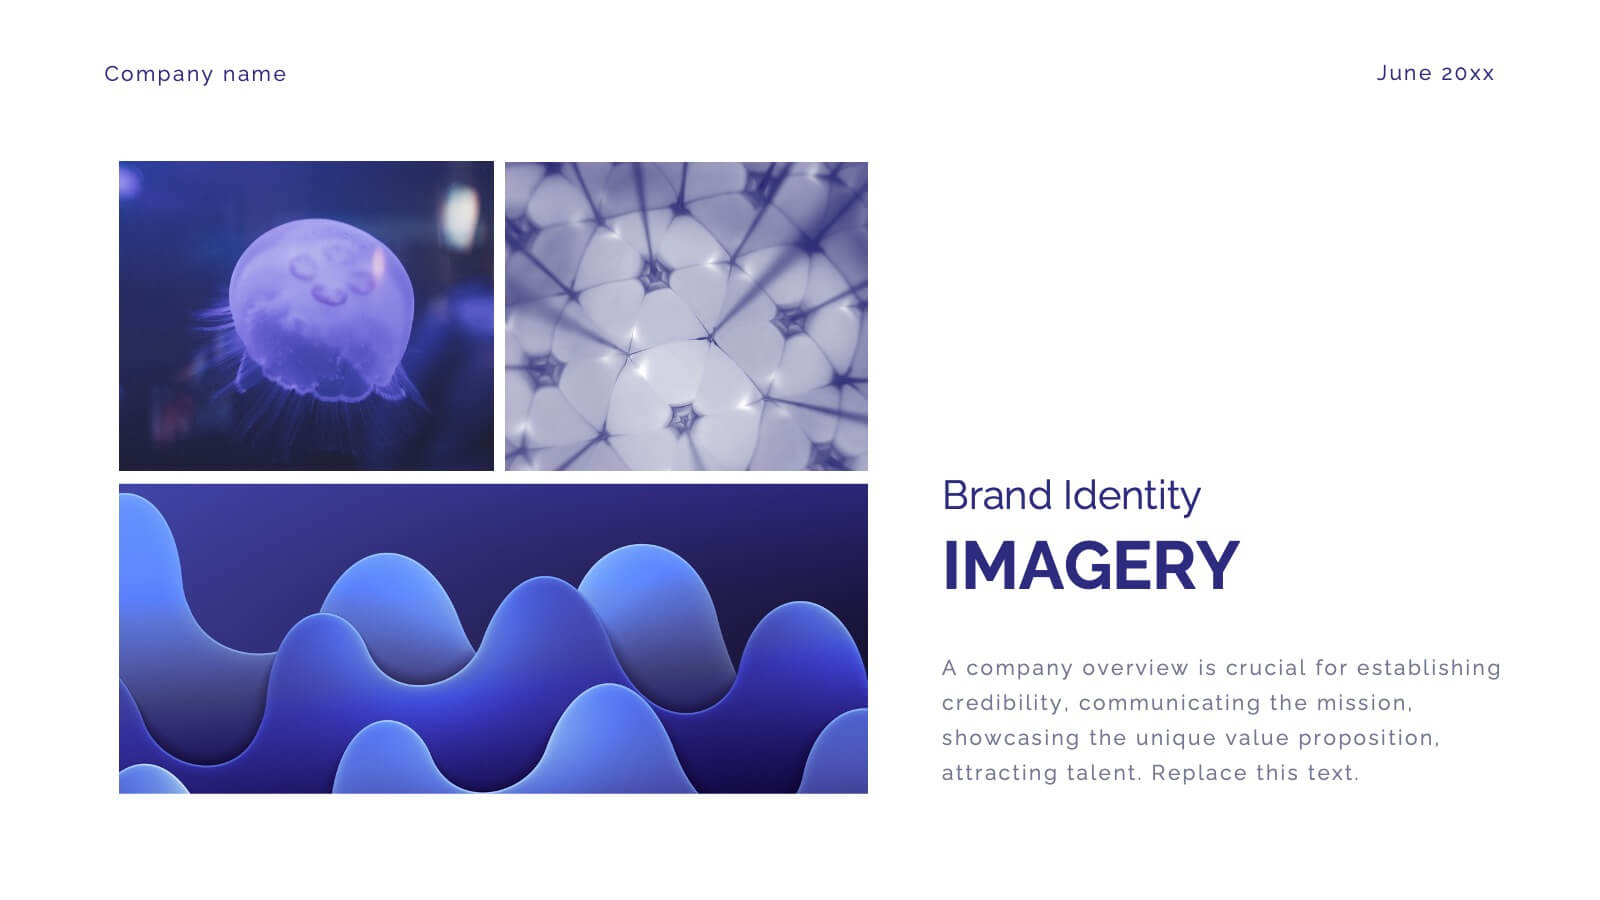
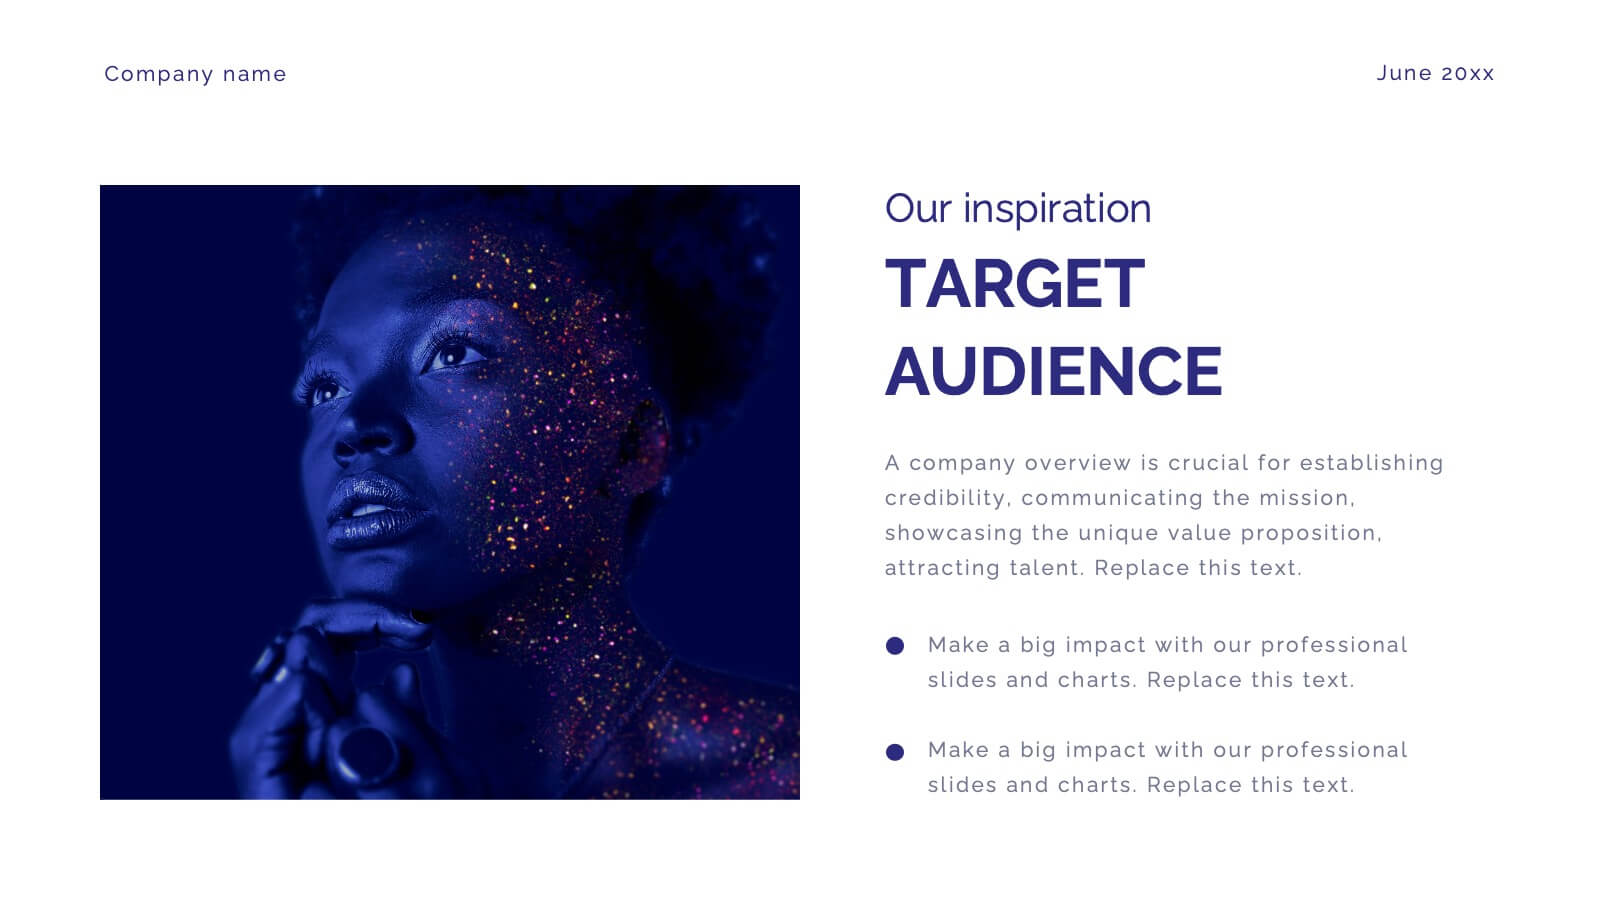
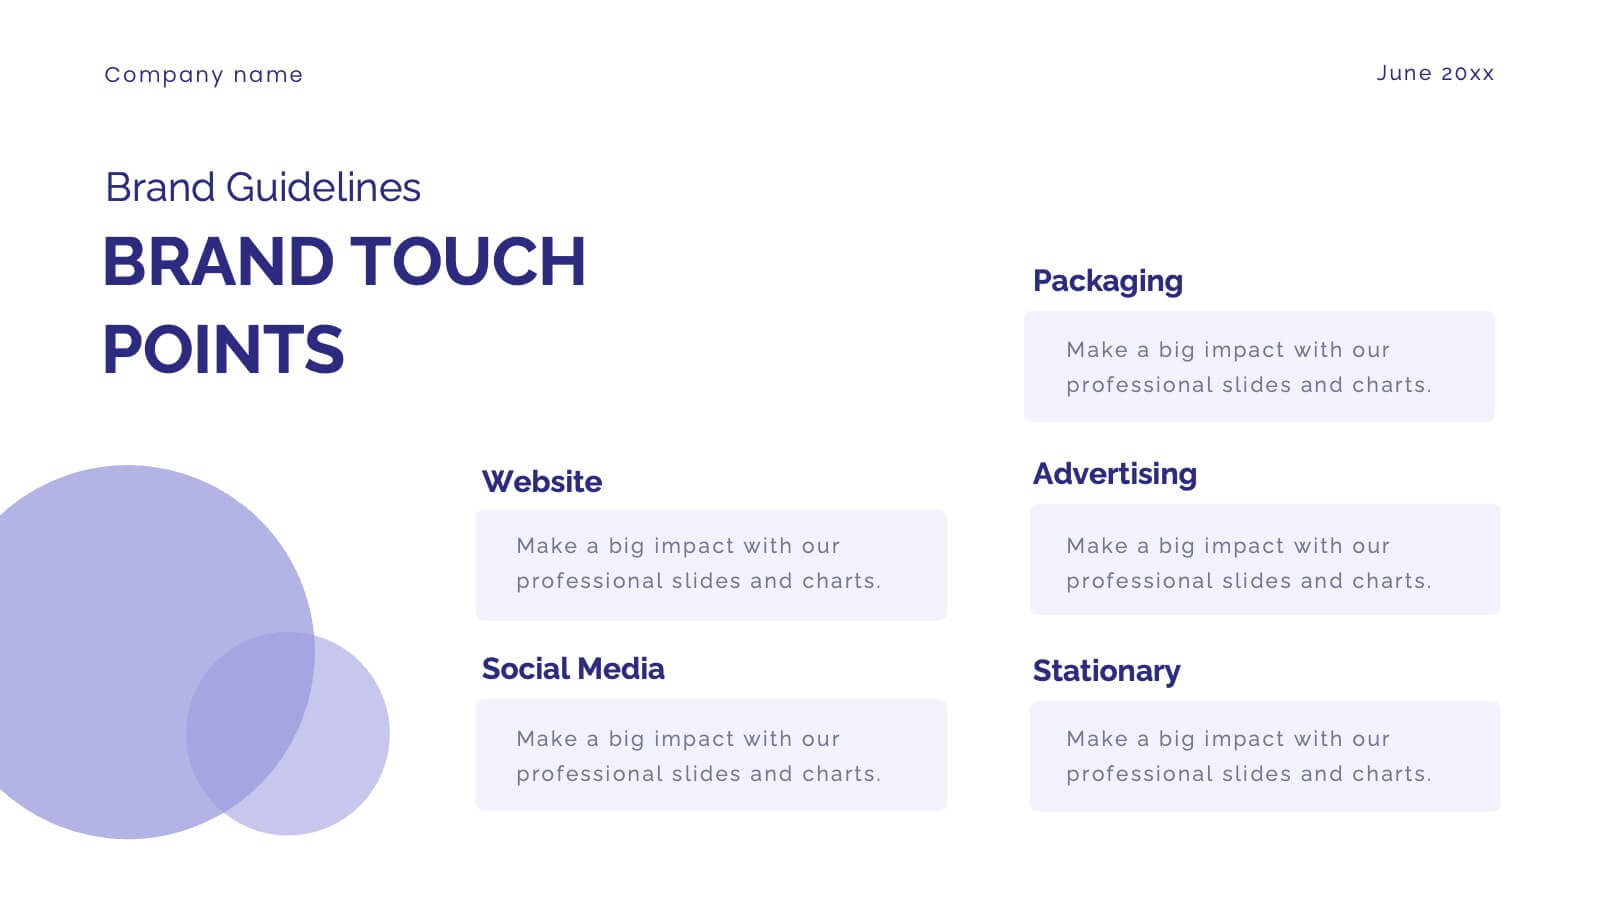
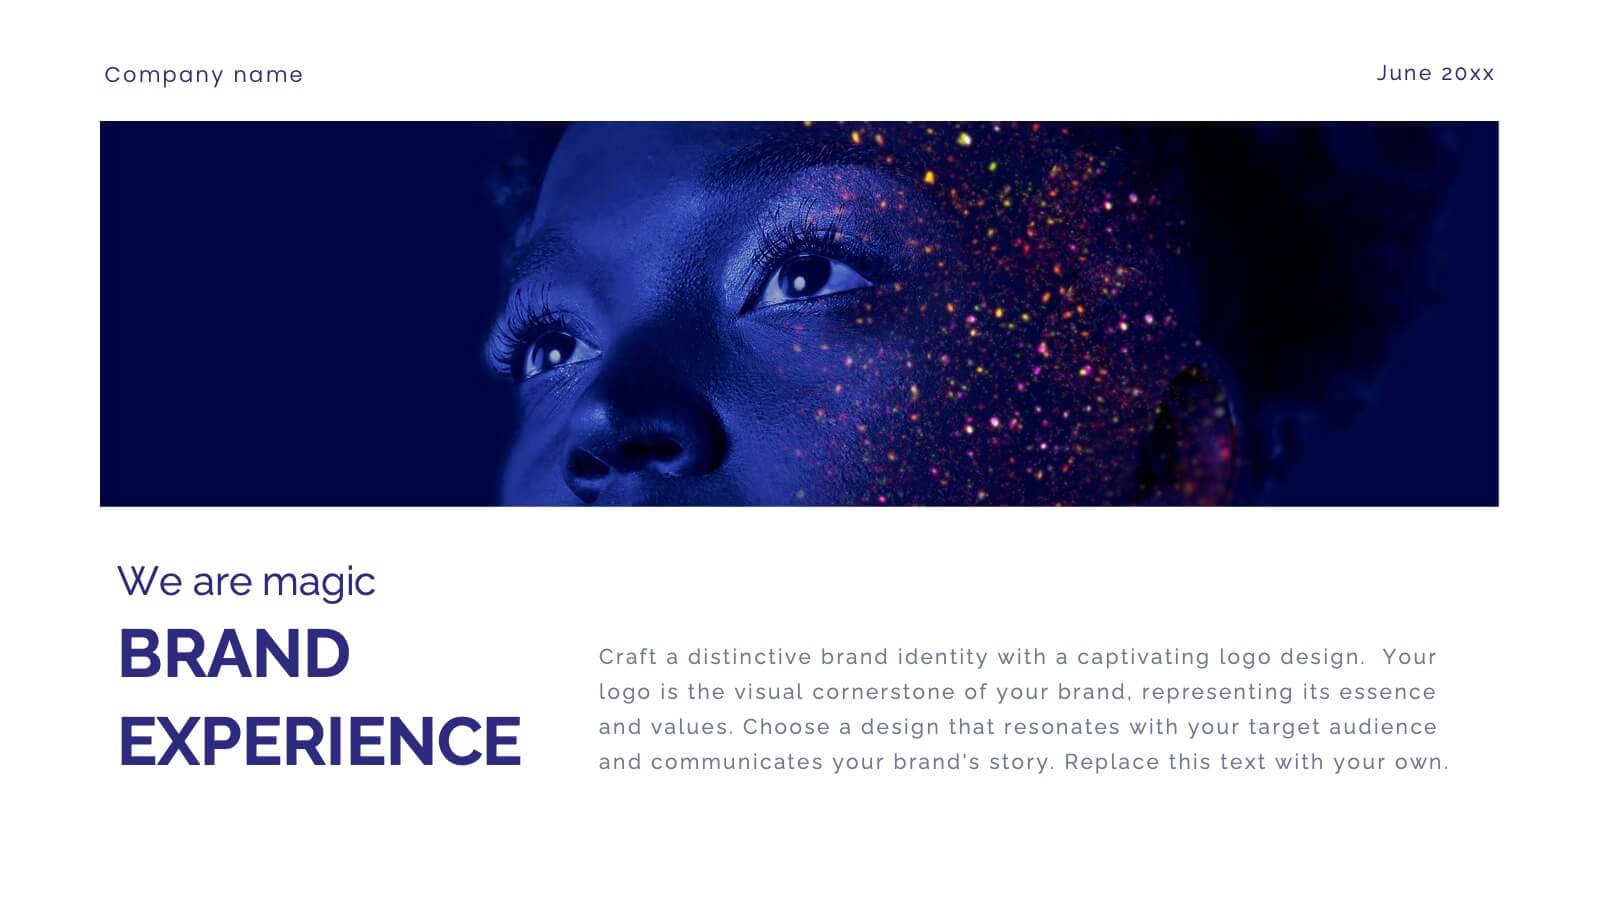
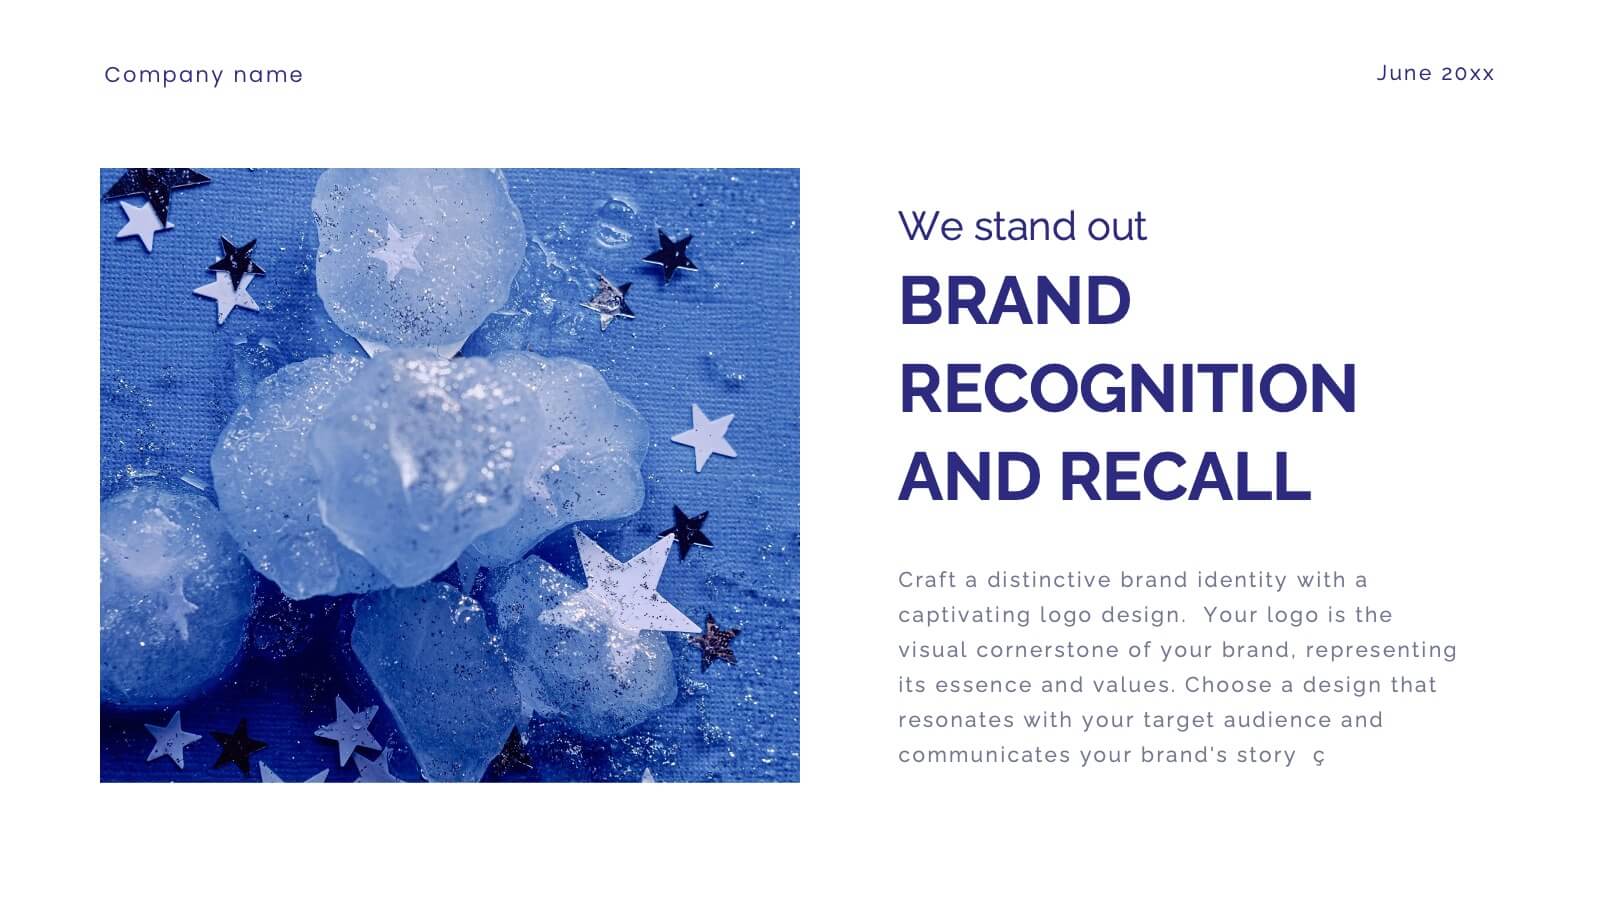
Astralis Brand Strategy Report Presentation
Present your brand strategy effectively with this well-structured presentation template. This comprehensive design covers all essential aspects, including vision and positioning, identity components, brand guidelines, and touchpoints. It is perfect for showcasing how your brand stands out, communicates, and connects with its audience. Highlight your unique selling points, ensure visual consistency with color palettes, and emphasize your brand's voice through tailored sections. This template is easy to customize and works seamlessly across PowerPoint, Google Slides, and Keynote, ensuring accessibility for all. Empower your brand strategy discussions with a professional and polished design.


7 diapositivas
Advanced Education Infographics
The "Advanced Education" infographic template is a sophisticated and visually engaging resource, designed meticulously for PowerPoint, Keynote, and Google Slides. This template is an invaluable tool for educators, administrators, and policy makers aiming to present complex educational frameworks, advanced curriculum details, and innovative learning methodologies. The template expertly encapsulates the essence of advanced education, highlighting specialized programs, cutting-edge research opportunities, and pathways for academic excellence. It's organized to showcase the breadth and depth of advanced educational offerings, making it perfect for academic conferences, institutional presentations, or educational policy discussions. The design is as intellectually stimulating as the content it represents, with a color scheme that is both elegant and conducive to a learning environment. This not only enhances the visual appeal of the presentation but also aligns with the advanced and scholarly nature of the content. Whether used in a university setting, a professional development seminar, or a policy briefing, this template ensures that the value and intricacies of "Advanced Education" are communicated with sophistication, clarity, and visual impact.


7 diapositivas
Relationship Infographics Presentation Template
Featuring our Relationship Infographic template, this provides the entire process of relationship building in its true form. This infographic will take you through the stages of building a relationship. This design is good for any purpose and can be used as a template for many presentations. Use this template to illustrate your ideas, put forward an argument, or make statistics and facts catchy. In this template, you’ll find everything you need to create a gorgeous relationship infographic. This is the perfect way to share your story and create an emotional connection with your audience.


22 diapositivas
Garnet Qualitative Research Findings Presentation
This qualitative research findings presentation template provides a structured layout for sharing in-depth insights from your study. It includes sections for objectives, methodology, data analysis, key findings, and future directions, offering a clear flow for presenting research in a professional format. Perfect for researchers, it’s fully customizable in PowerPoint, Keynote, and Google Slides.


6 diapositivas
Stakeholder Analysis Chart Infographic
Stakeholder analysis is a process used by organizations to identify and assess the interests, concerns, expectations, and potential impact of various individuals, groups, or entities that have a stake in a particular project, decision, or initiative. The goal of this infographic is to better understand the perspectives and needs of different stakeholders and to use this information to inform decision-making and project planning. This template summarizes the importance of stakeholder analysis in project management or organizational decision-making. This compatible with Powerpoint, Keynote, and Google Slides.


6 diapositivas
Porter's Five Forces Management Infographic
Porter's Five Forces is a framework, that helps businesses understand the attractiveness and profitability of an industry by examining five key forces that shape its competitive landscape. These infographic templates provide a visually appealing and concise overview of Porter's Five Forces framework. They are designed to help businesses and professionals analyze the competitive dynamics of an industry and make informed strategic decisions. By using this to help your audience understand the forces that shape industry competitiveness, they can identify potential threats and opportunities to make informed decisions, and gain a competitive edge.