


Características


¿Tienes alguna pregunta?
Recomendar


5 diapositivas
Organizational Management Frameworks Overview Presentation
Clarify reporting lines and decision-making roles with the Organizational Management Frameworks Overview Presentation. This clean and color-coded hierarchy chart helps visualize team structure, leadership levels, or departmental breakdowns. Ideal for organizational design, onboarding, or strategic alignment discussions, each placeholder is fully customizable to reflect your company’s framework. Compatible with PowerPoint, Keynote, and Google Slides—perfect for HR professionals, managers, and consultants seeking structure and clarity.


8 diapositivas
Marketing Plan and Audience Targeting Presentation
Visualize your audience segmentation strategy with the Marketing Plan and Audience Targeting Presentation. This bullseye diagram template highlights three key focus areas, making it ideal for showcasing market research, targeting tactics, or funnel stages. Fully editable in Canva, PowerPoint, Keynote, and Google Slides to match your branding and goals.


10 diapositivas
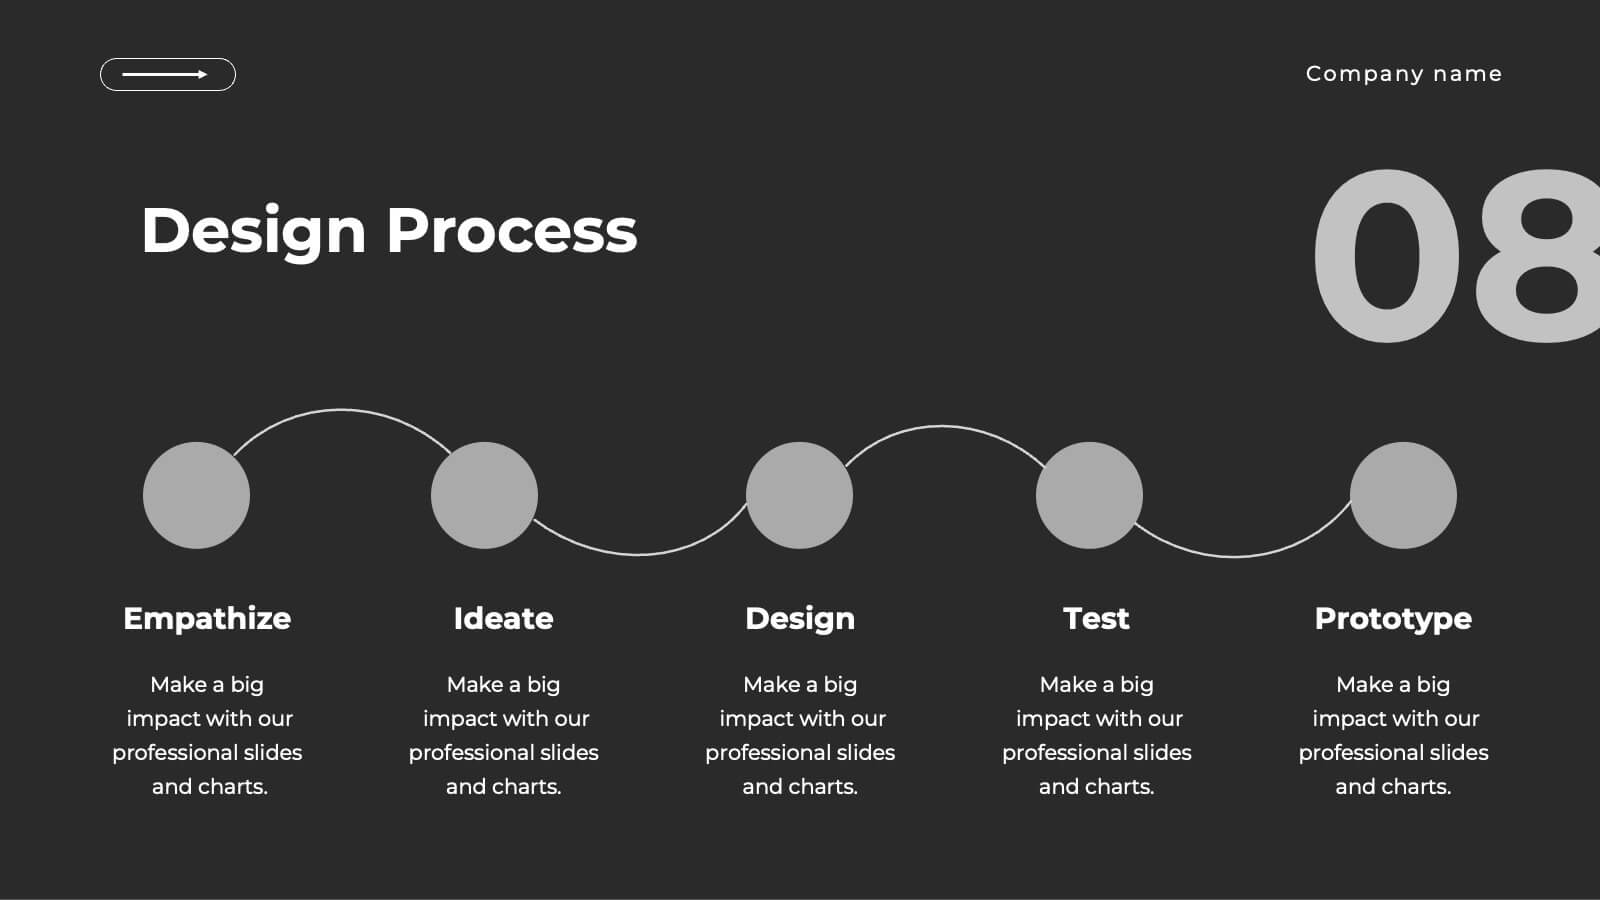
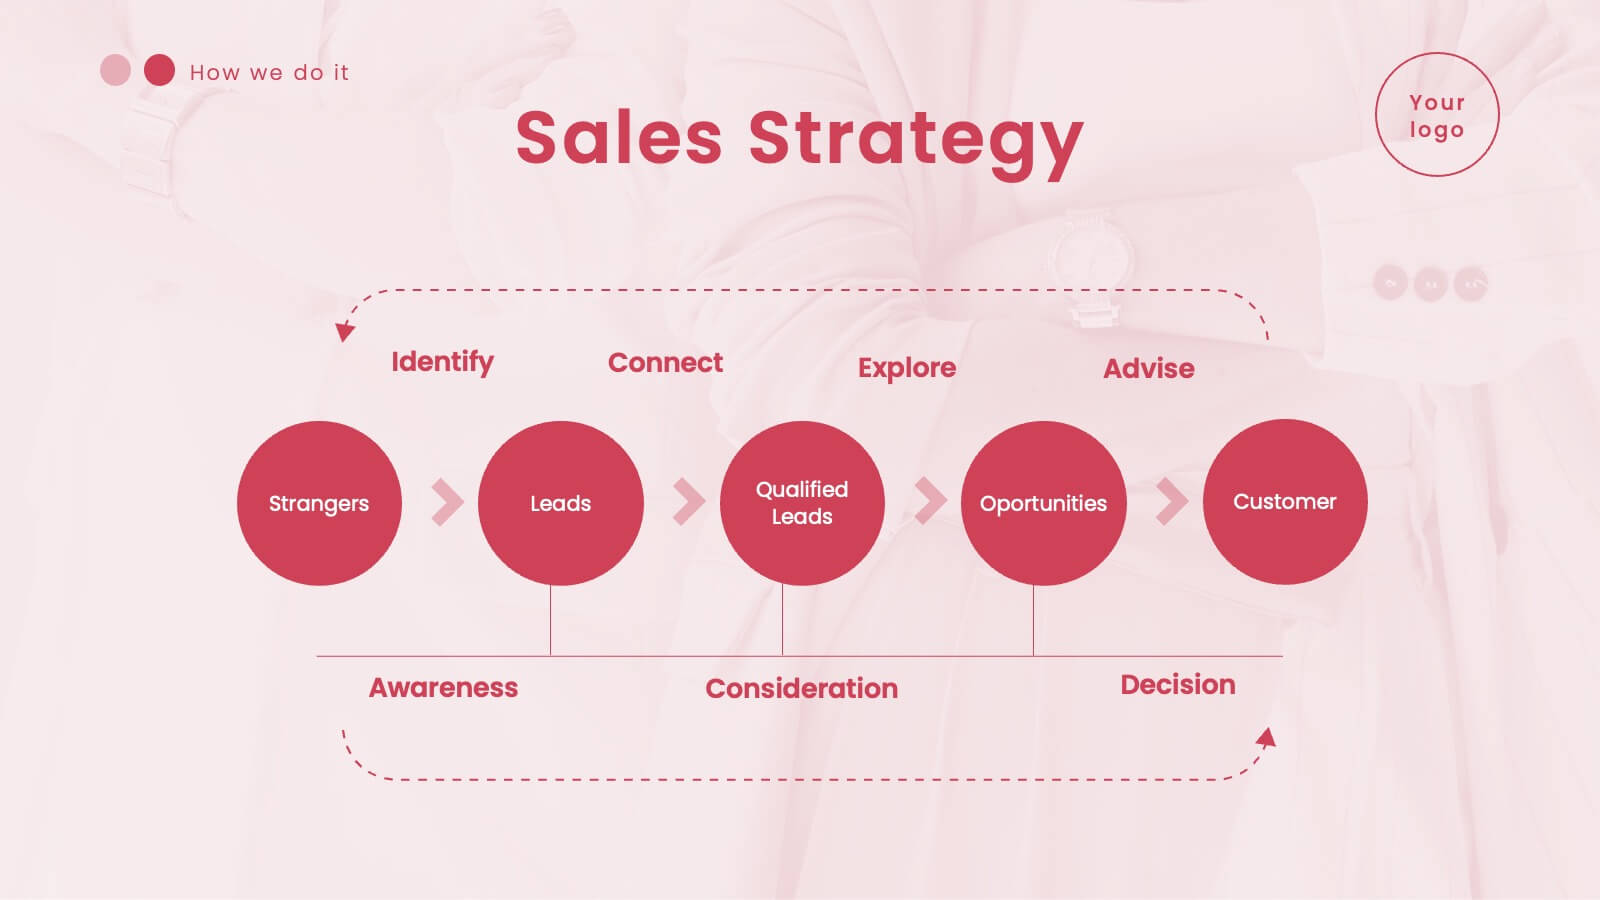
Process Flow Chart Presentation
Visualize your process with clarity using the Process Flow Chart Presentation. Featuring a central hexagon design branching out into four sequential steps, this layout is perfect for showcasing workflows, procedures, or business strategies. Color-coded options and dark/light theme variations add versatility. Fully customizable in PowerPoint, Keynote, and Google Slides.


6 diapositivas
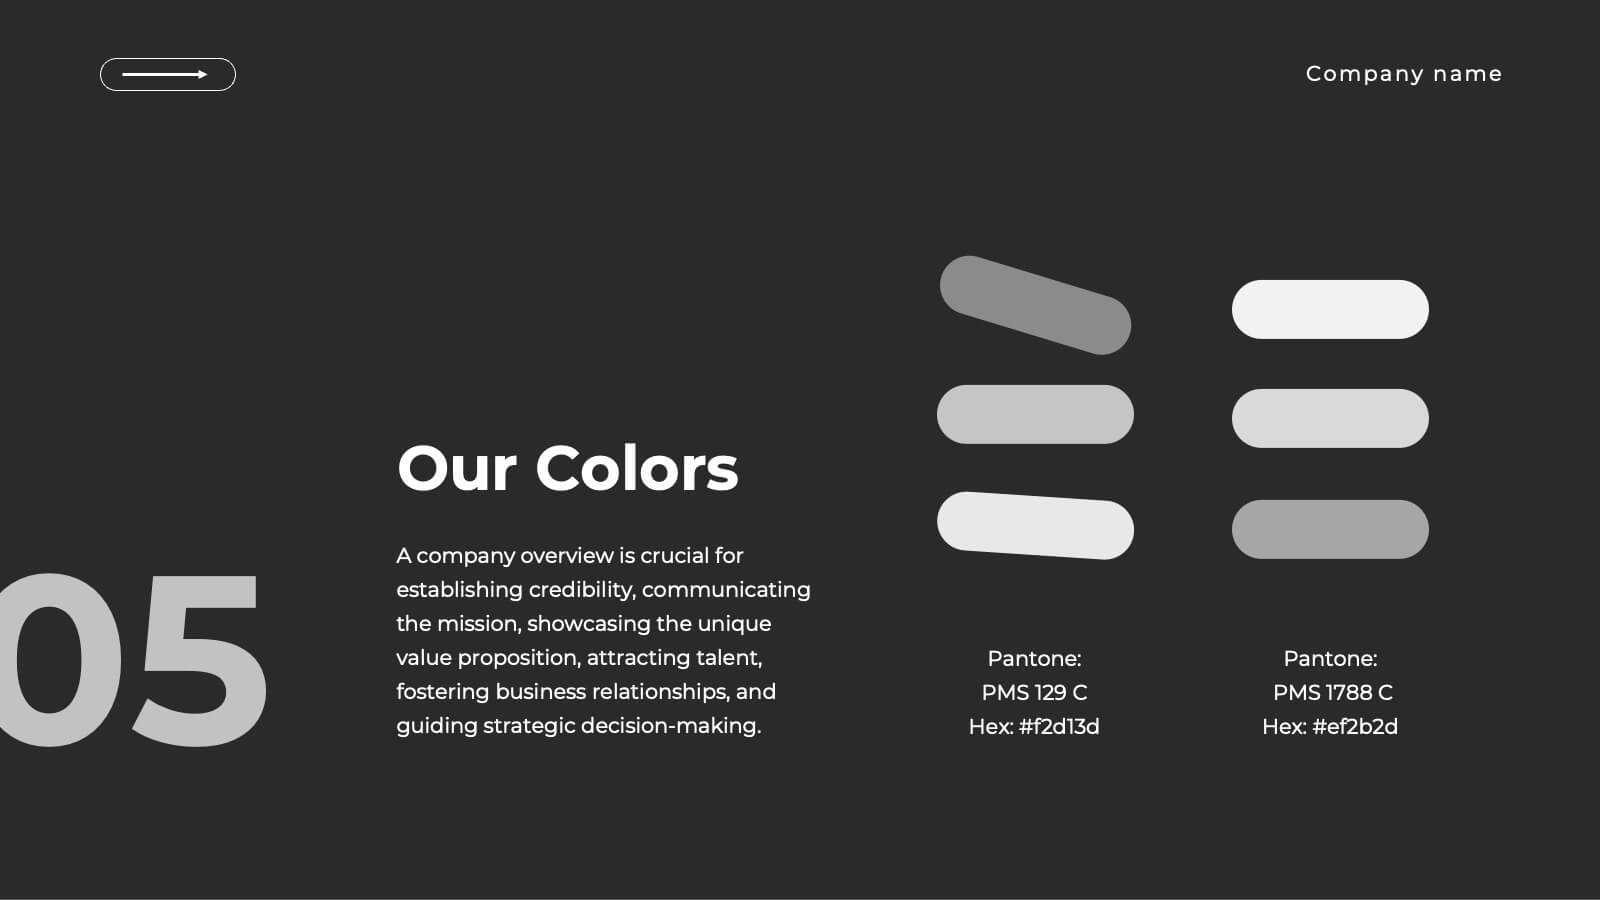
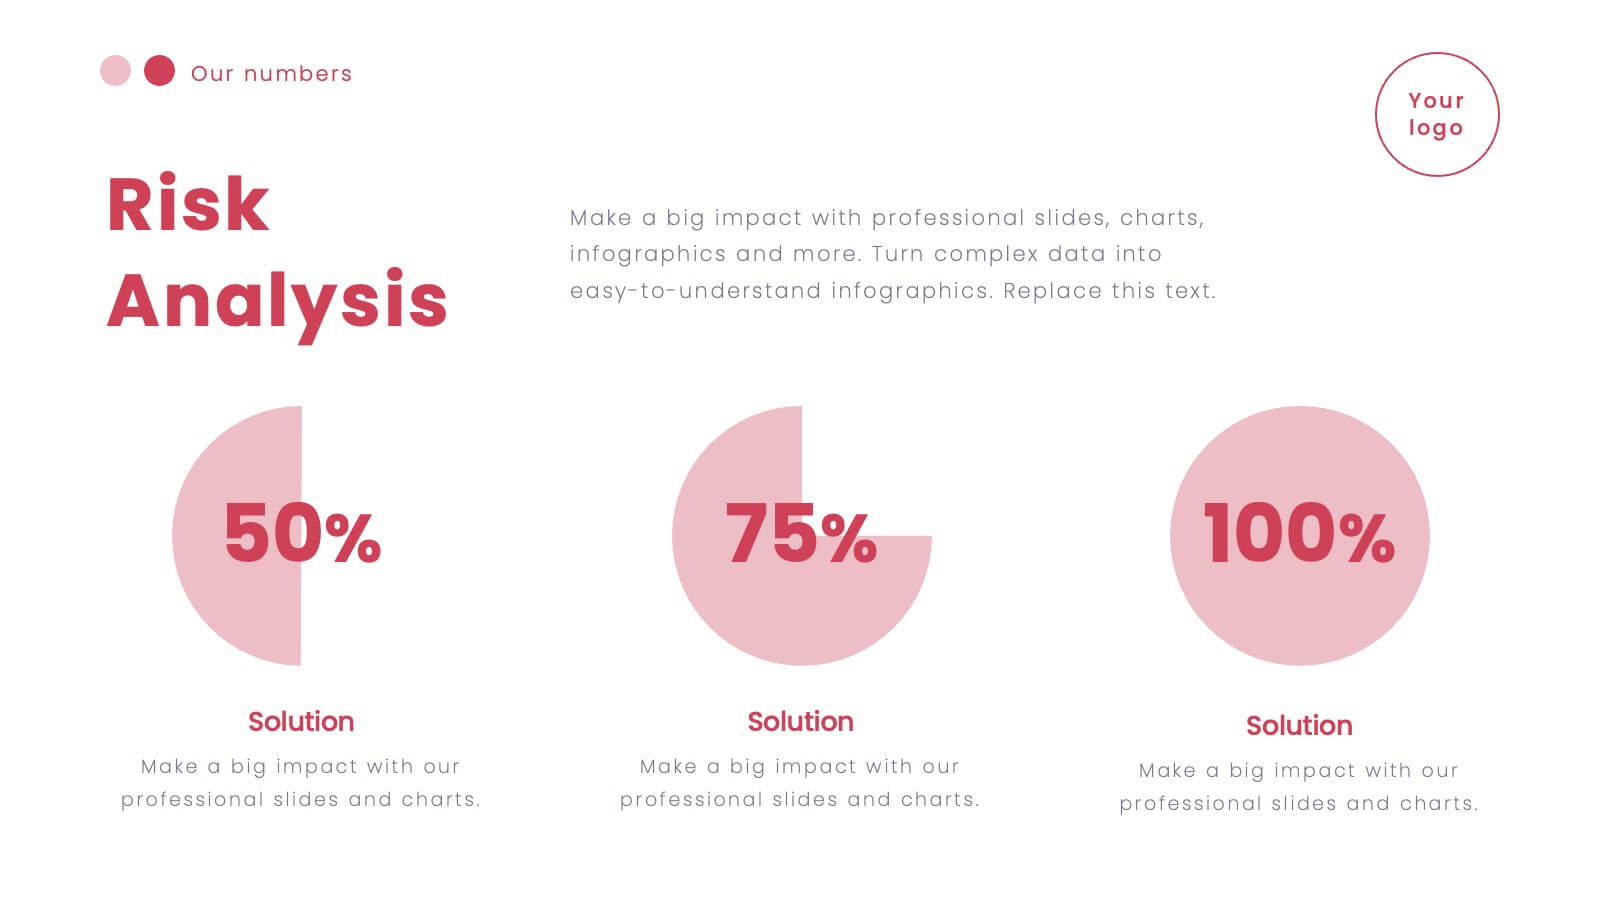
Data Visualization Pie Chart Presentation
Present data with clarity using the Data Visualization Pie Chart Presentation template. This professional and fully customizable slide deck is designed for business analysts, marketers, and data scientists to showcase key insights in an engaging and visually impactful way. Featuring a modern pie chart layout, it simplifies complex information for clear communication. Compatible with PowerPoint, Keynote, and Google Slides.


6 diapositivas
Credit Card Comparison and Features Presentation
Make your decision-making effortless with this bright and visual template that helps you break down features, perks, and details of different cards in one glance. Perfect for financial presentations or product comparisons, it clearly illustrates credit card benefits side by side. Fully compatible with PowerPoint, Keynote, and Google Slides.


6 diapositivas
Money Conversion Infographics
Convert currencies effectively with our Money Conversion infographic template. This template is fully compatible with popular presentation software like PowerPoint, Keynote, and Google Slides, allowing you to easily customize it to illustrate and communicate currency conversion rates and methods. The Money Conversion infographic template offers a visually engaging platform to explain the process of converting one currency to another, including exchange rates, conversion tools, and tips for international travelers or businesses. Whether you're a traveler, finance professional, or anyone dealing with currency exchange, this template provides a user-friendly canvas to create informative presentations and educational materials. Optimize your currency conversion knowledge with this SEO-optimized Money Conversion infographic template, thoughtfully designed for clarity and ease of use. Customize it to showcase currency conversion tools, real-time exchange rate sources, and practical examples, ensuring that your audience gains valuable insights into this important aspect of finance. Start crafting your personalized infographic today to become more proficient in money conversion.


26 diapositivas
Effective Communication Skills Presentation
Discover the key to successful interactions with our Effective Communication Skills presentation template. This all-in-one template is fully compatible with PowerPoint, Keynote, and Google Slides, making it the perfect addition to your toolkit, whether you're an educator, a corporate trainer, or a team leader. Our template is meticulously designed to help you convey the essence of effective communication, breaking down complex concepts into easily understandable segments. From active listening to clear articulation, it covers various aspects of communication that are crucial in both personal and professional environments. Each slide in the Effective Communication Skills template features a clean, engaging design, encouraging viewers to focus on the content. Editable charts, graphs, and models allow for a customized experience, ensuring that your message resonates with your specific audience. By using this template, you can confidently guide your audience through the intricacies of effective communication, making your presentation a reference point for those looking to improve their communication skills. Elevate your presentations and ensure your message is not just heard, but understood and acted upon.


4 diapositivas
Agricultural Business Strategy Presentation
Cultivate success in the field of agriculture with our dynamic Agricultural Business Strategy Presentation template. This visually appealing and easy-to-use template is perfect for showcasing innovative strategies that drive agricultural growth and efficiency. Each slide is thoughtfully designed to help you present crucial business insights and foster sustainable development in the farming sector. Ideal for agribusiness professionals seeking to make a meaningful impact, this template is fully compatible with PowerPoint, Keynote, and Google Slides, ensuring a smooth presentation experience across various platforms.


10 diapositivas
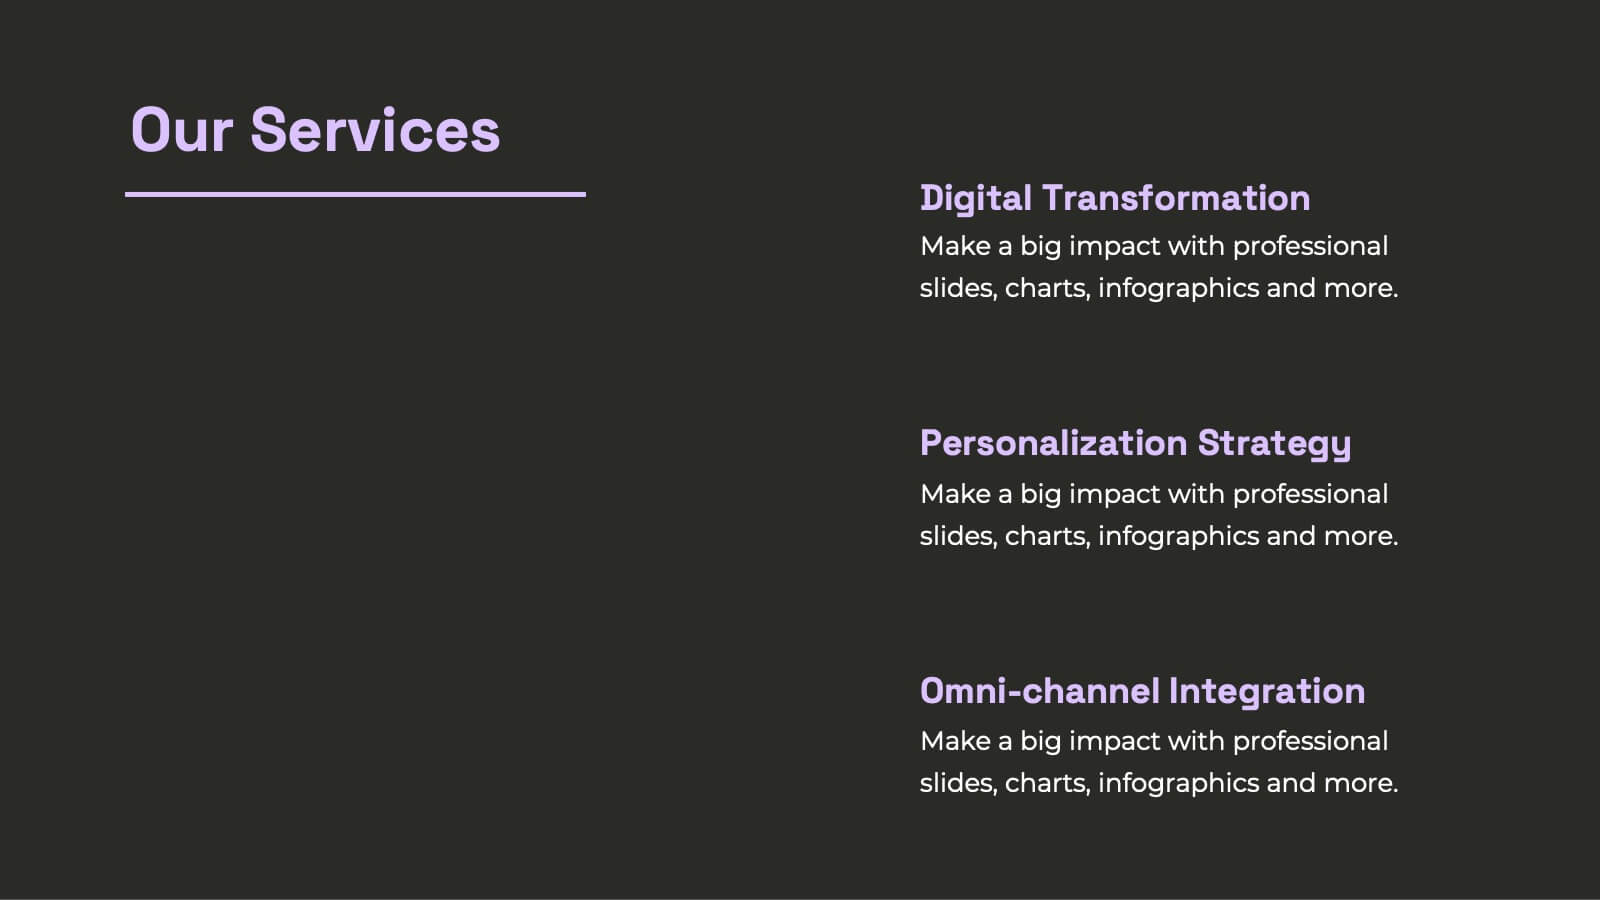
Digital Transformation Strategy Presentation
The "Digital Transformation Strategy Presentation" template is designed to clearly showcase the stages of digital transformation initiatives. It features a visually appealing layout with concentric circles or varying targets that focus on key elements of transformation strategy. This format is ideal for emphasizing the progression from planning to execution and monitoring of digital strategies. Each section is distinctly colored and provides a space for succinctly labeled titles and detailed descriptions, making it perfect for presenting strategic initiatives, technology implementation, or progress metrics in corporate settings. The template ensures that complex strategies are communicated in an understandable and visually engaging manner.


22 diapositivas
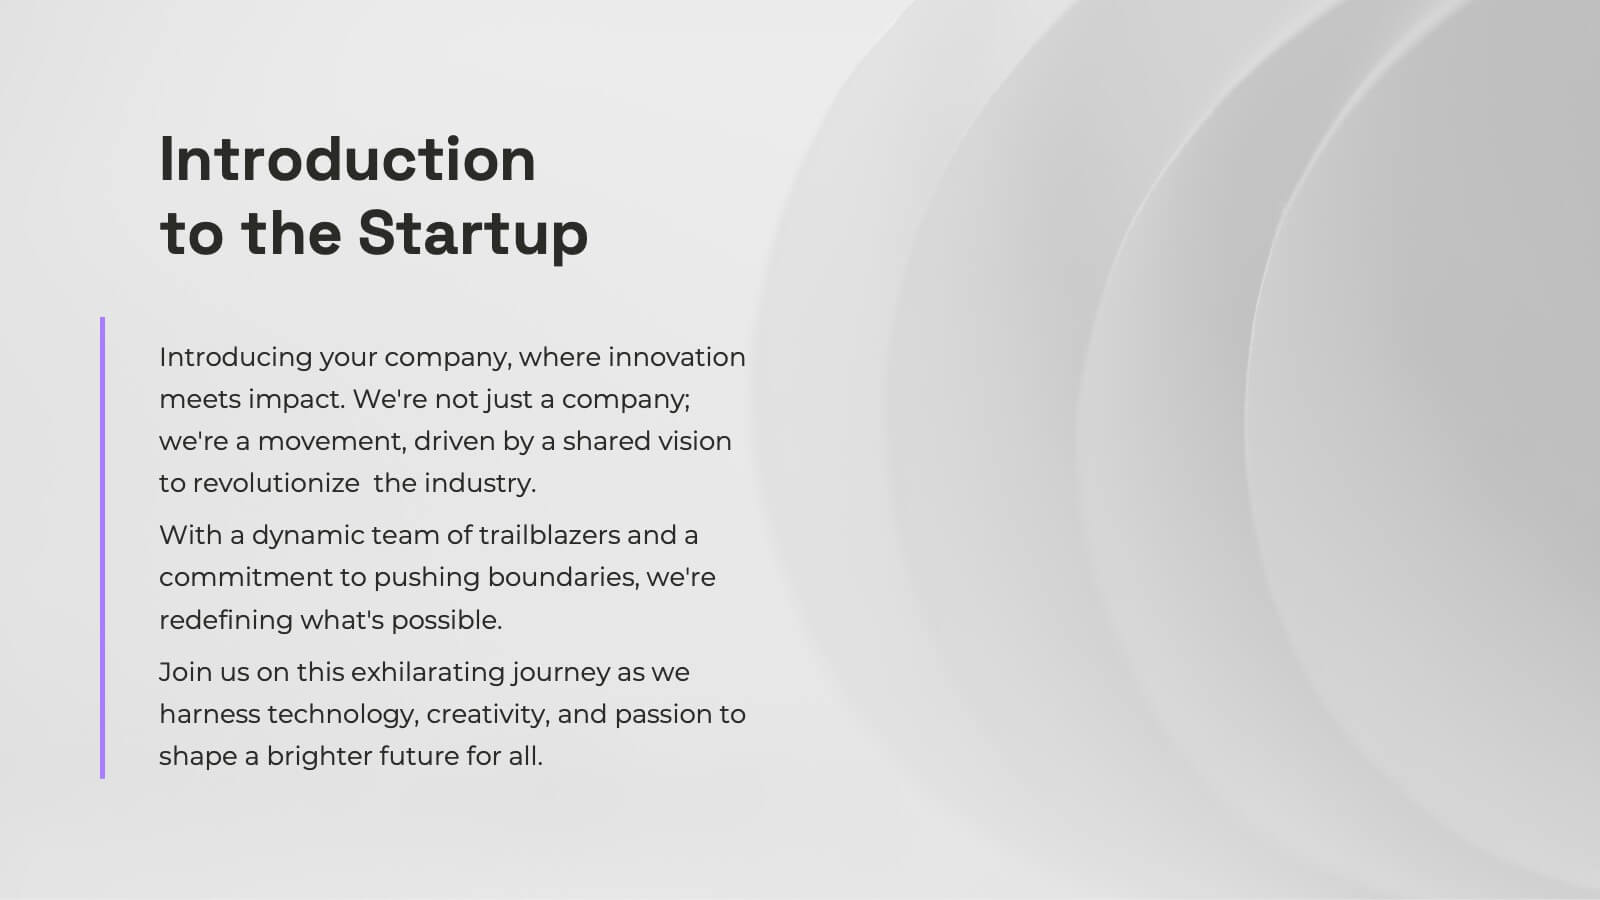
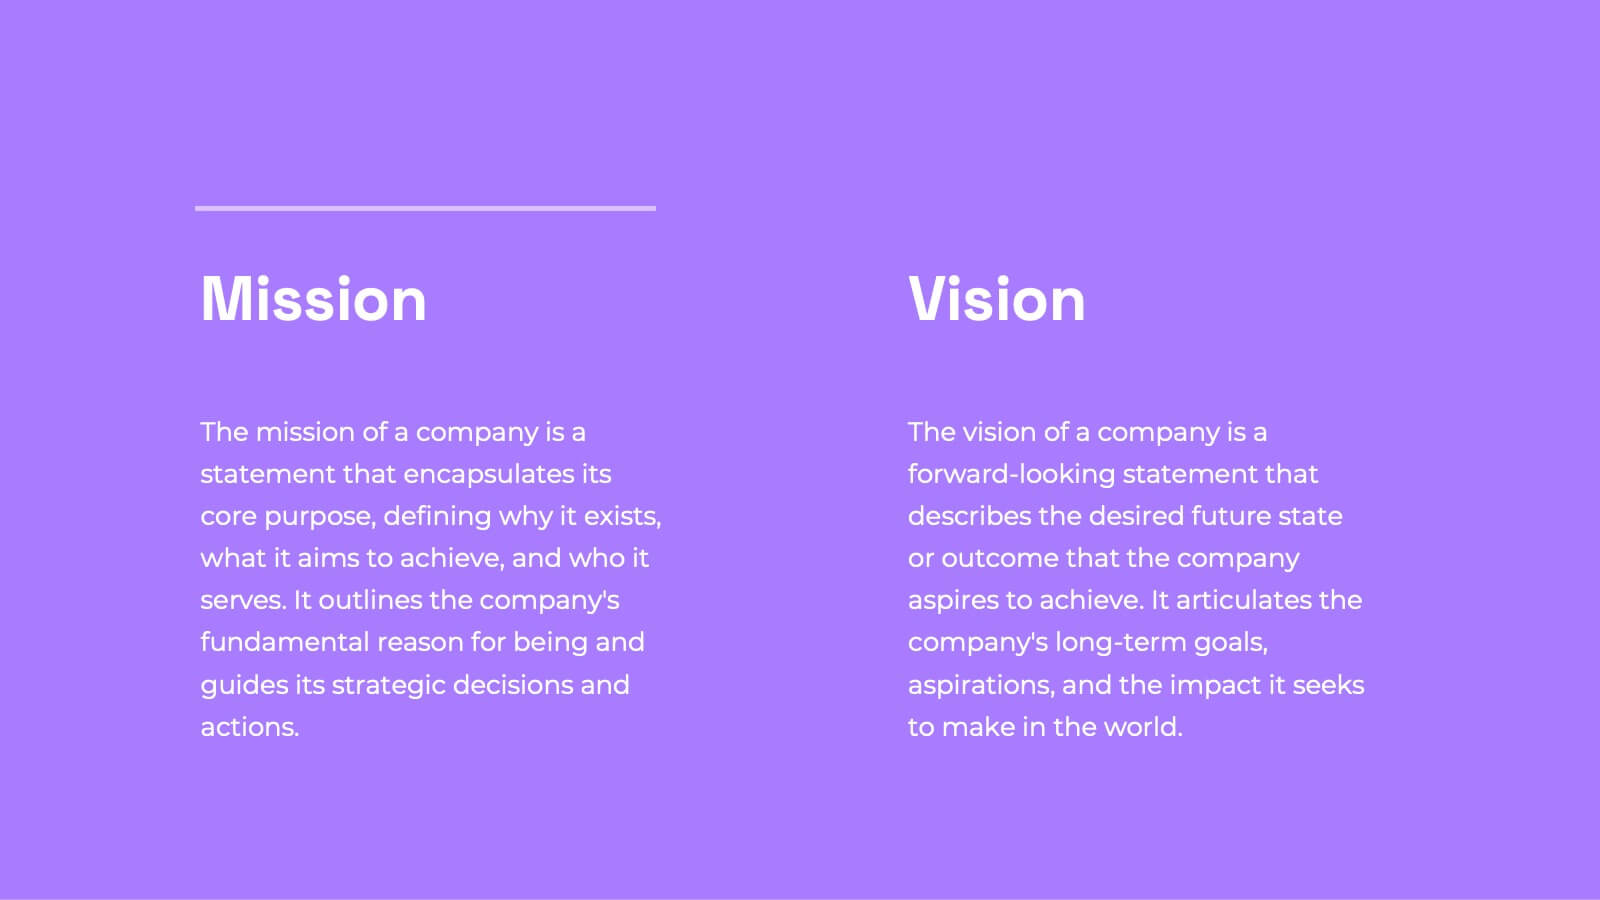
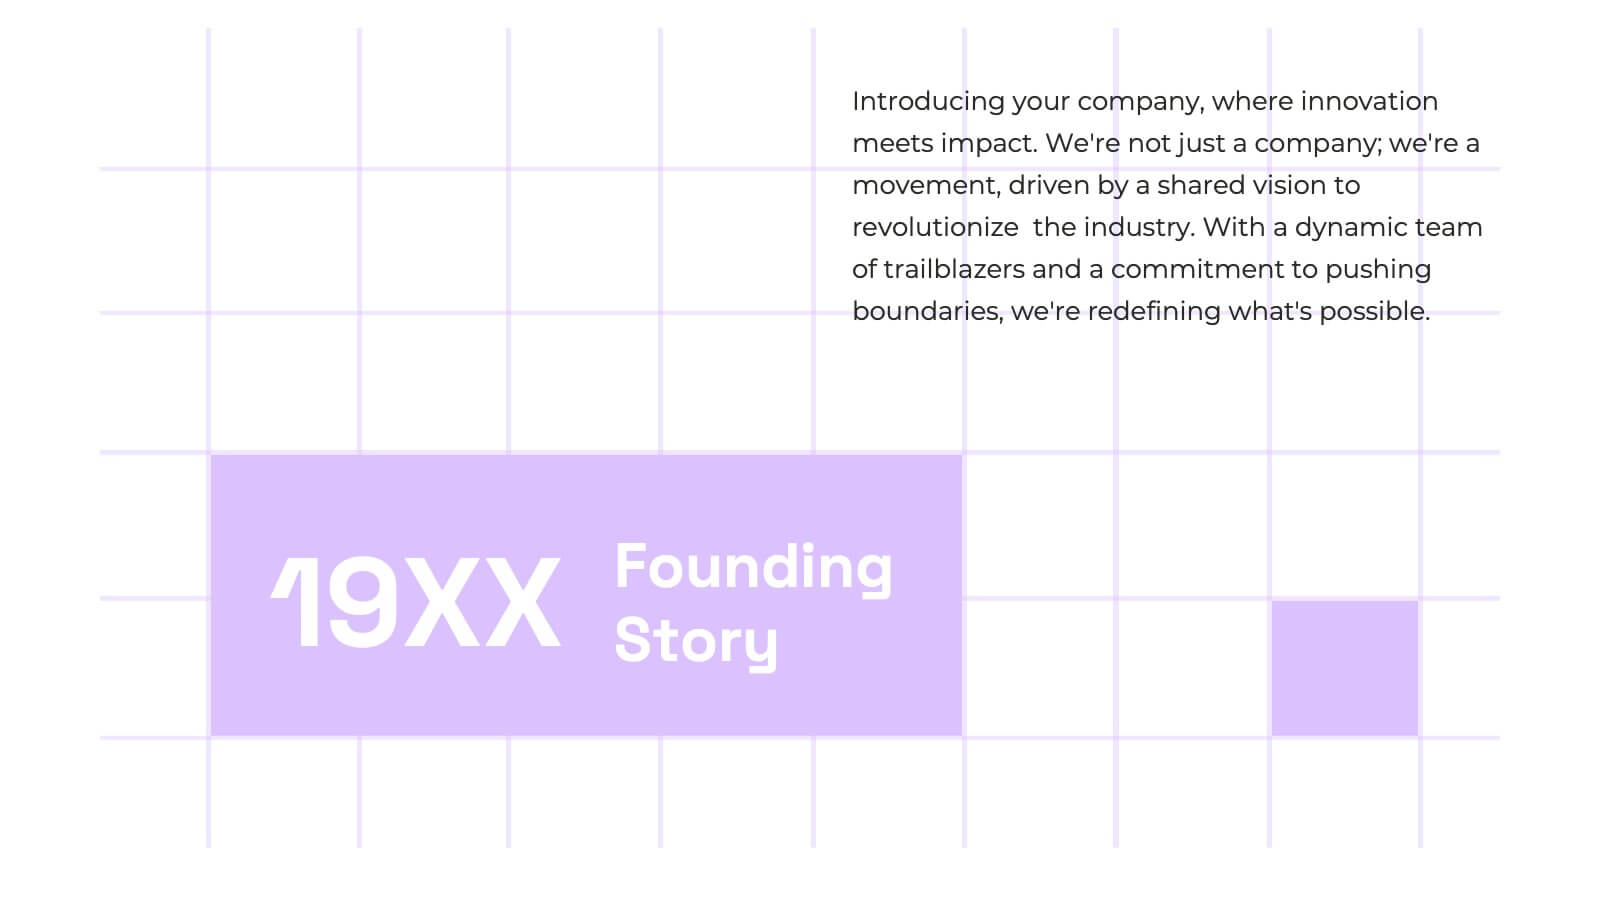
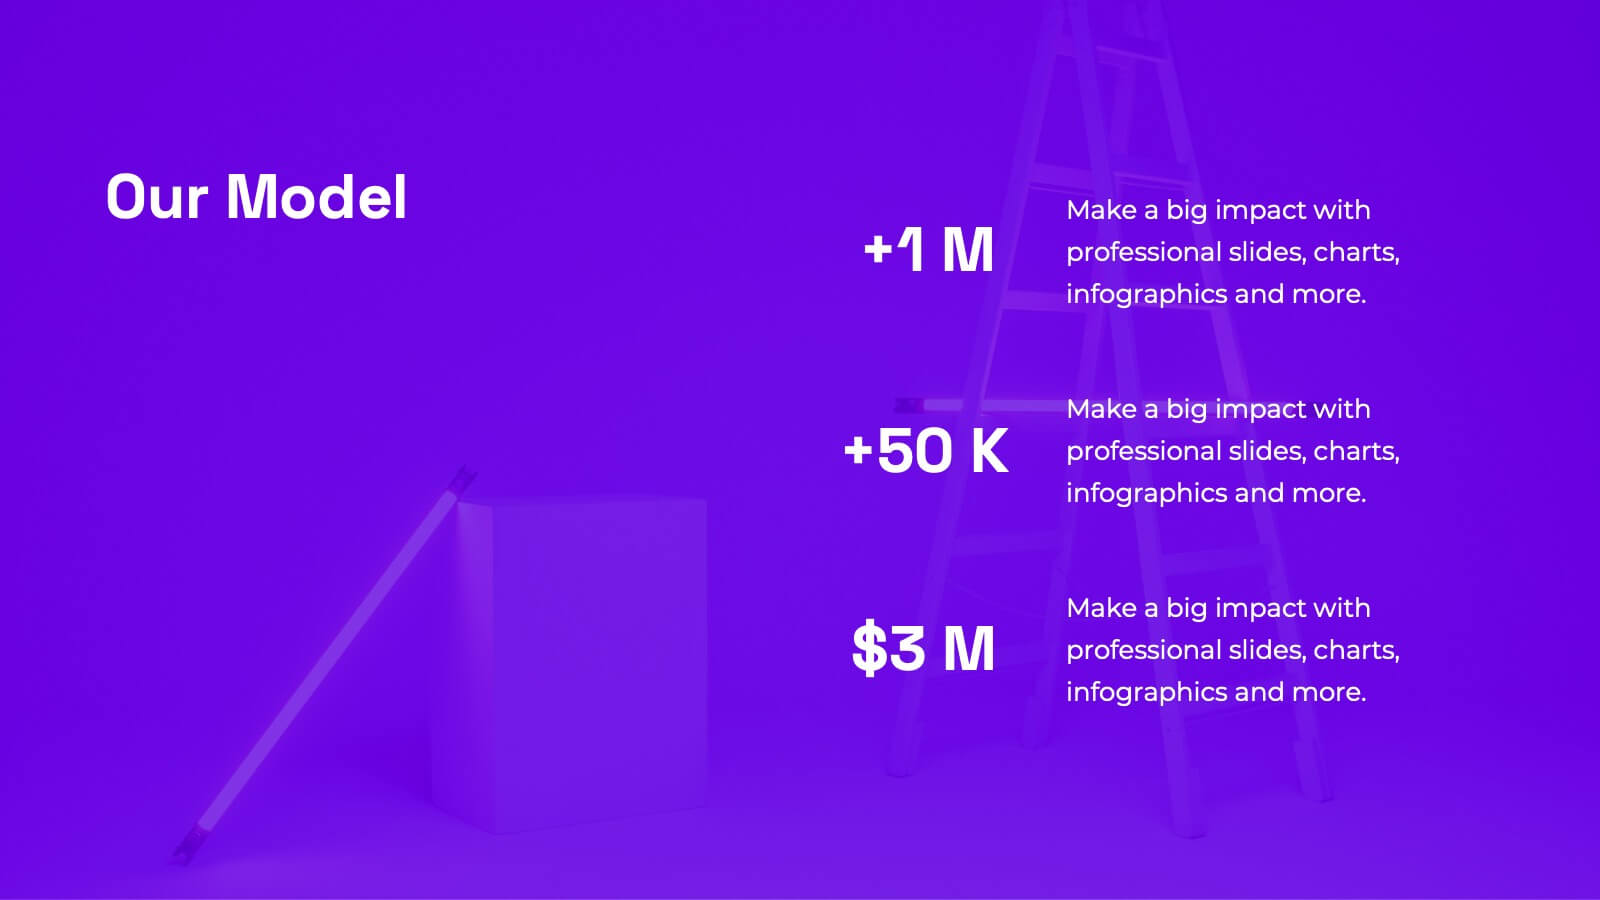
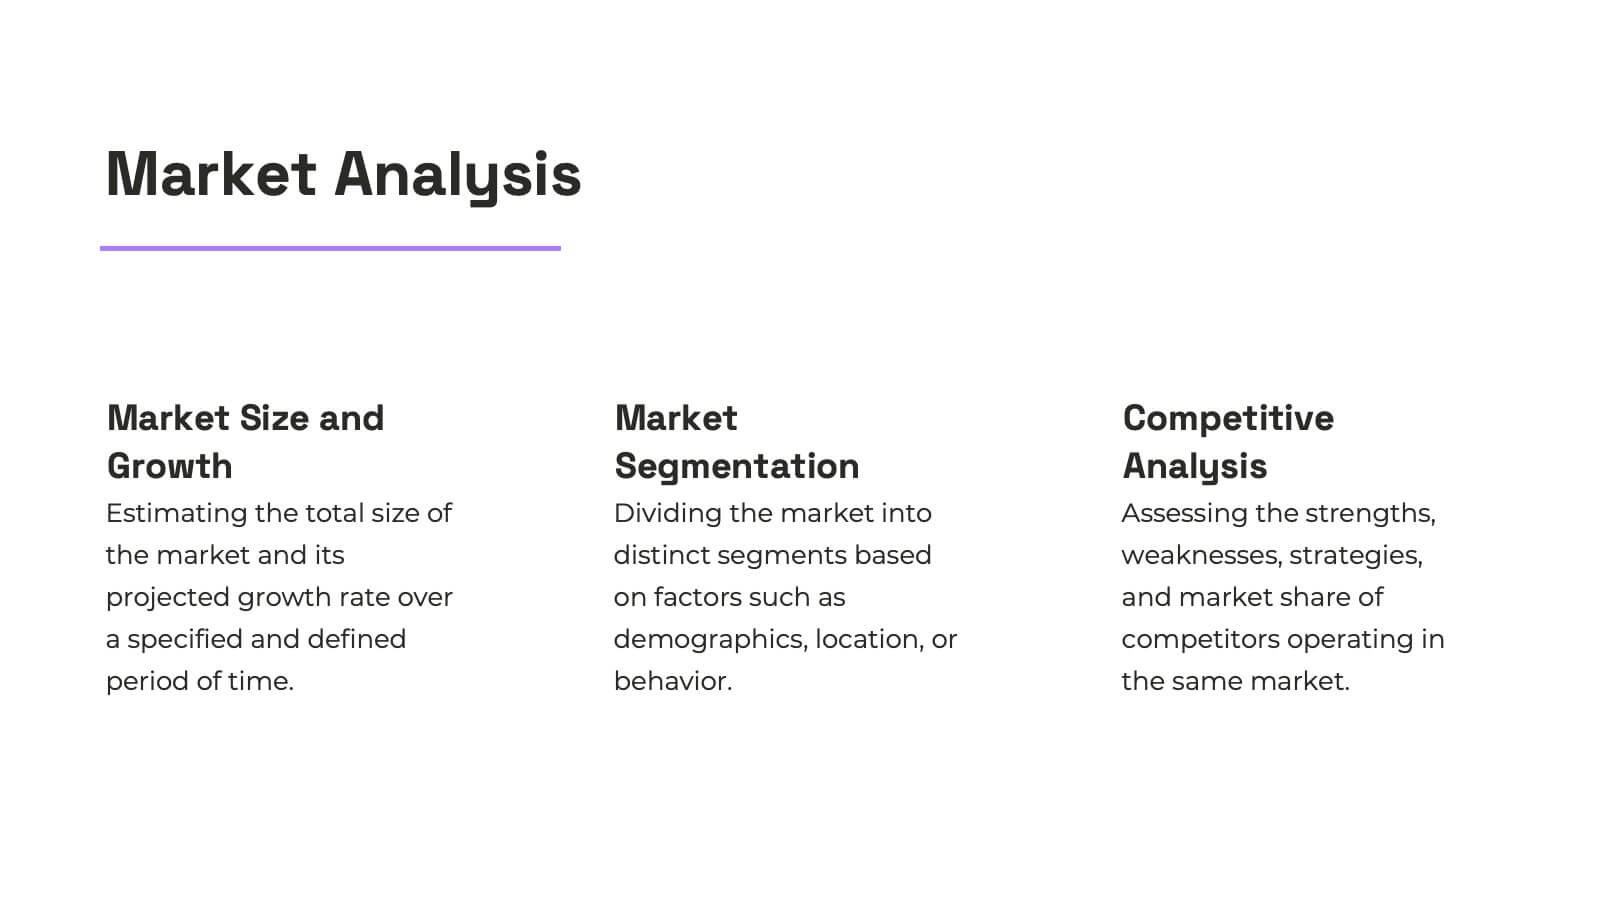
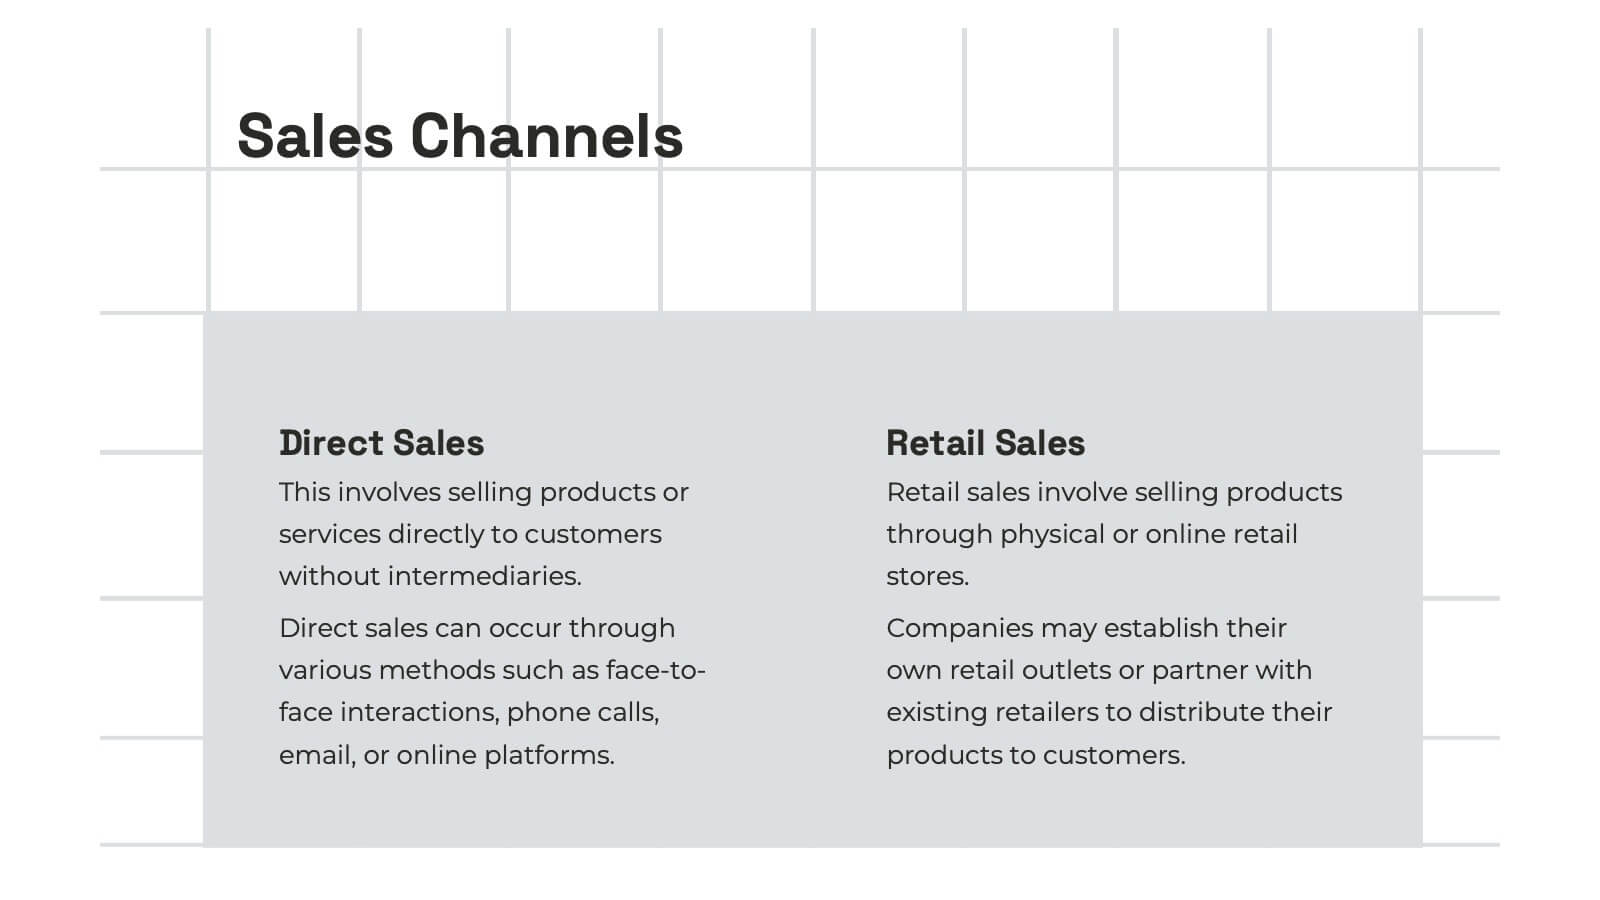
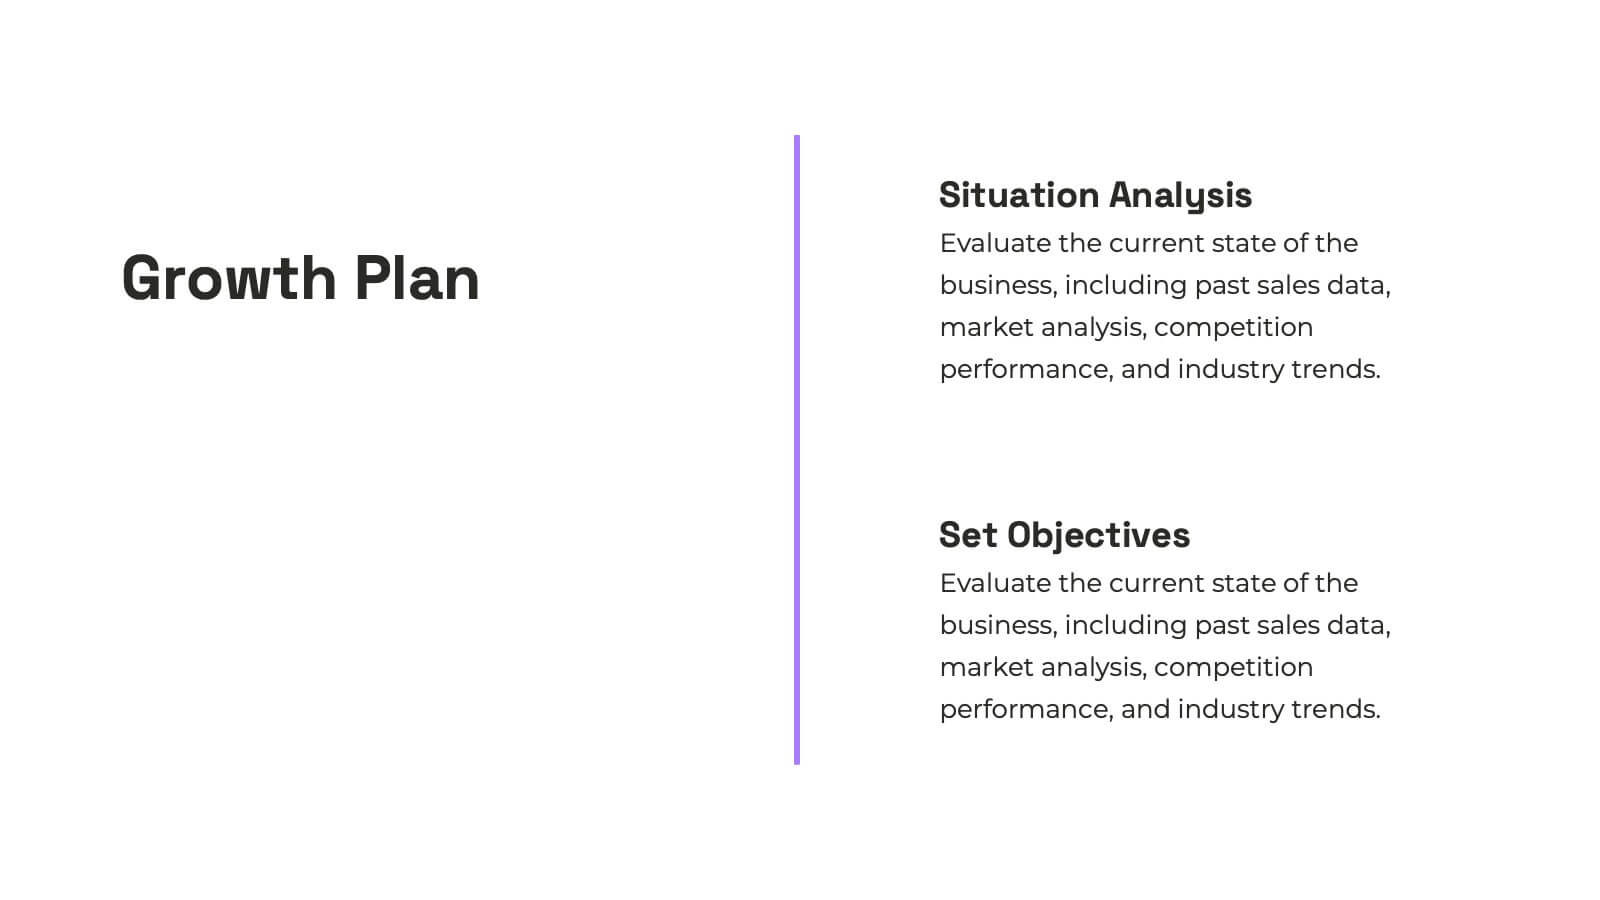
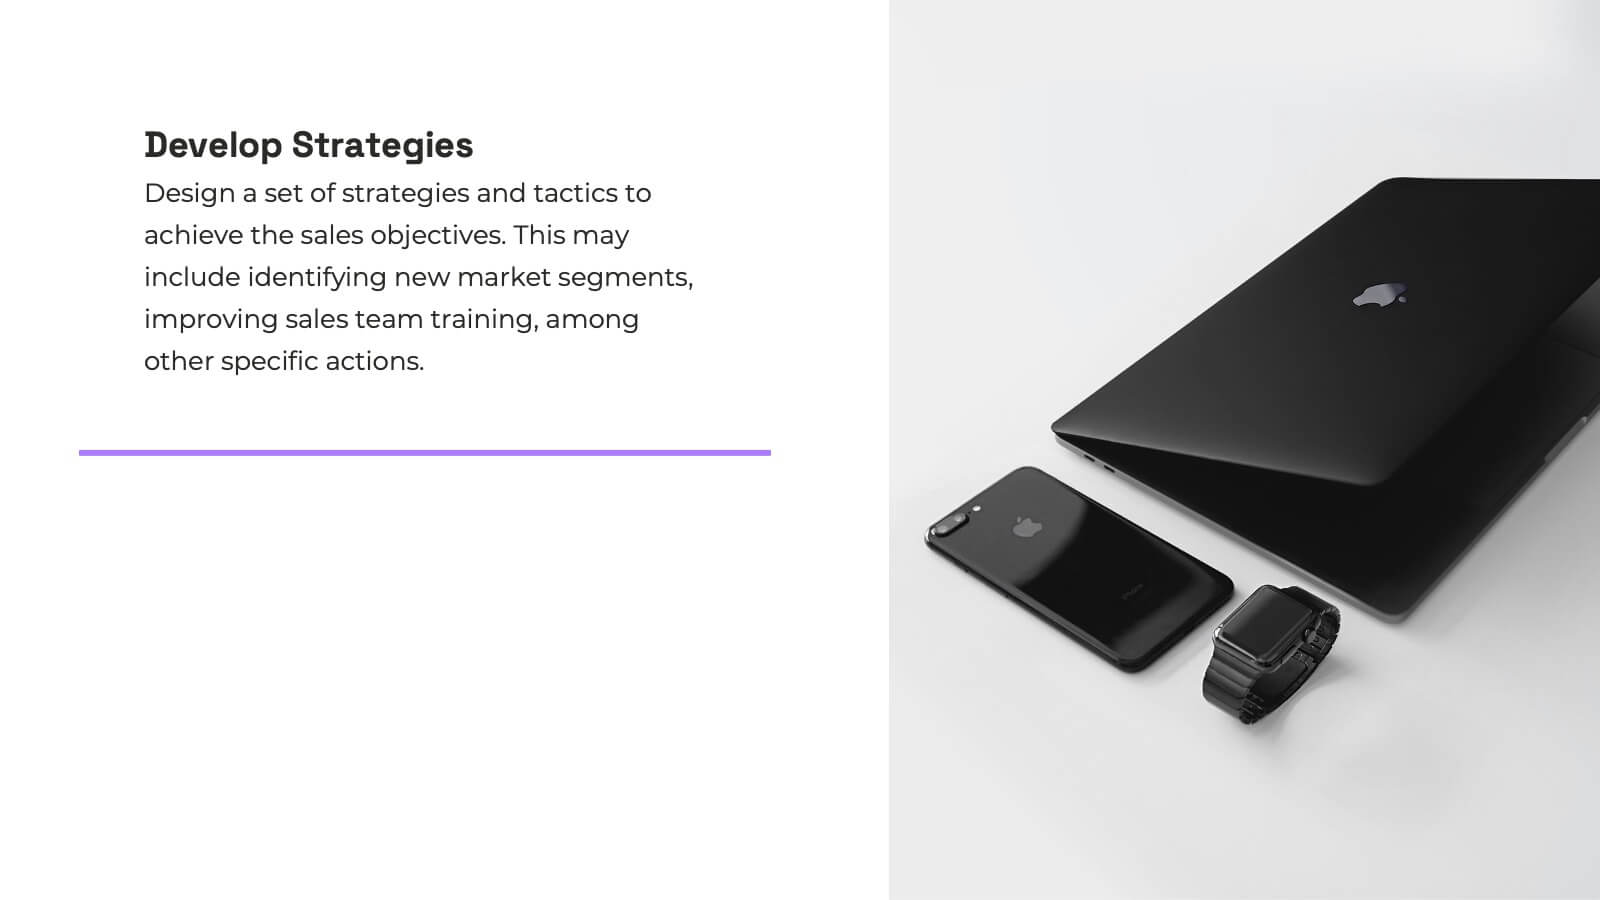
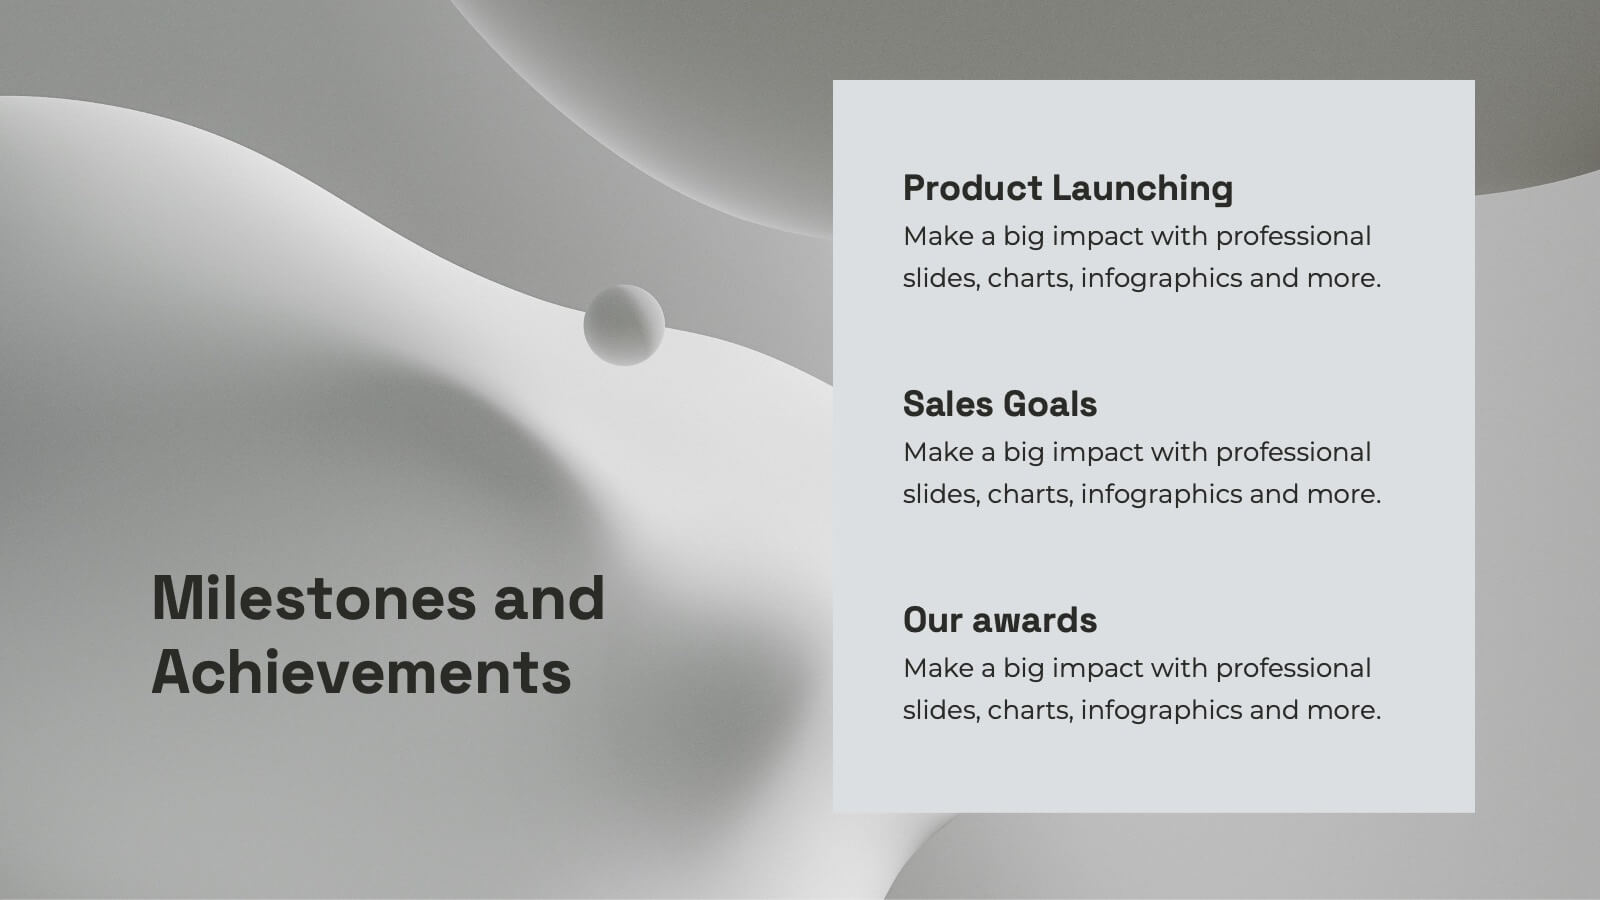
Nexus Startup Growth Plan Presentation
Jumpstart your business journey with this dynamic presentation template! Ideal for outlining your startup growth plan, it covers mission, vision, market analysis, and financial projections with sleek, professional slides. Capture investor interest and articulate your strategy effortlessly. Compatible with PowerPoint, Keynote, and Google Slides, ensuring seamless presentation across all platforms.


20 diapositivas
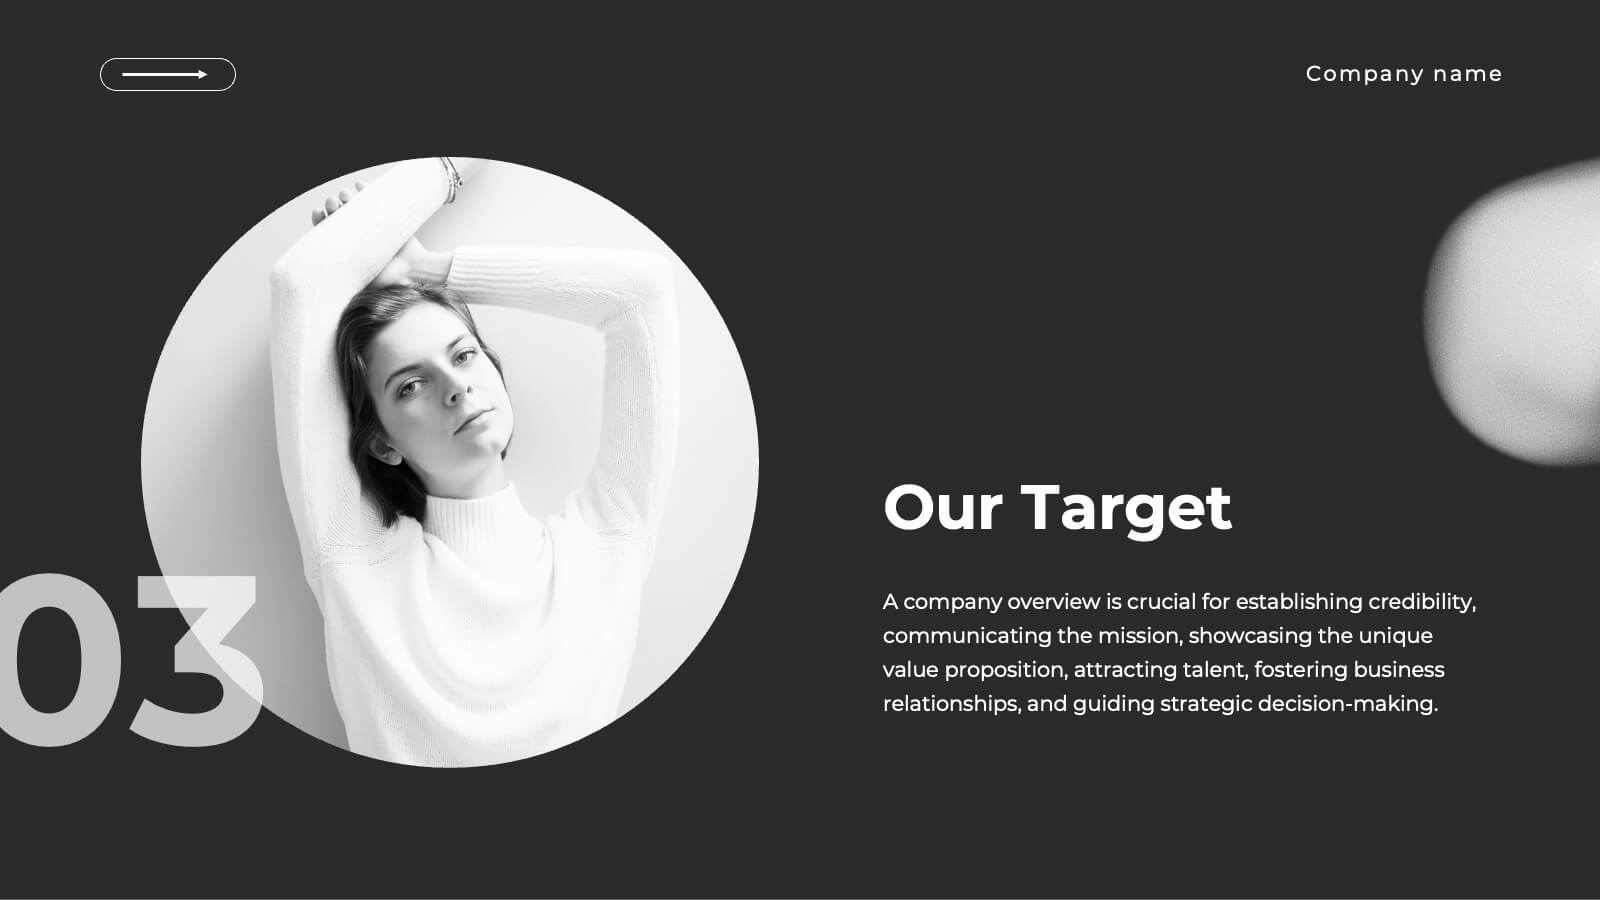
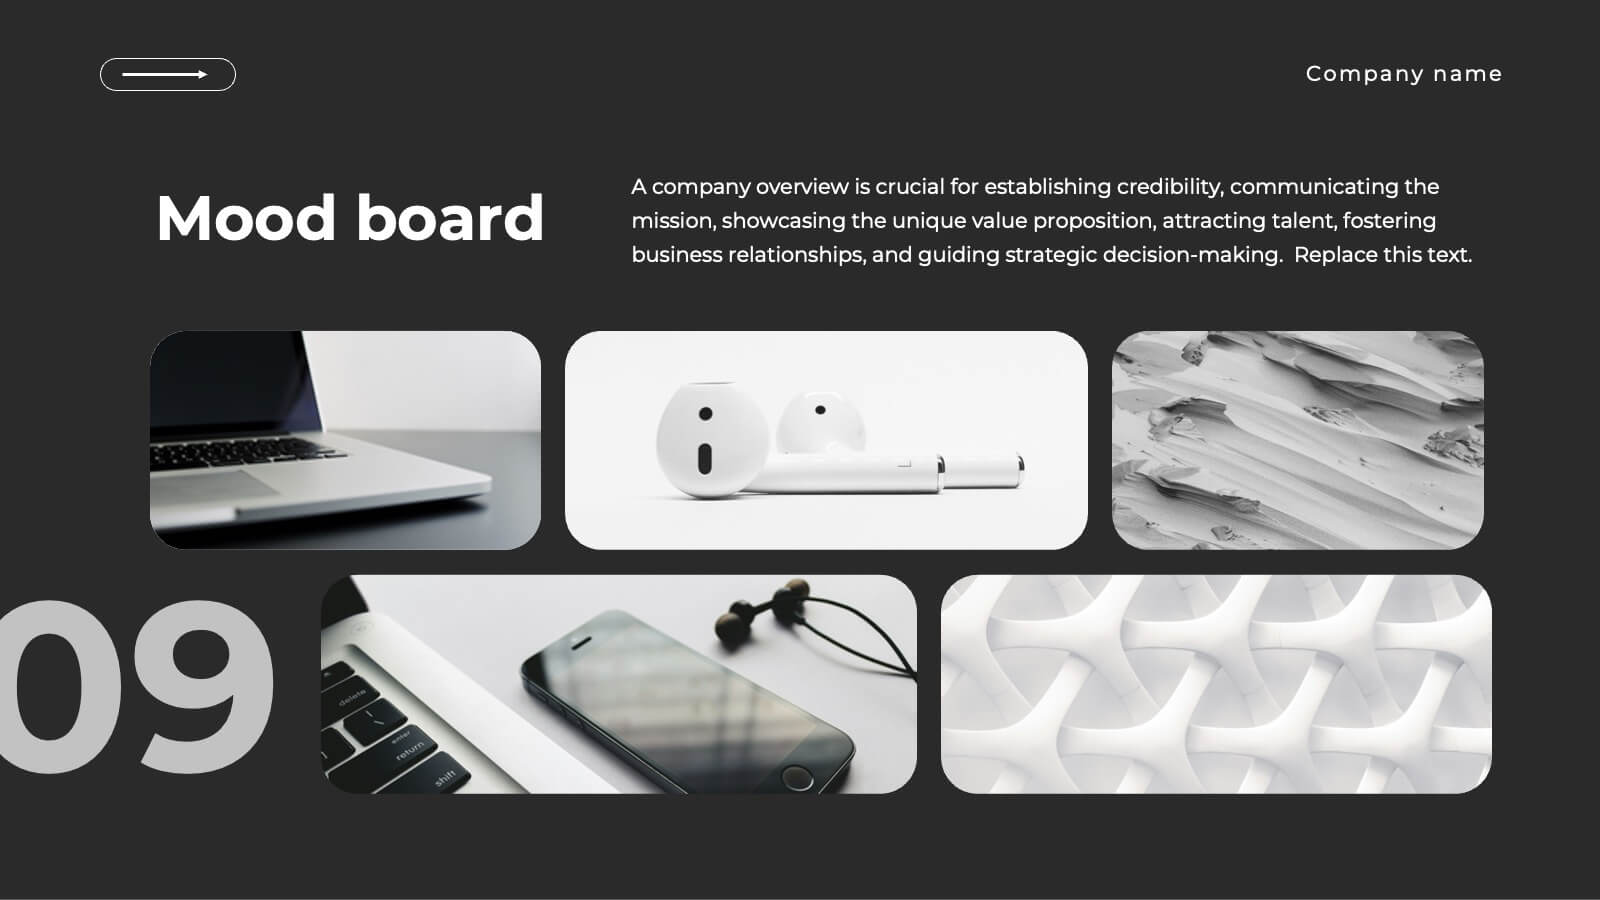
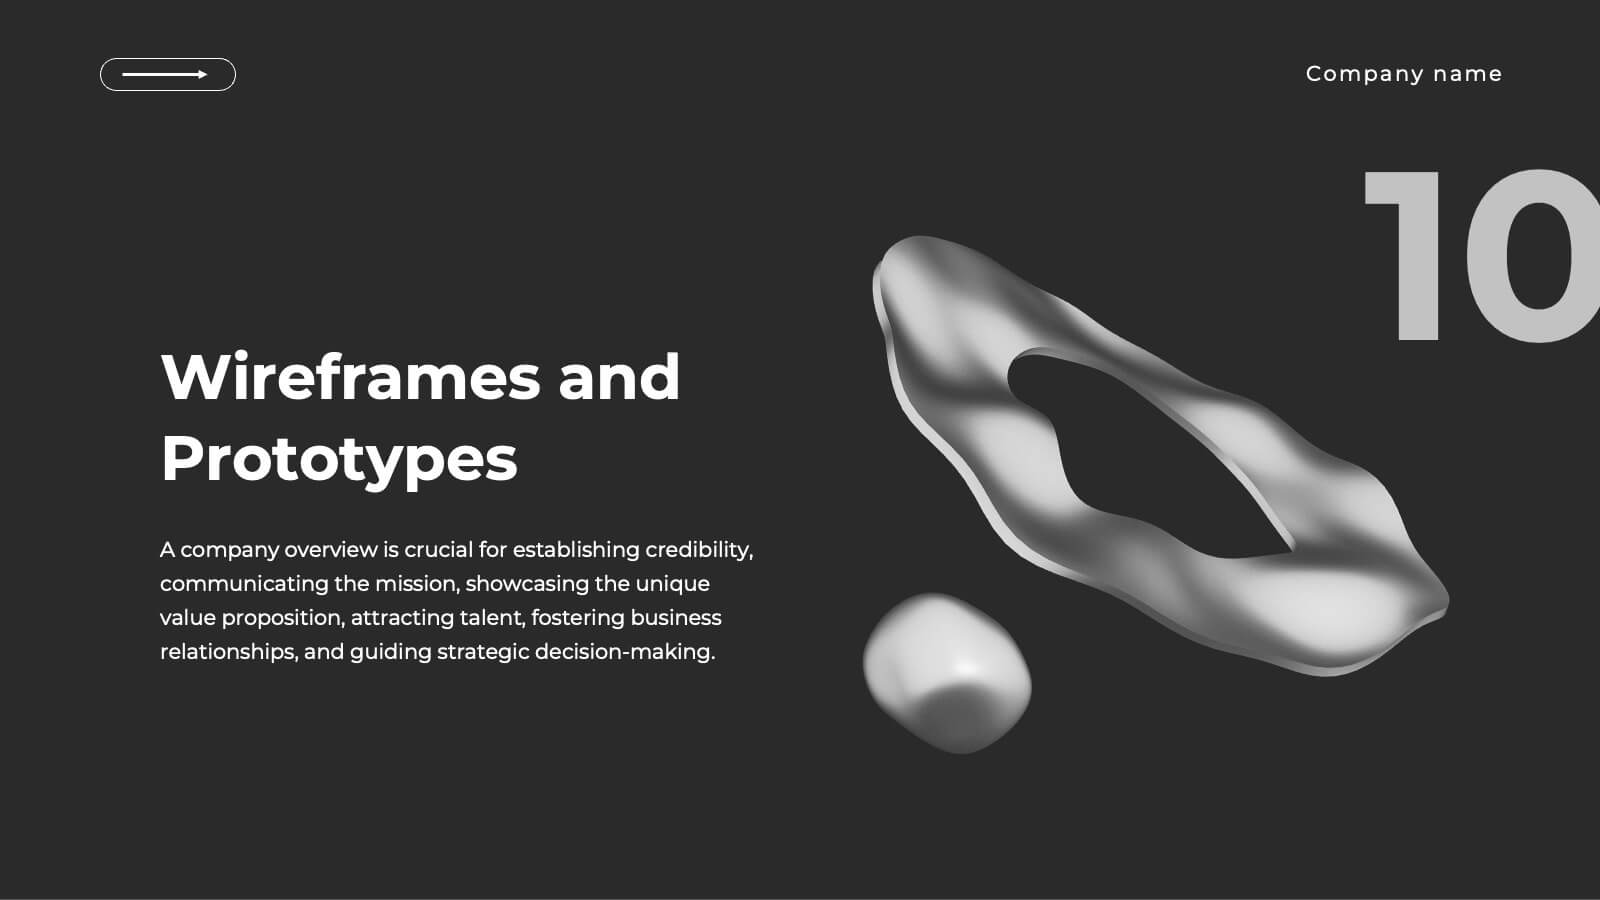
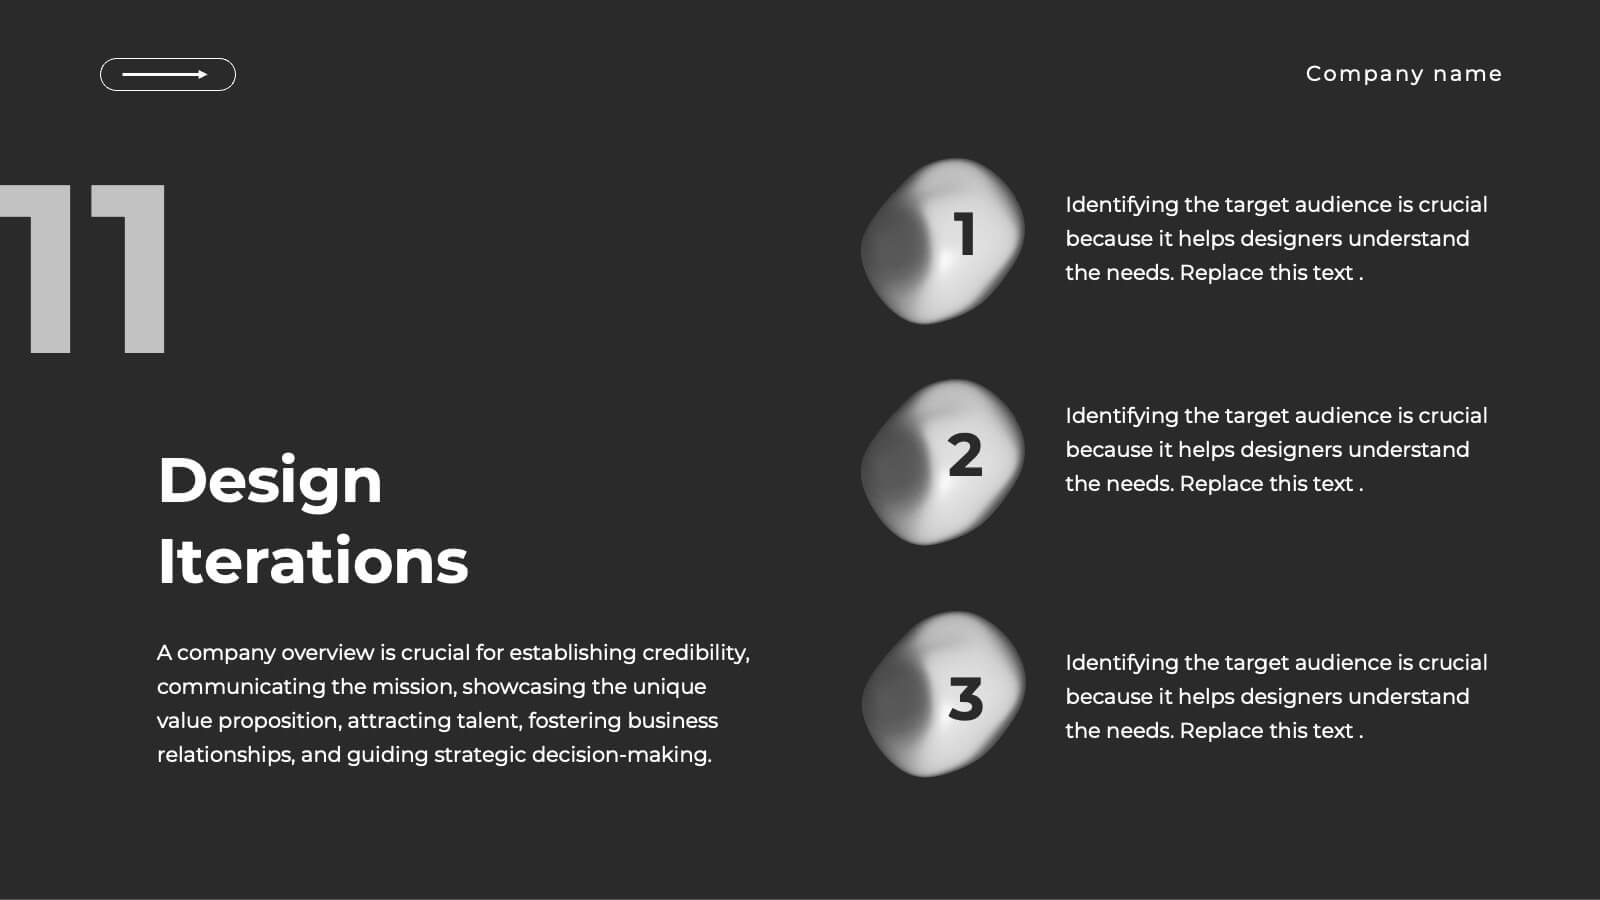
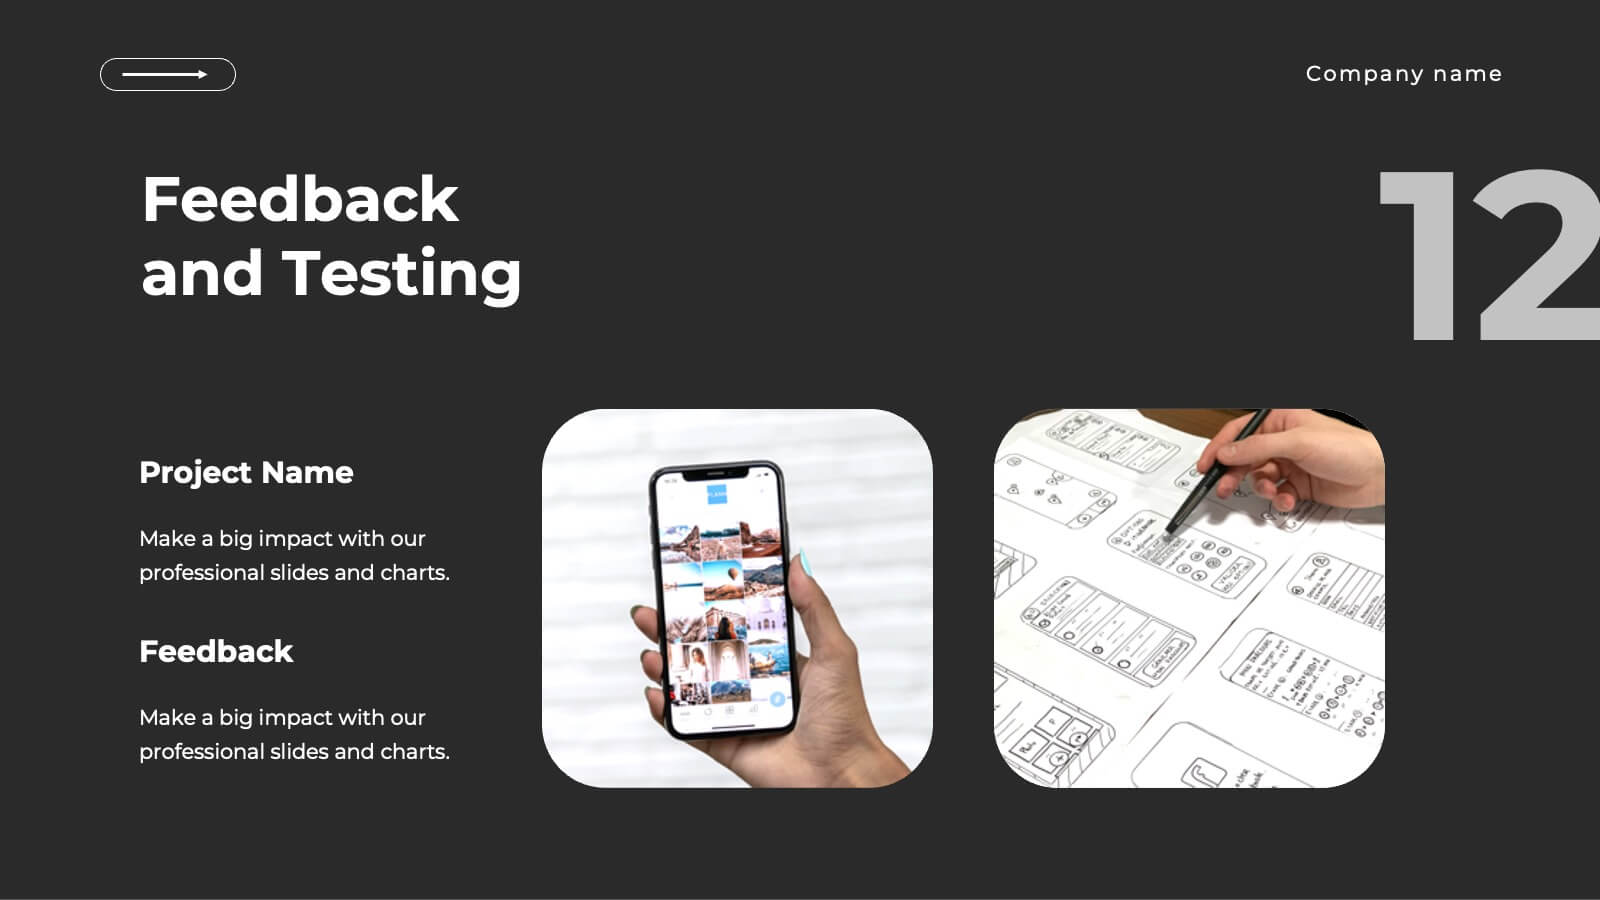
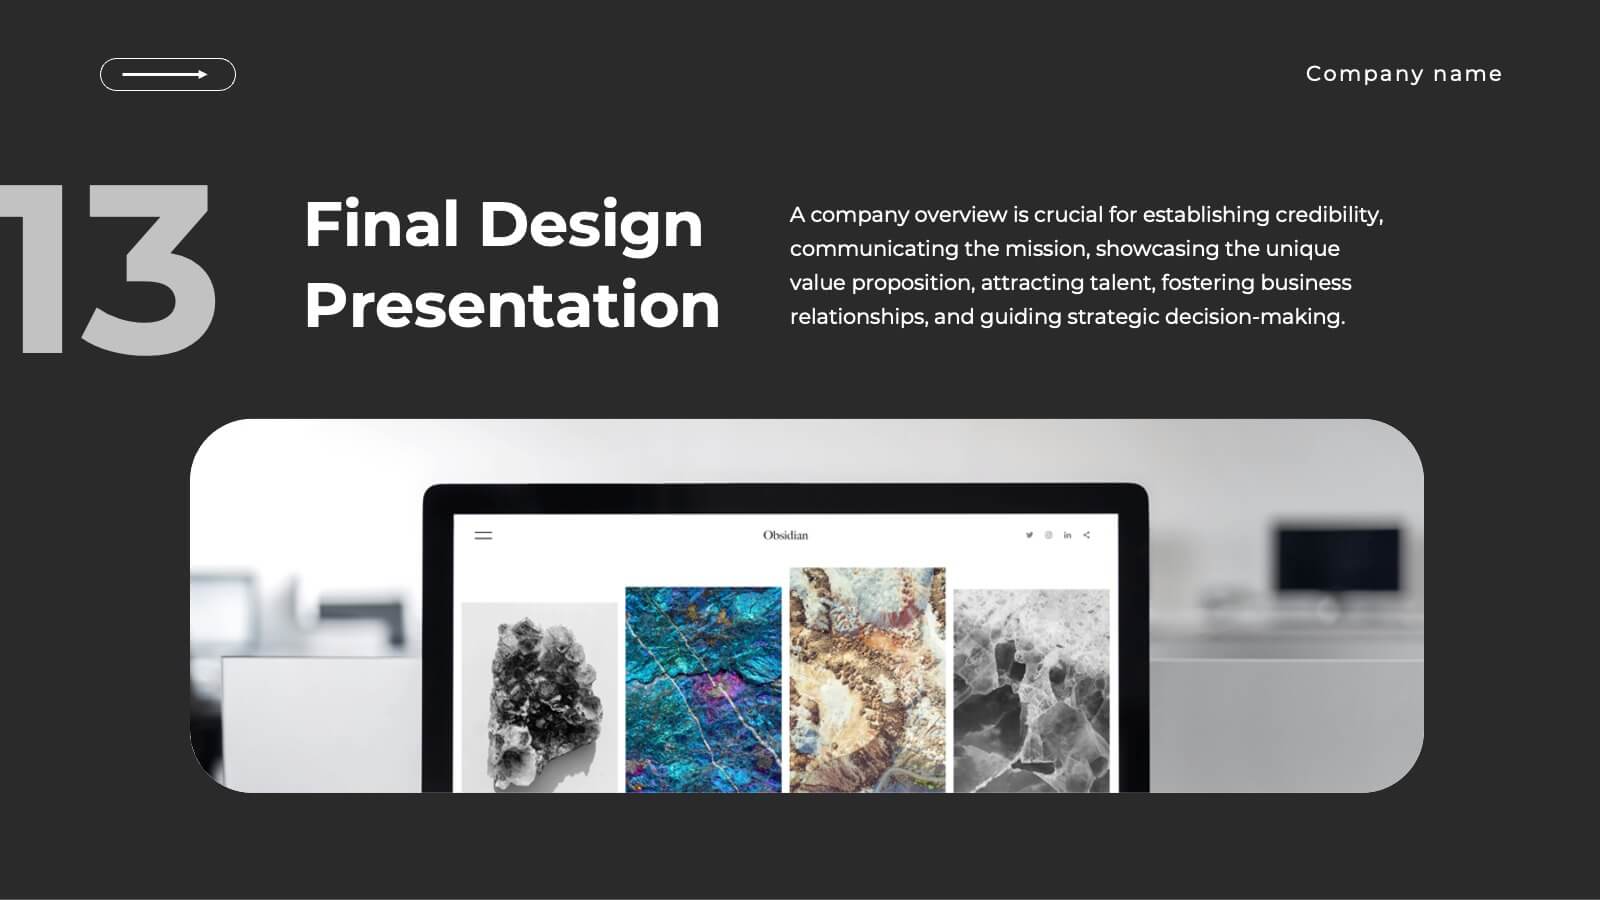
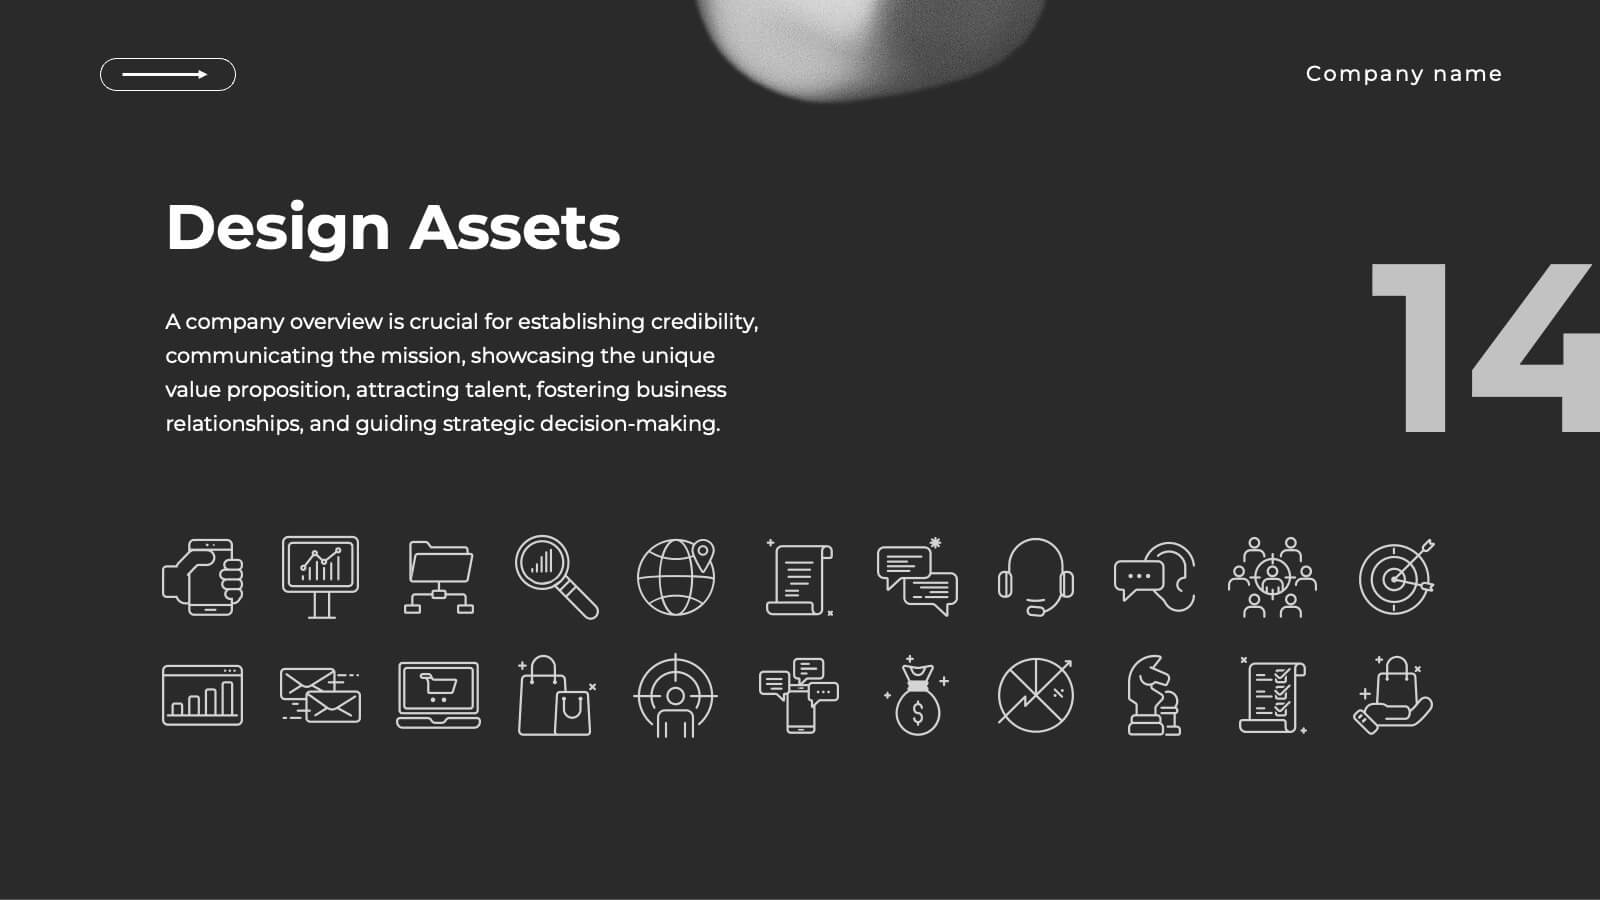
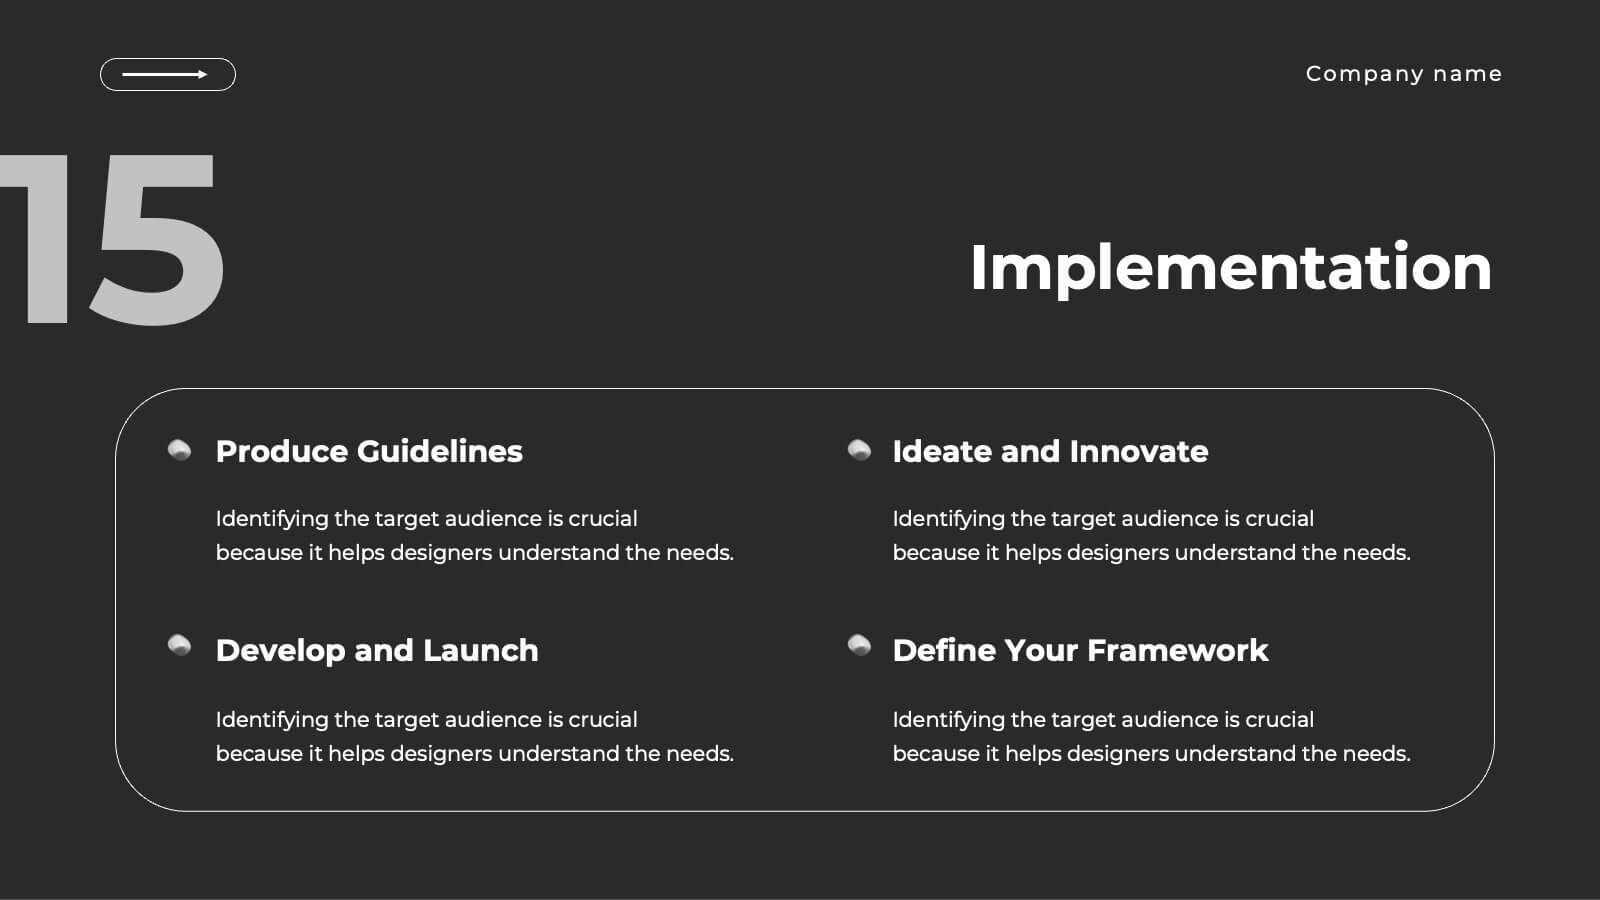
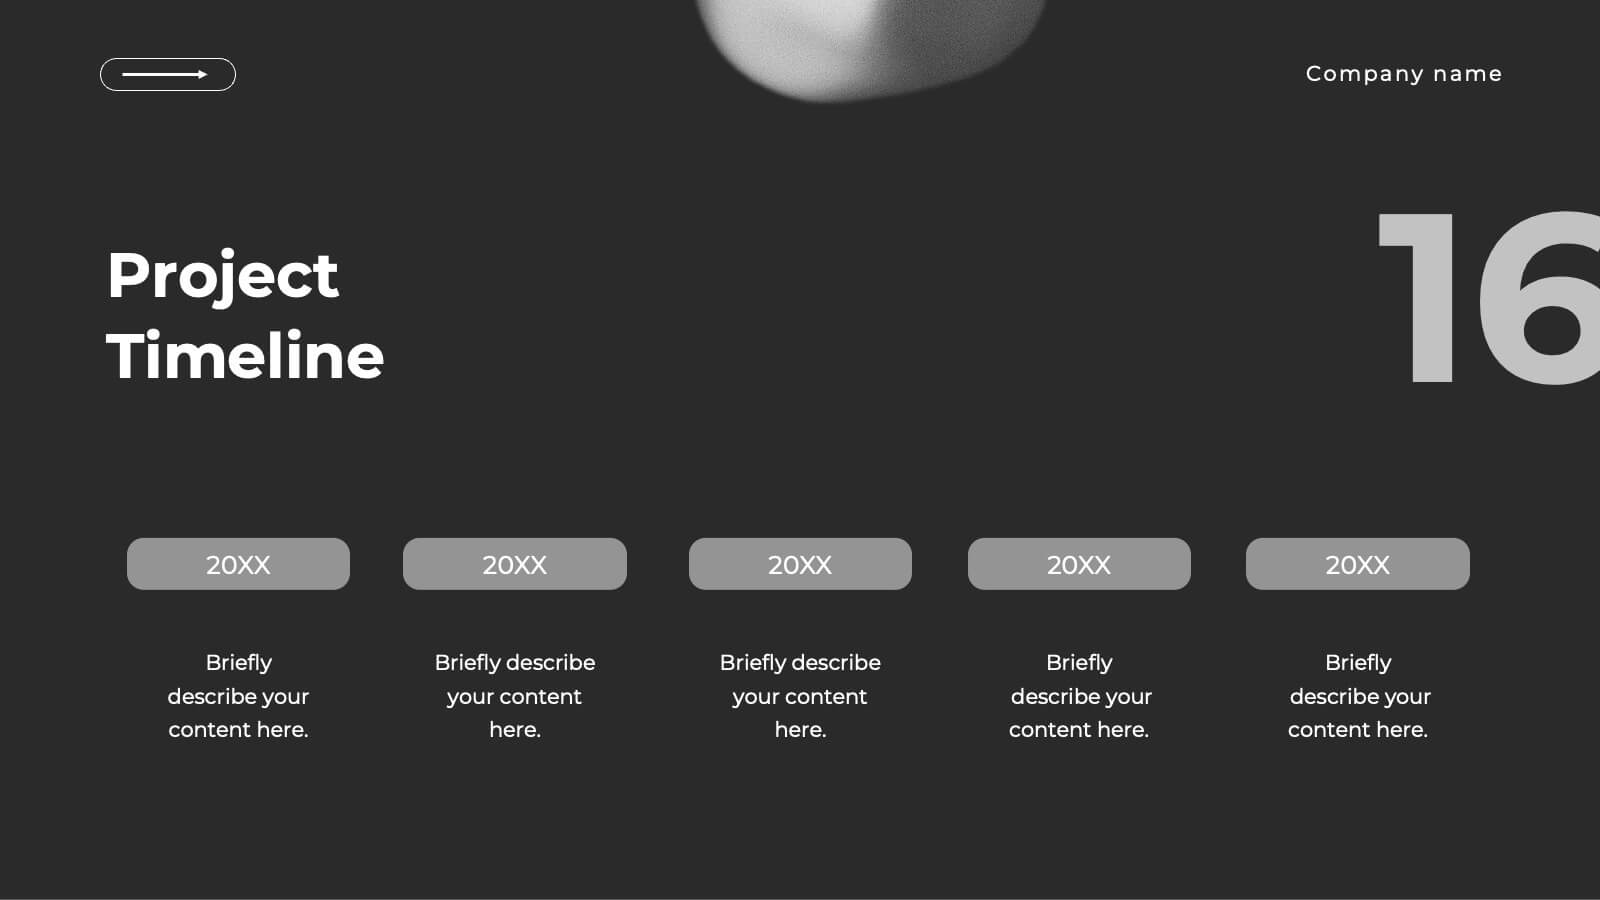
Realm UX UI Design Pitch Deck Presentation
Present your UX/UI design process with this sleek and modern design template! It covers everything from concept development to wireframes, prototypes, design iterations, and final design presentation. Fully customizable and compatible with PowerPoint, Keynote, and Google Slides, it’s perfect for design teams and professionals looking to showcase their creative process effectively.


8 diapositivas
Project Stakeholder Mapping Presentation
Visualize the impact and influence of different stakeholder groups with our Project Stakeholder Mapping Presentation template. This tool offers a clear graphical representation to guide project managers in understanding stakeholder dynamics, ensuring effective engagement and strategic decision-making. Compatible with PowerPoint, Keynote, and Google Slides.


26 diapositivas
Navigating Freelance and Flexible Work Presentation
Take control of your career with this insightful presentation on navigating freelance and flexible work. Covering key topics like client management, productivity strategies, income stability, and remote work tools, this template helps you present a clear roadmap to success. Fully customizable and compatible with PowerPoint, Keynote, and Google Slides for a seamless experience.

22 diapositivas
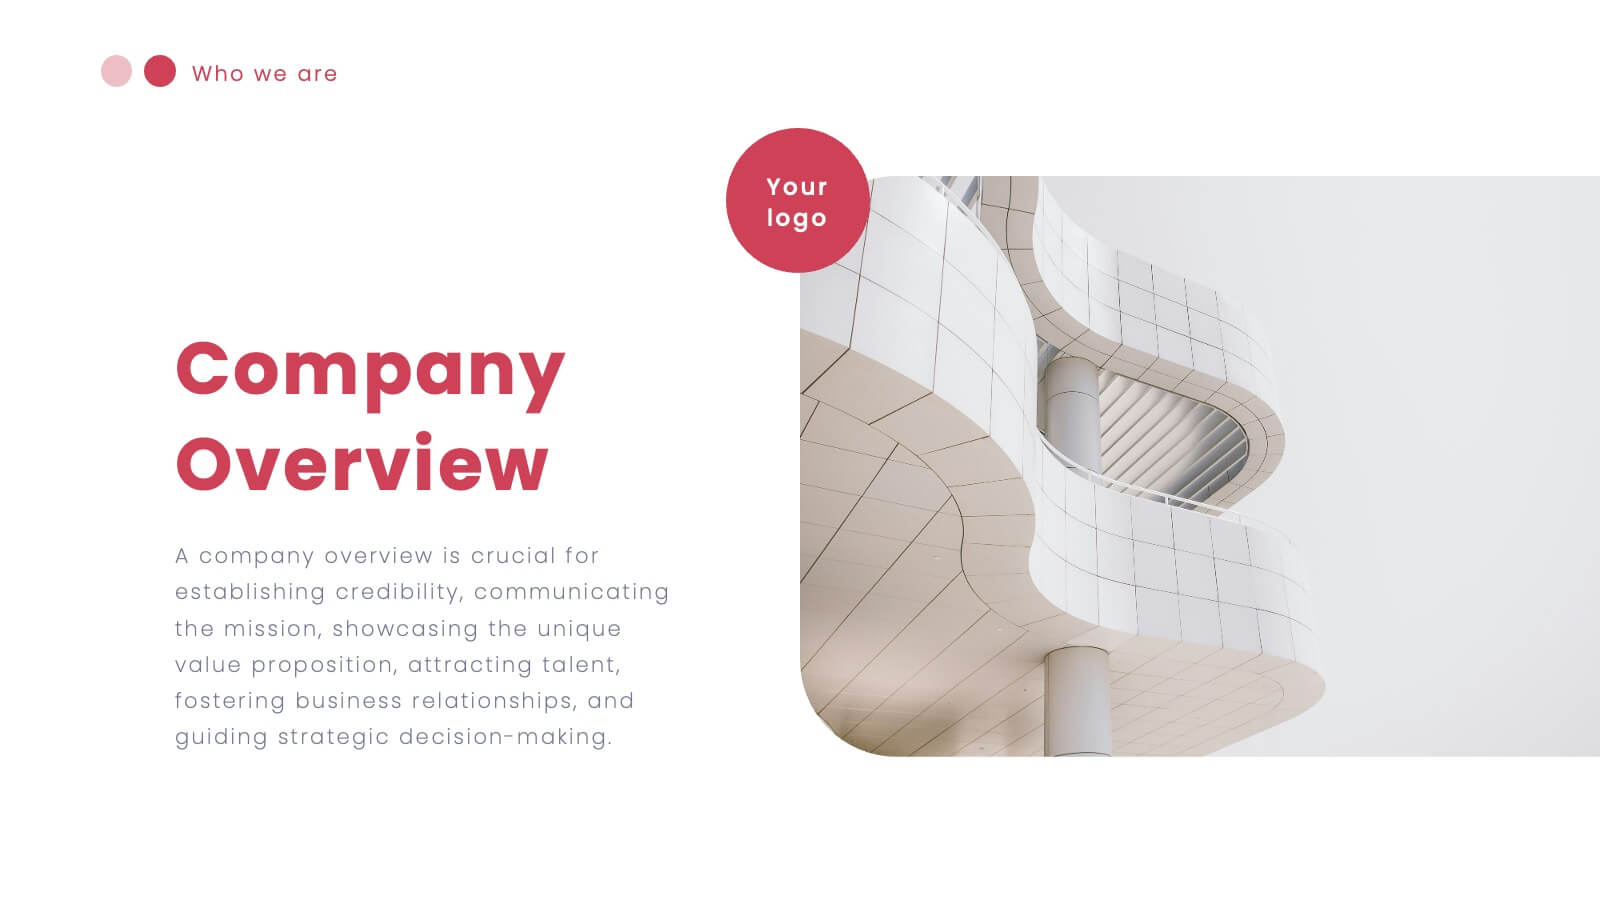
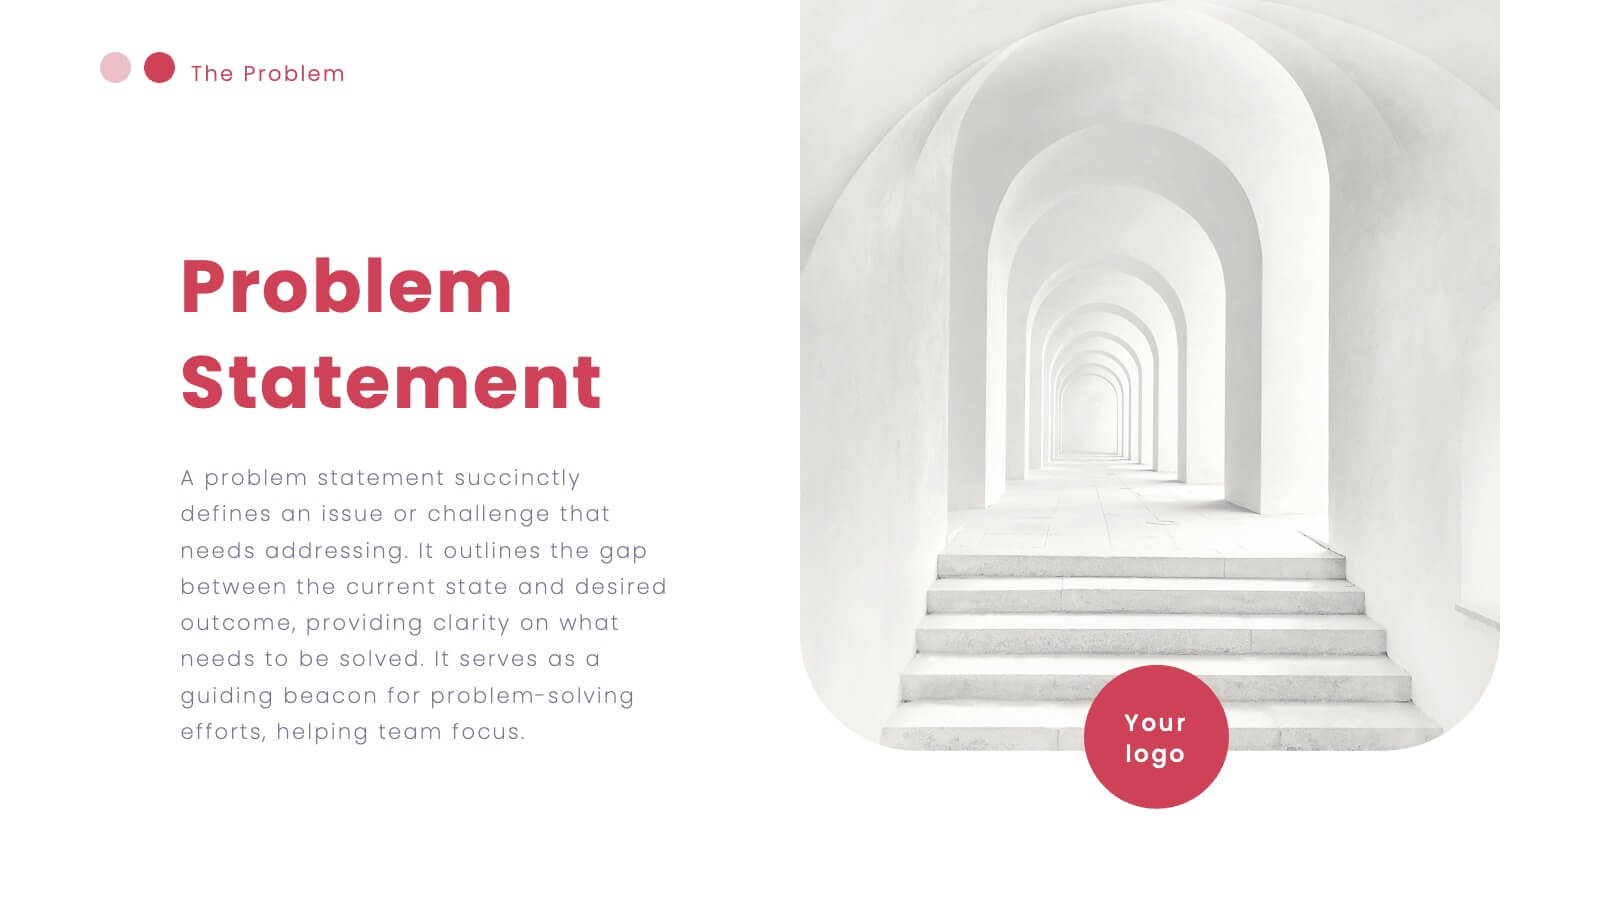
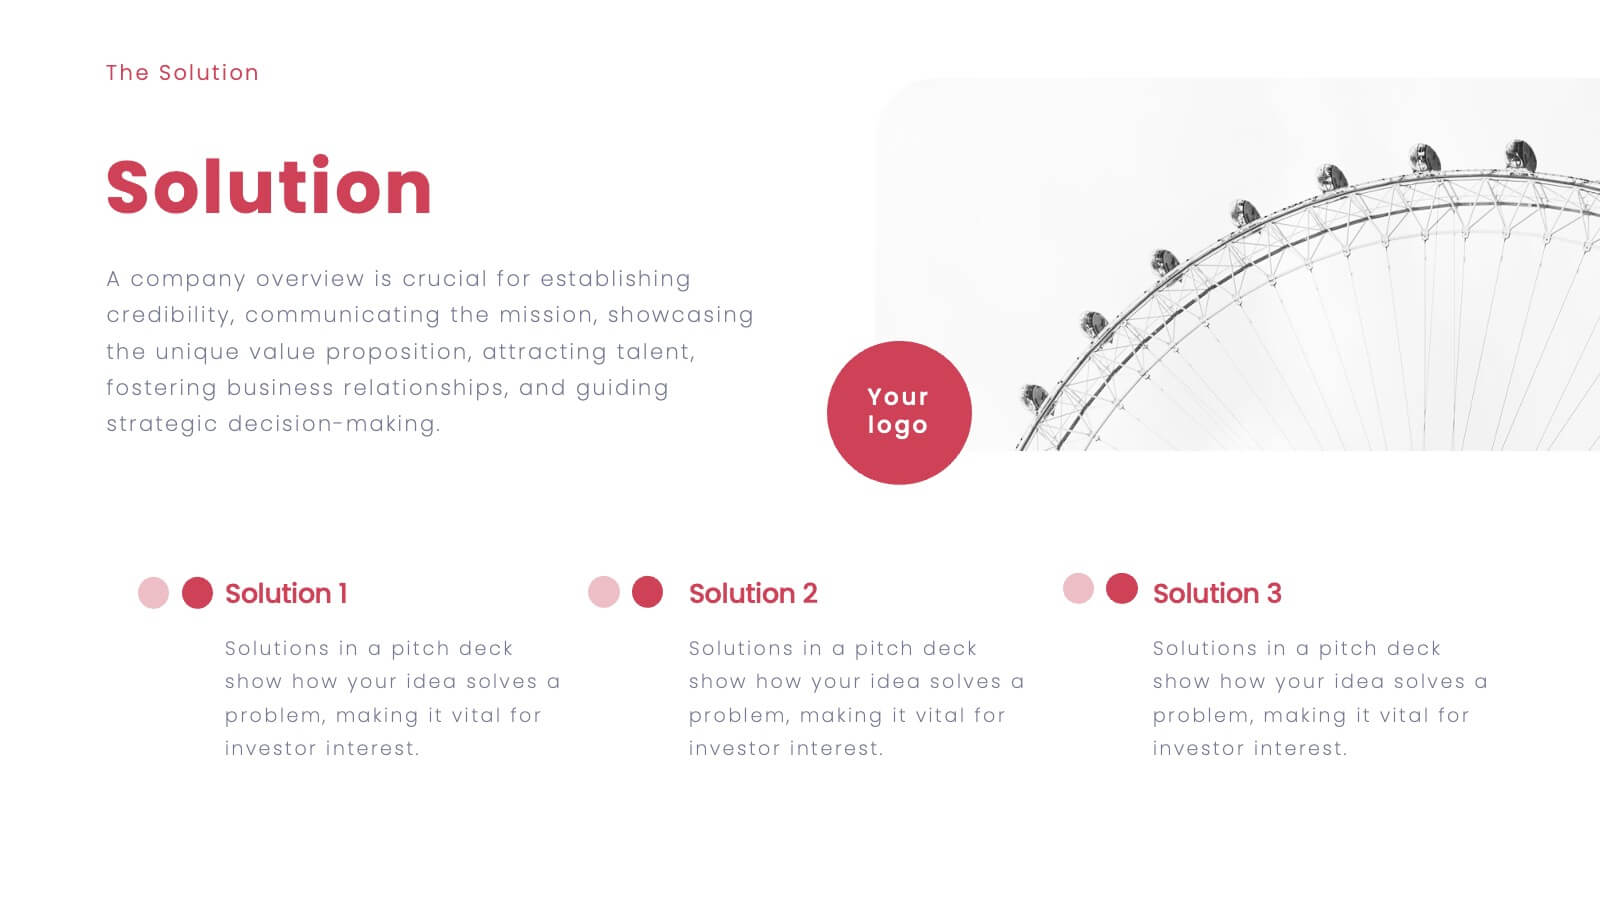
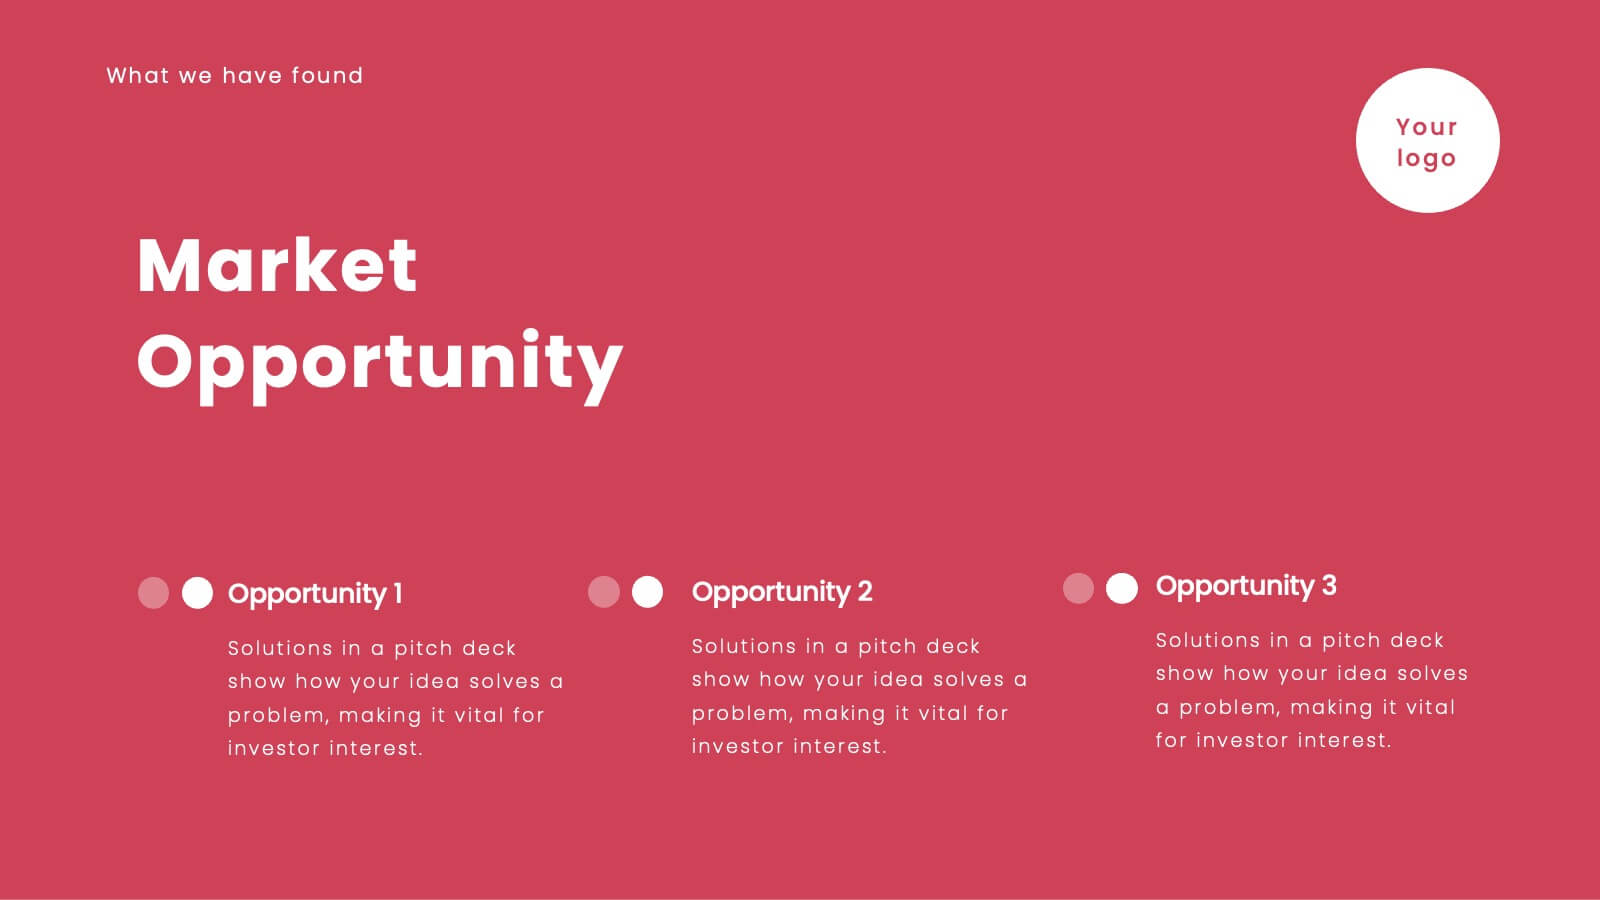
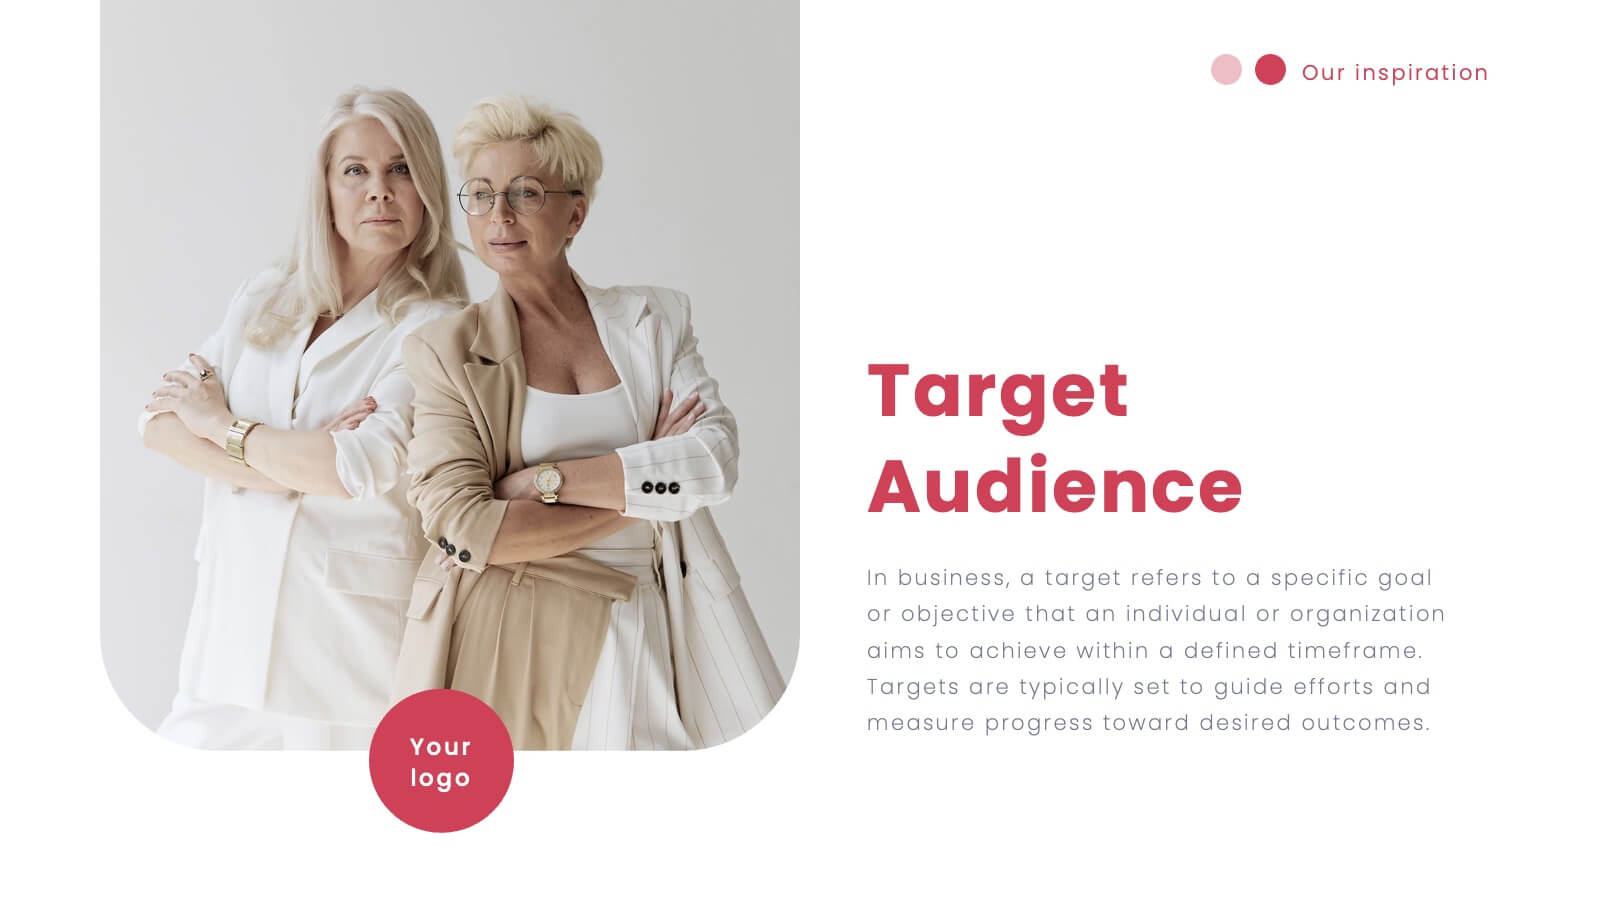
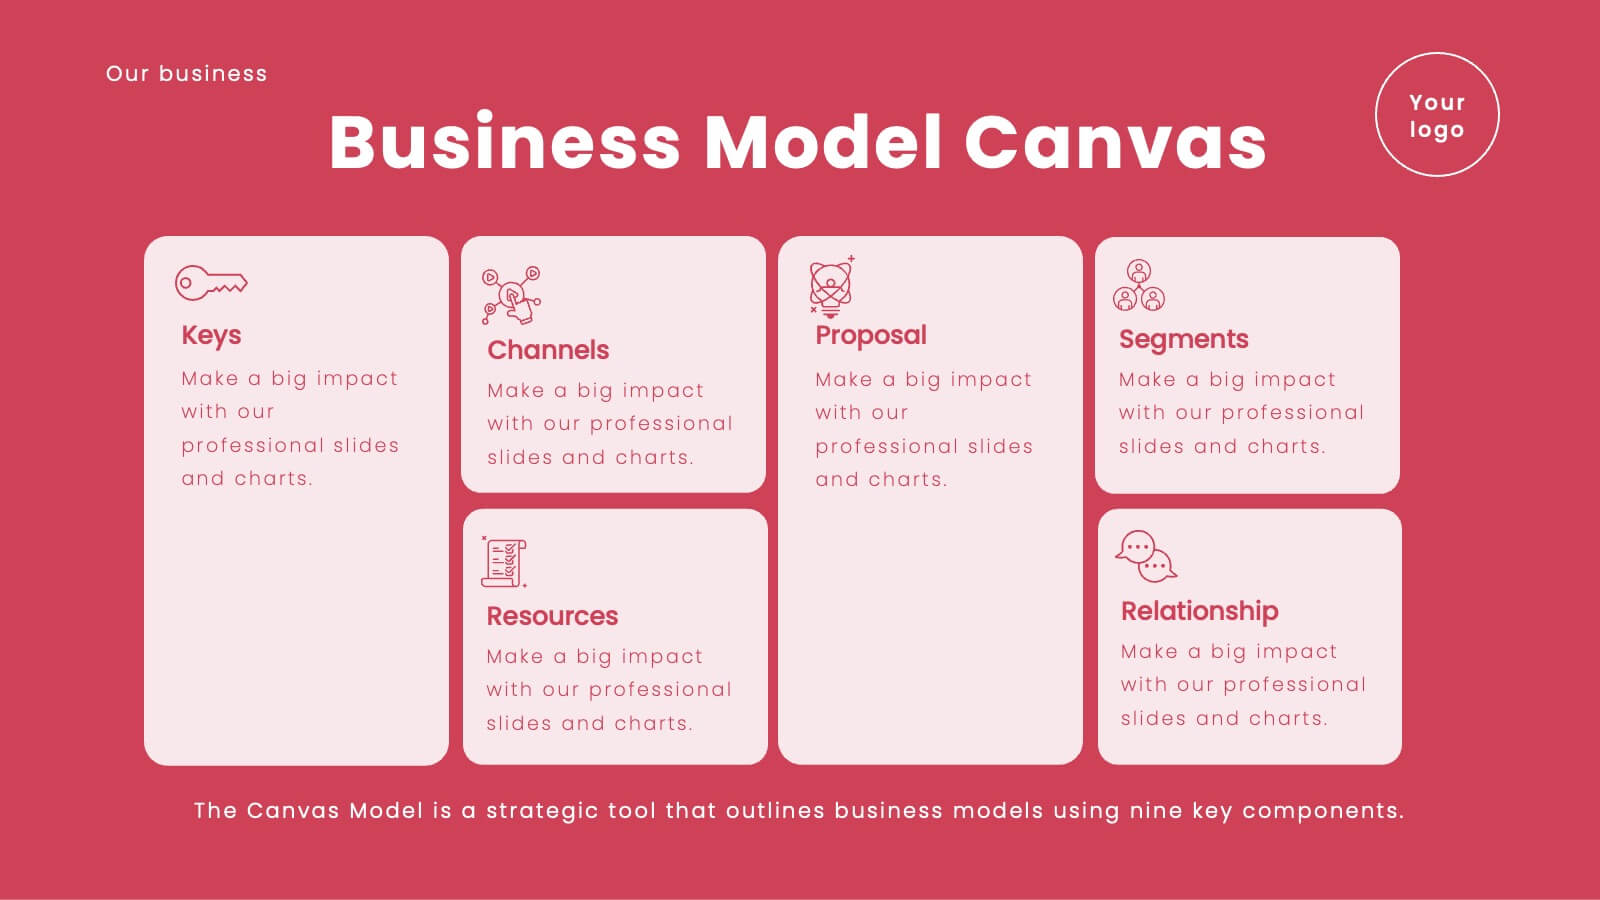
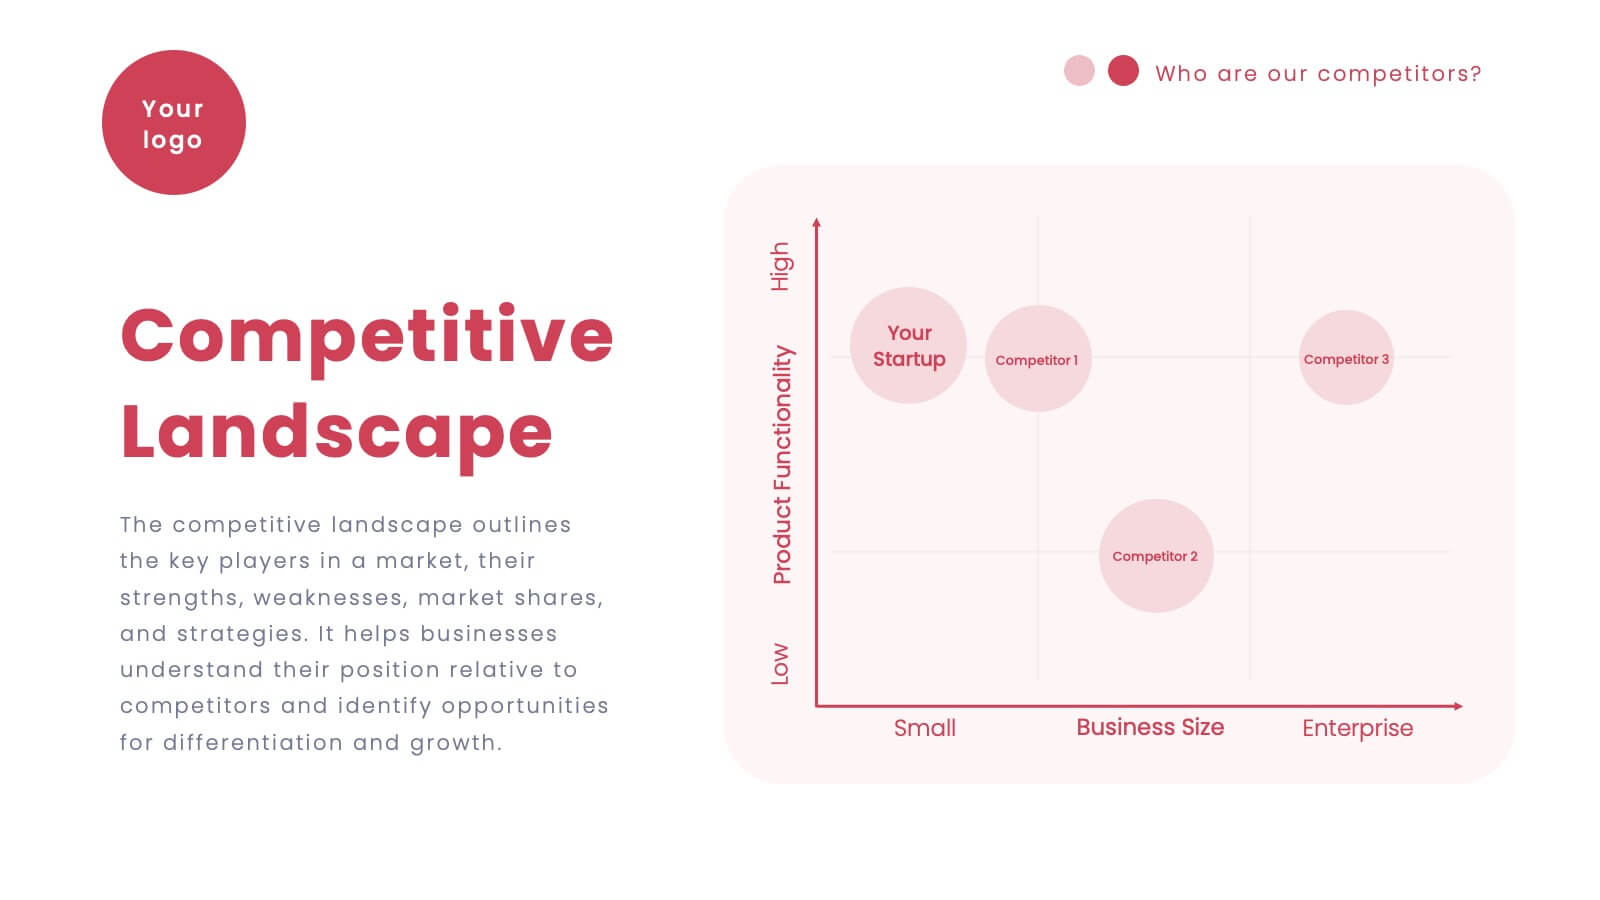
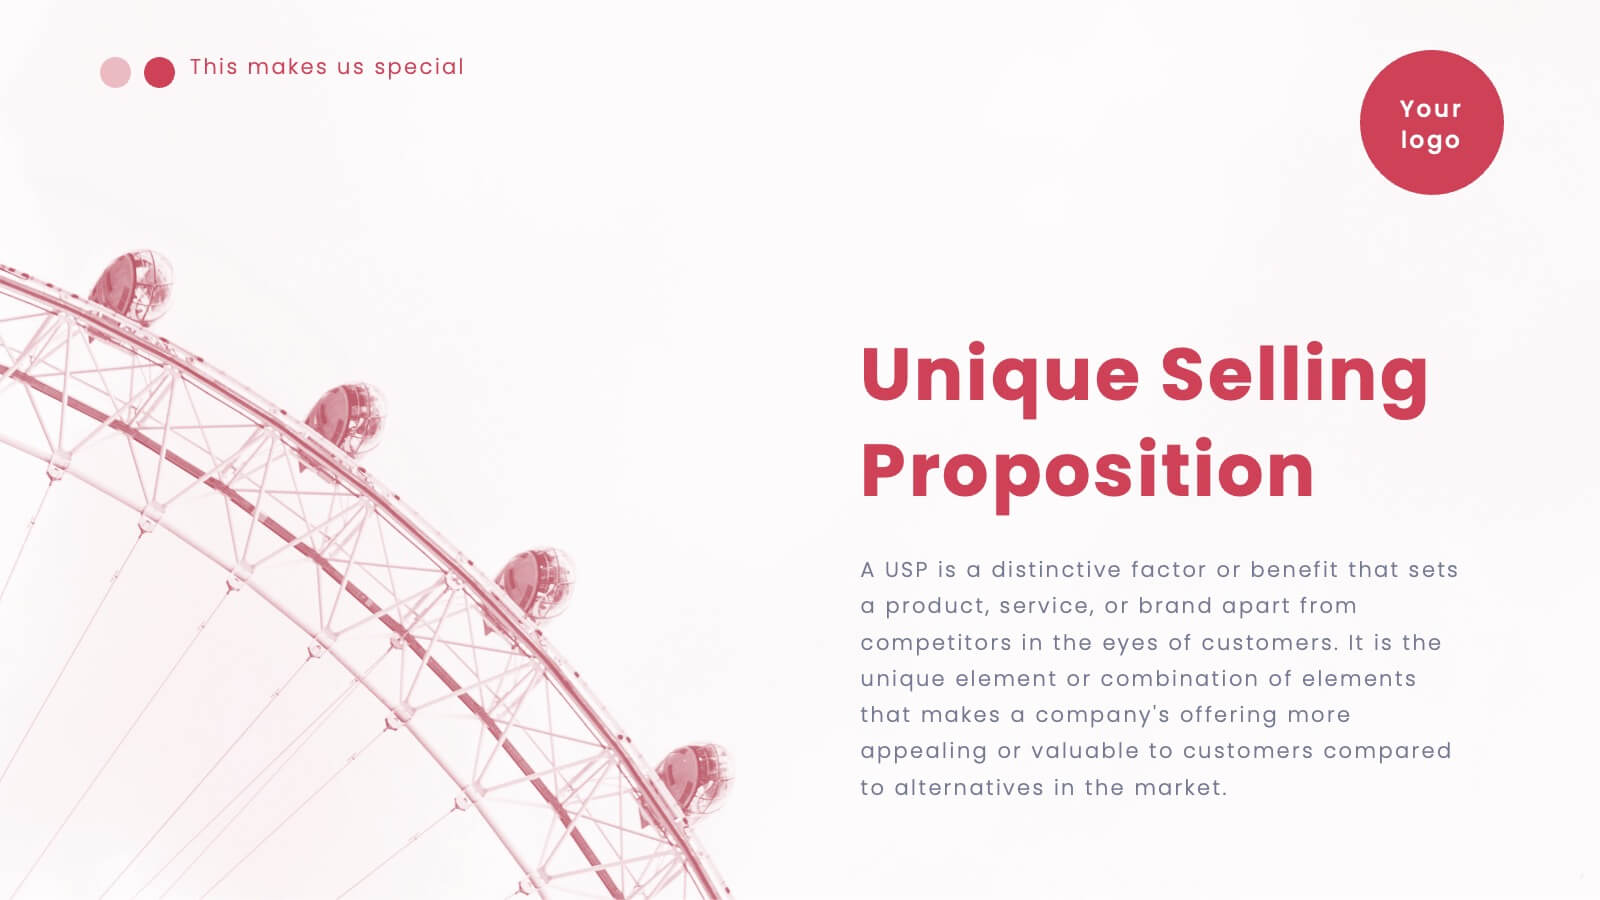
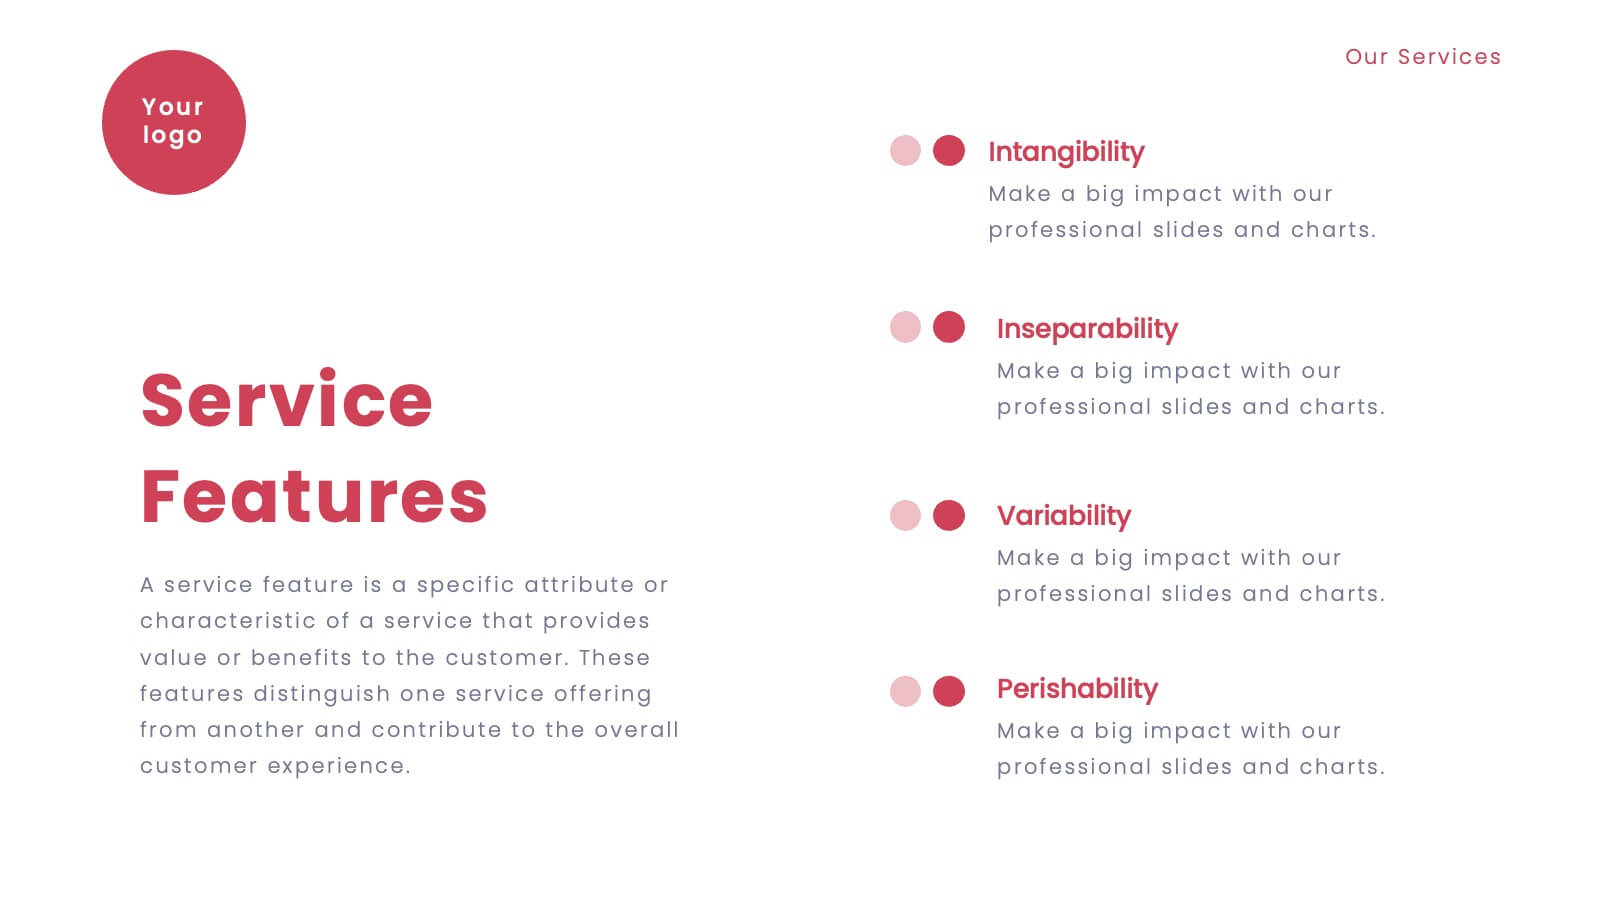
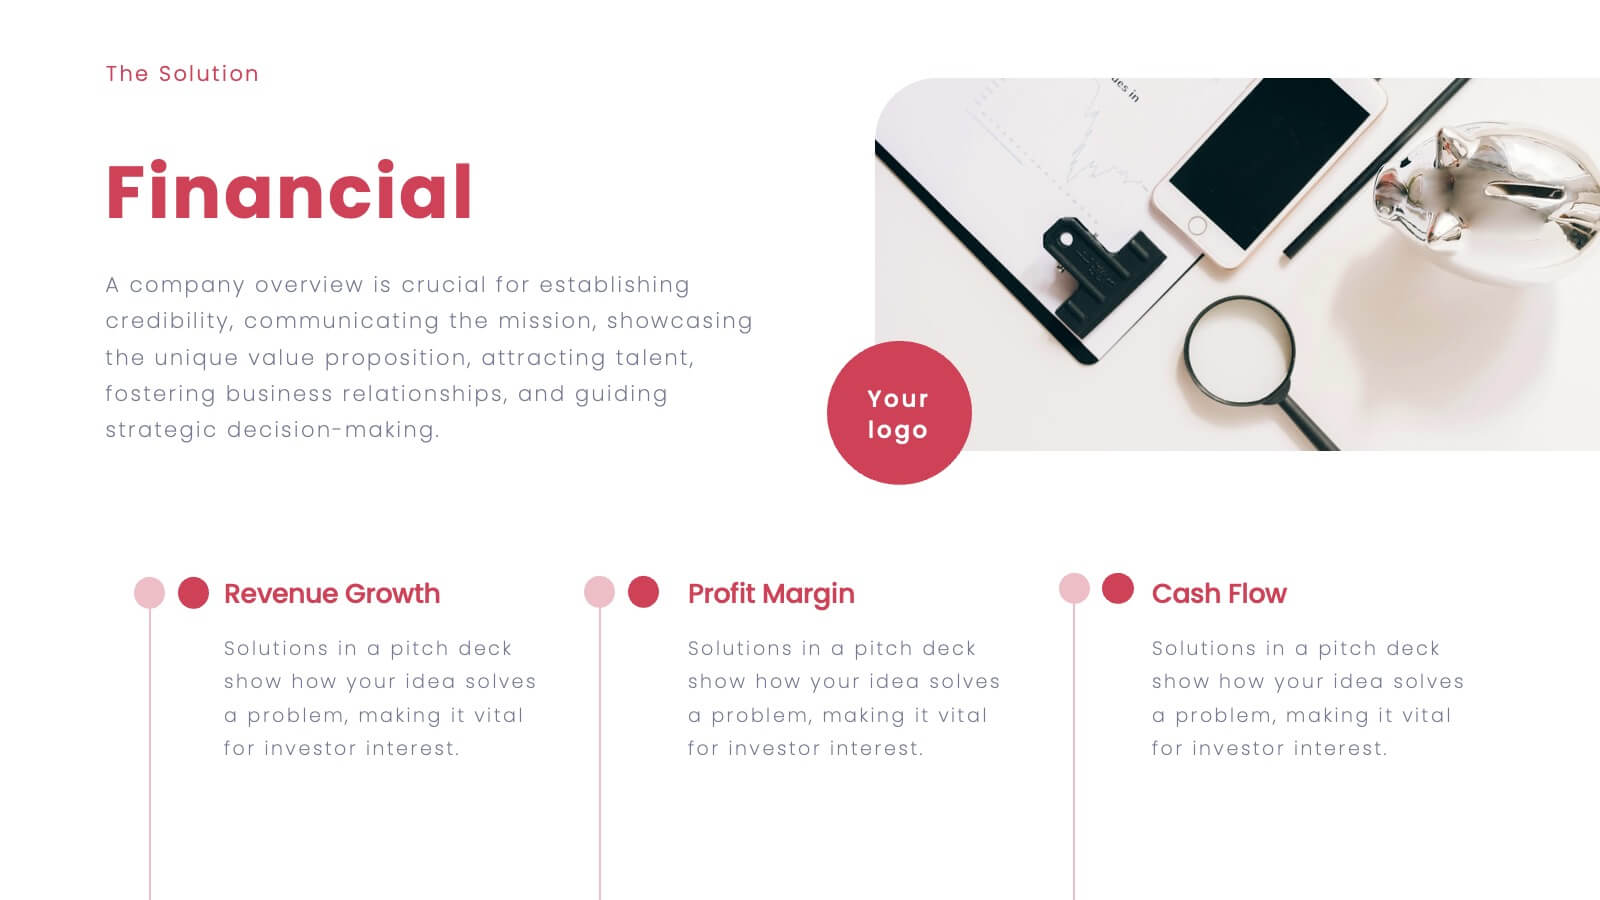
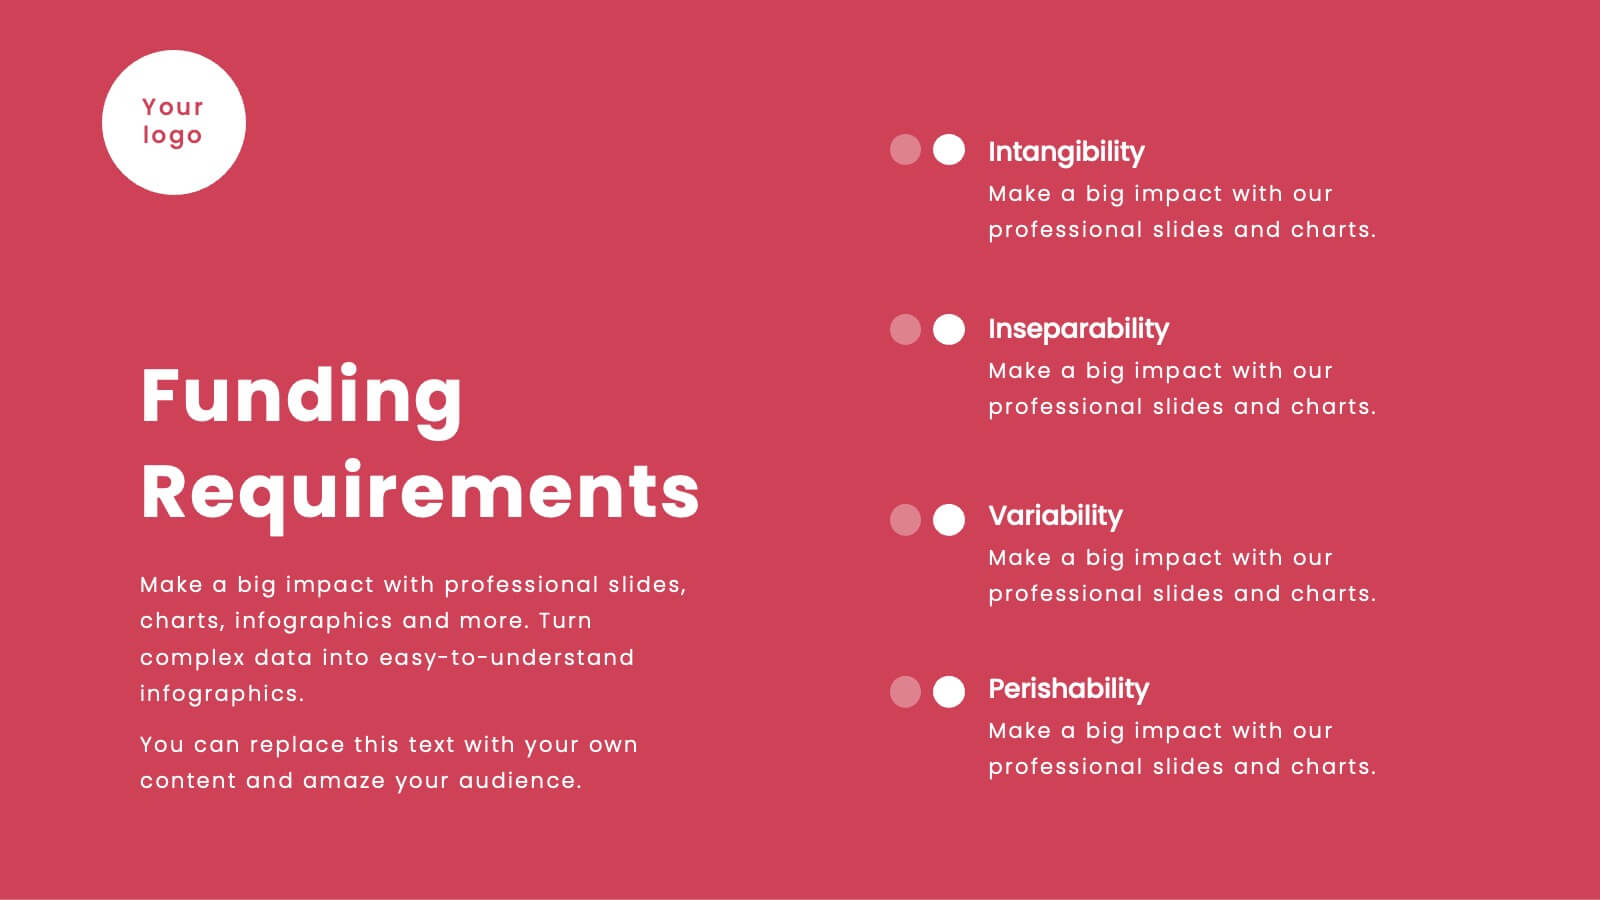
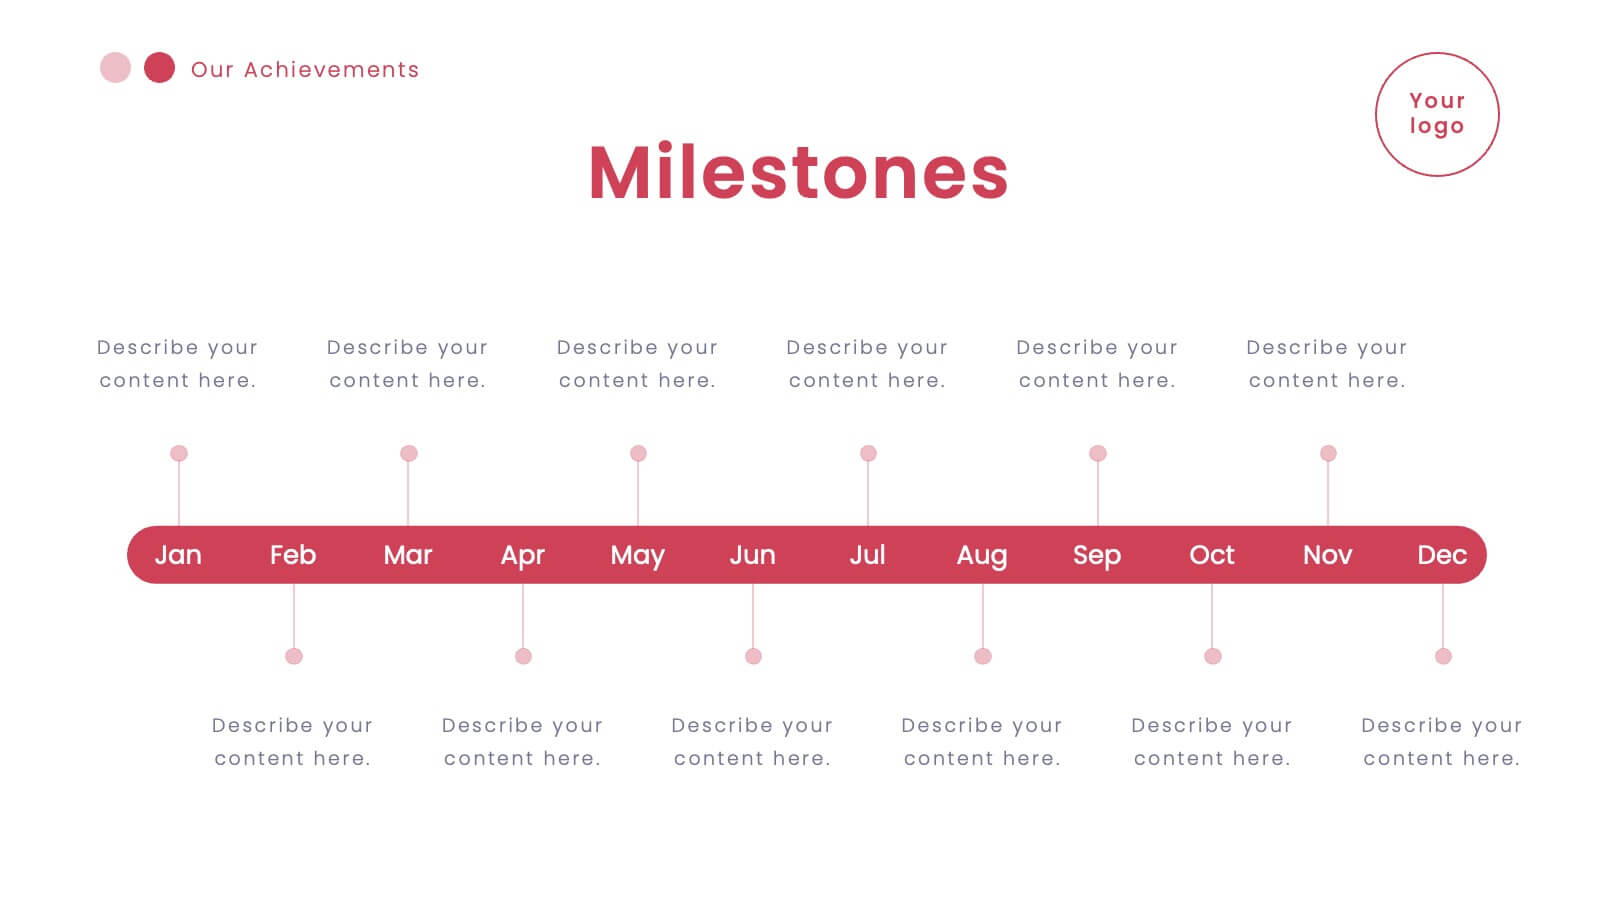
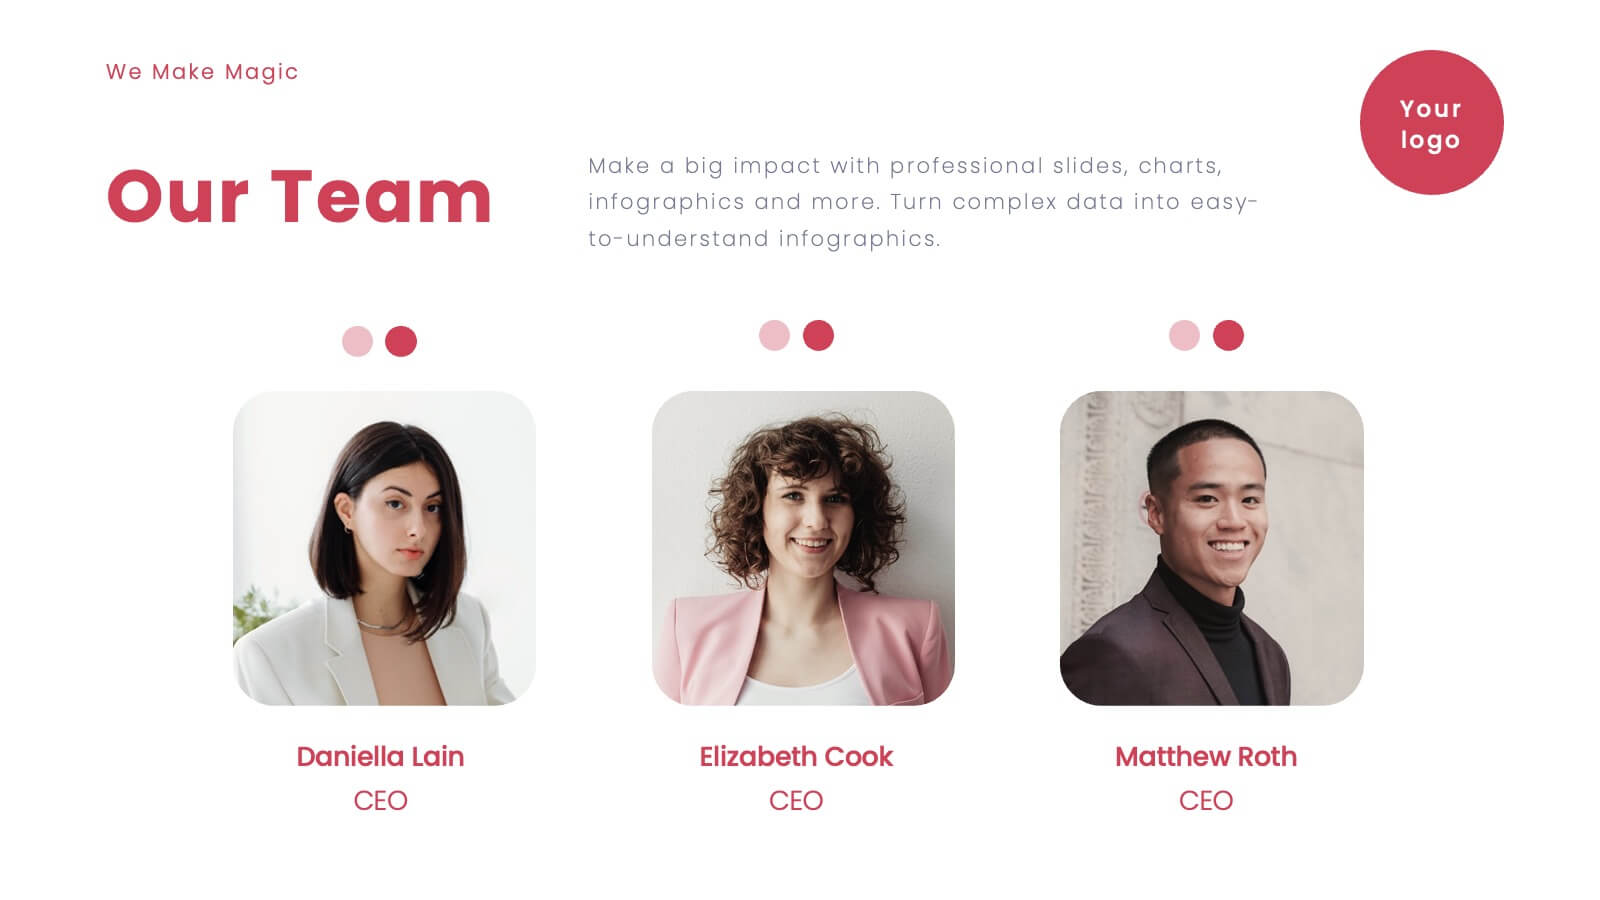
Vortex Startup Pitch Deck Presentation
Launch your ideas into action with this vibrant red pitch deck template, designed to captivate and inform potential investors. It covers everything from company overview to financials and market strategy, ensuring your vision is communicated effectively. Compatible with PowerPoint, Google Slides, and Keynote, this template is perfect for startups seeking to impress and engage.


2 diapositivas
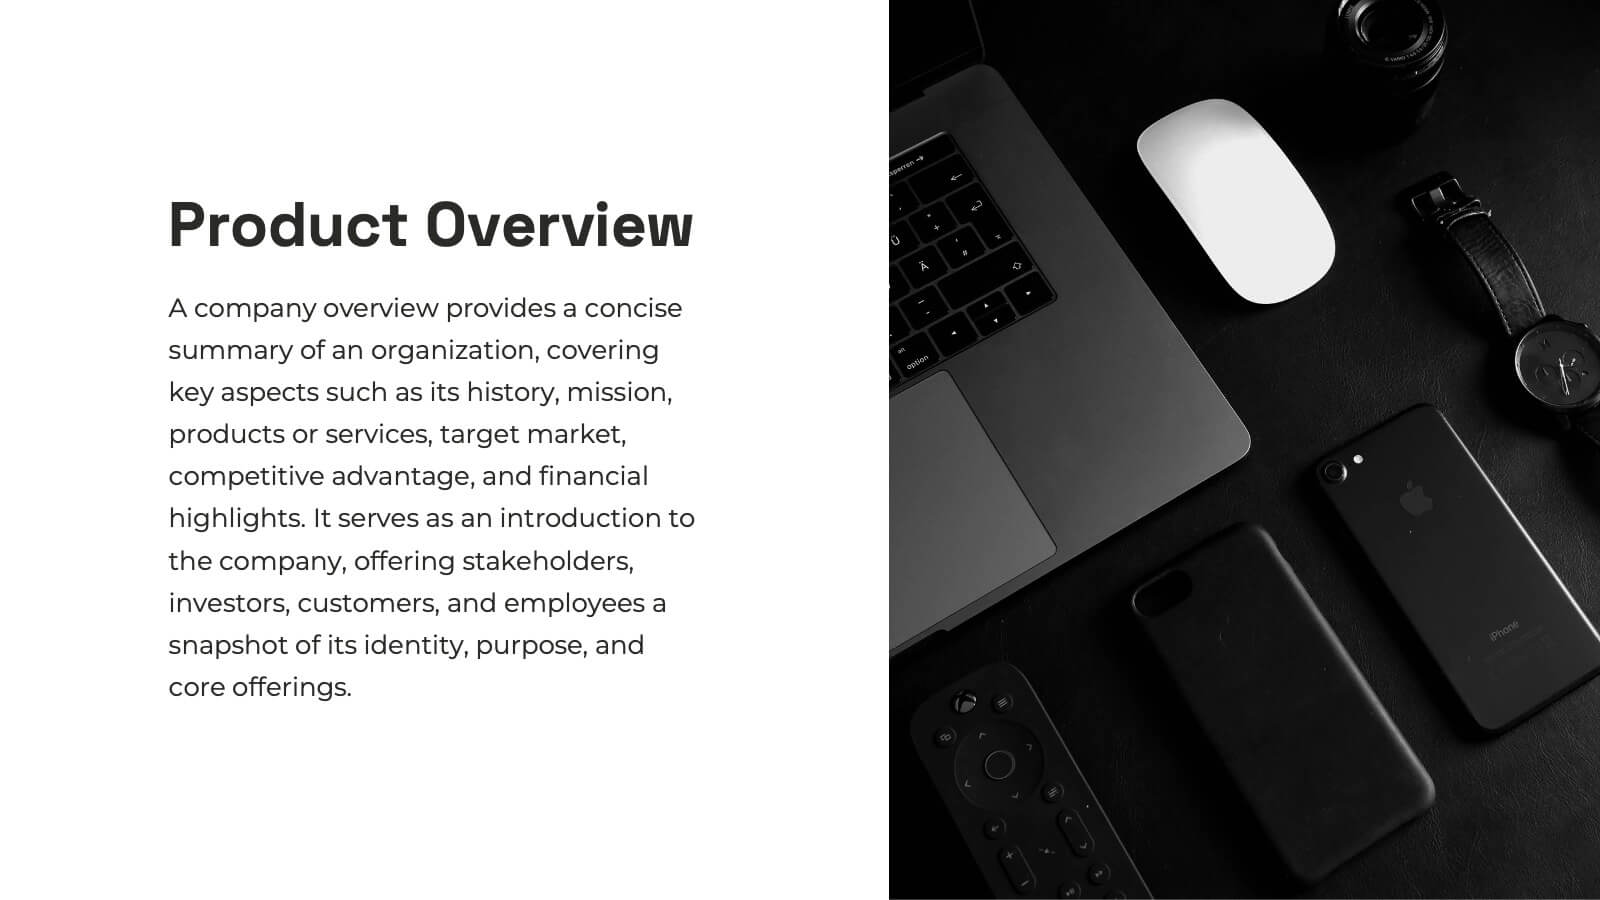
Business Self-Introduction Presentation
Introduce yourself with confidence using this Business Self-Introduction Slide. Perfect for networking, team meetings, and professional presentations, this template features a modern layout with a dynamic photo cutout, engaging visuals, and structured text areas. Fully customizable for PowerPoint, Keynote, and Google Slides, you can adjust colors, fonts, and content to reflect your personal or business identity.


4 diapositivas
User Base by Demographic Factors
Understand your audience at a glance with the User Base by Demographic Factors Presentation. This visual template displays gender-based or group-based demographic insights alongside bar chart statistics and percentages, making it ideal for marketing reports, pitch decks, or user research presentations. Fully customizable in PowerPoint, Keynote, and Google Slides.


6 diapositivas
Employee Welcome and Orientation Guide Presentation
Welcome new hires with clarity using the Employee Welcome and Orientation Guide Presentation. Featuring a timeline-style layout with flag icons, this design helps outline key onboarding stages—from introductions and training to policies and first-week expectations. Easy to customize in Canva, PowerPoint, Keynote, or Google Slides for a smooth employee experience.