


Características


¿Tienes alguna pregunta?
Recomendar


4 diapositivas
Green Initiative Report Deck Presentation
Show your sustainability story with a modern, eco-inspired presentation built to highlight green initiatives, progress reports, and environmental goals. Its clean layout makes data and insights easy to follow while maintaining a professional tone. Fully customizable and compatible with PowerPoint, Keynote, and Google Slides for effortless presentation design.


6 diapositivas
Internal Communication Strategy Presentation
Bring your message to life with a dynamic slide that turns communication goals into a simple, engaging visual story. This presentation highlights key steps, channels, and team roles to help audiences understand how information flows across an organization. Clean icons and structured layouts make every point clear and memorable. Fully compatible with PowerPoint, Keynote, and Google Slides.


5 diapositivas
Business Overview and Highlights Summary
Summarize your company’s key milestones with this Business Overview and Highlights Summary slide. Featuring a clean layout with a bold briefcase visual and four spotlight areas, it’s ideal for showcasing achievements. Fully editable in PowerPoint, Keynote, and Google Slides.


20 diapositivas
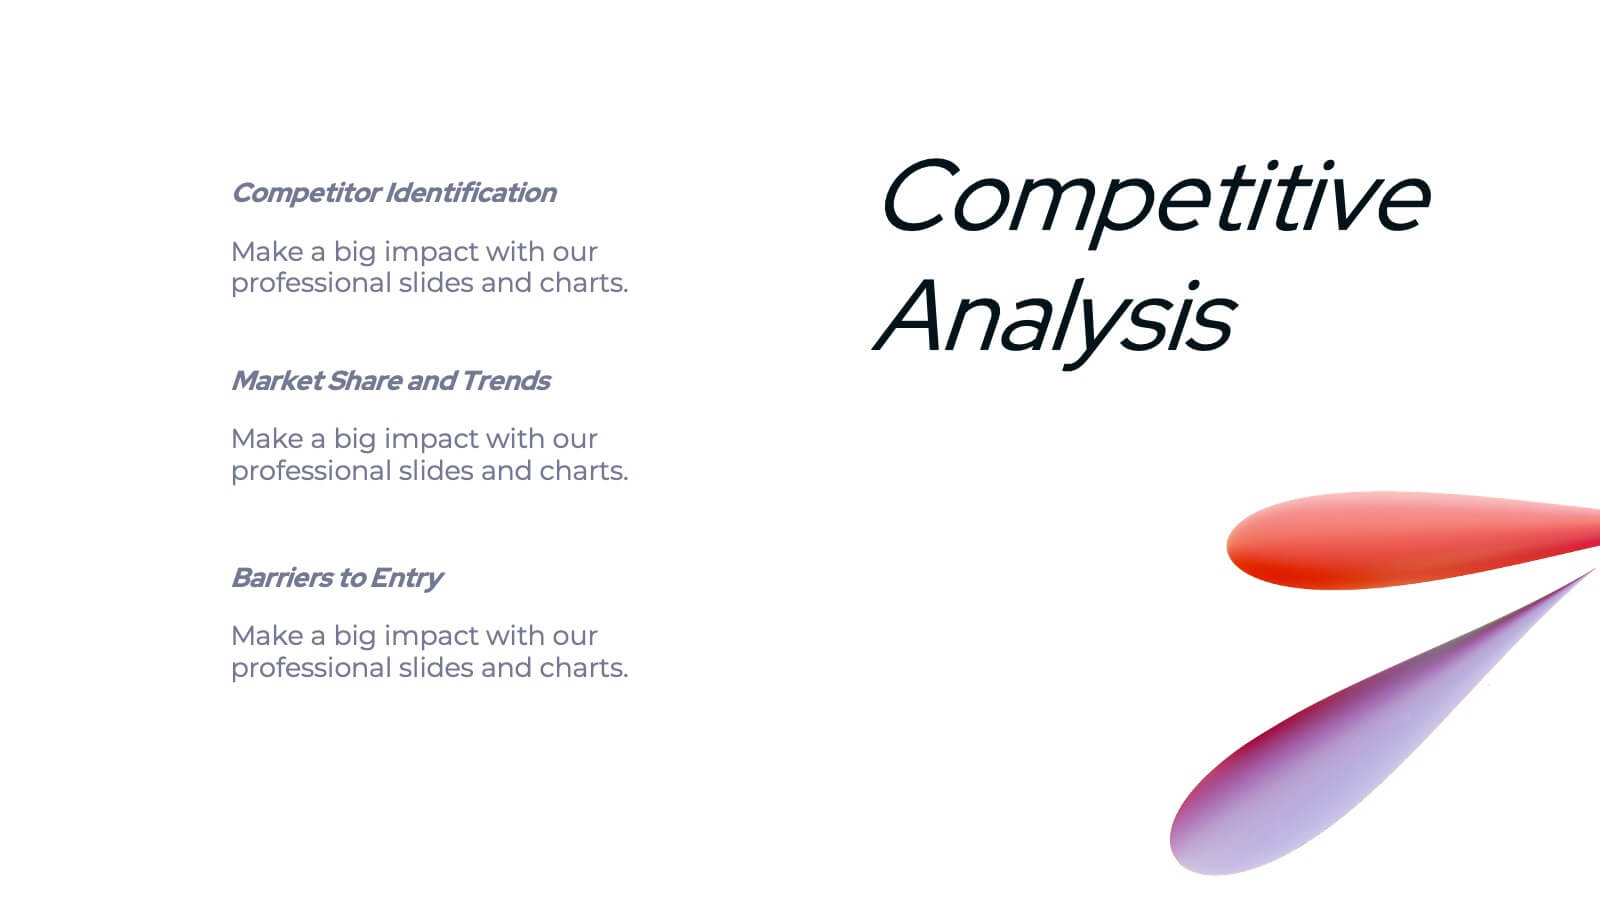
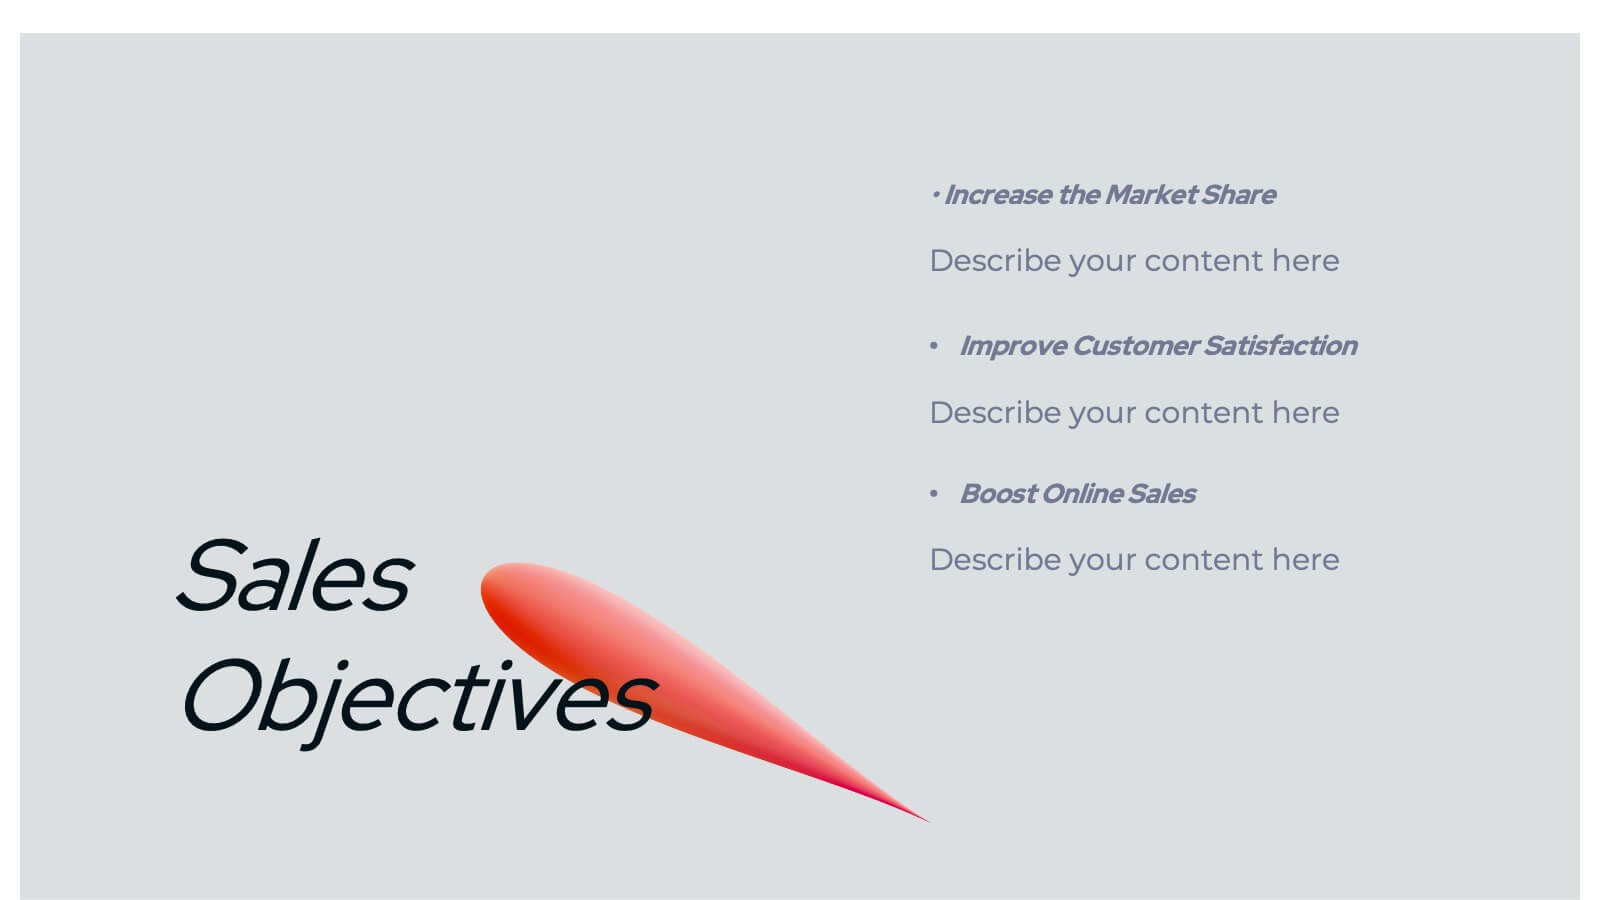
Spark Sales Performance Report Presentation
Deliver insights and strategies with this dynamic sales performance report presentation template. Featuring an elegant and modern design, it provides dedicated sections for agenda setting, company overview, service highlights, and customer value propositions. Present competitive analysis, sales objectives, and performance metrics with ease using clean, structured layouts. Visualize sales processes, team introductions, and pricing strategies through engaging, editable infographics and data slides. The template also includes areas for showcasing promotions, customer testimonials, future opportunities, and actionable next steps. Tailored for sales teams and managers, it offers a professional framework to review and strategize effectively. Fully customizable and compatible with PowerPoint, Google Slides, and Keynote, this template ensures seamless adaptation to your branding and needs. Impress your audience while highlighting achievements and paving the way for future growth!


21 diapositivas
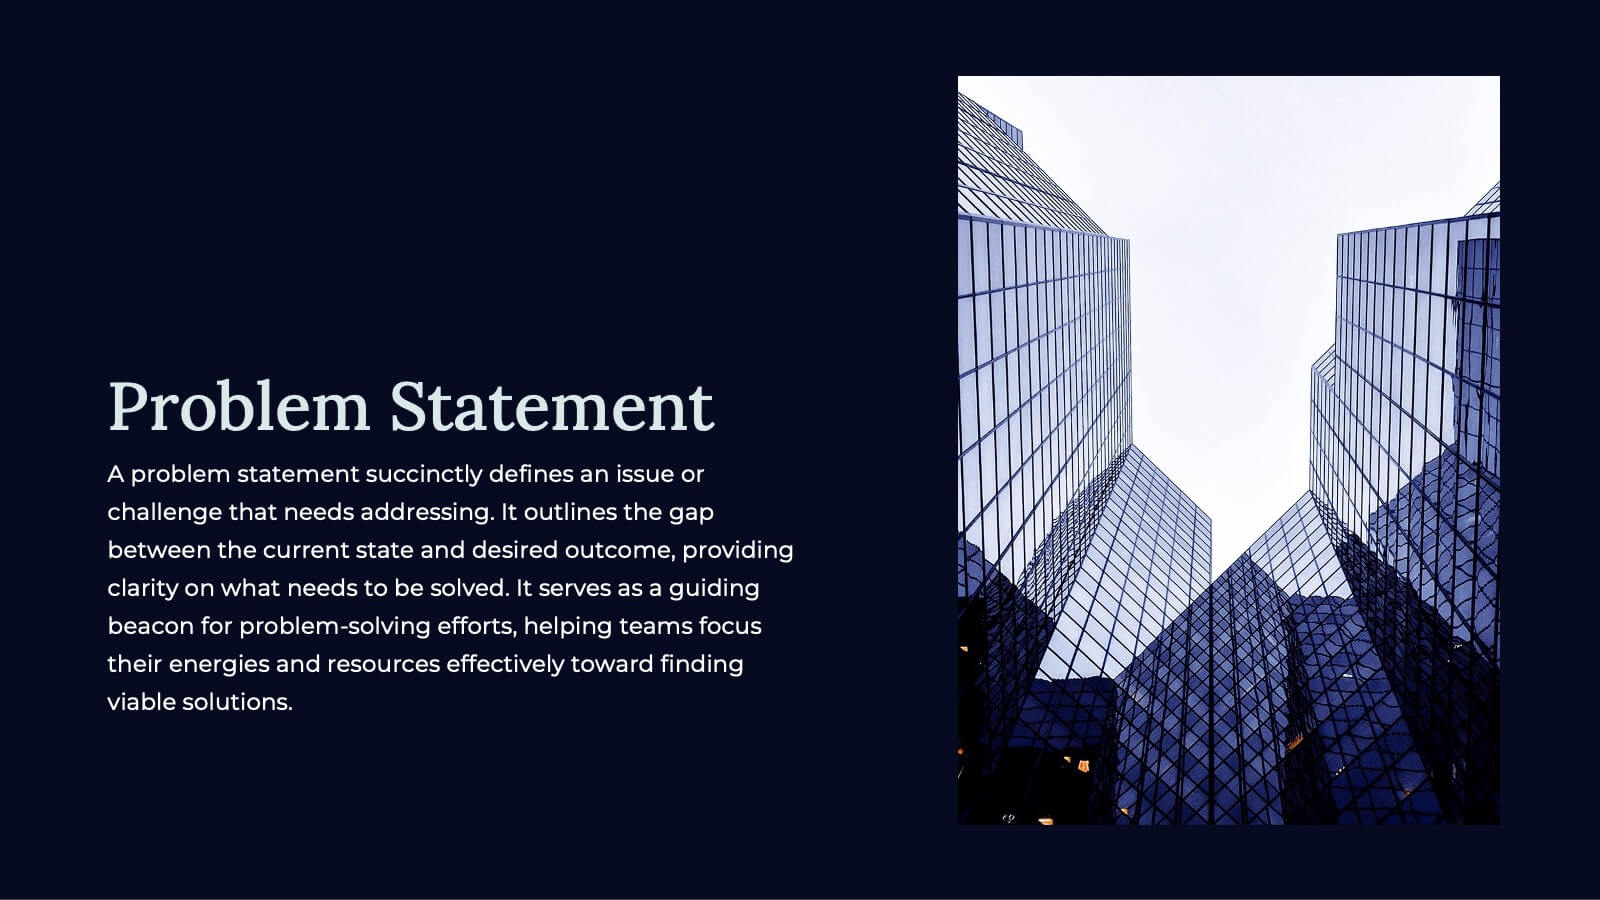
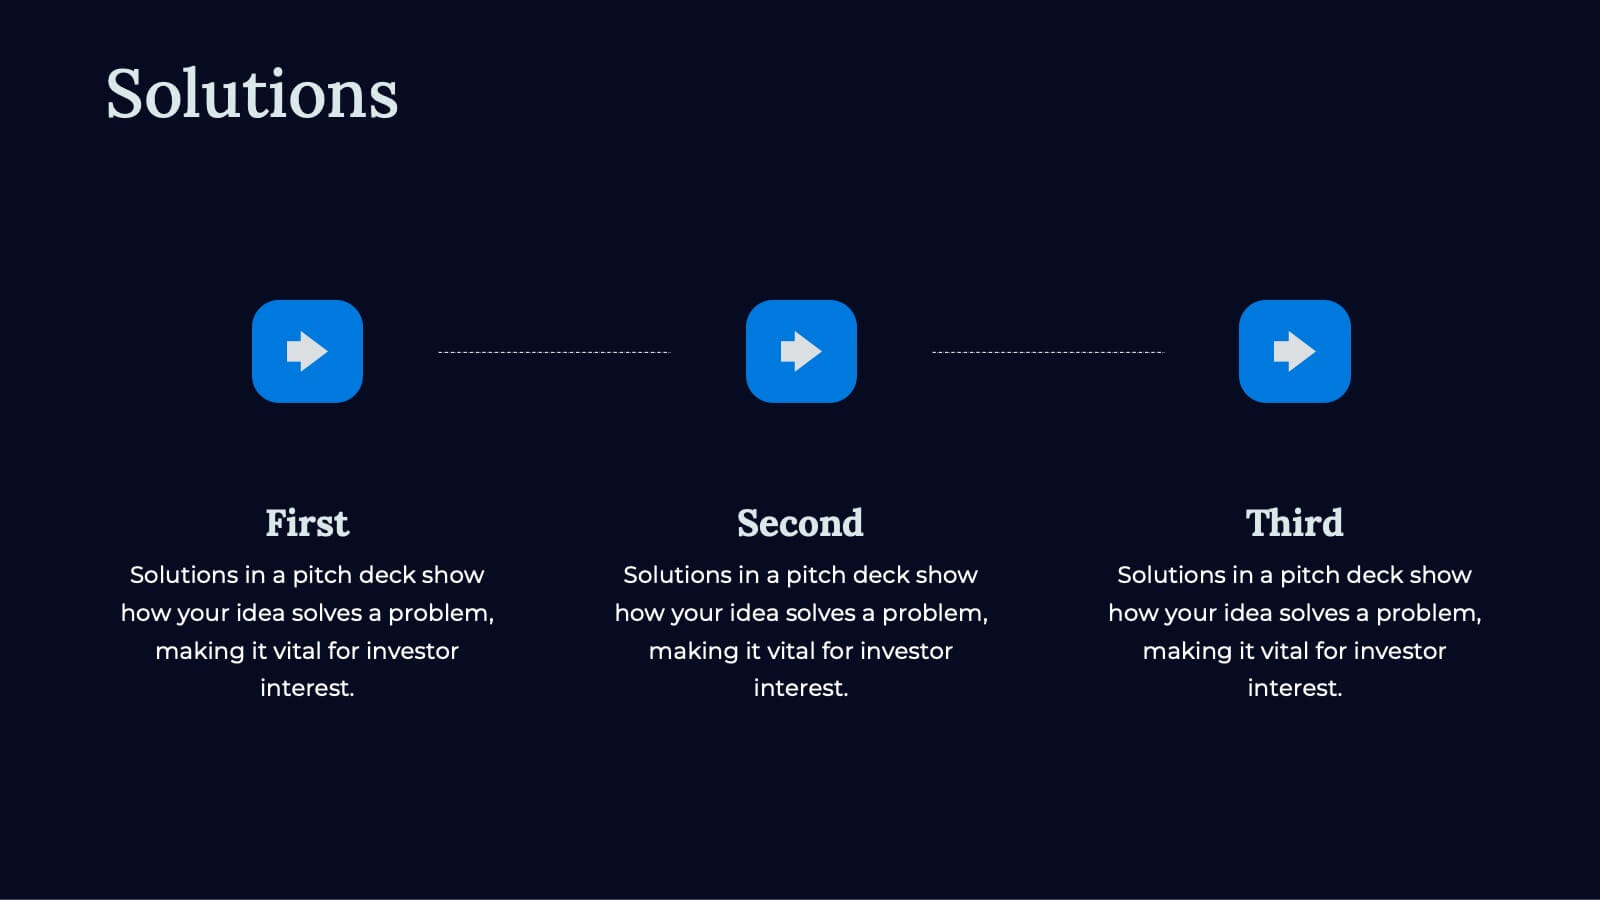
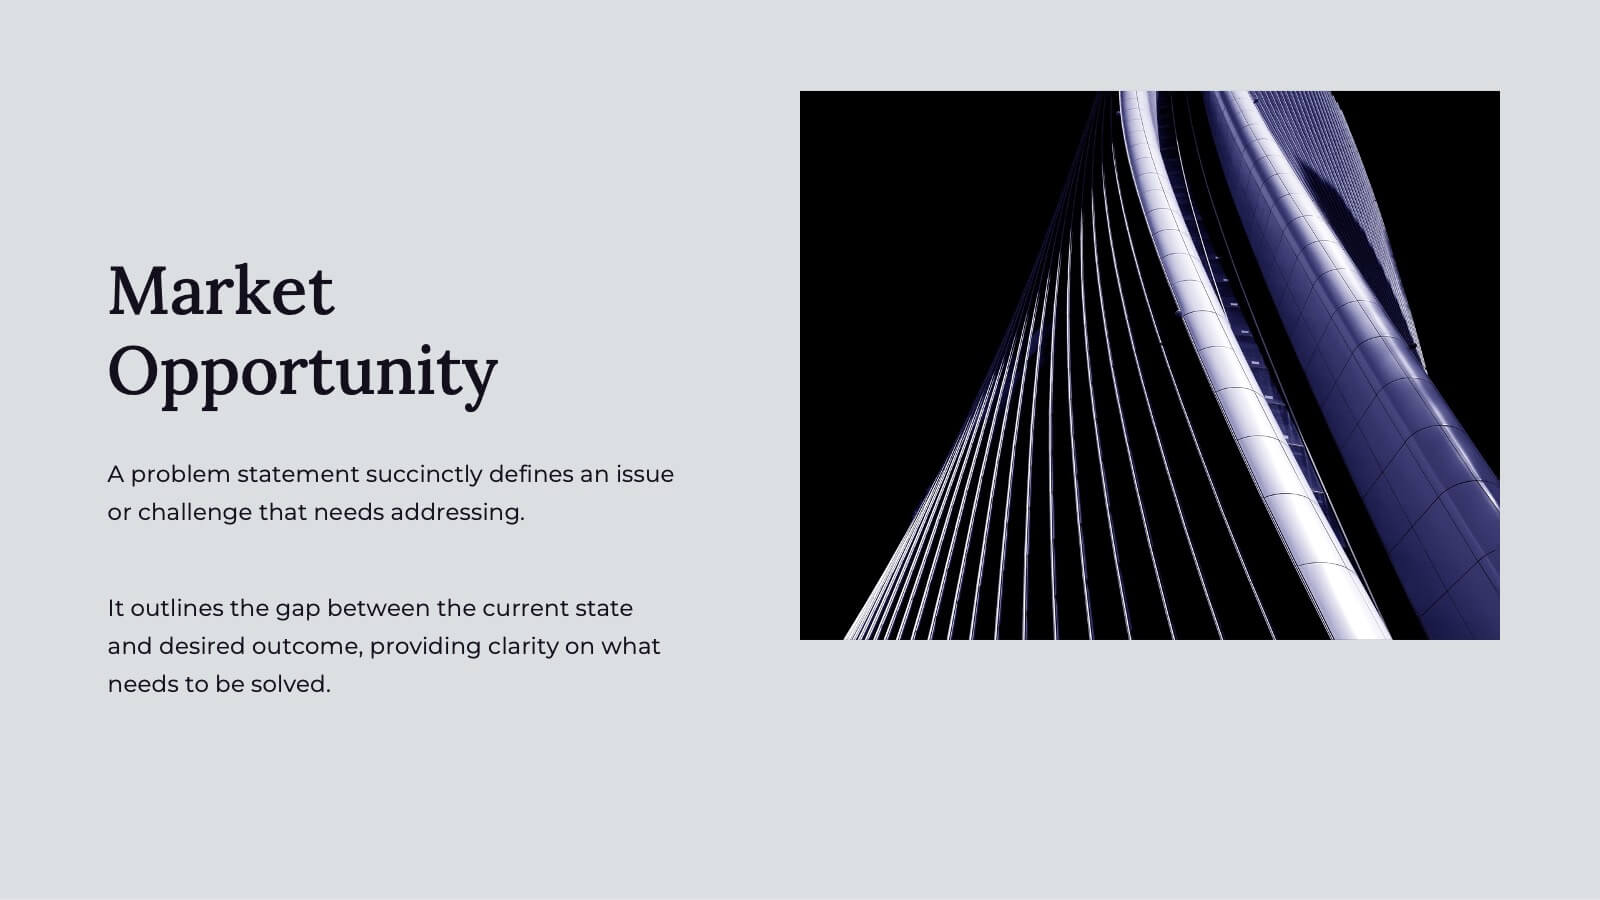
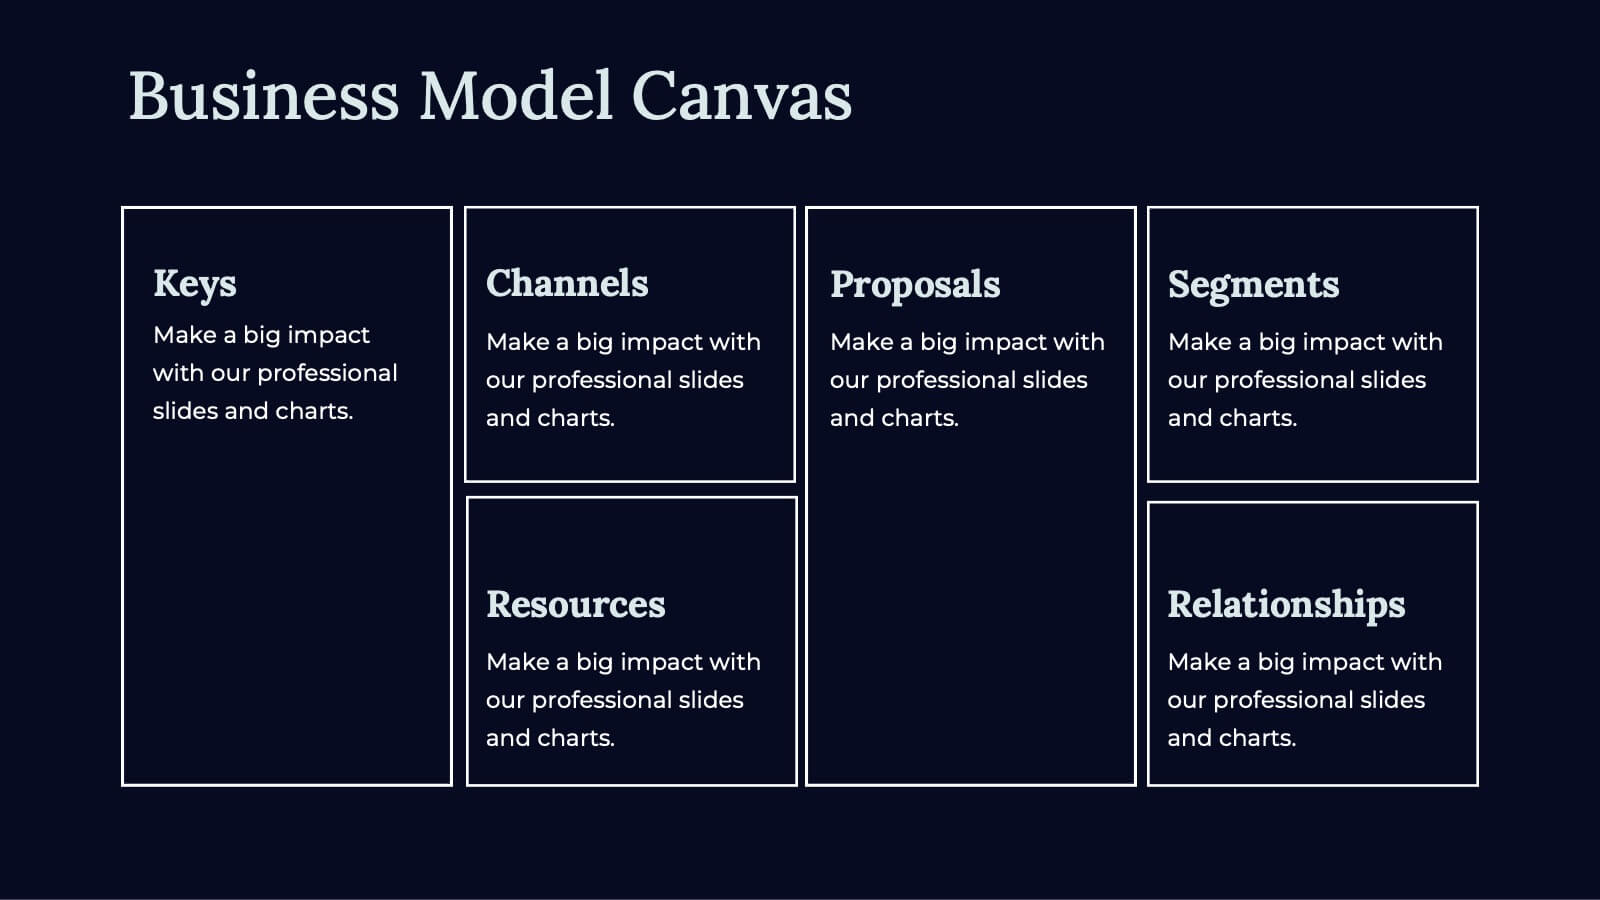
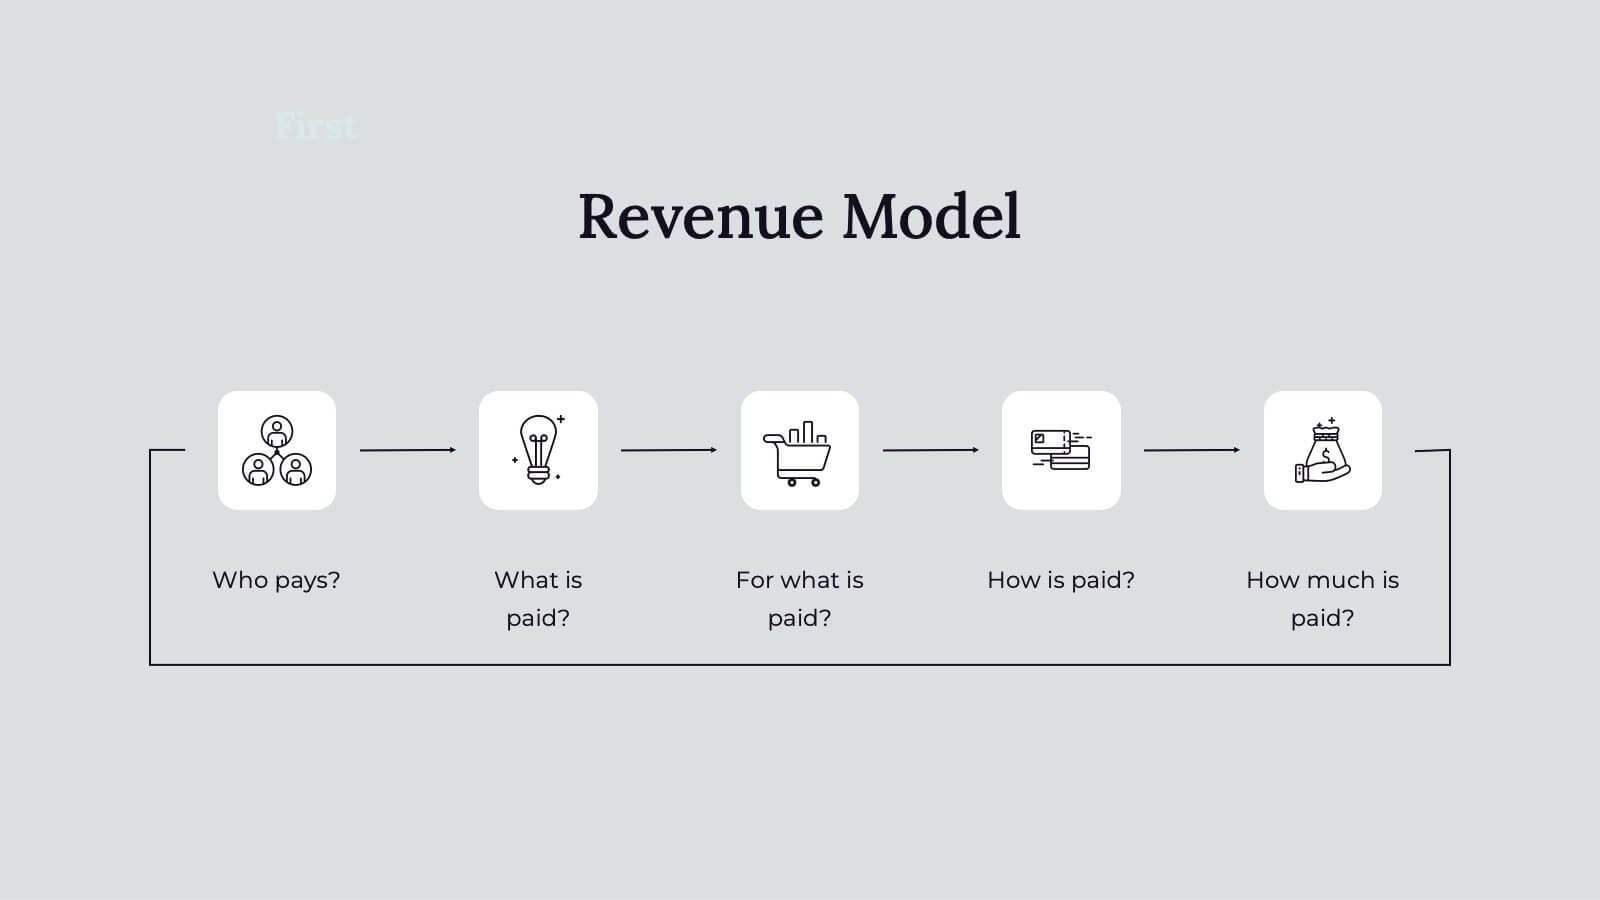
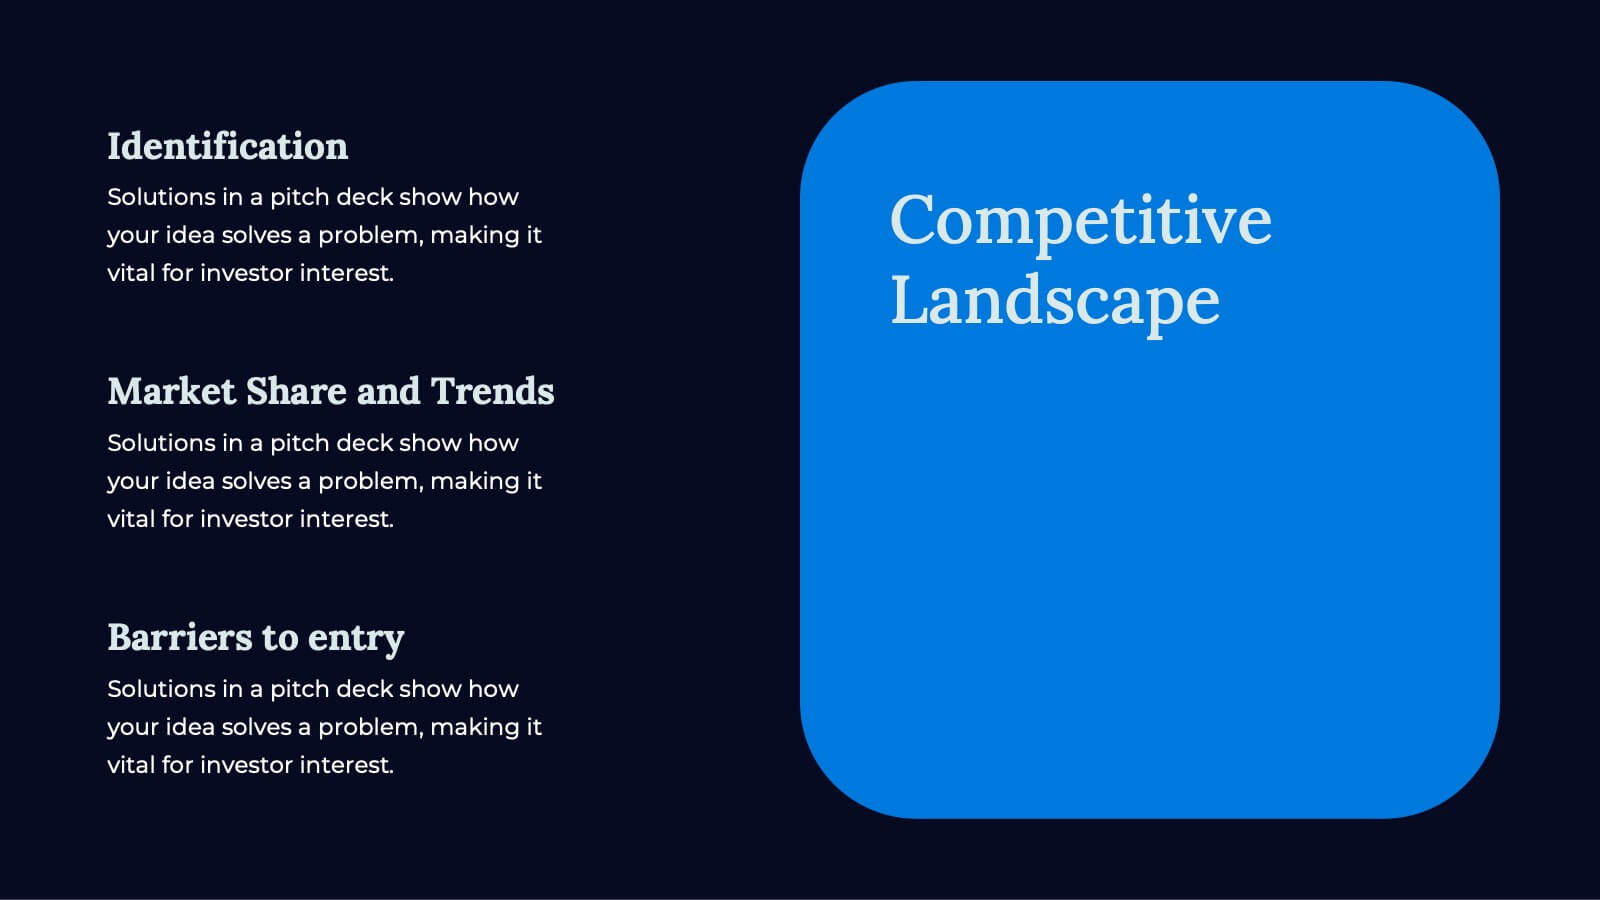
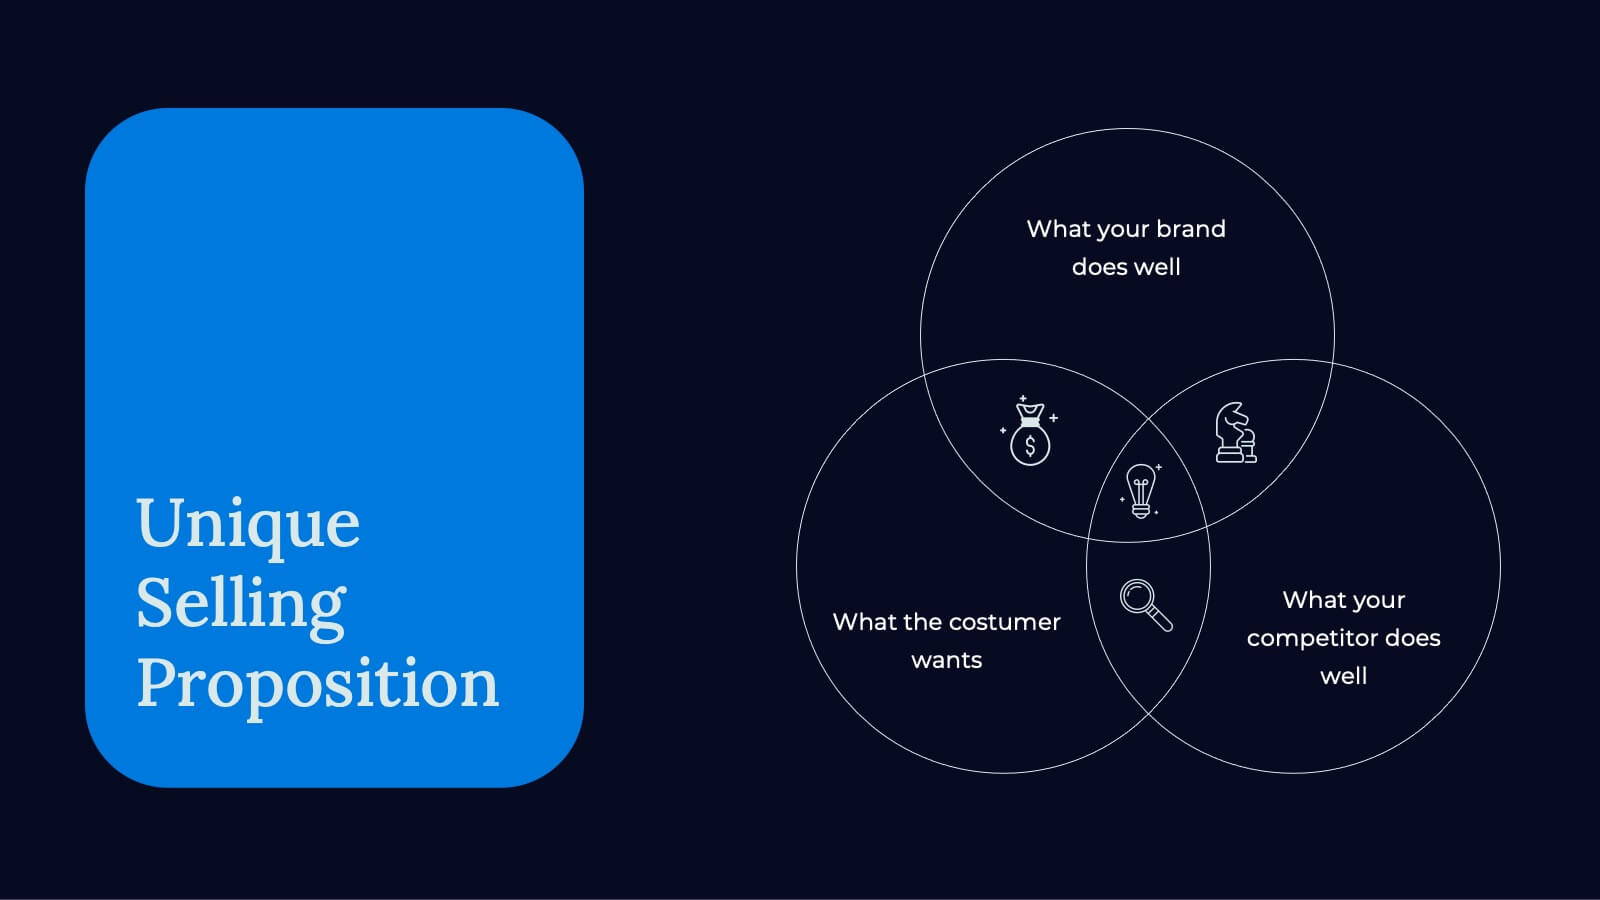
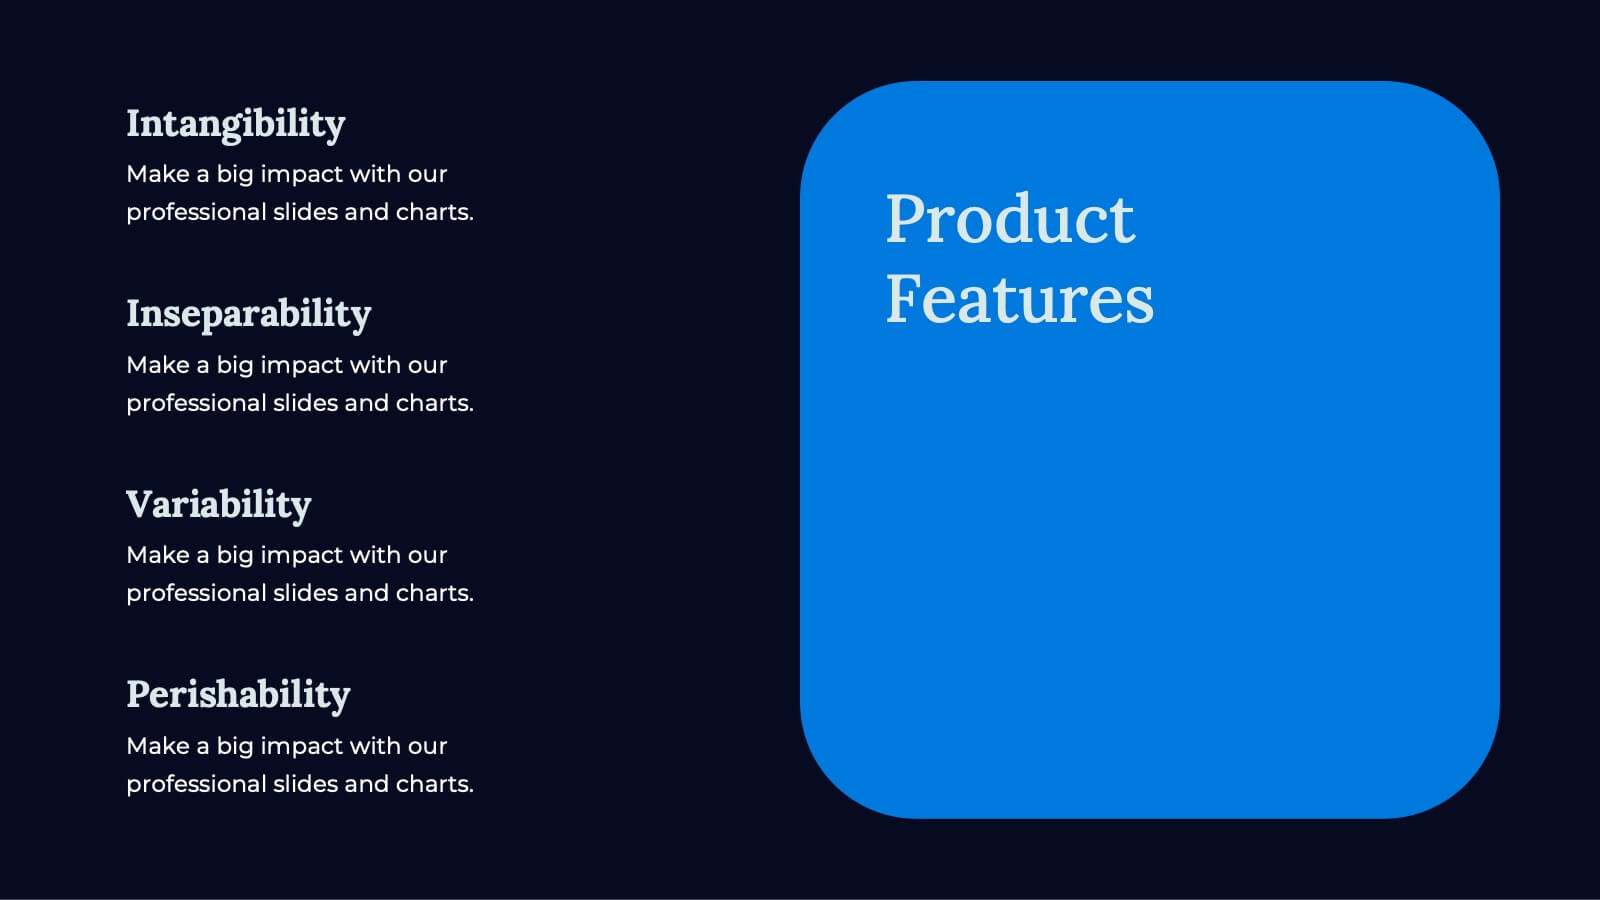
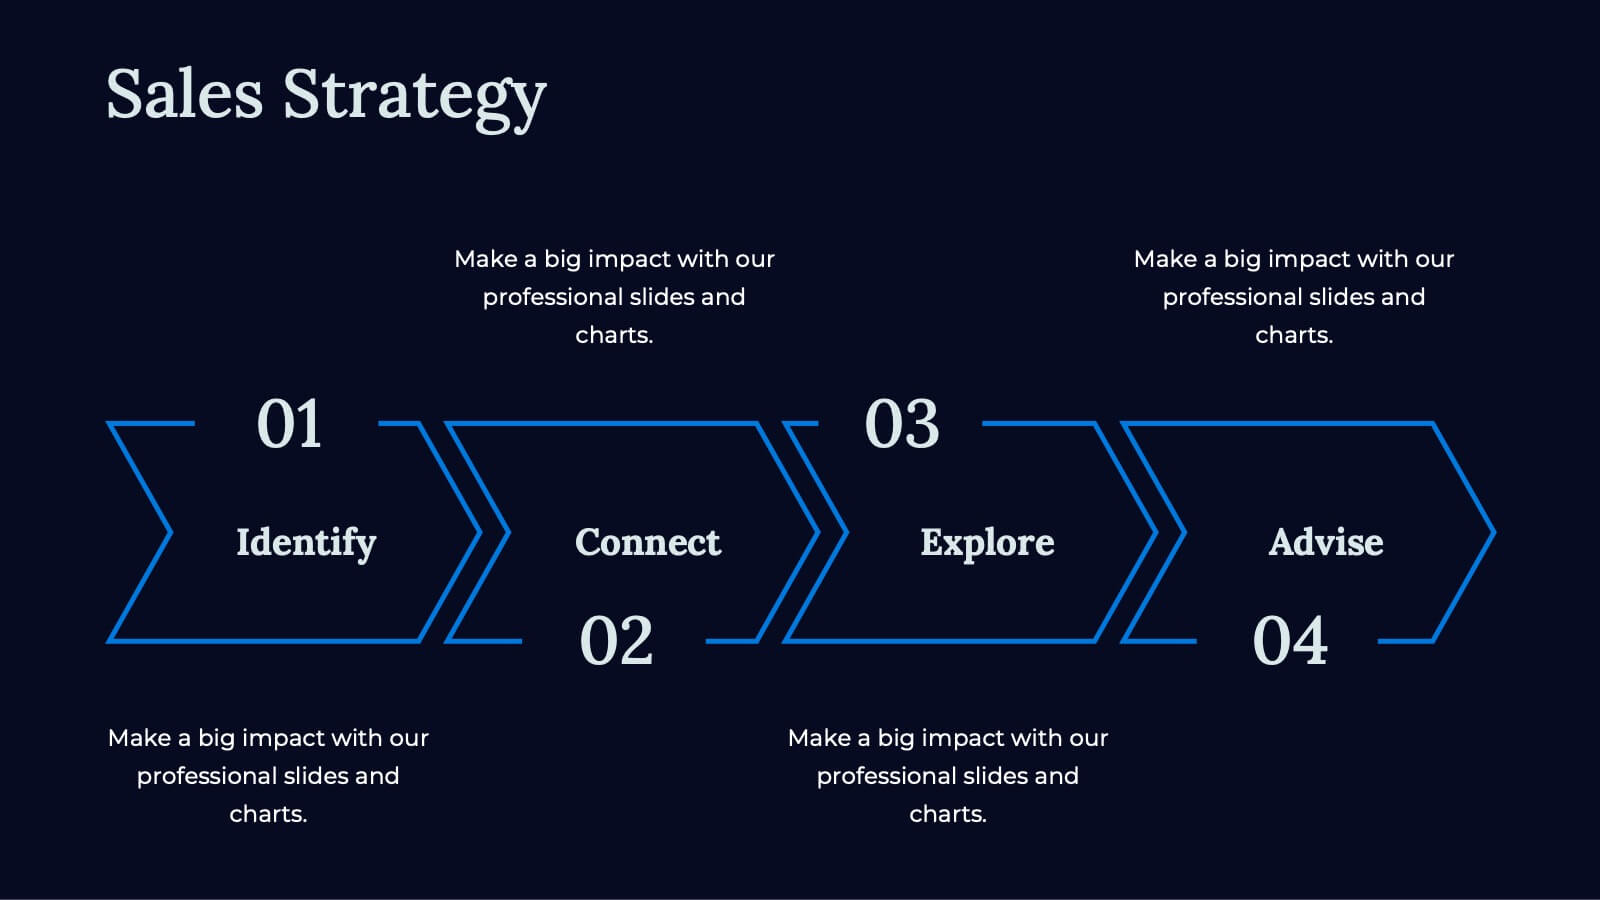
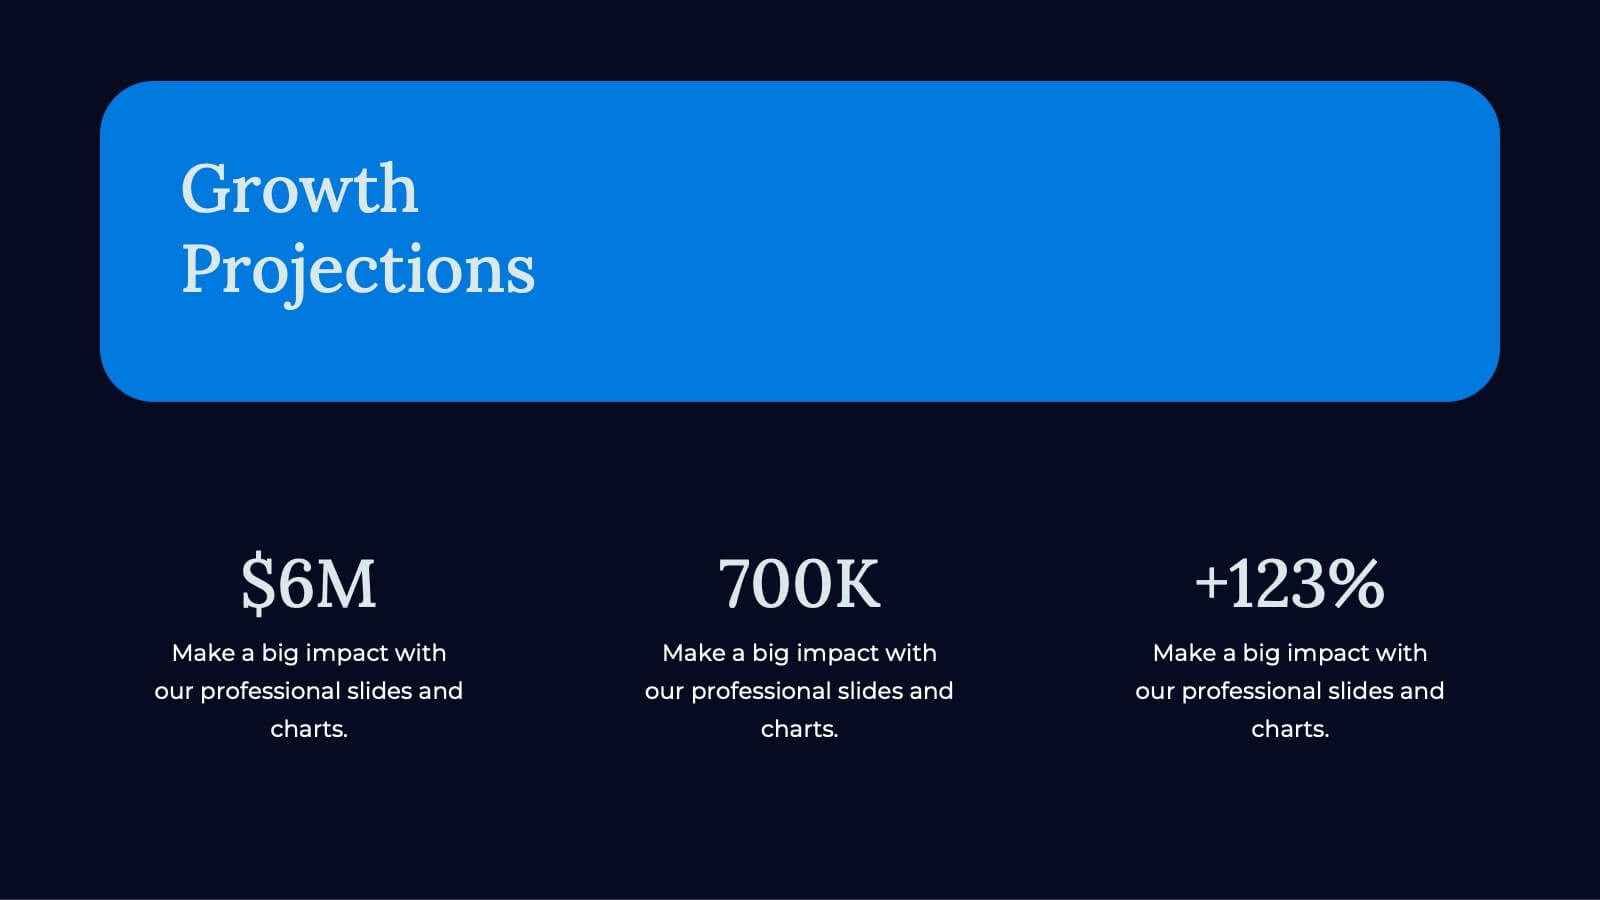
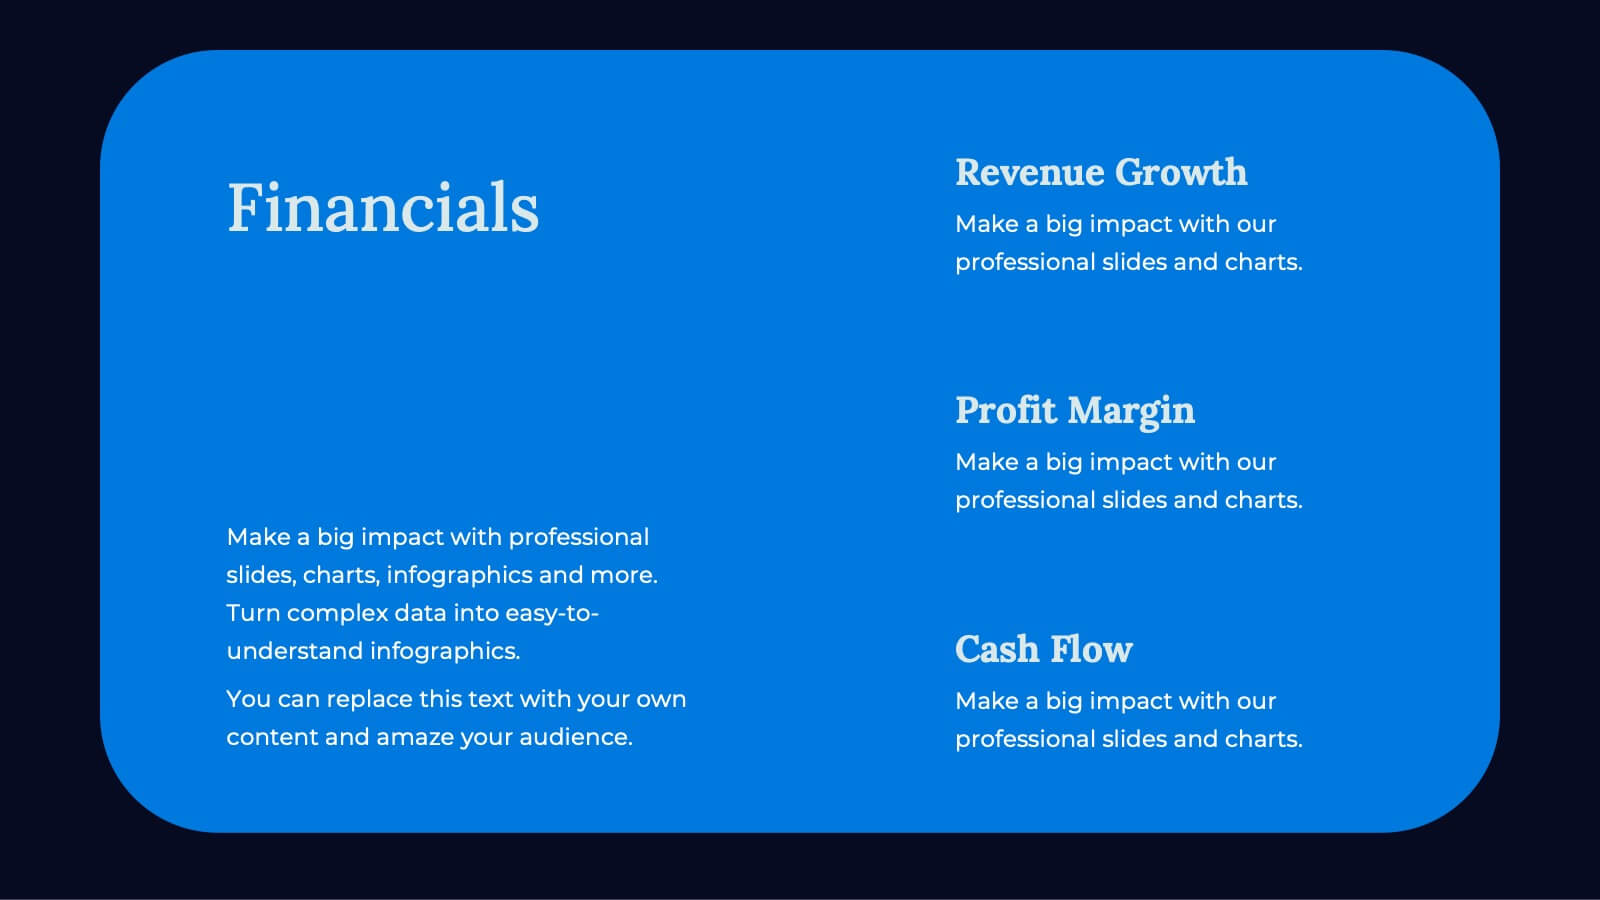
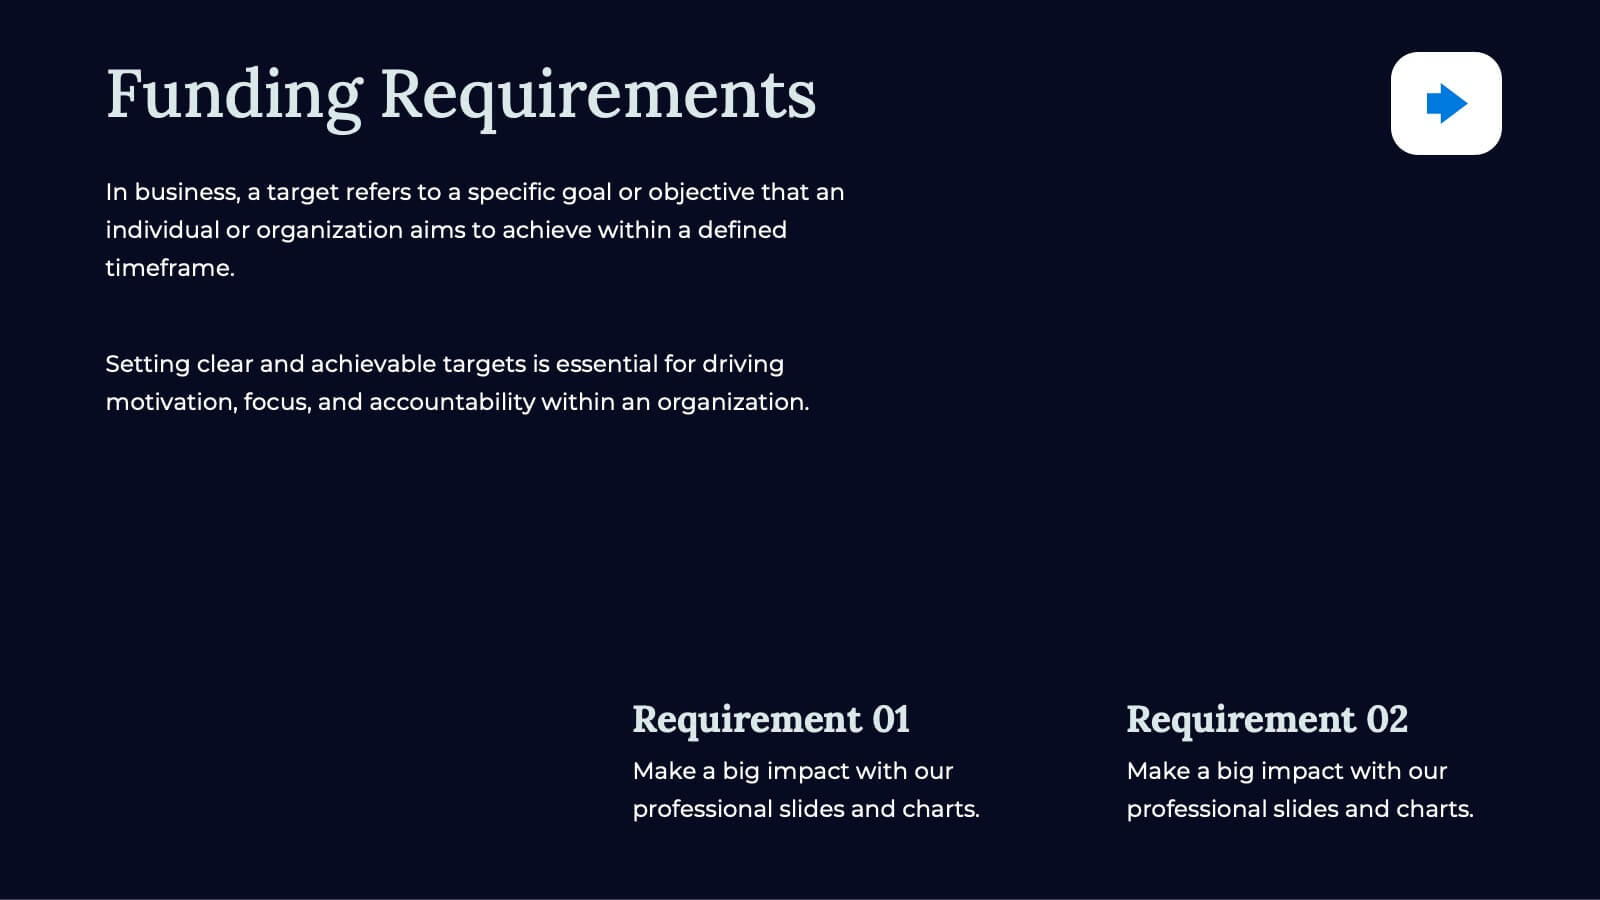
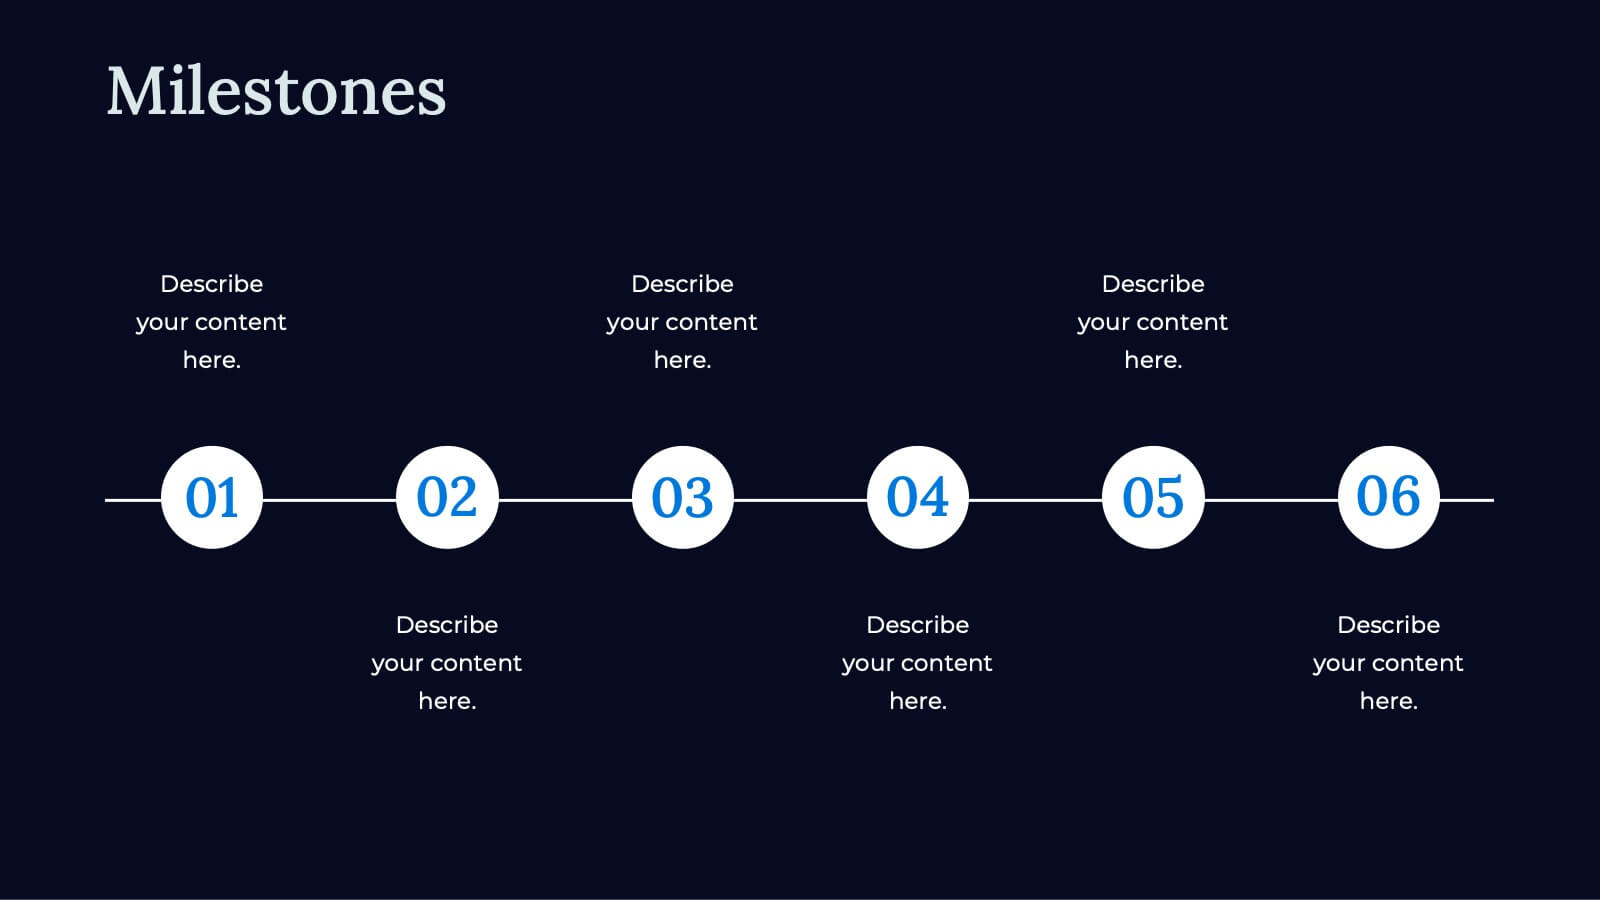
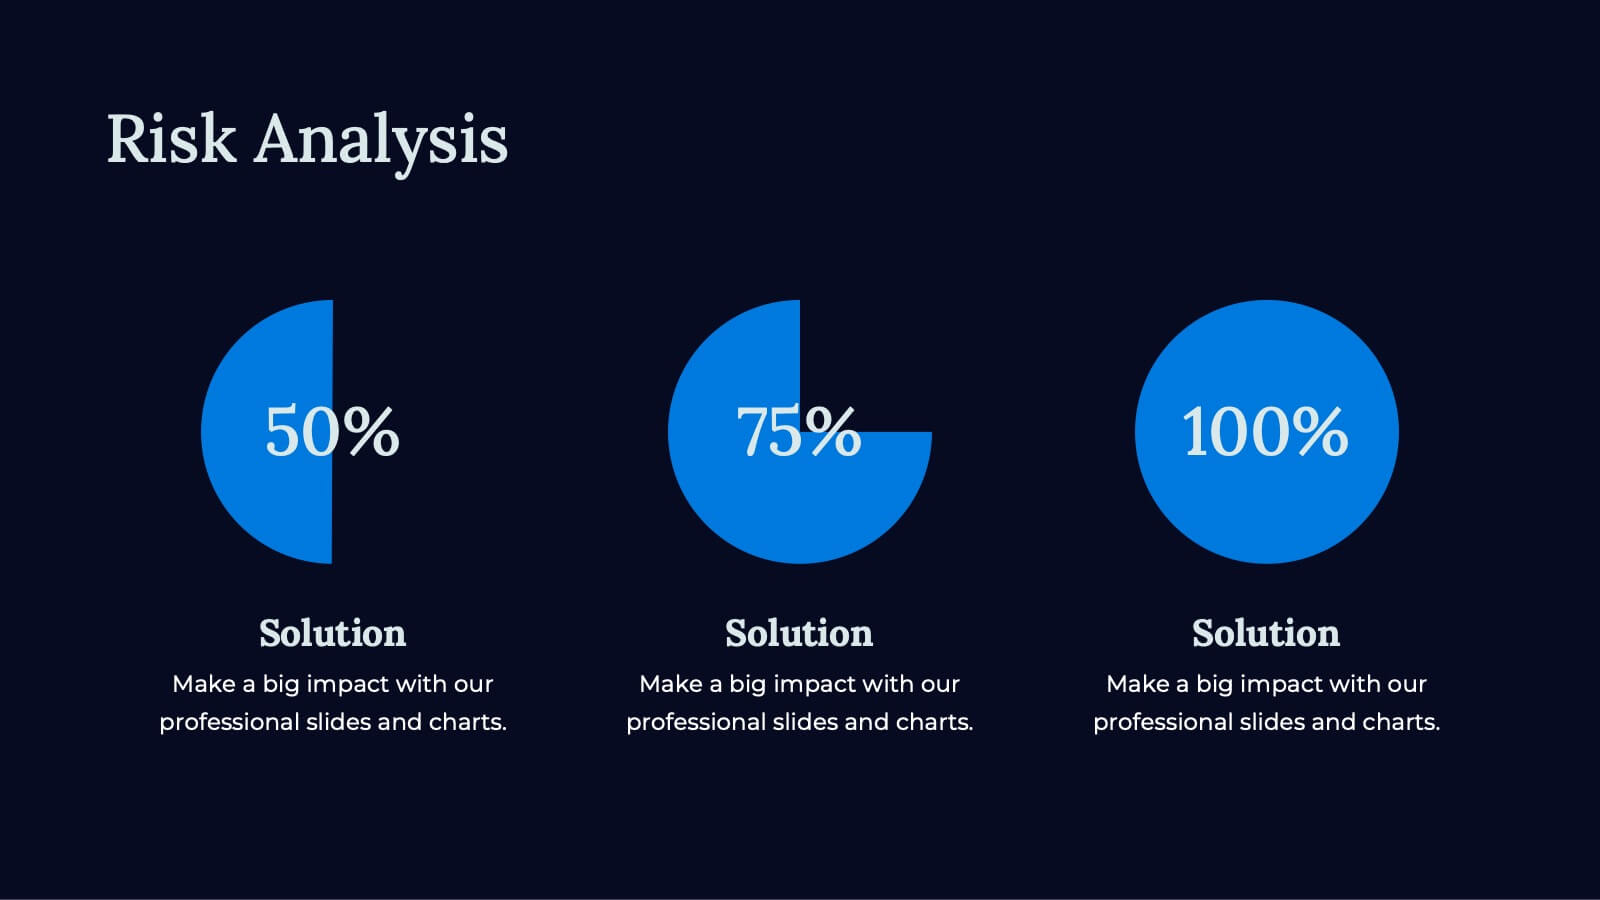
Apex Business Idea Pitch Deck Presentation
Craft powerful business pitch decks with this sleek template. Present your company overview, problem statement, solutions, and market opportunity. Showcase your business model, revenue model, competitive landscape, and unique selling proposition. Perfect for highlighting financials, growth projections, and funding requirements. Compatible with PowerPoint, Keynote, and Google Slides. Impress investors and stakeholders with clear, concise, and visually appealing presentations.


20 diapositivas
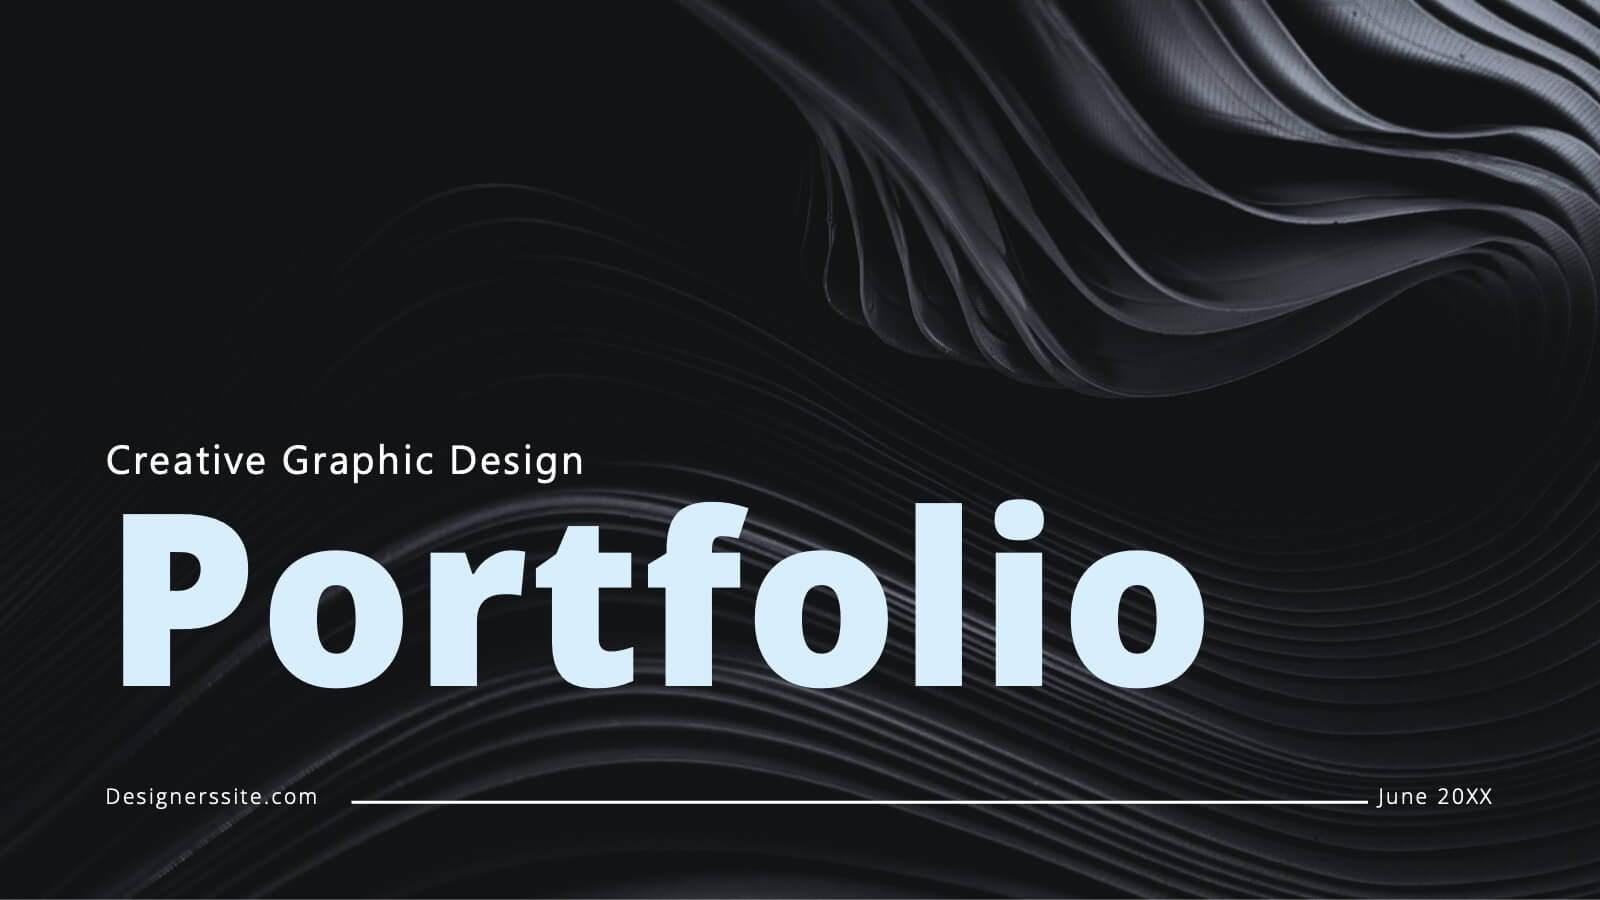
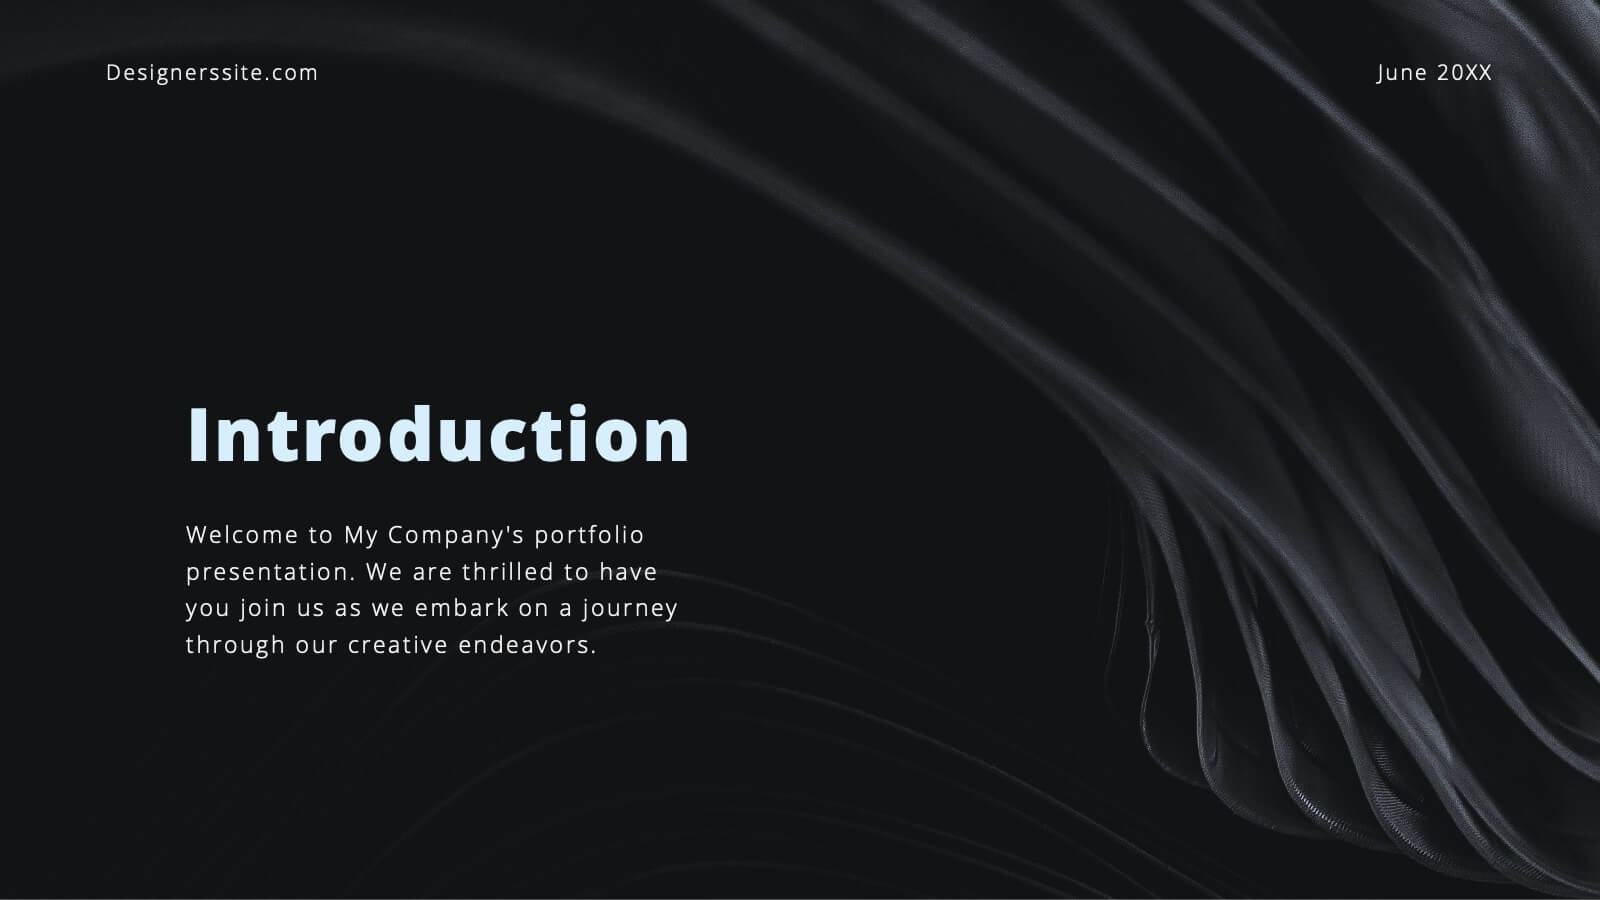
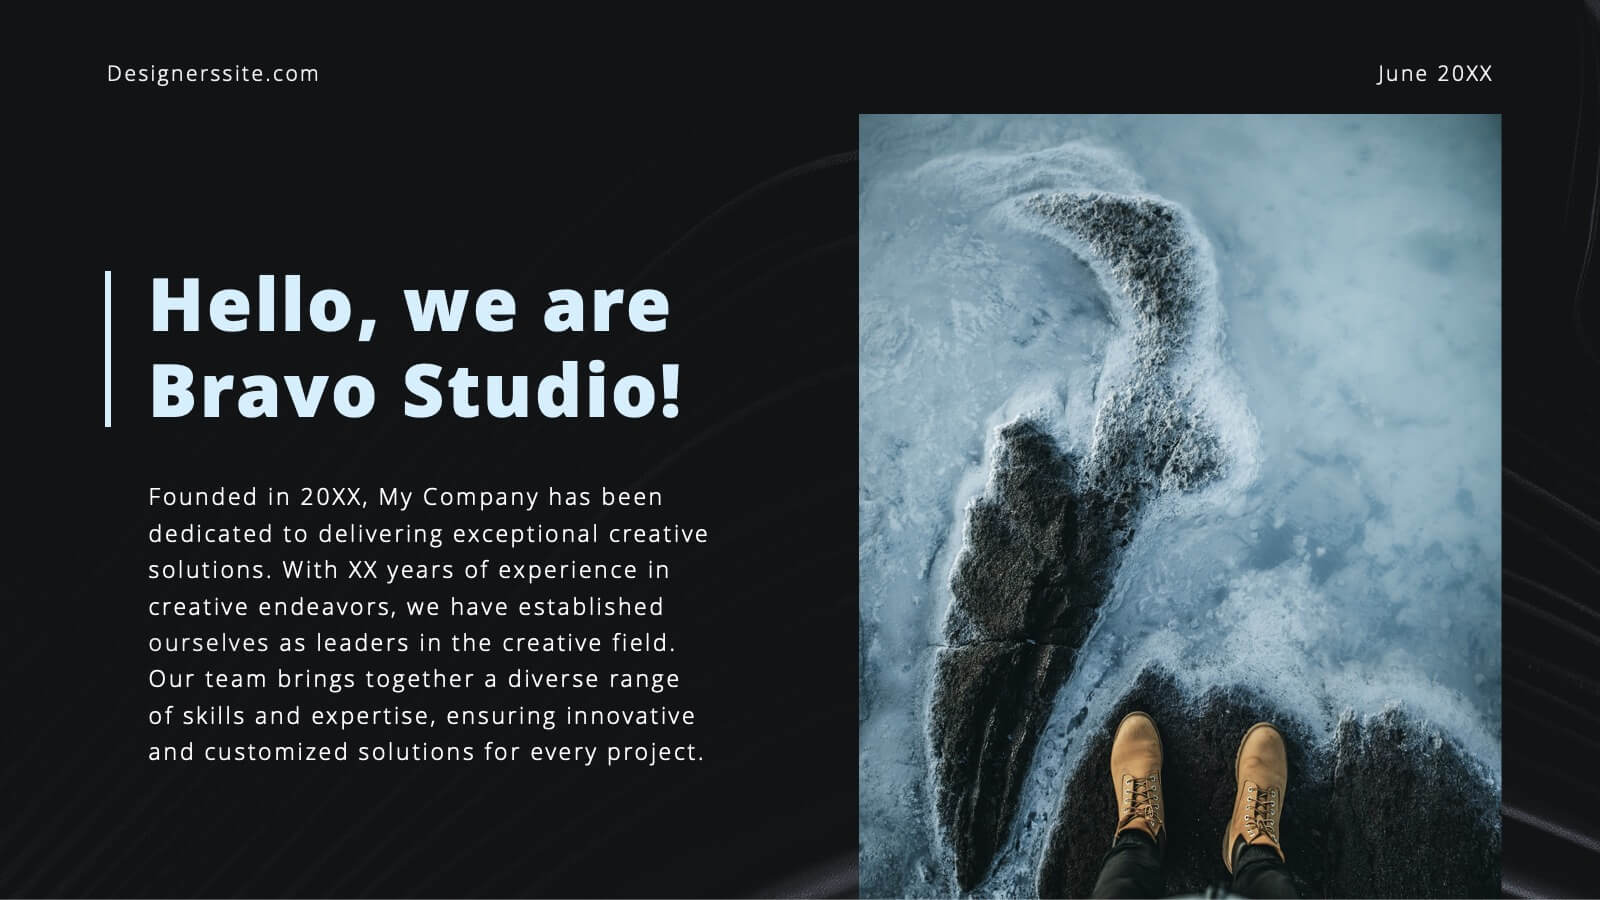
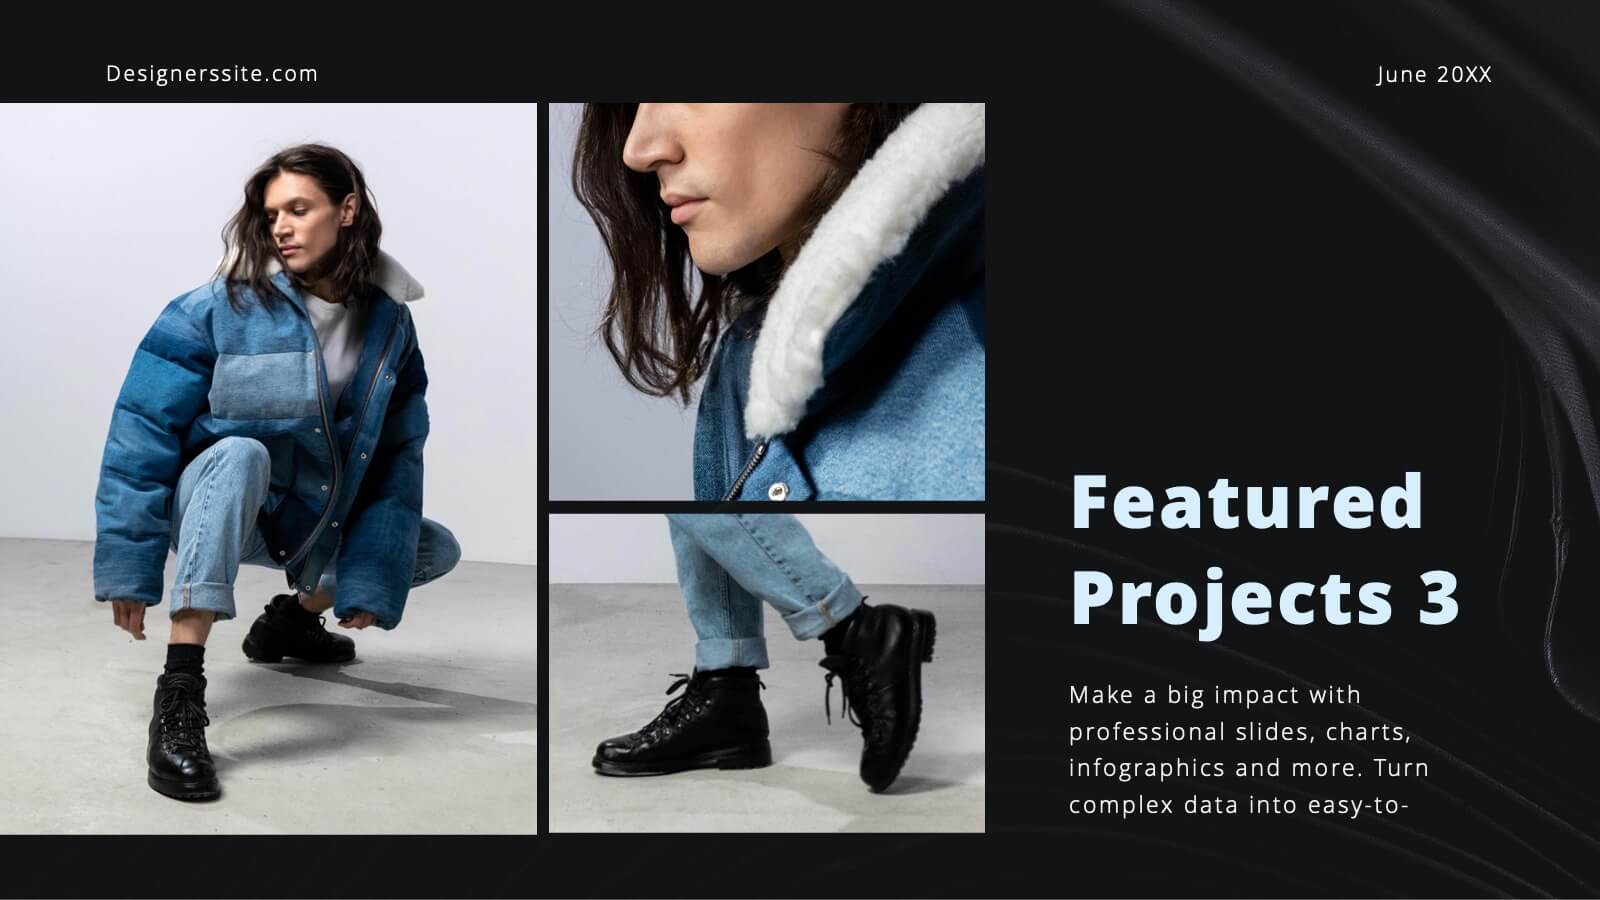
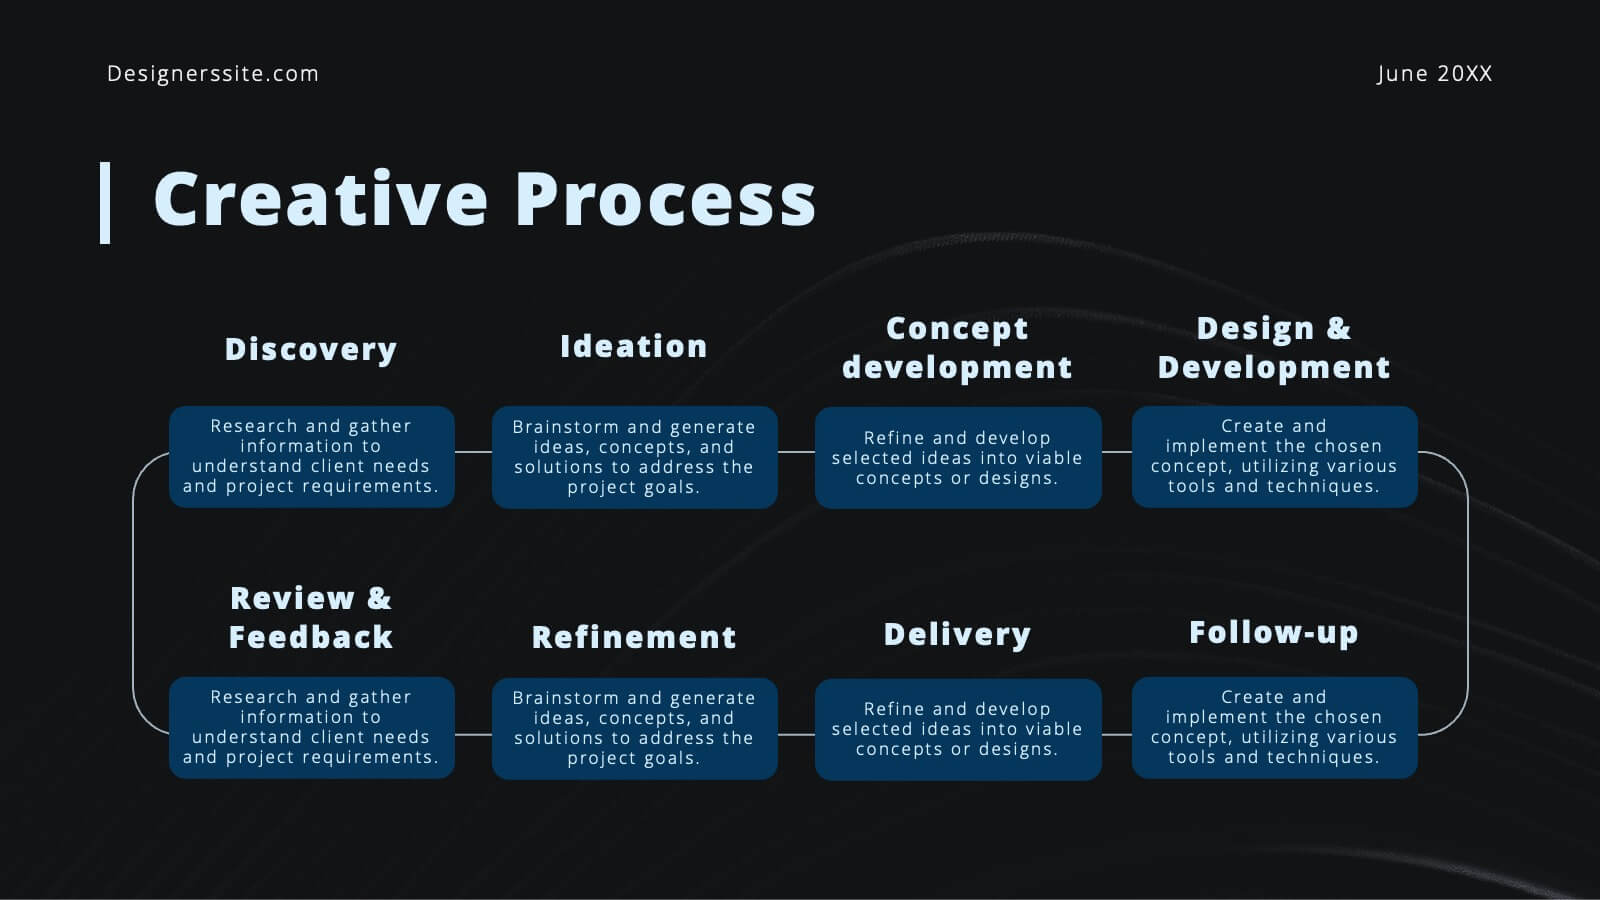
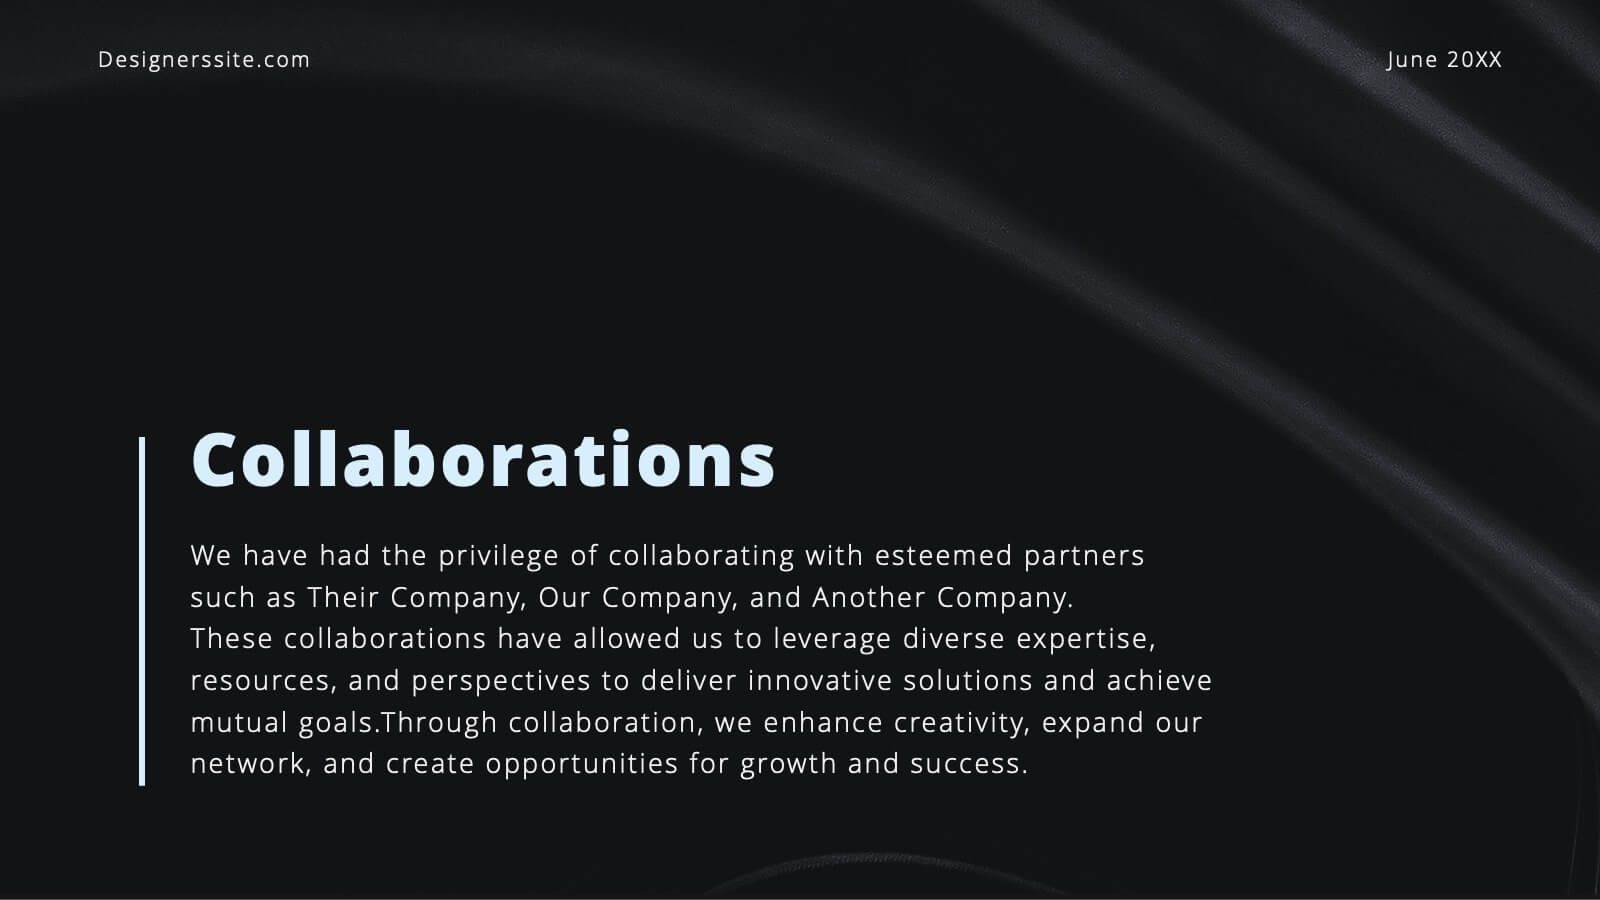
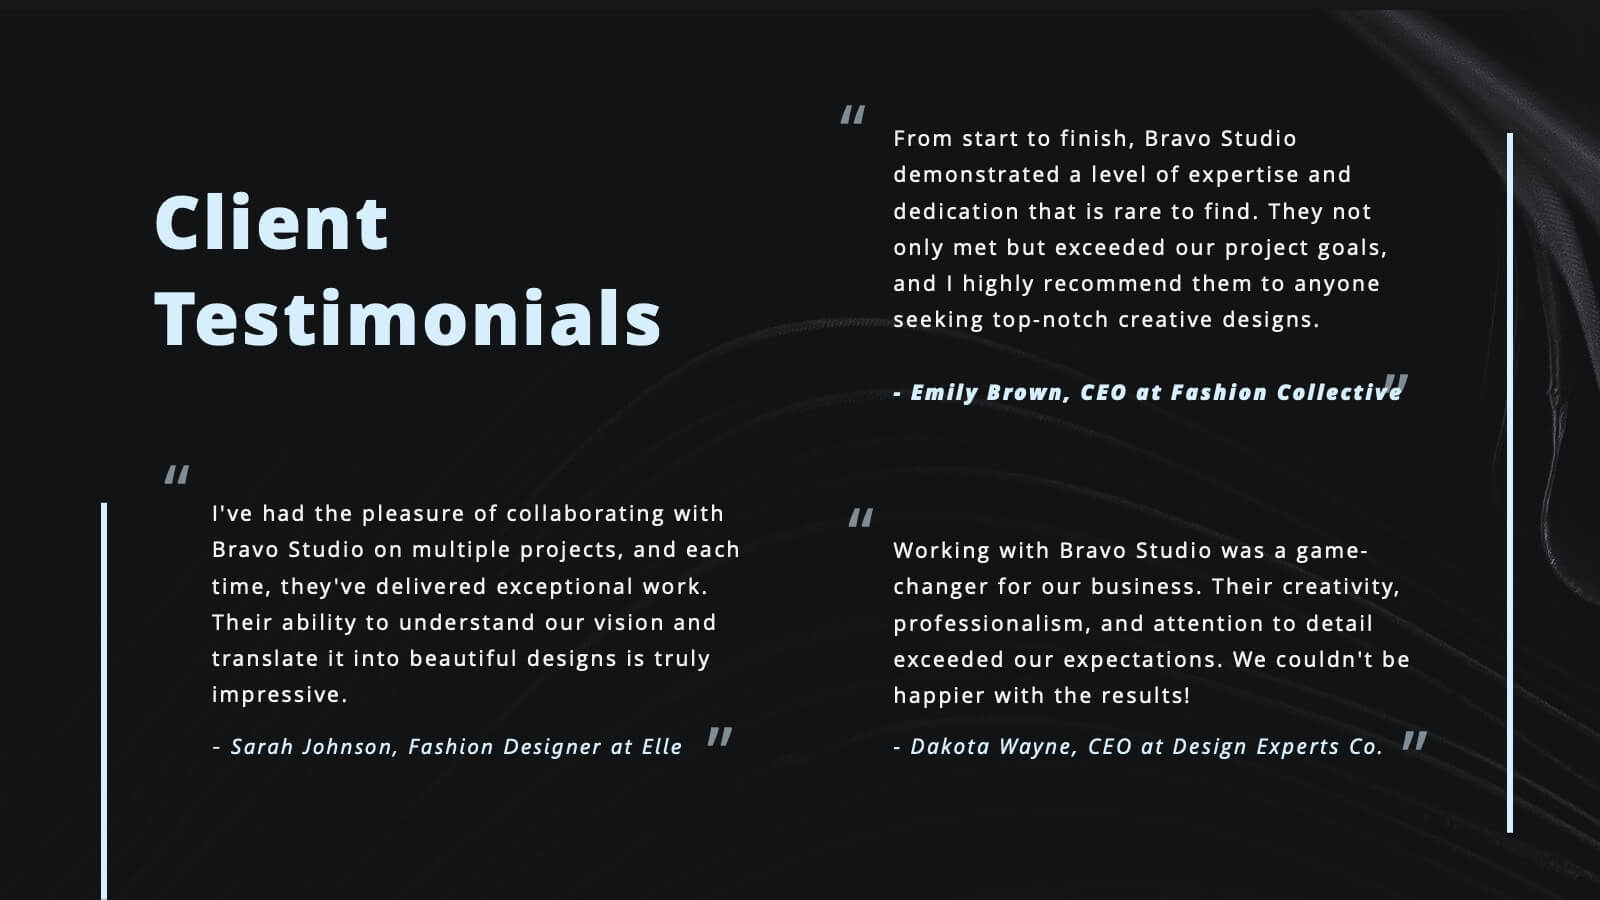
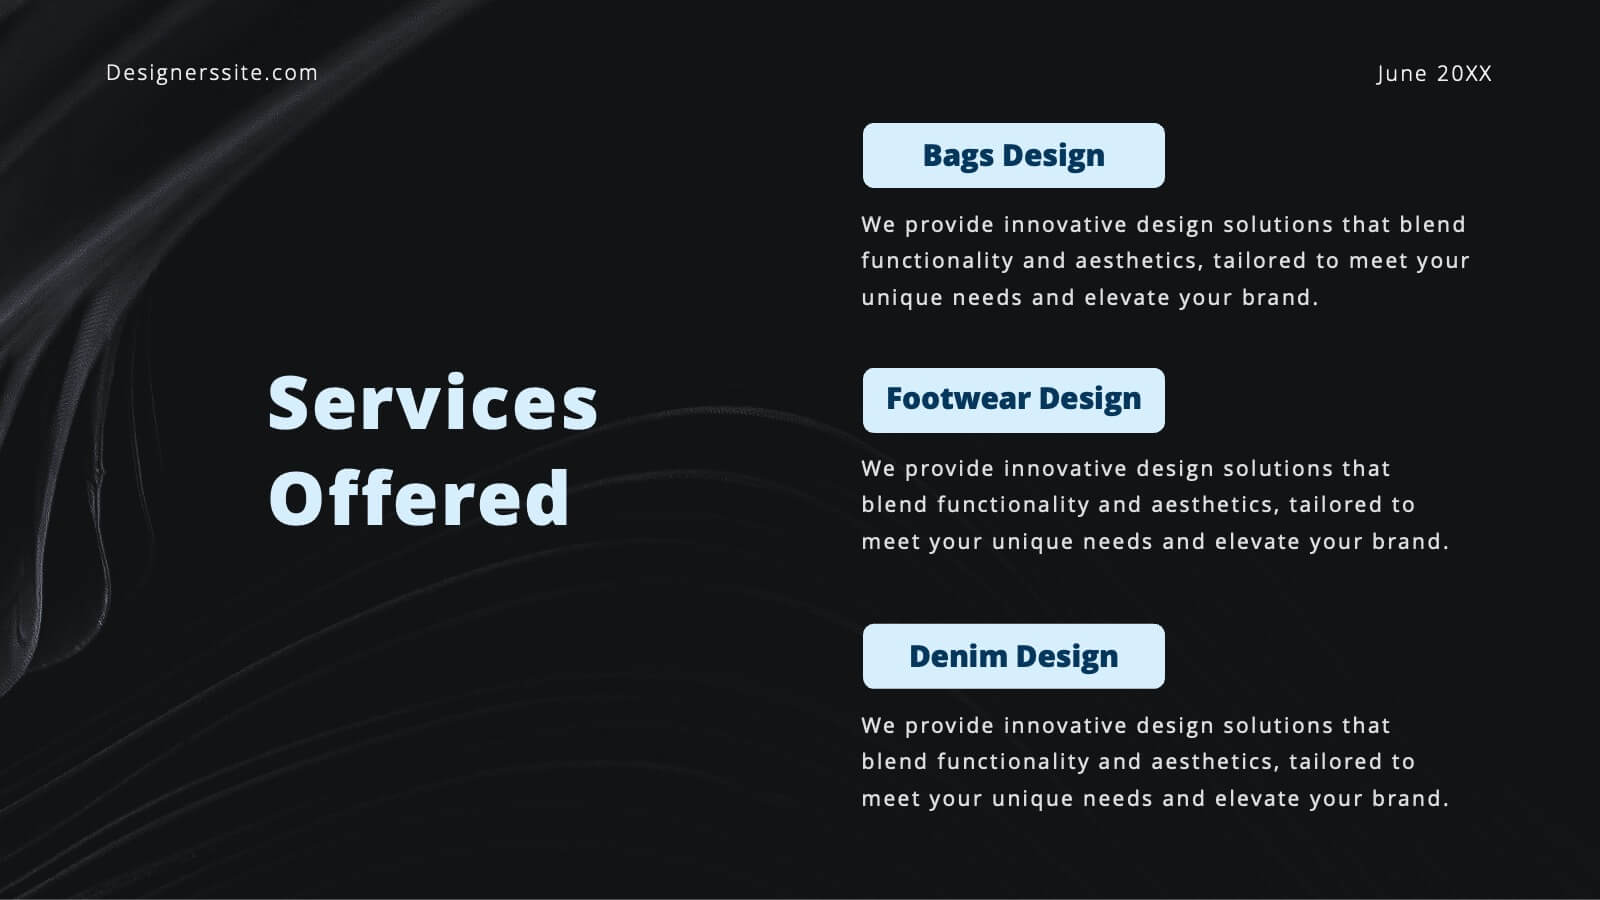
Bravo Creative Portfolio Presentation
Showcase your creative prowess with this sleek, modern portfolio presentation template. Perfect for highlighting featured projects, client testimonials, and your creative process, this template ensures your work shines. Its stylish design and professional layout make it ideal for impressing potential clients and collaborators. Compatible with PowerPoint, Keynote, and Google Slides, it's versatile for any platform.


21 diapositivas
Planetar Startup Strategy Presentation
This Startup Strategy Presentation offers a modern and structured layout to showcase your startup’s mission, vision, market analysis, and financial projections. Designed for entrepreneurs and investors, it includes sections on customer needs, growth plans, and milestones. Fully customizable and compatible with PowerPoint, Keynote, and Google Slides.


5 diapositivas
Five Essential Steps for Business Success Presentation
Visualize your growth plan with the Five Essential Steps for Business Success Presentation. This step-by-step layout highlights key milestones using a modern isometric staircase design, with speech bubble markers for added clarity. Ideal for roadmaps, strategic planning, or onboarding workflows. Fully editable in PowerPoint, Keynote, and Google Slides.


26 diapositivas
Venture Capital Dark Presentation
Present your investment vision with confidence using our Venture Capital presentation template, ideal for PowerPoint, Keynote, and Google Slides. This template is expertly crafted for venture capitalists, startup founders, and financial advisors looking to create persuasive and engaging presentations that attract investment. Our Venture Capital template is designed to showcase the potential of innovative startups to savvy investors. It includes a range of slides that detail market analysis, growth potential, business strategies, and investment opportunities, all laid out in an easy-to-understand format. With this template, you can effectively communicate complex financial data and investment propositions through clear visuals and concise text. Featuring customizable charts, graphs, and diagrams, the template allows for a personalized touch, making it easier to highlight the unique selling points of investment opportunities. Whether you're presenting to angel investors, venture capital firms, or at a funding pitch, this template will help you to articulate your message with clarity and impact. Increase the visibility of your venture capital presentations with our SEO-optimized template and position yourself as a thought leader in the field of investment and startup growth.


21 diapositivas
Karma Design Portfolio Presentation
Step into the spotlight with this bold and contemporary design portfolio! It presents your creative work in a sleek, visually striking format. From featured projects to your creative process and collaborations, this portfolio will leave a lasting impression. Perfect for showcasing your design style on PowerPoint, Keynote, or Google Slides!


22 diapositivas
Arachne Digital Marketing Strategy Plan Presentation
Weave a powerful digital marketing strategy with this sleek, Arachne-inspired presentation! Perfect for outlining your digital marketing plans, this template helps you highlight key strategies, analytics, and campaign goals in a structured and visually engaging way. Its modern design keeps your audience focused. Compatible with PowerPoint, Keynote, and Google Slides.


5 diapositivas
Business People Collaboration Overview Presentation
Showcase team dynamics with the Business People Collaboration Overview Presentation. This template uses a clean hexagon layout to highlight roles, responsibilities, or partnerships between individuals or departments. Ideal for collaboration strategies, organizational structures, or cross-functional workflows. Fully editable in PowerPoint, Canva, and Google Slides.


8 diapositivas
Corporate Office Scenes Illustrations Presentation
Bring workplace communication to life with this slide featuring an illustrated office meeting scene and a four-point list layout. Each segment is color-coded with accompanying icons, making it ideal for presenting corporate strategies, team roles, or process workflows. Designed for clarity and visual appeal, this slide is perfect for business reports, training decks, or client briefings. Easily customizable in PowerPoint, Keynote, and Google Slides.


6 diapositivas
Restaurant Branding Food Presentation
Bring your ideas to life with a presentation that feels fresh, playful, and full of personality. This layout helps you showcase food branding concepts, menu themes, and visual identity elements in a clear, engaging flow that’s easy for audiences to follow. Fully compatible with PowerPoint, Keynote, and Google Slides.


6 diapositivas
Conversion Funnel Stages Overview Presentation
Visualize user journeys with clarity using the Conversion Funnel Stages Overview Presentation. This funnel diagram template breaks down key conversion phases—from awareness to decision—into distinct, color-coded stages. Ideal for marketing reports, sales strategies, or product demos. Fully editable in PowerPoint, Google Slides, and Canva.


4 diapositivas
Product Launch and Roadmap Milestones Presentation
Highlight every phase of your product journey with this Product Launch and Roadmap Milestones presentation. Designed with a winding roadmap layout and colorful milestone markers, this template is perfect for visualizing launch plans, key deliverables, and development stages. Fully editable in Canva, PowerPoint, and Google Slides for easy customization.


26 diapositivas
Dante Presentation Template
Featuring our new Dante Sportswear template this is a great way to present your products and ideas in an attractive, easy-to-read and easily understanding presentation. It includes all the elements you need to create a marketing presentation with style that will stand out. This template has plenty of space for displaying statistics and other data with images that complement your product/service information. You can use this template for valuable sportswear content or information to educate or entertain your audience. This template is fully and easily editable in powerpoint as well!