


Características


¿Tienes alguna pregunta?
Recomendar


20 diapositivas
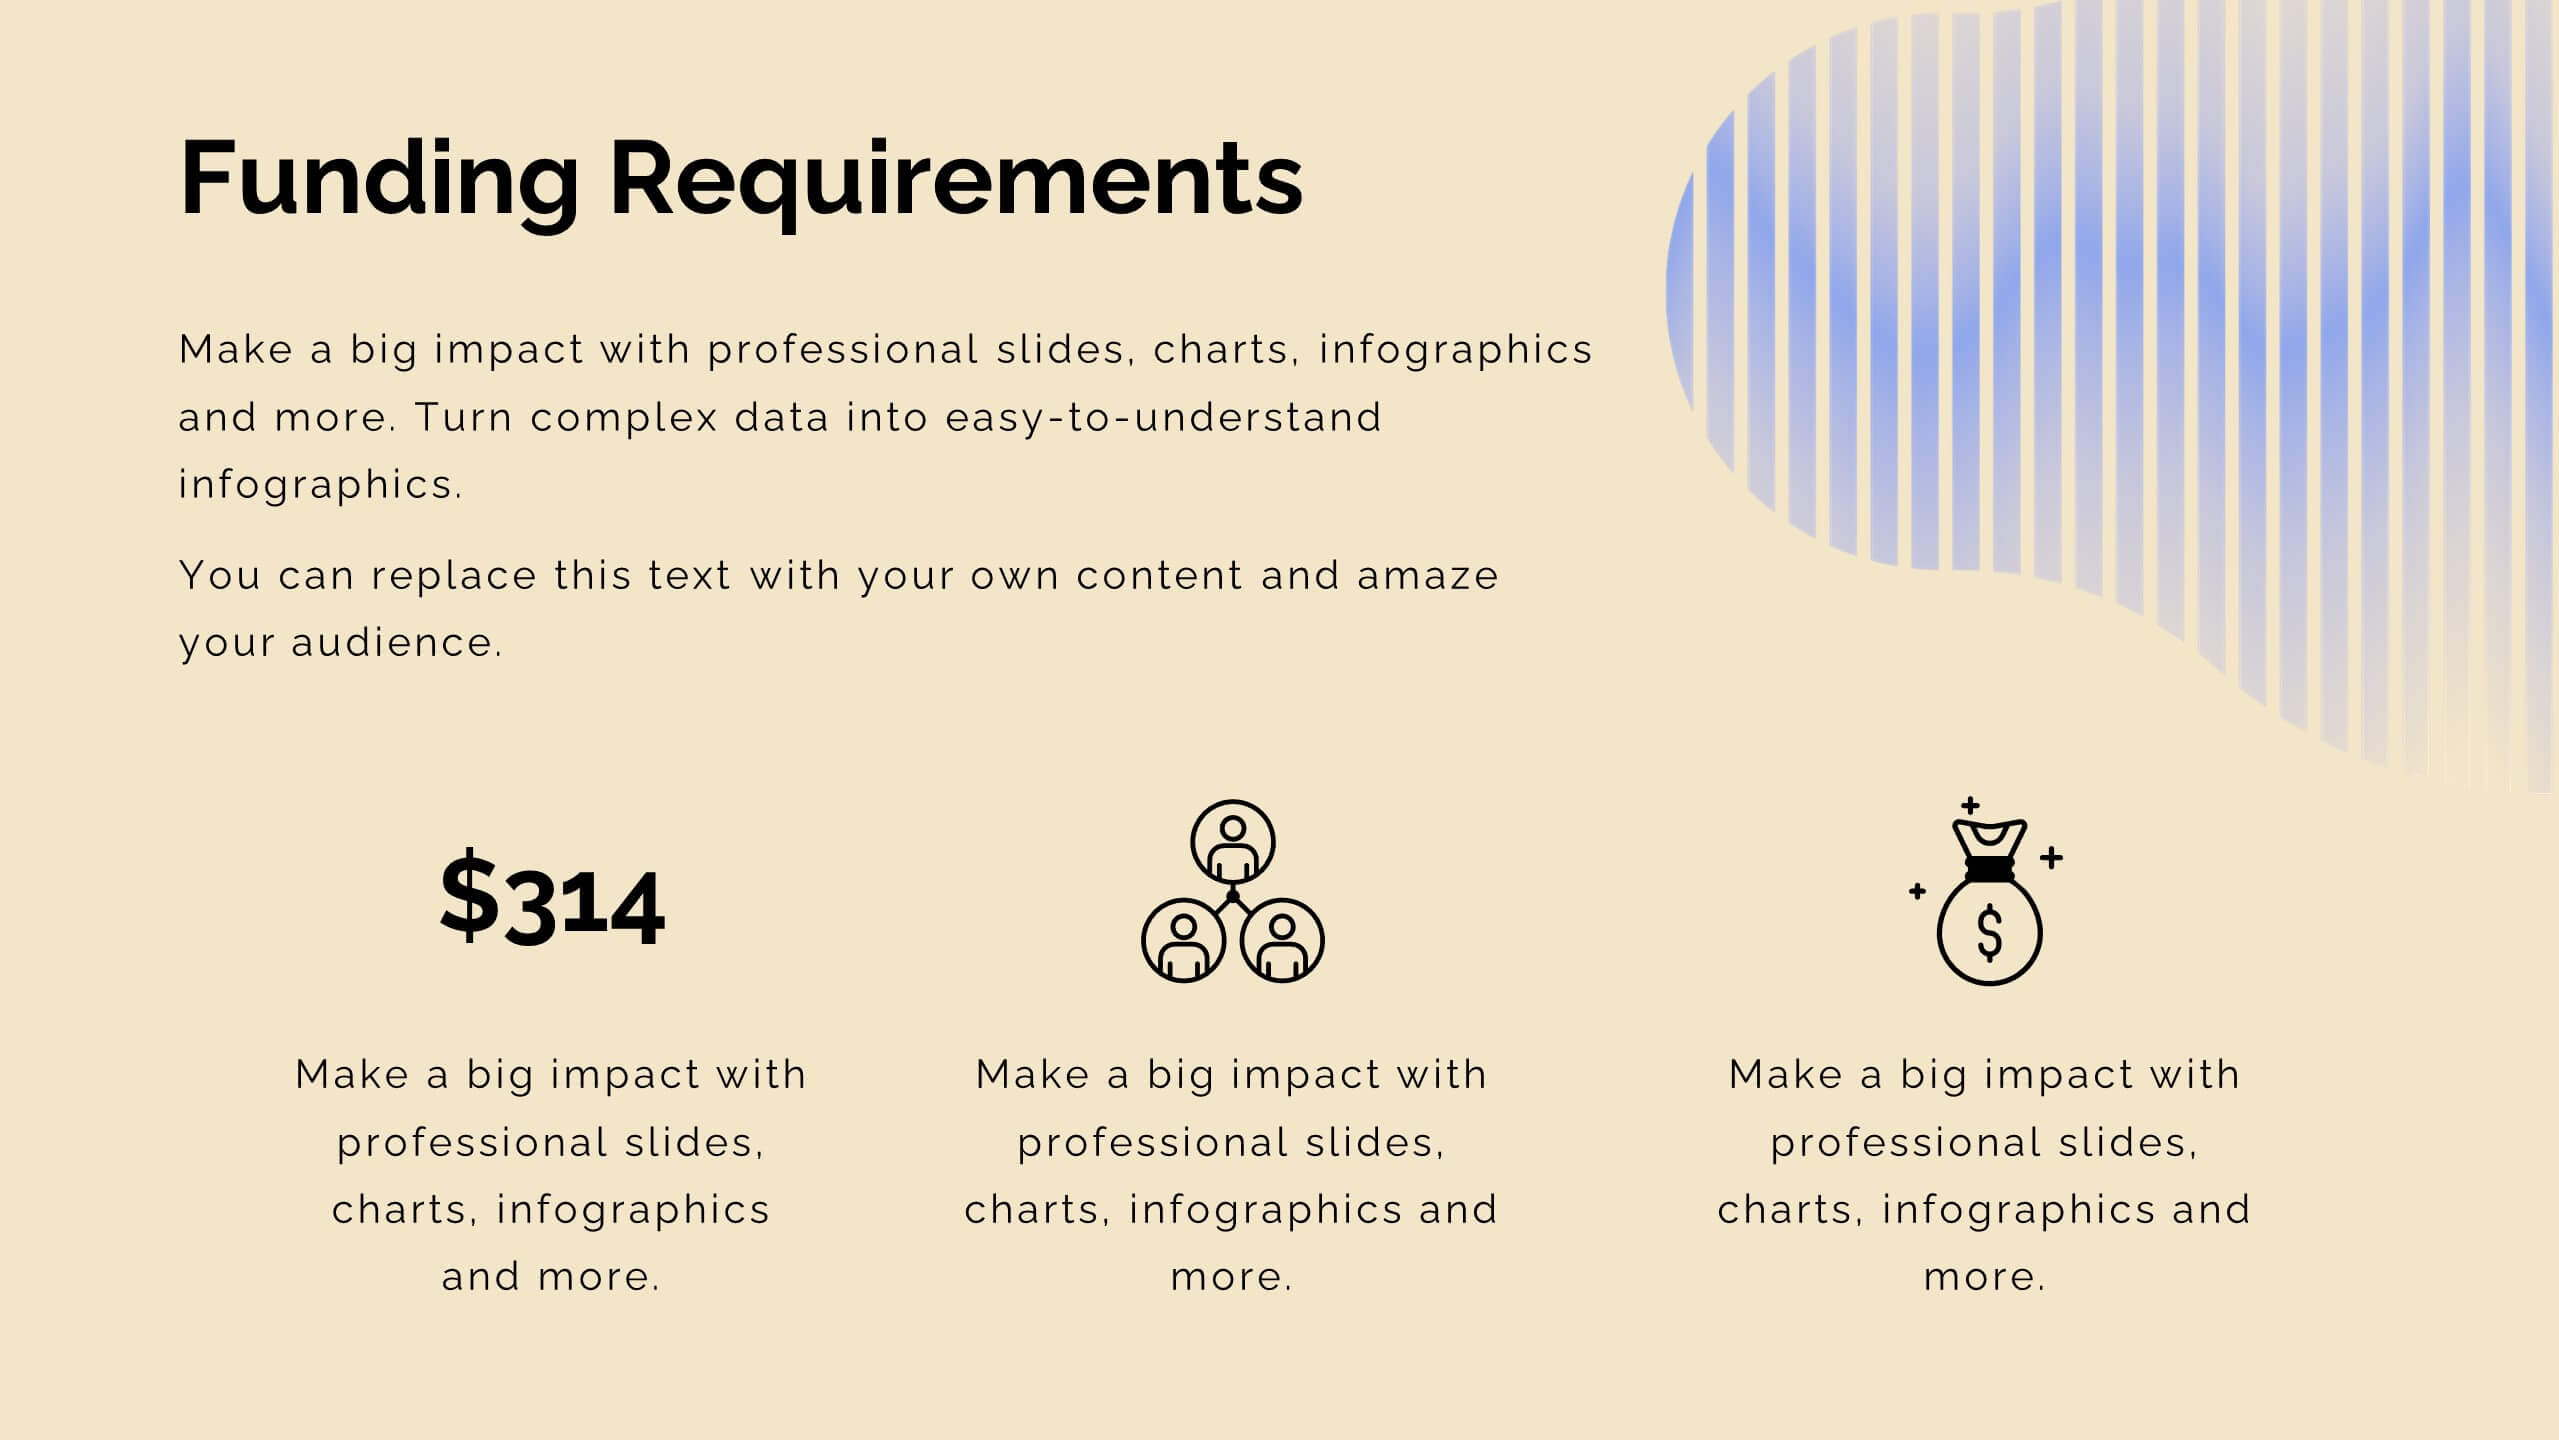
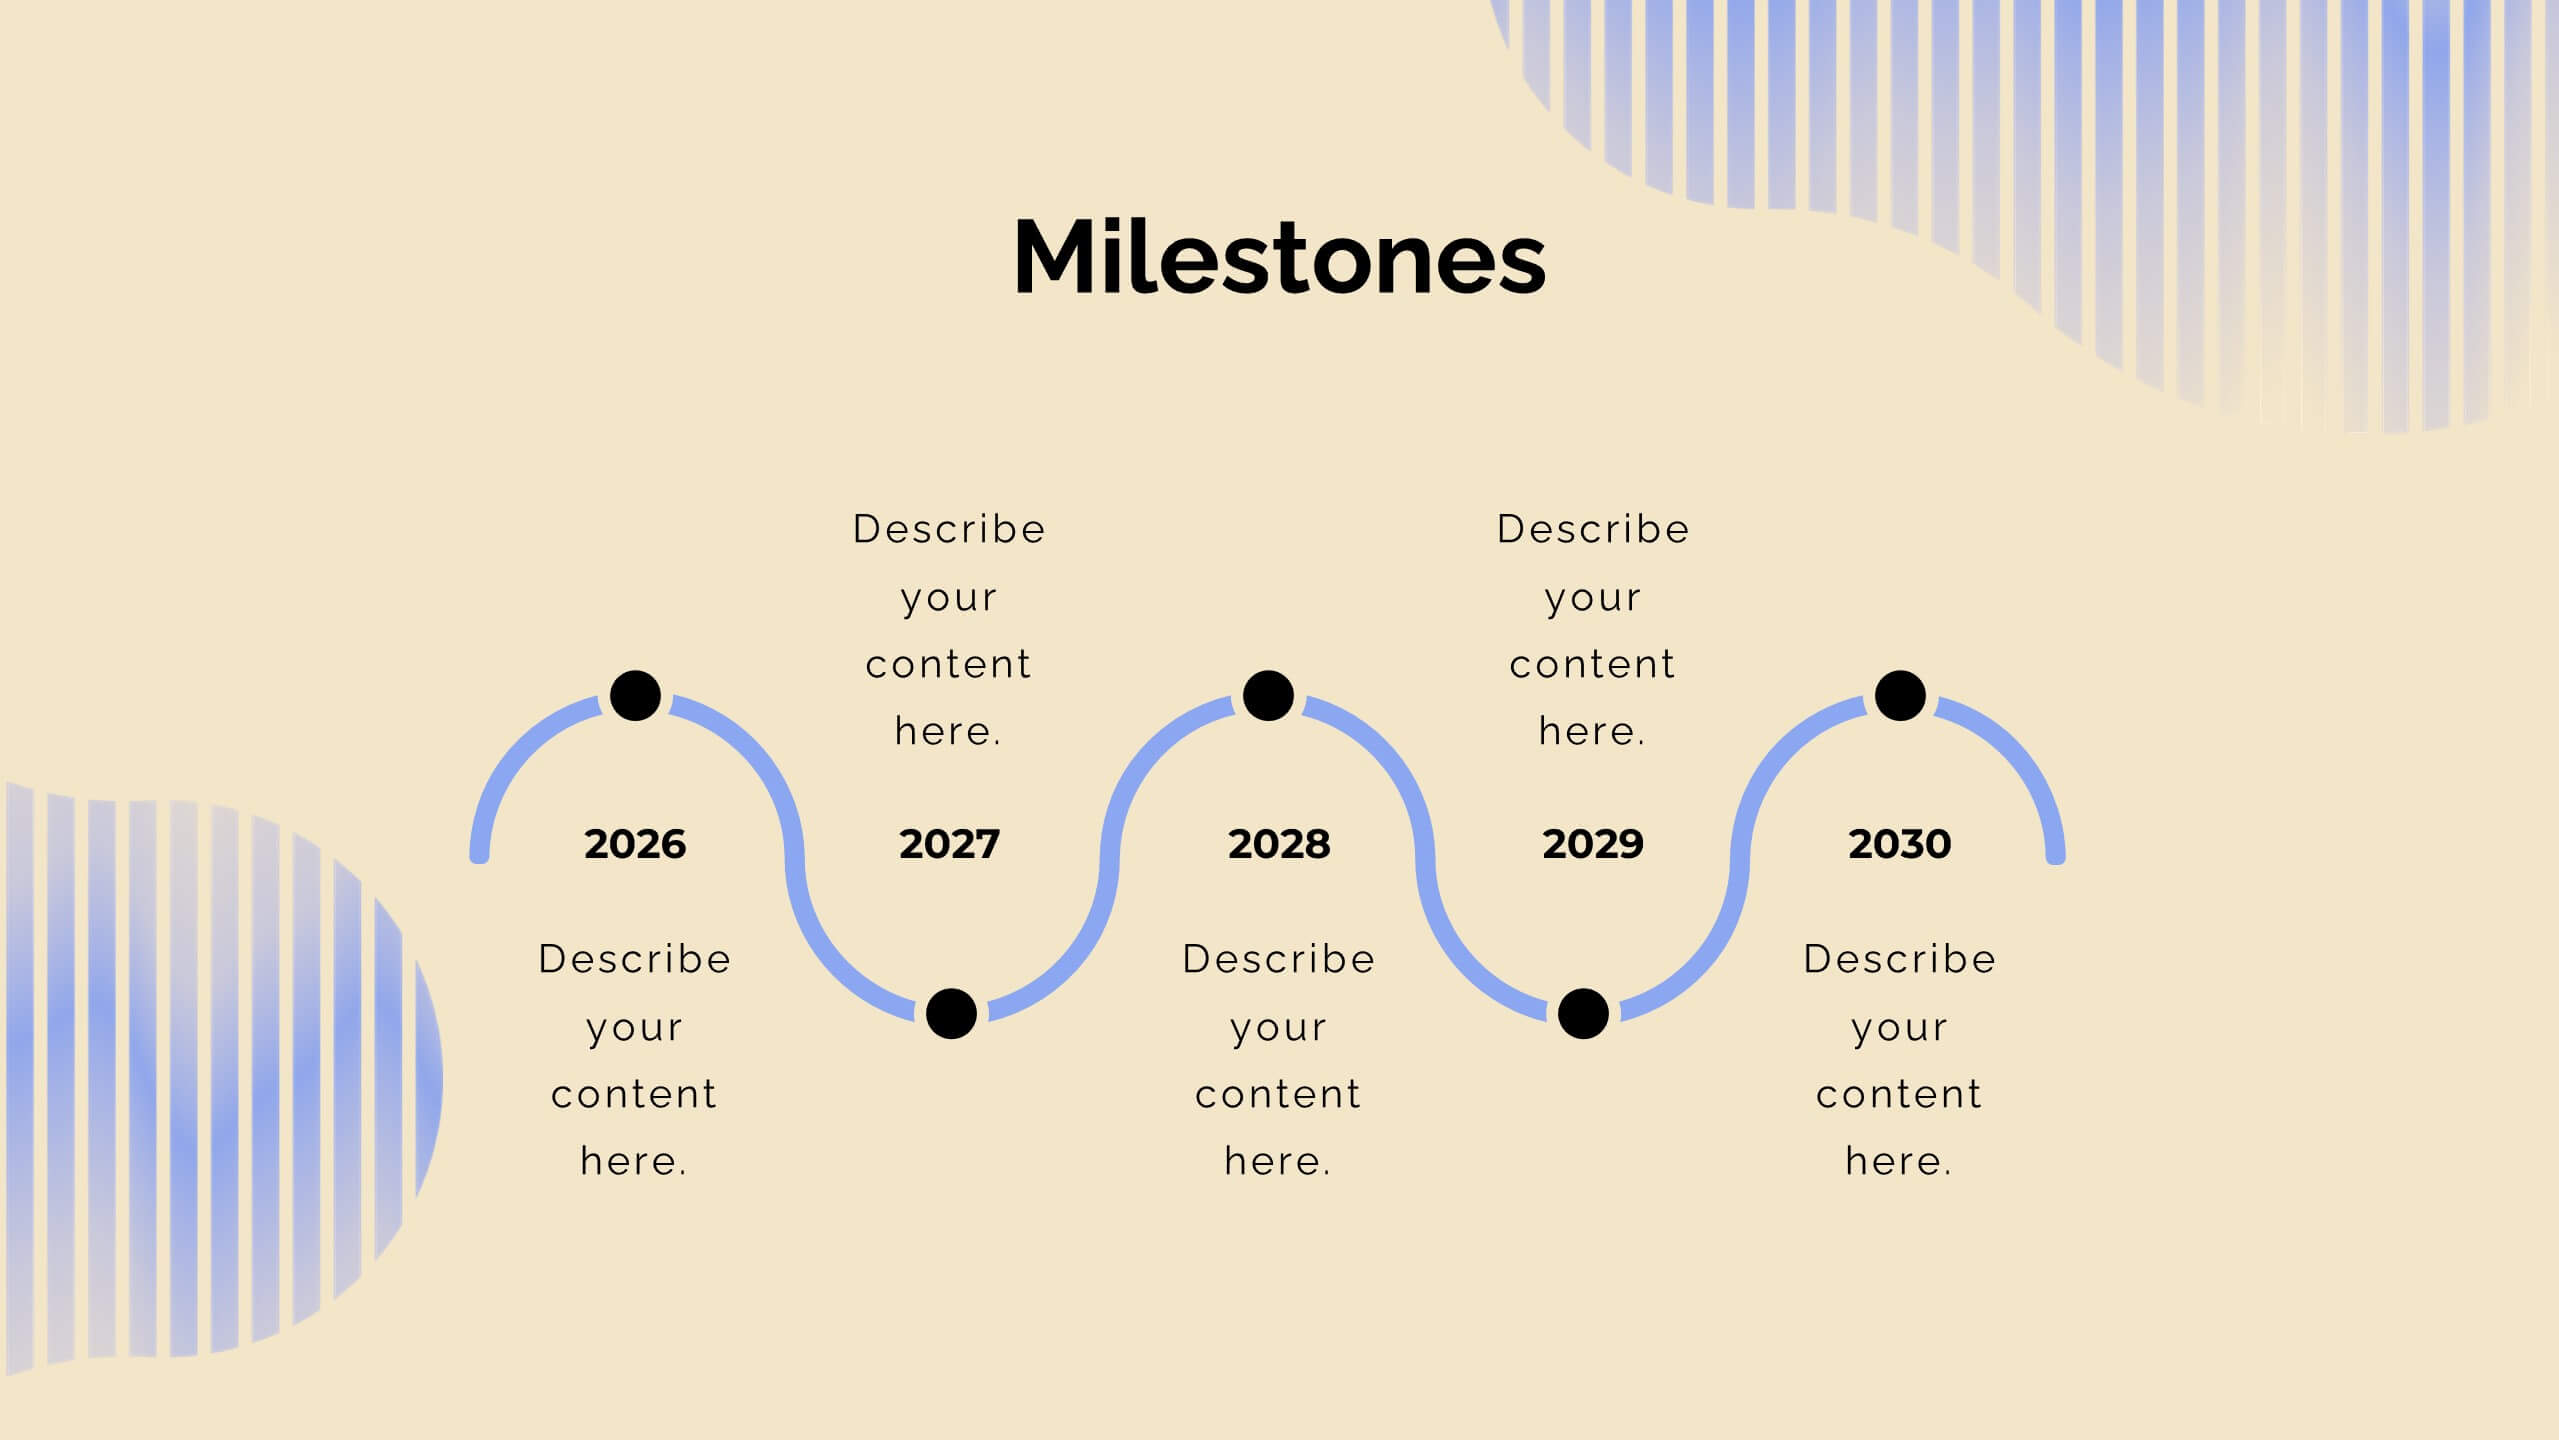
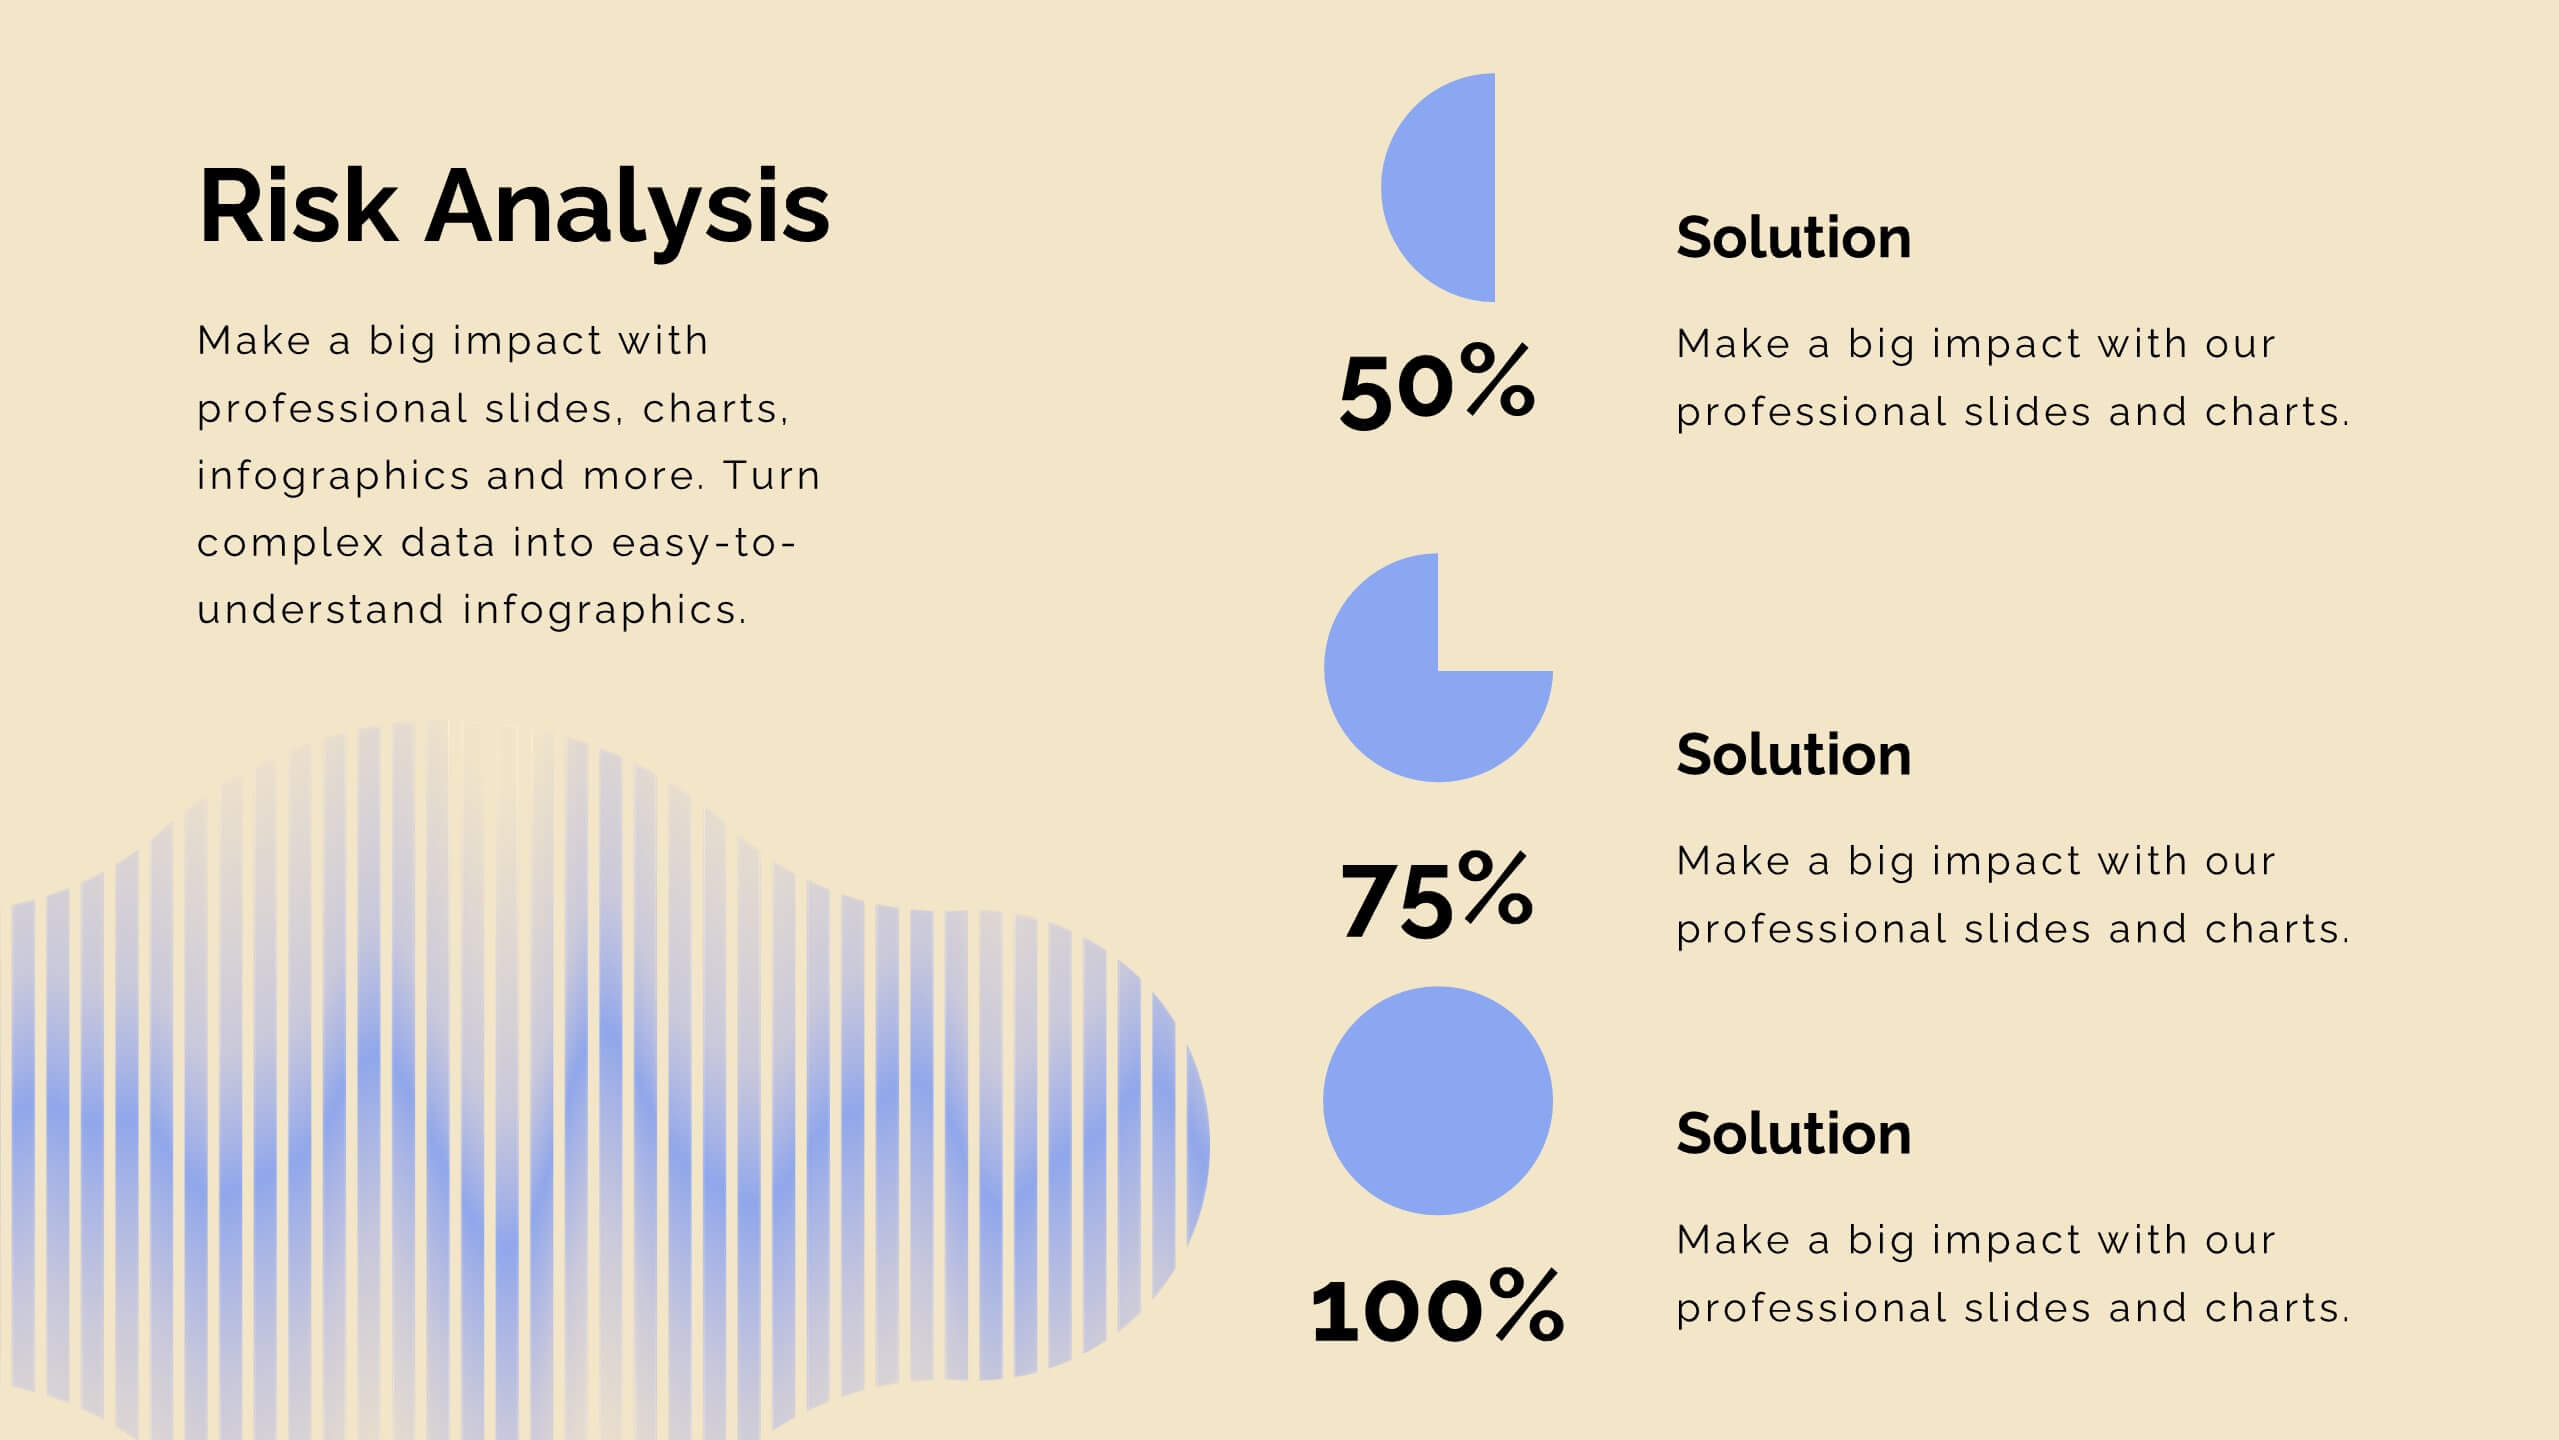
Blaze UX UI Design Pitch Deck Presentation
Craft a visually stunning pitch that brings your UX/UI design process to life with this sleek and modern presentation template. From concept development to final prototypes, each slide is designed to showcase research, wireframes, typography, and more with a seamless, professional aesthetic. Fully compatible with PowerPoint, Keynote, and Google Slides.


7 diapositivas
Flow Chart Diagram
A flowchart diagram is a visual representation that illustrates a process or system by using different symbols and shapes to depict the steps, decisions, and actions involved. Our flow chart diagram infographic is the compass to navigate your concepts into concrete actions. It's a visual roadmap that simplifies complex processes, helping you illustrate the steps in a sequence. This Infographic is your trusted tool for transforming processes into a visually appealing and understandable journey. This tool is designed to be used in various fields, including software development, business process analysis, education, and more, to depict the logical flow.


7 diapositivas
Smile Rating Infographic Presentation Template
Our Smile Rating Infographic is a template that is best used for promoting services. This useful template includes charts that can assist you to convey information about your business, company or product. This Smile Rating infographic is a powerful tool for instilling positive behavior in your customers. This template will show customer's interactions with you and gives you valuable information about what they expect from their most recent experience. This infographic is designed to help your customers rate their experience, and let you know where they think improvements can be made.


22 diapositivas
Virtus Qualitative Research Findings Presentation
This qualitative research findings template features a modern design with geometric shapes and a professional palette of blue, gold, and black. It’s structured to showcase research details effectively, covering objectives, methodology, findings, limitations, and future directions. Compatible with PowerPoint, Keynote, and Google Slides for seamless presentations.


6 diapositivas
30 60 90 Manager Infographic
A 30-60-90 day plan outlines an individual's goals and tasks for the first three months of a new job, project, or role. This infographic template outlines the goals and tasks a manager plans to achieve during the first 30, 60, and 90 days of their role. This is a helpful tool to communicate objectives and strategy to your team. Design the infographic so that it's easy to share. The 30-60-90 Manager Infographic serves as a roadmap for the manager's initial months and provides transparency to their team about their goals and priorities. Use a consistent color scheme that aligns with your company's branding.


7 diapositivas
Gantt Chart Management Infographic
Elevate your project planning with our gantt chart management infographic. Laid out on a pristine white backdrop and highlighted with the professional shades of blue, regal purple, energetic red, and growth-centric green, this template is the epitome of structured time management. Equipped with illustrative infographics, symbolic icons, and dedicated image placeholders, it breaks down project timelines and tasks with immaculate precision. Immaculately tailored for Powerpoint, Keynote, or Google Slides. An invaluable asset for project managers, team leaders, corporate trainers, or anyone aiming for meticulous time tracking and project progression.


23 diapositivas
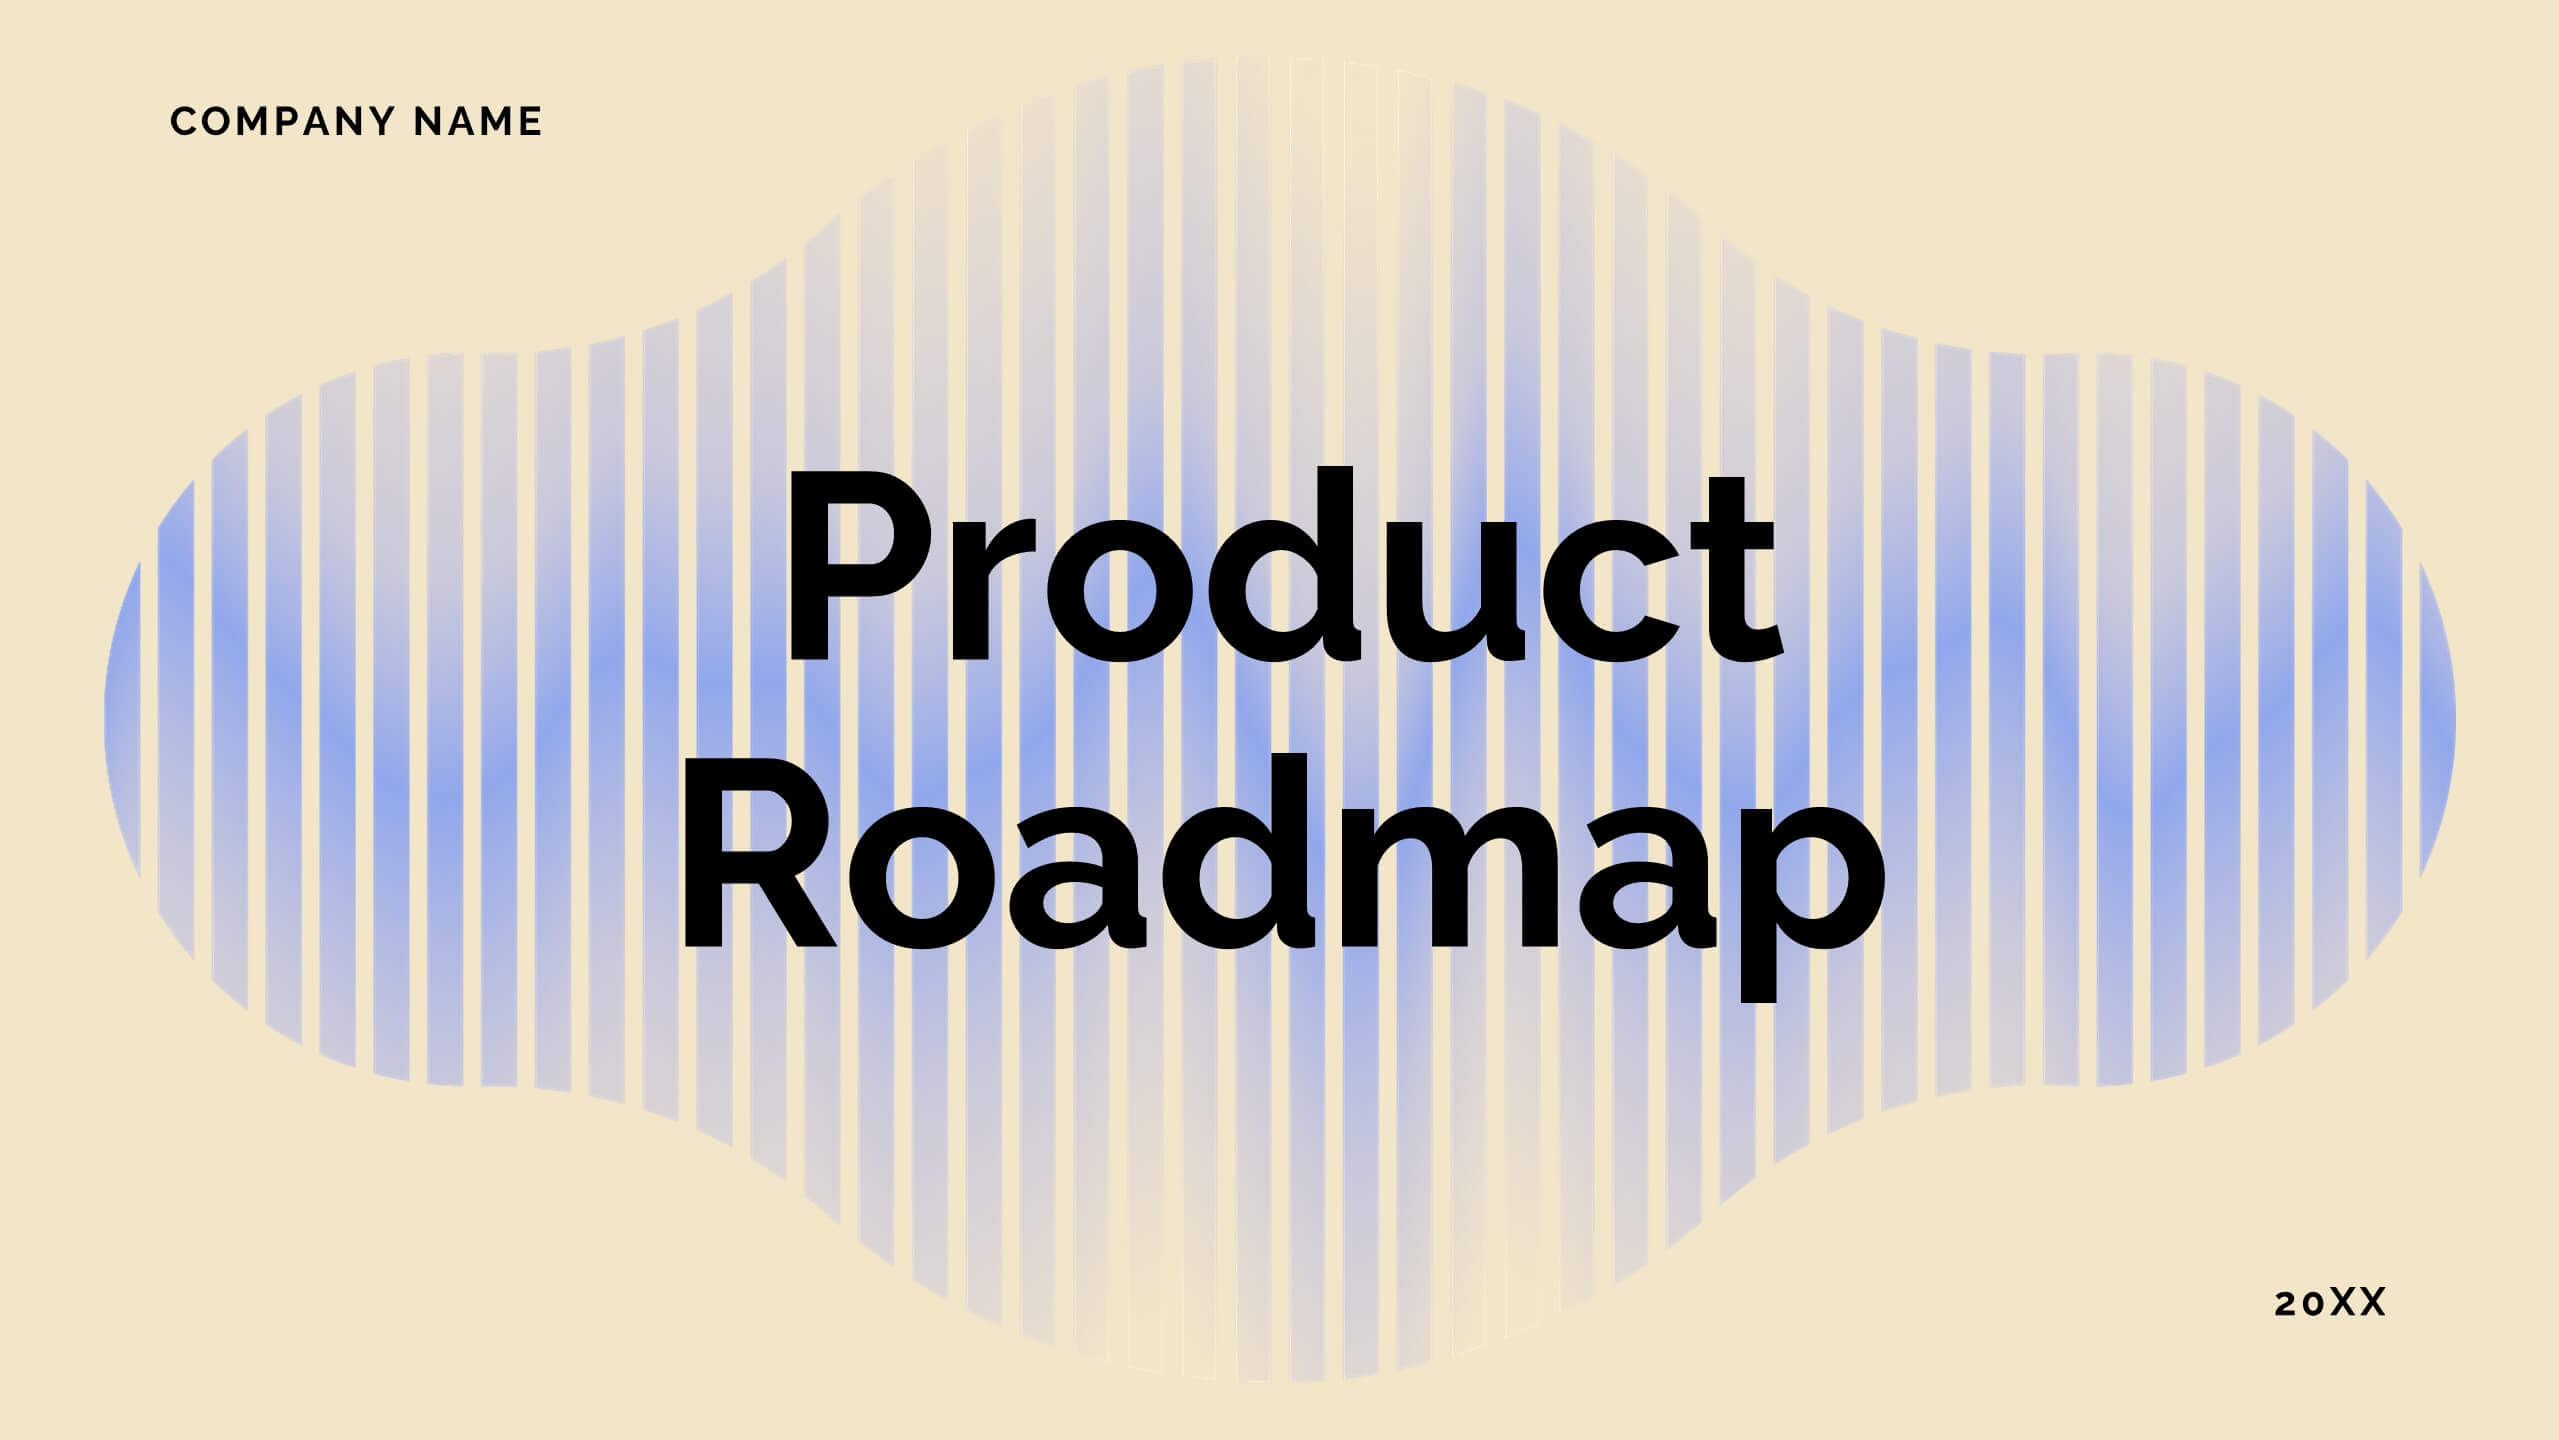
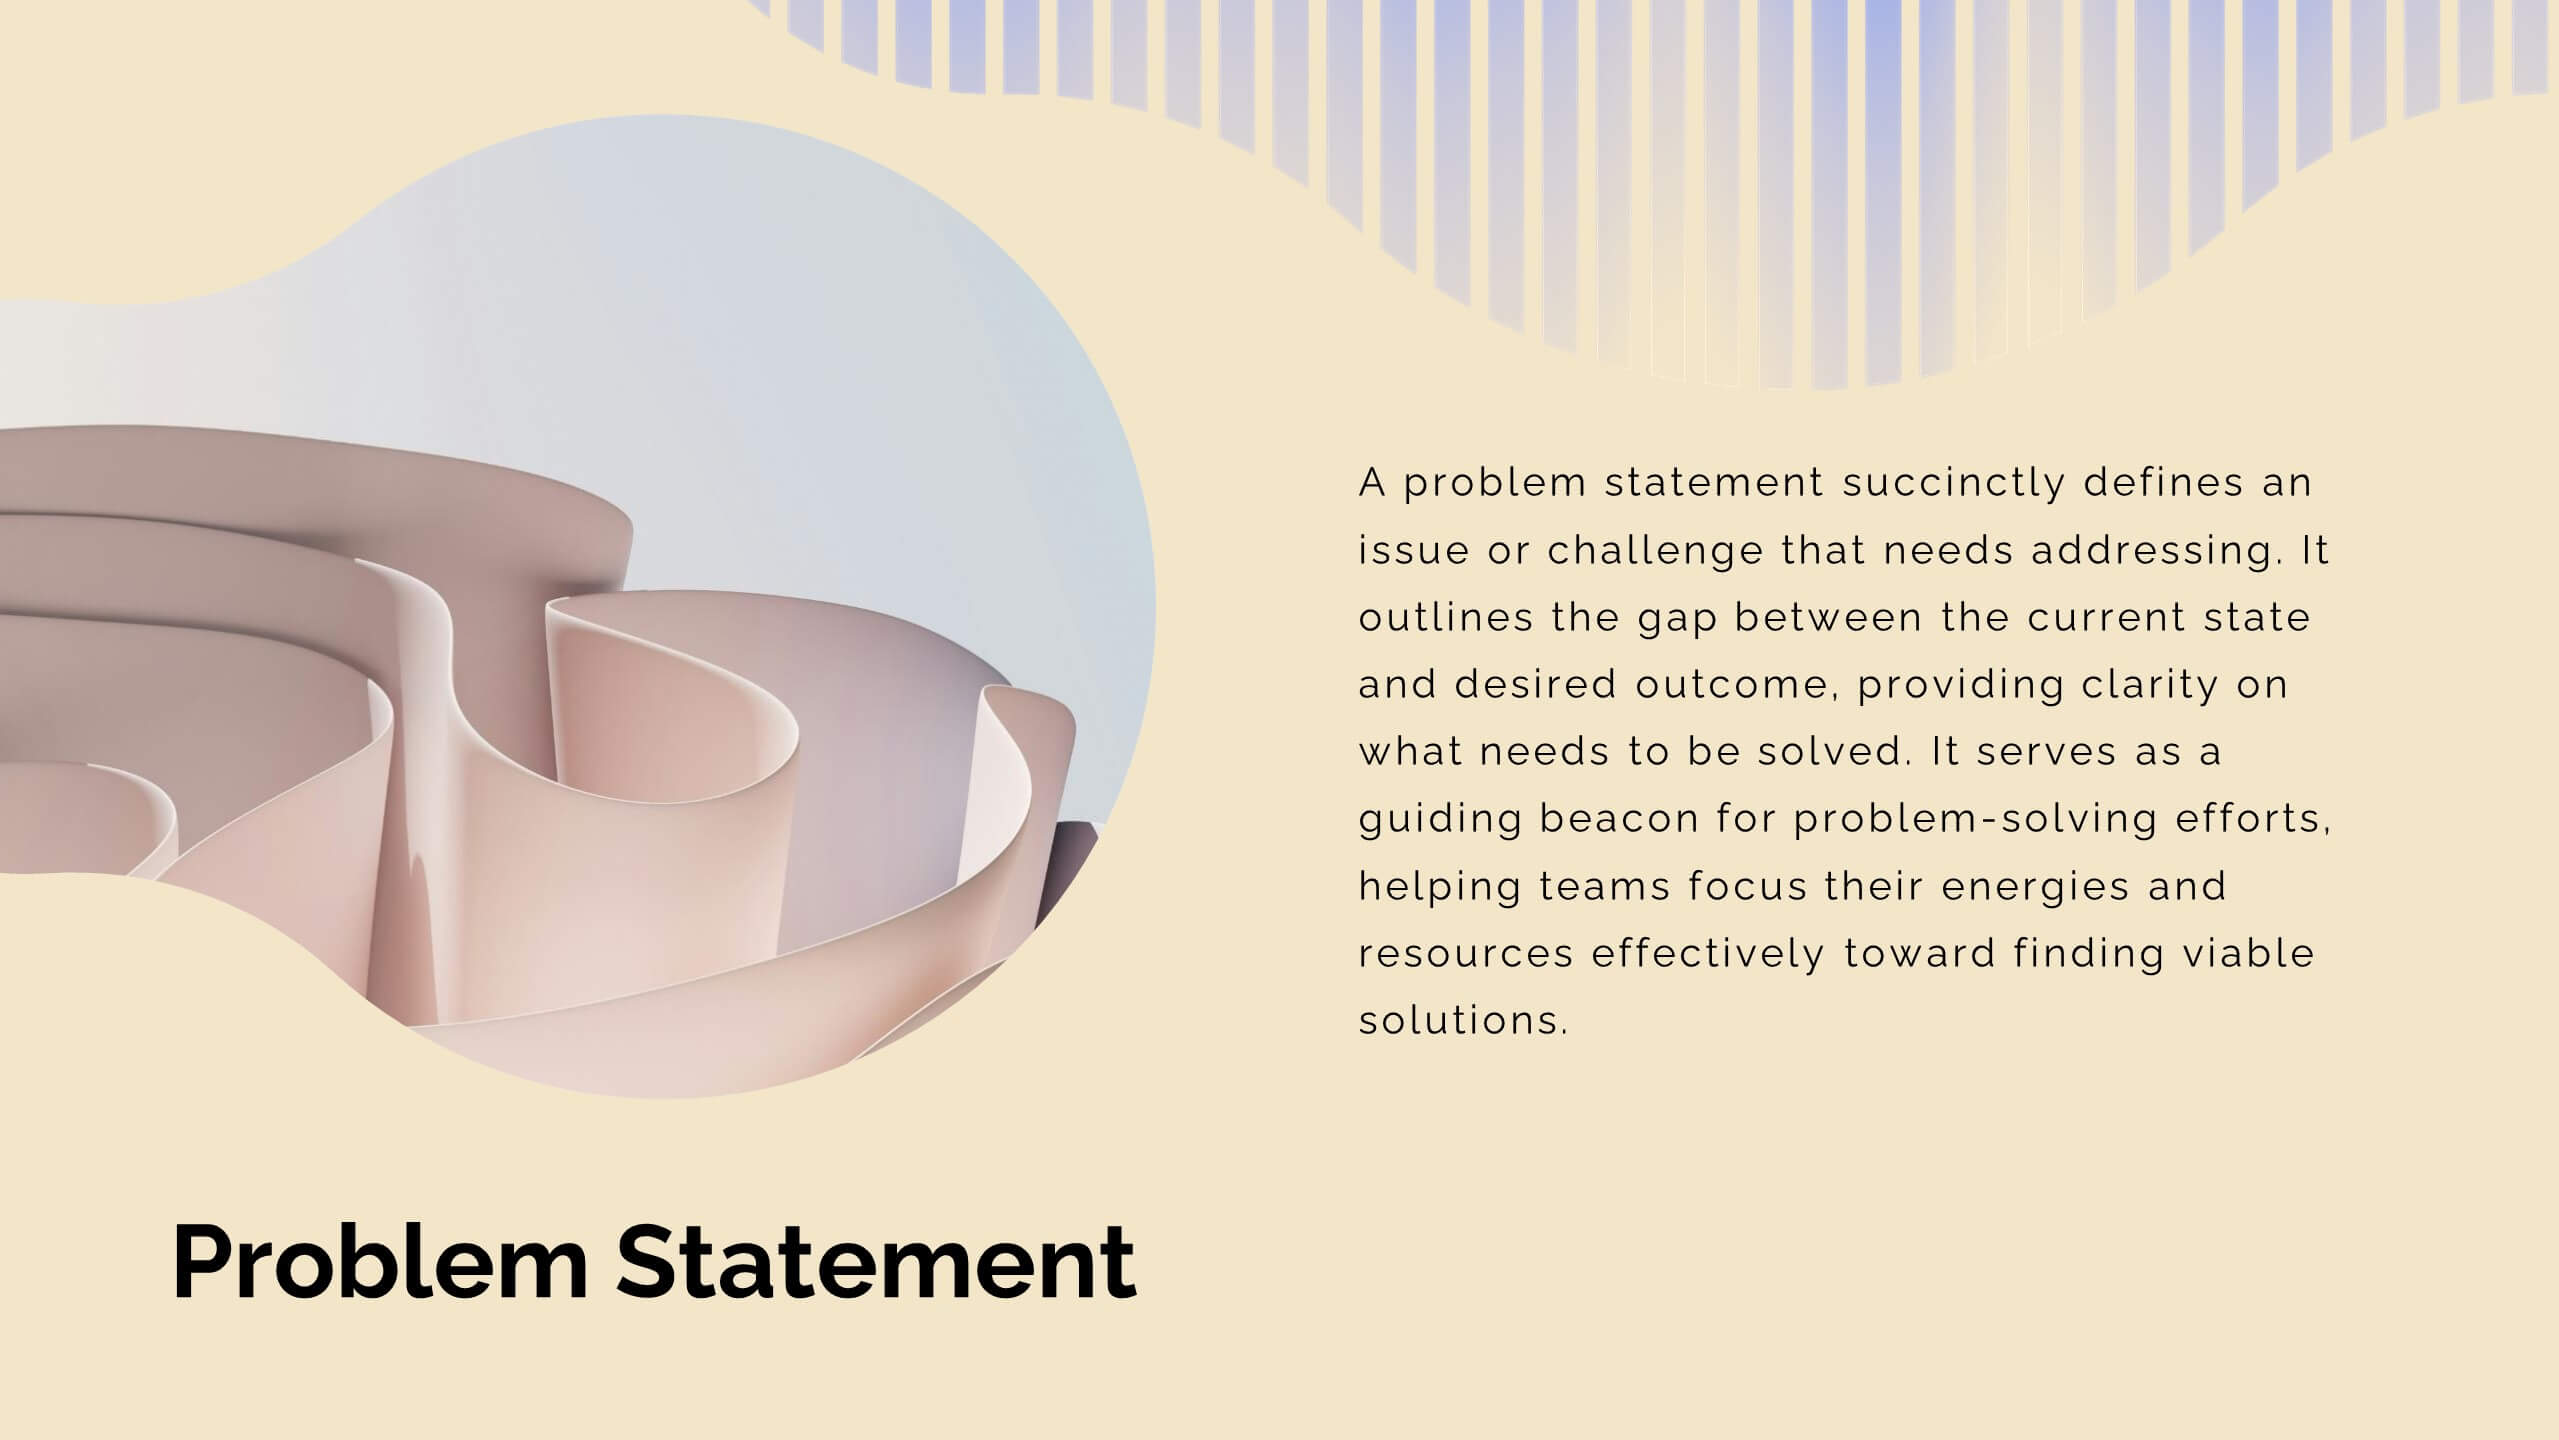
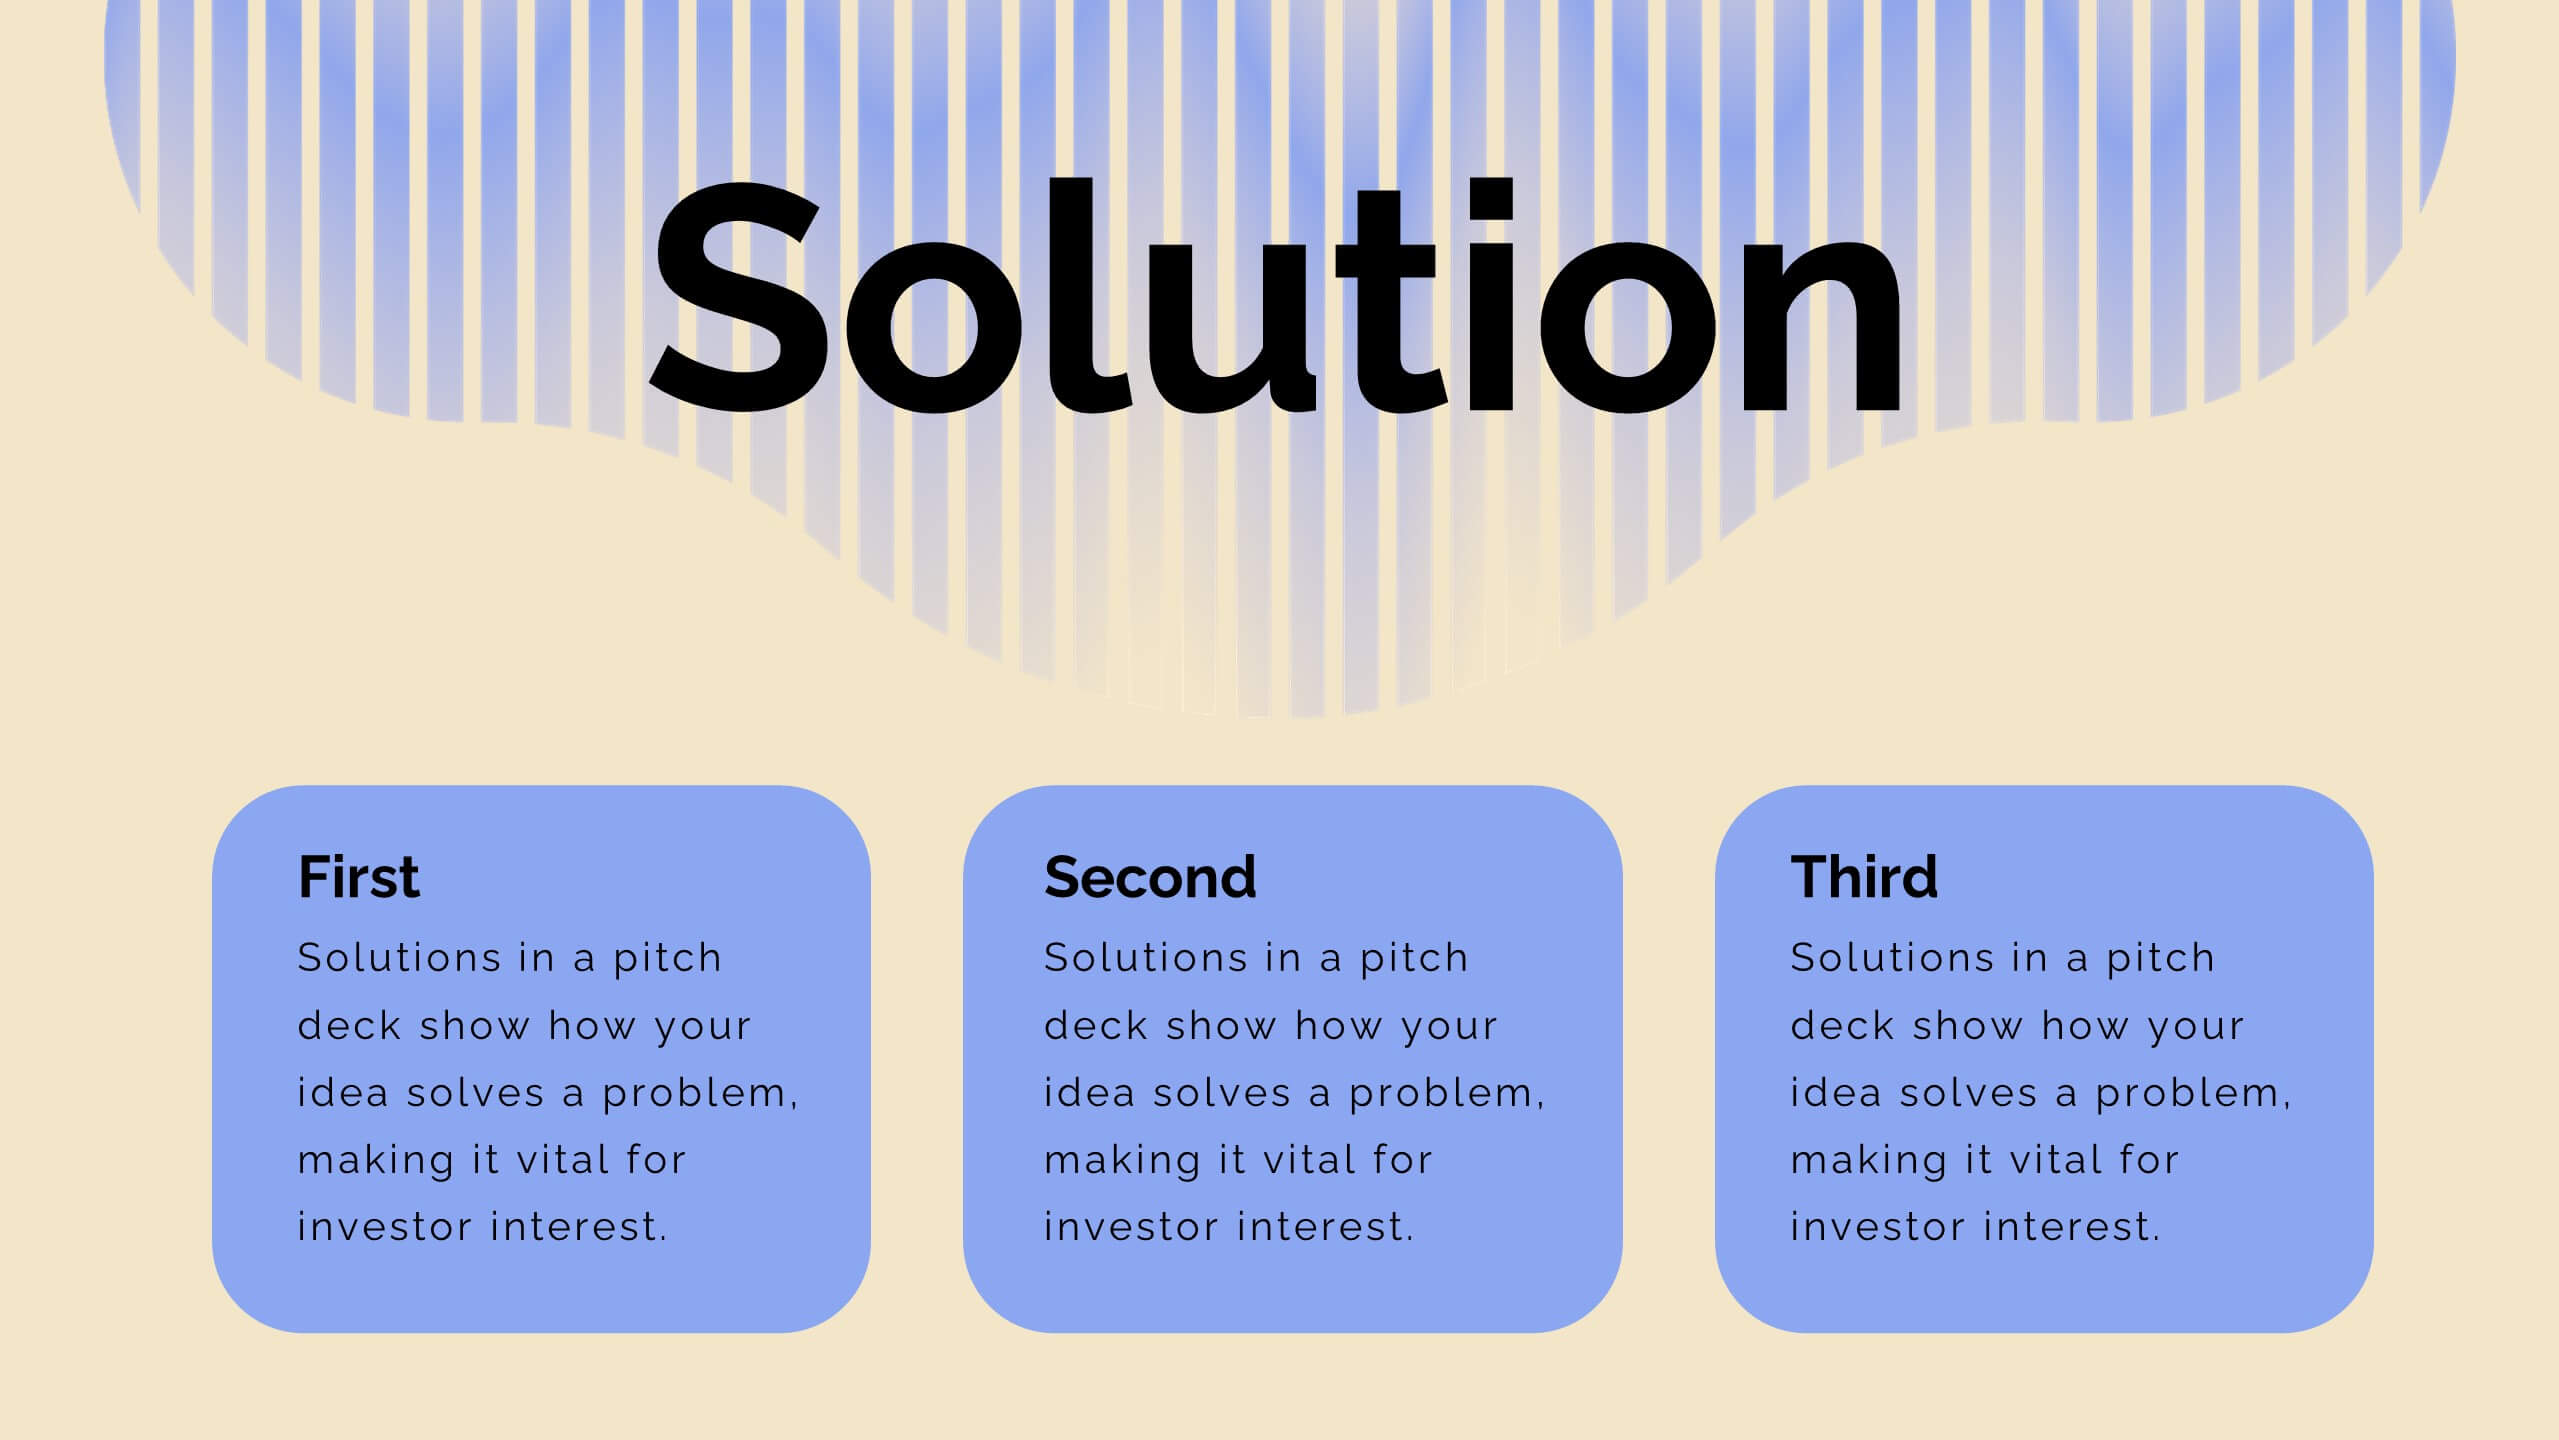
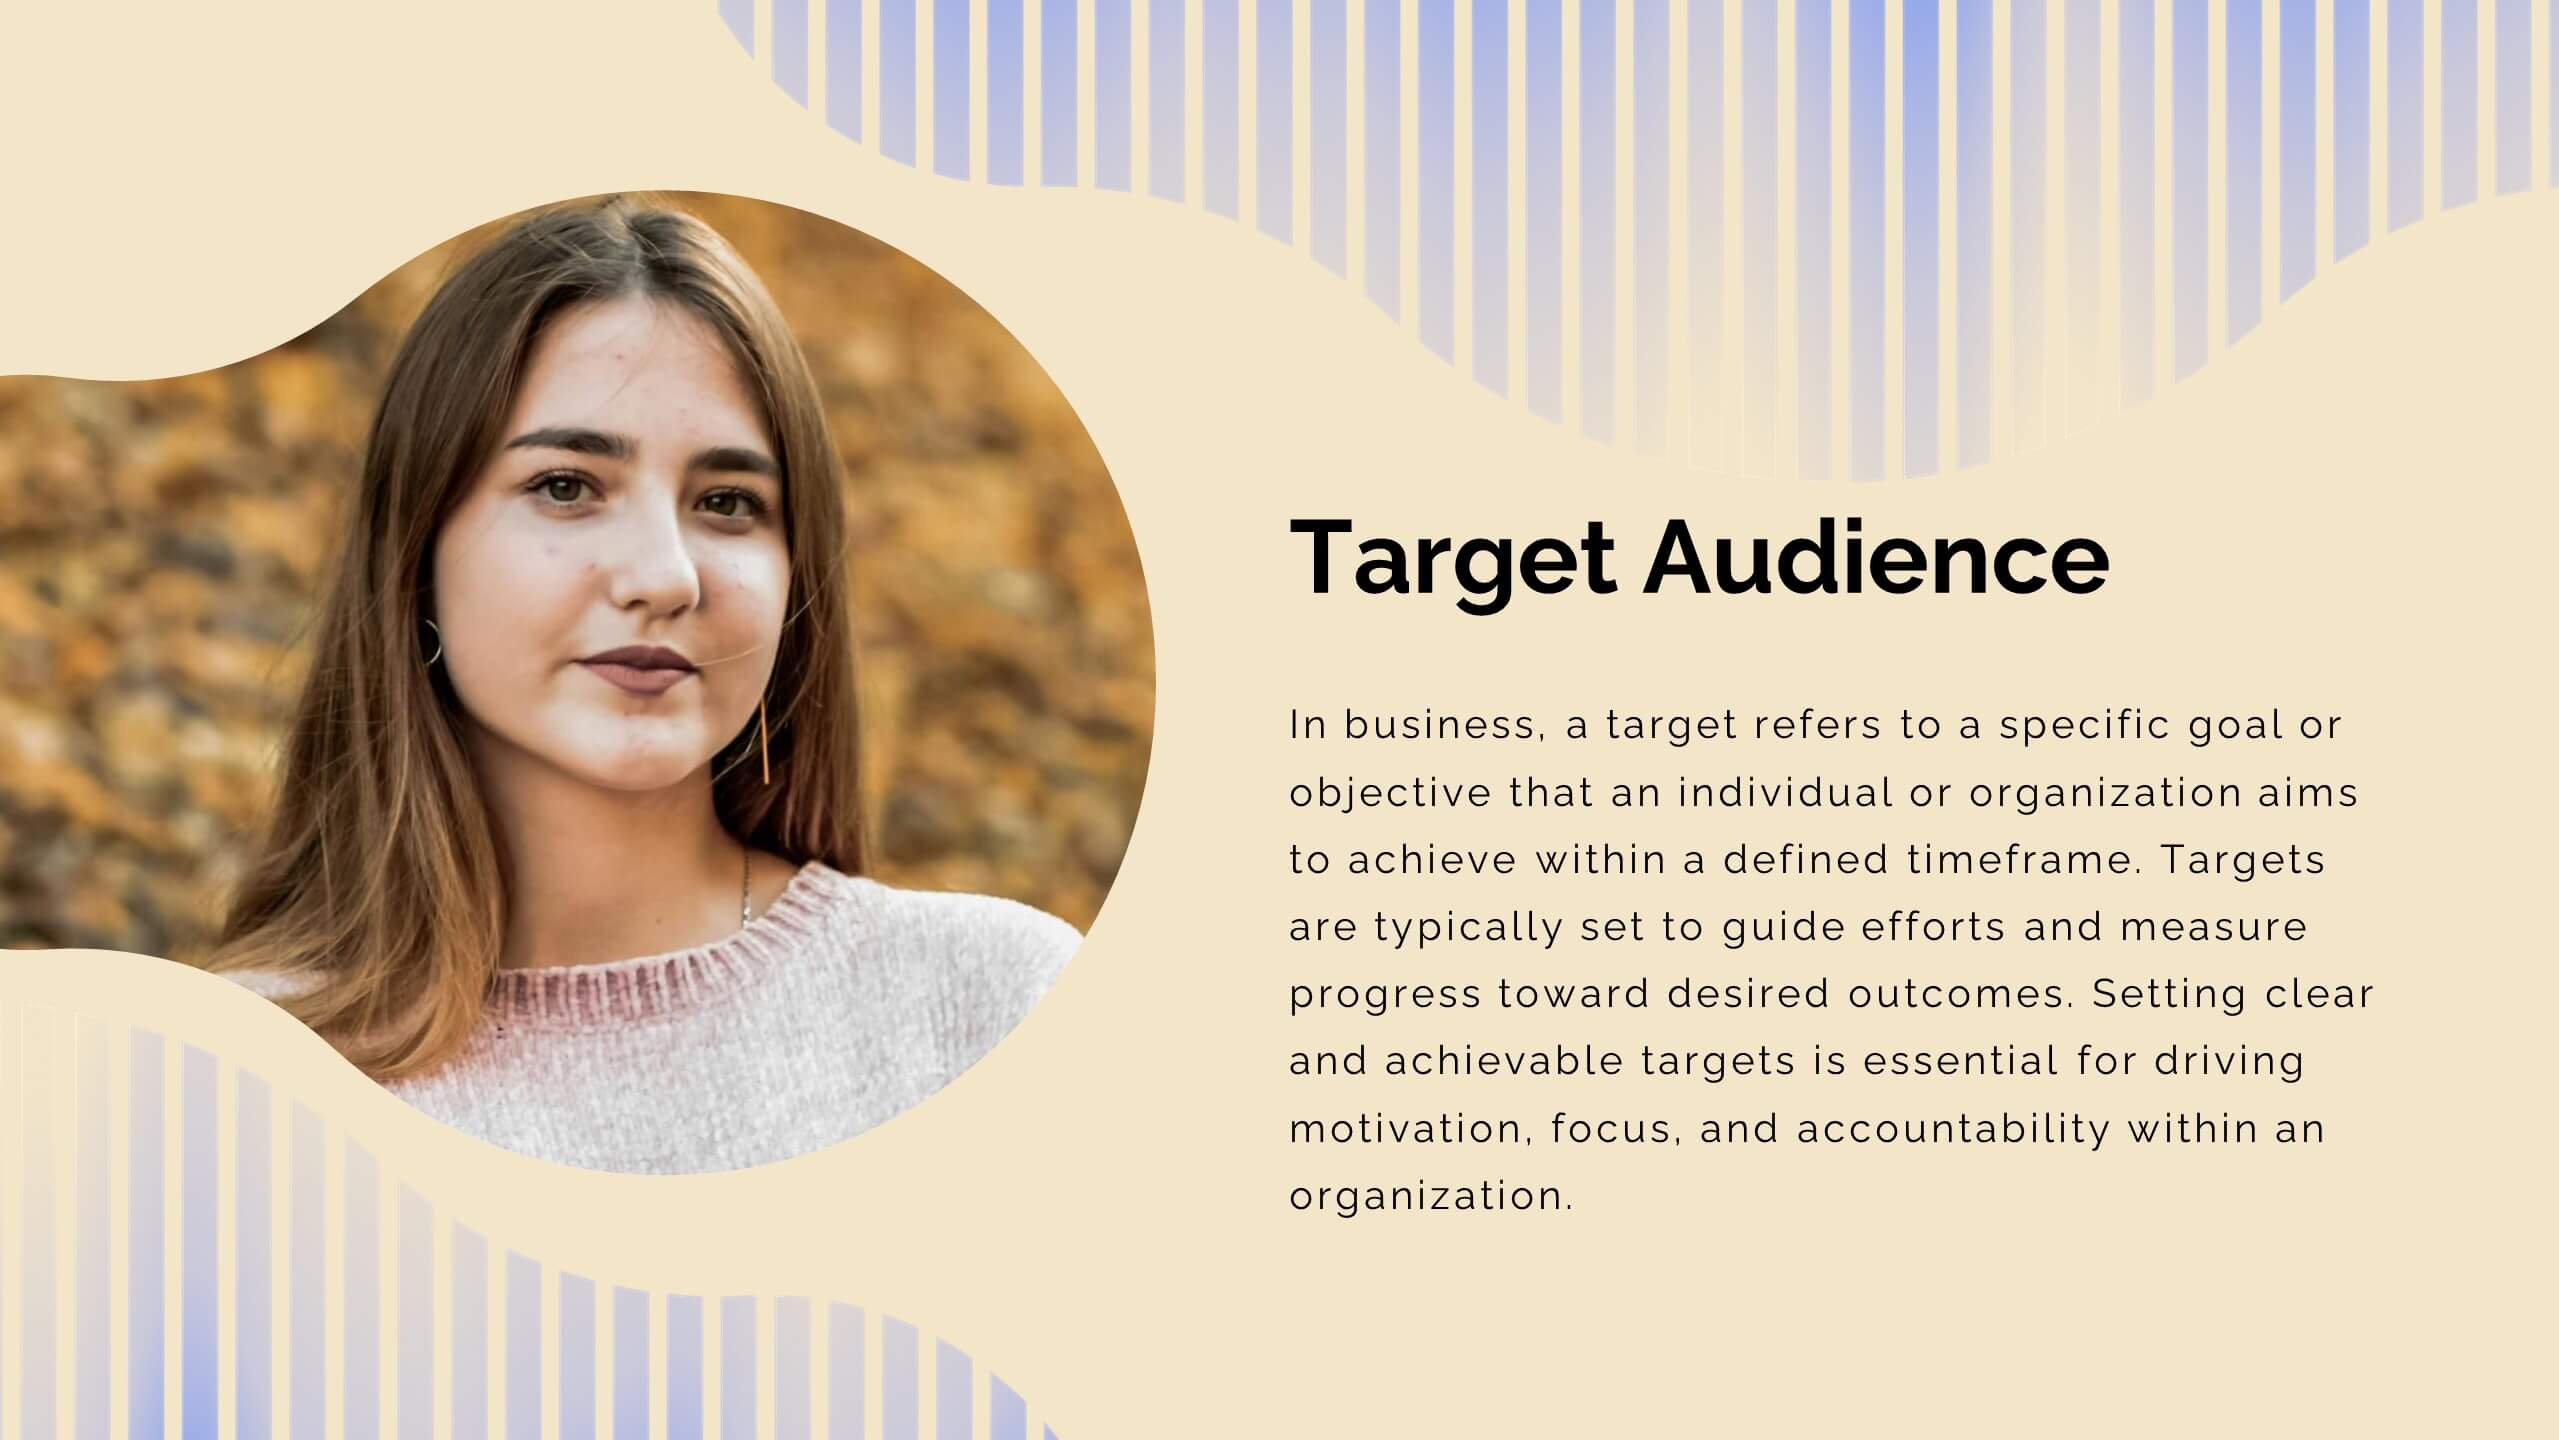
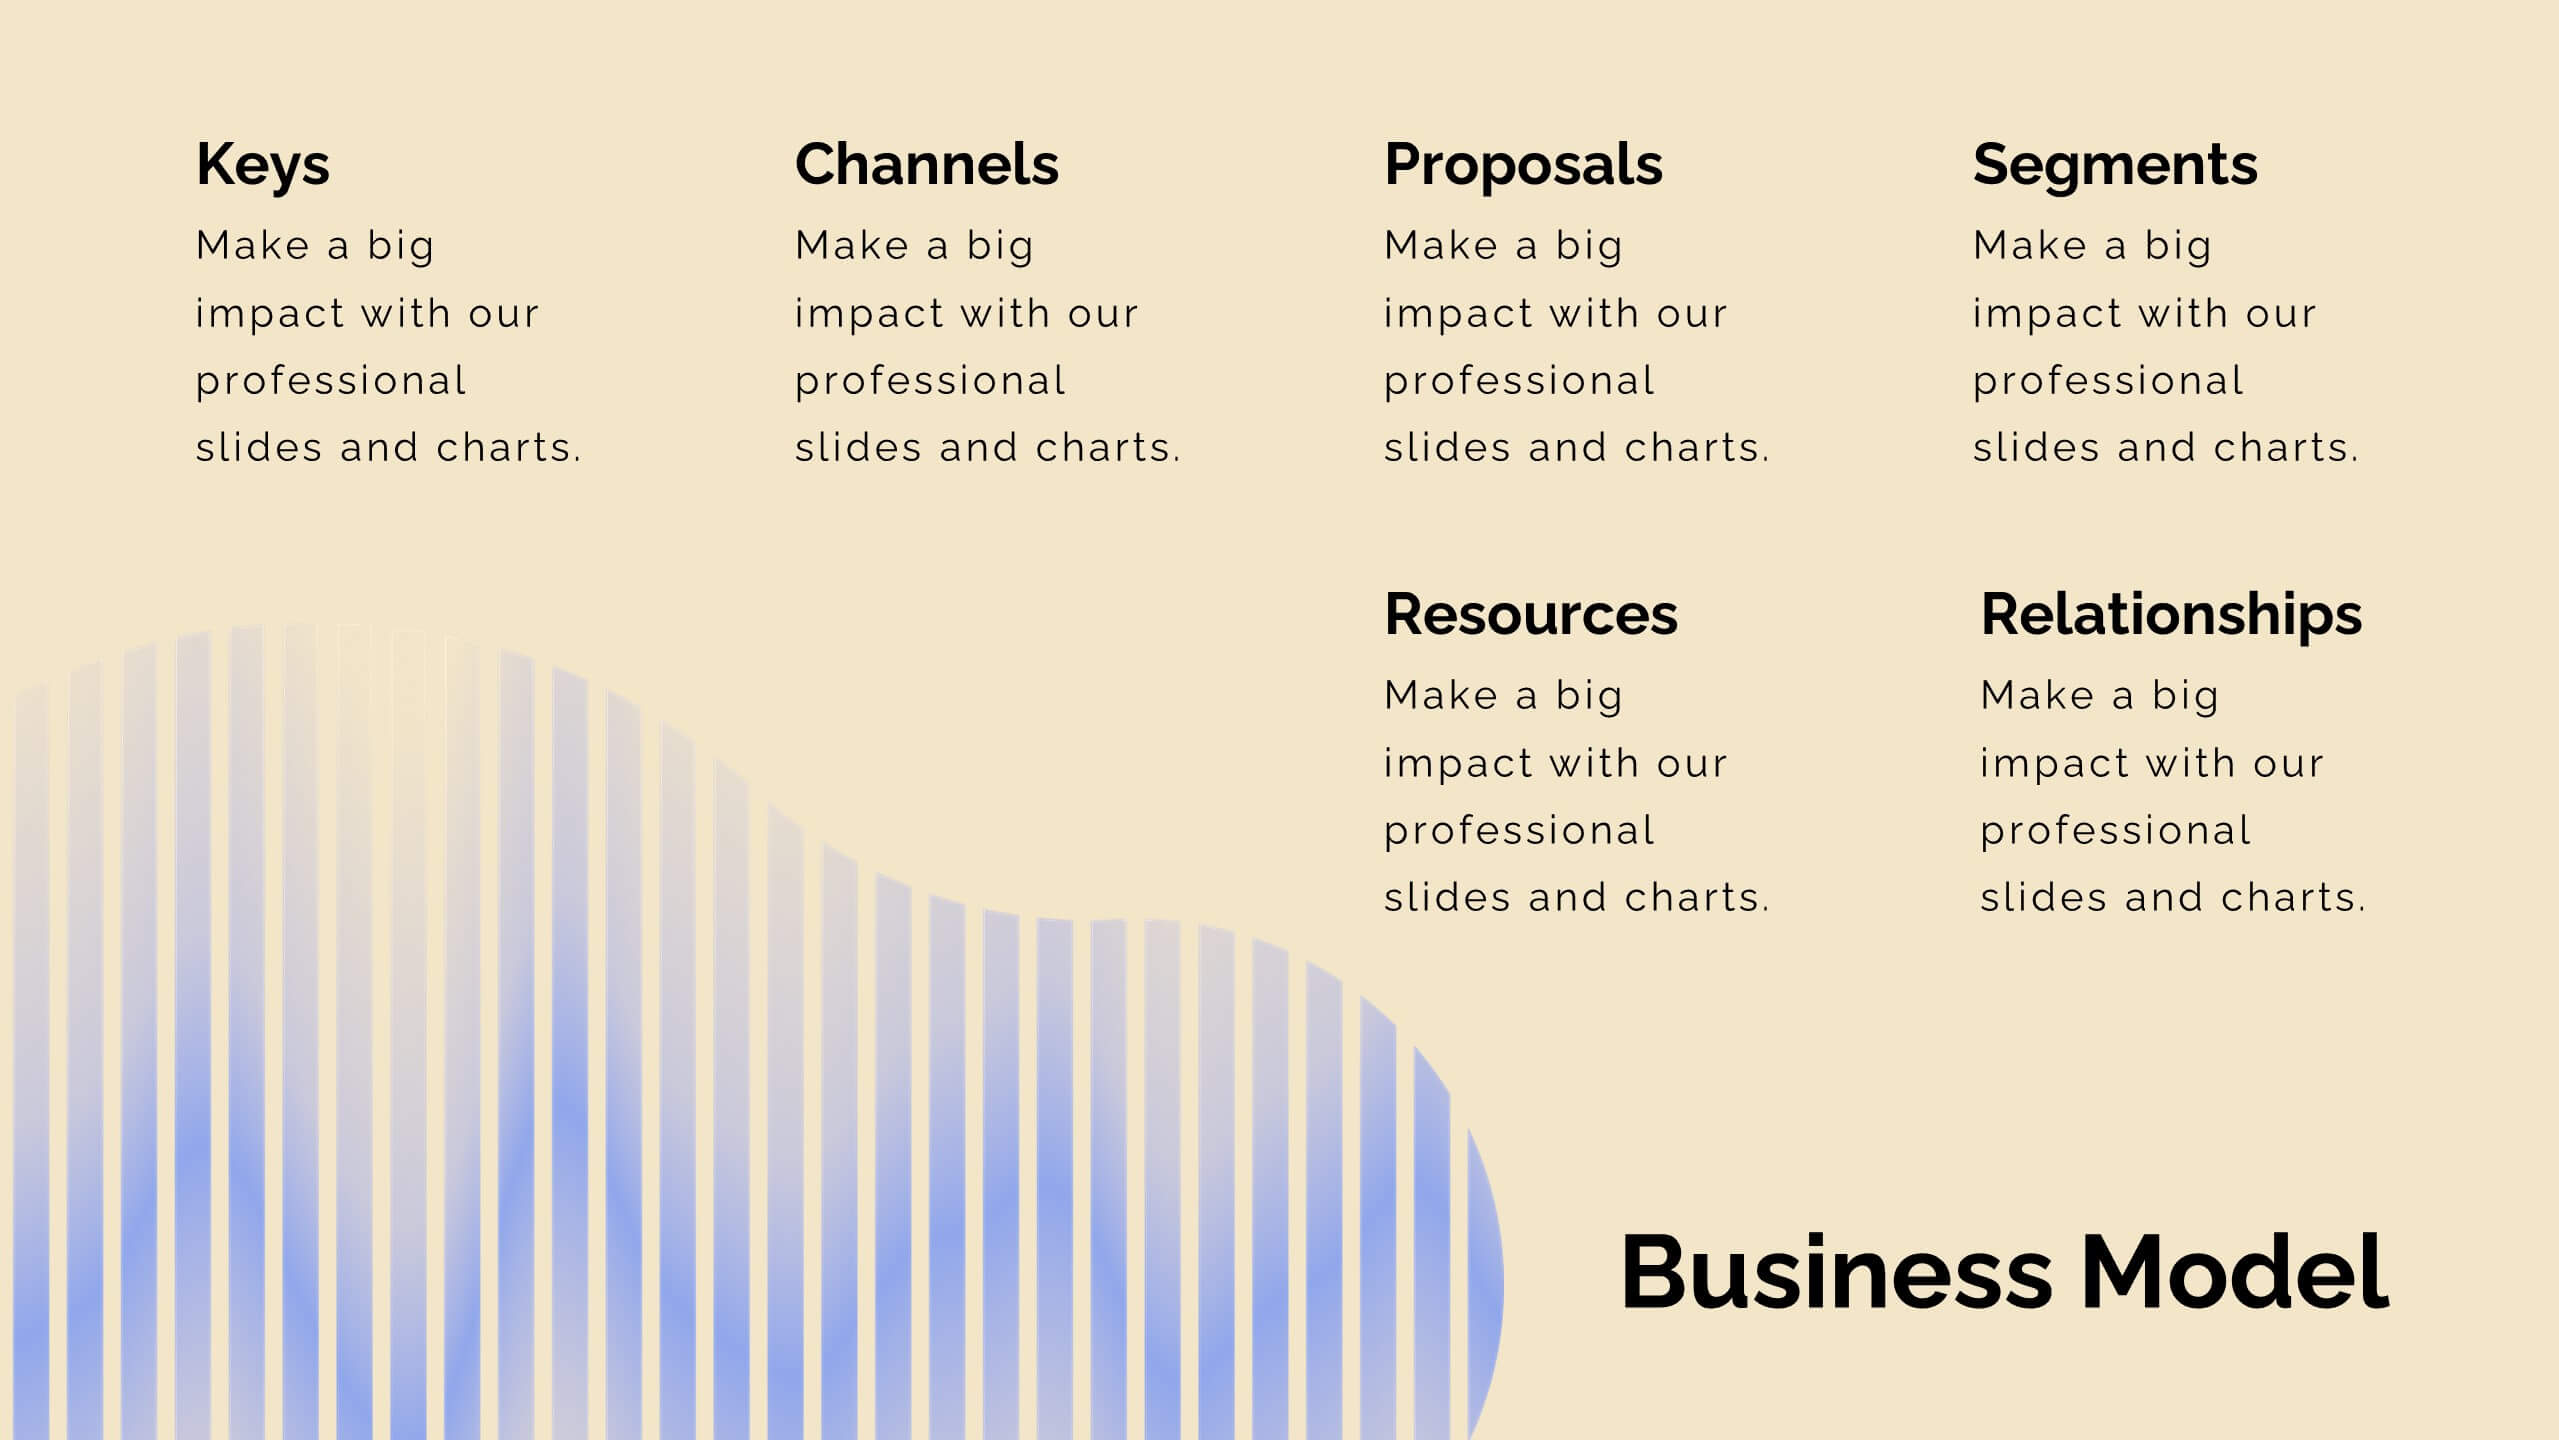
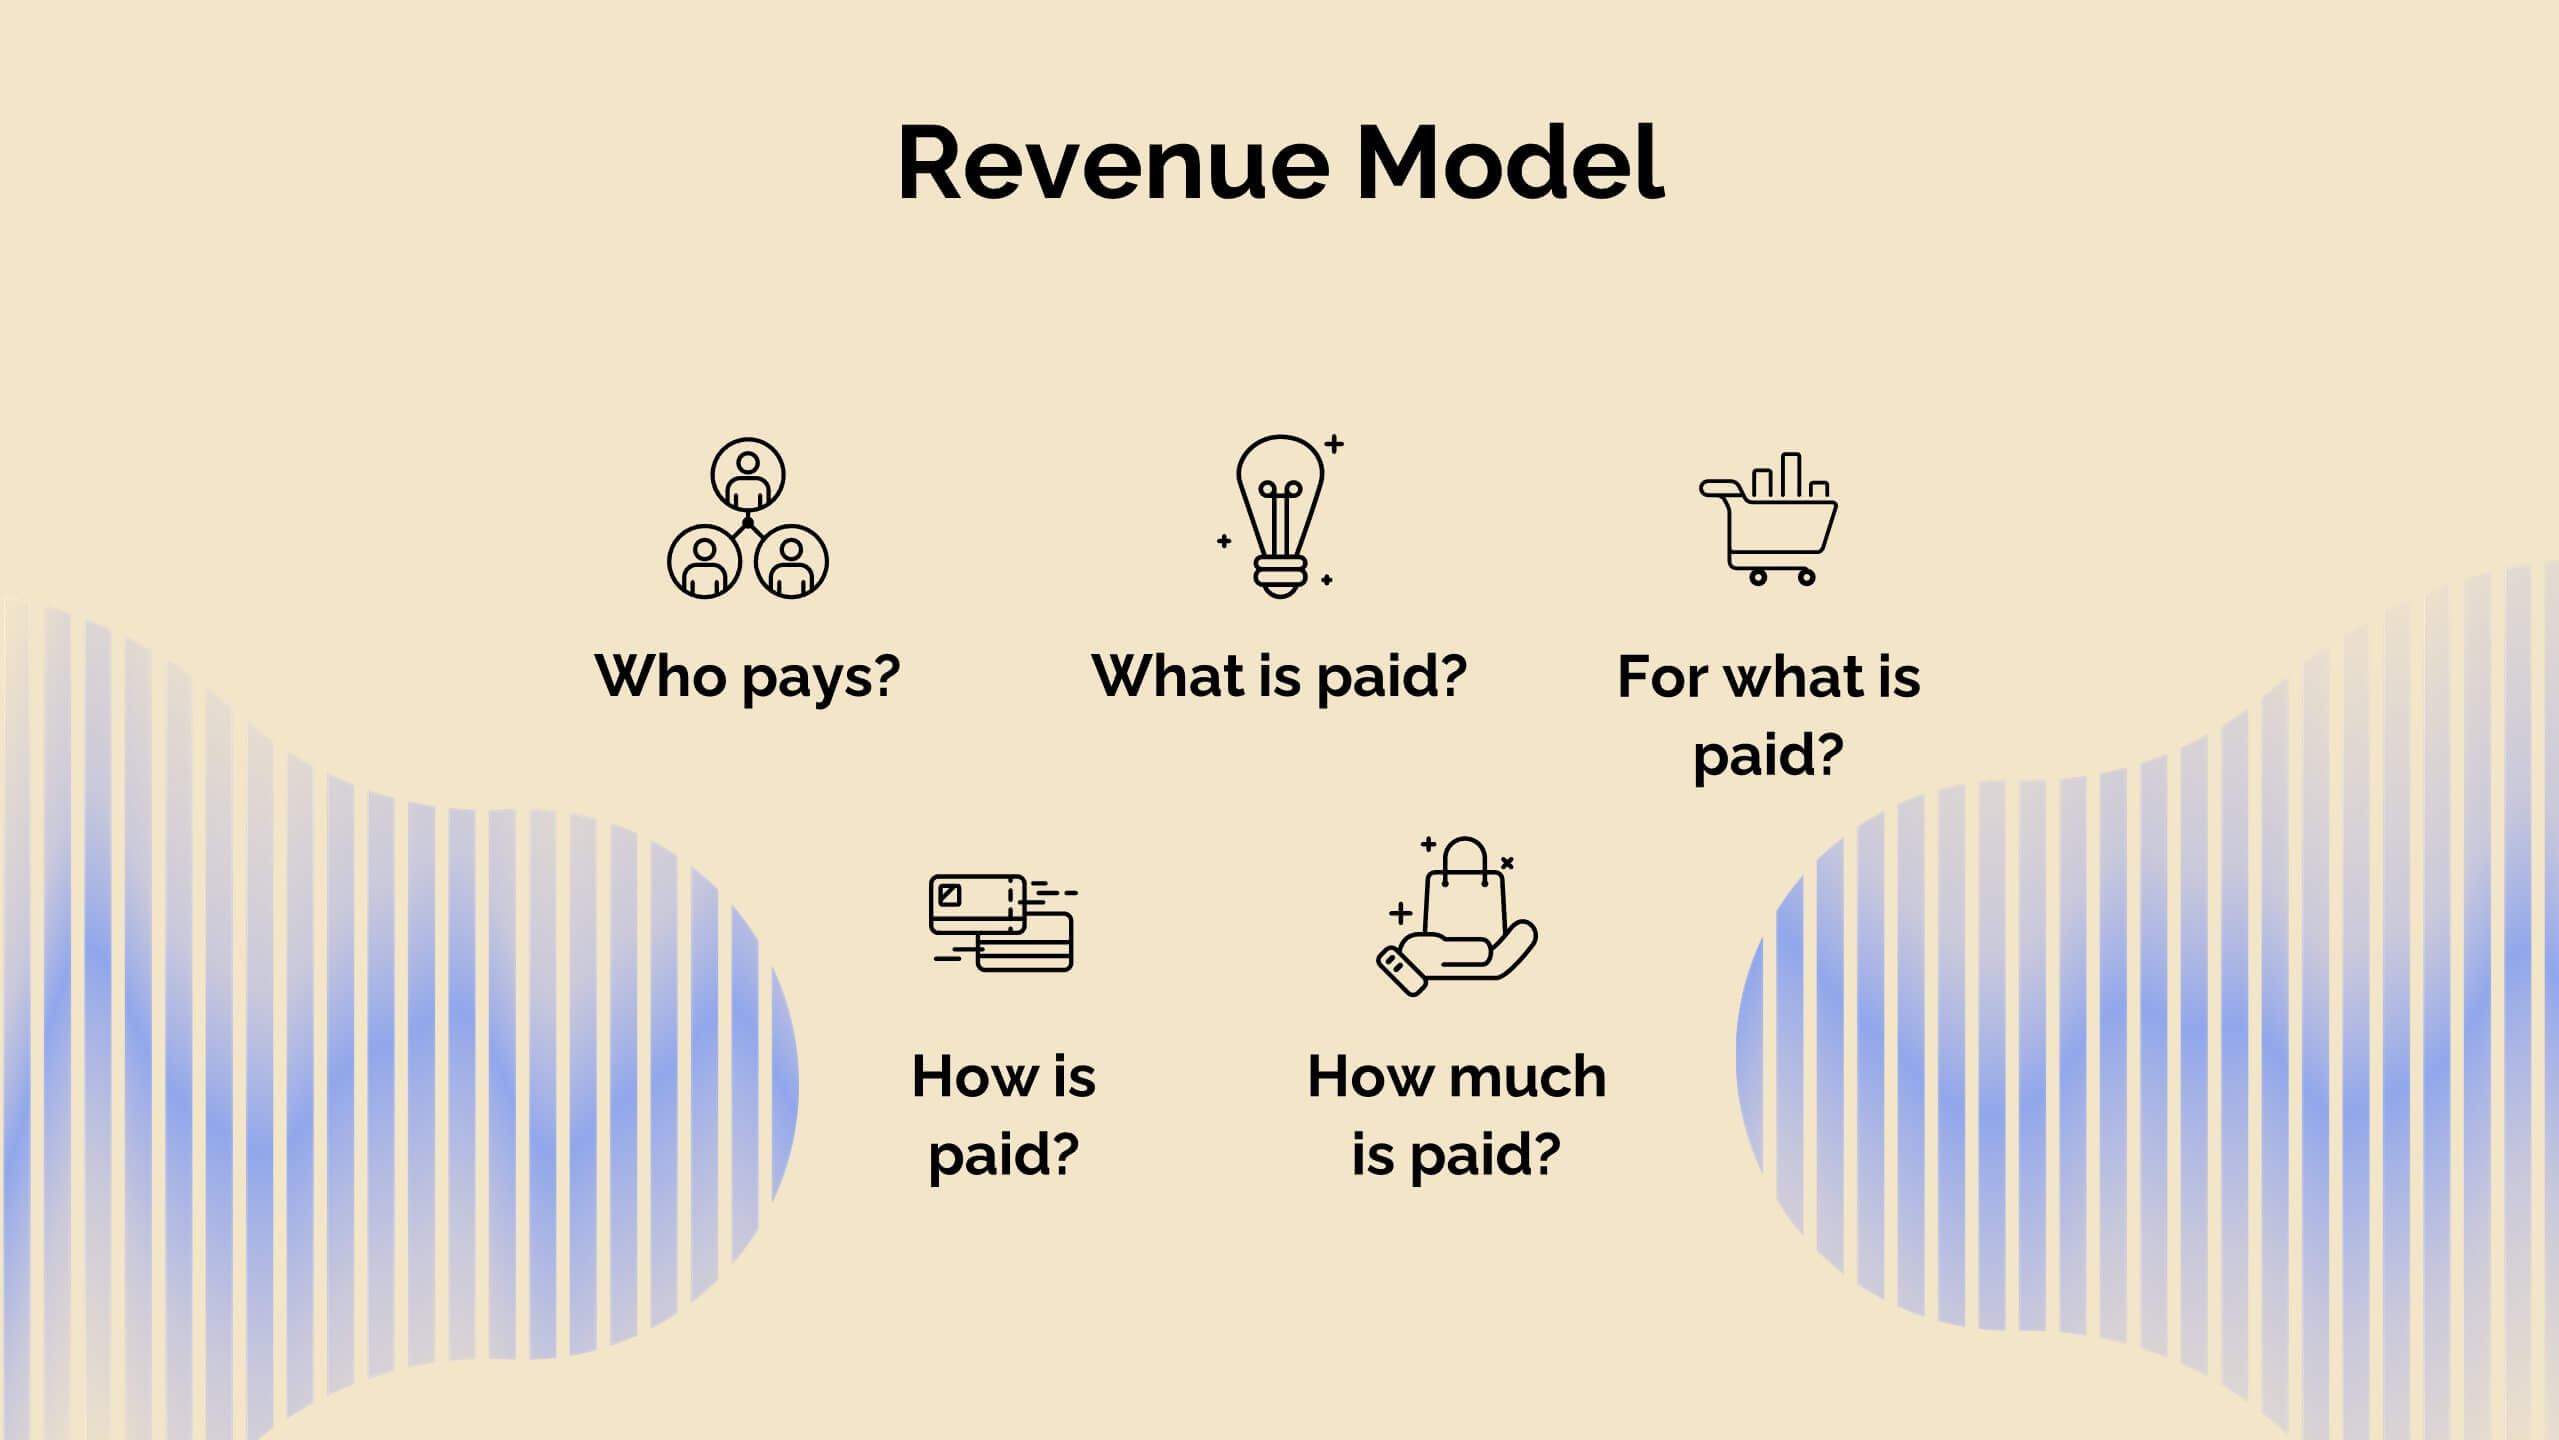
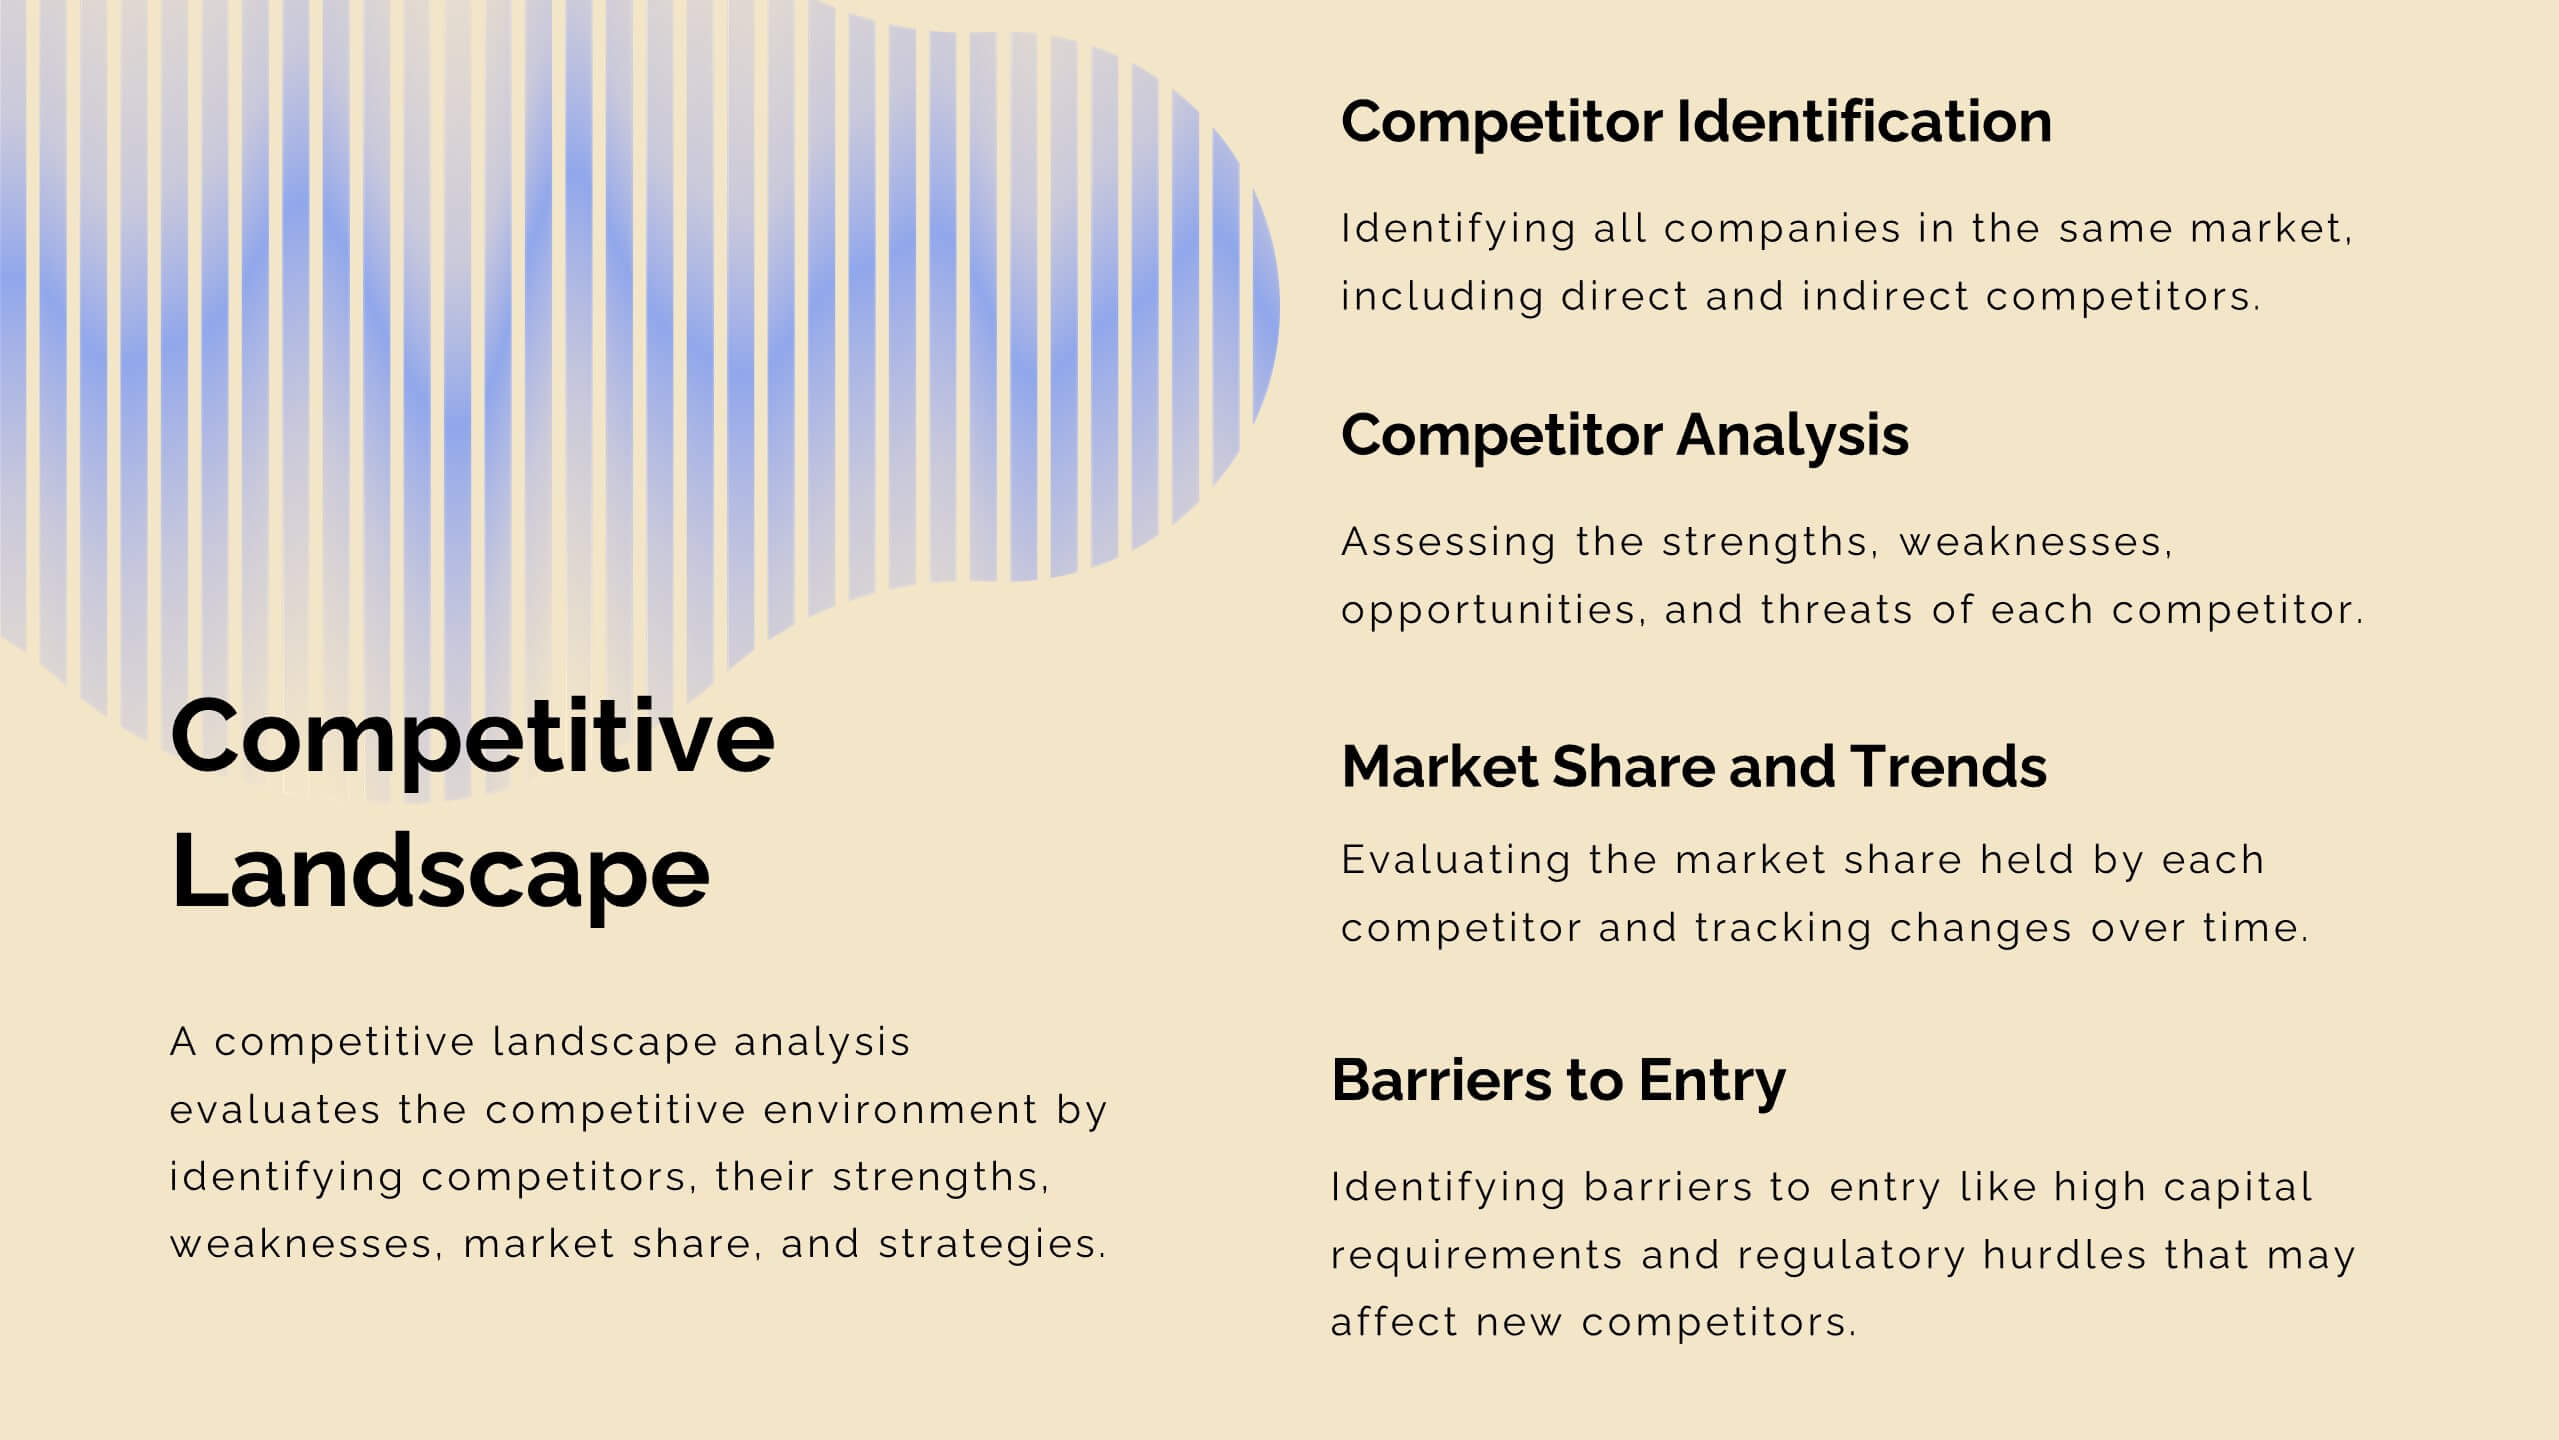
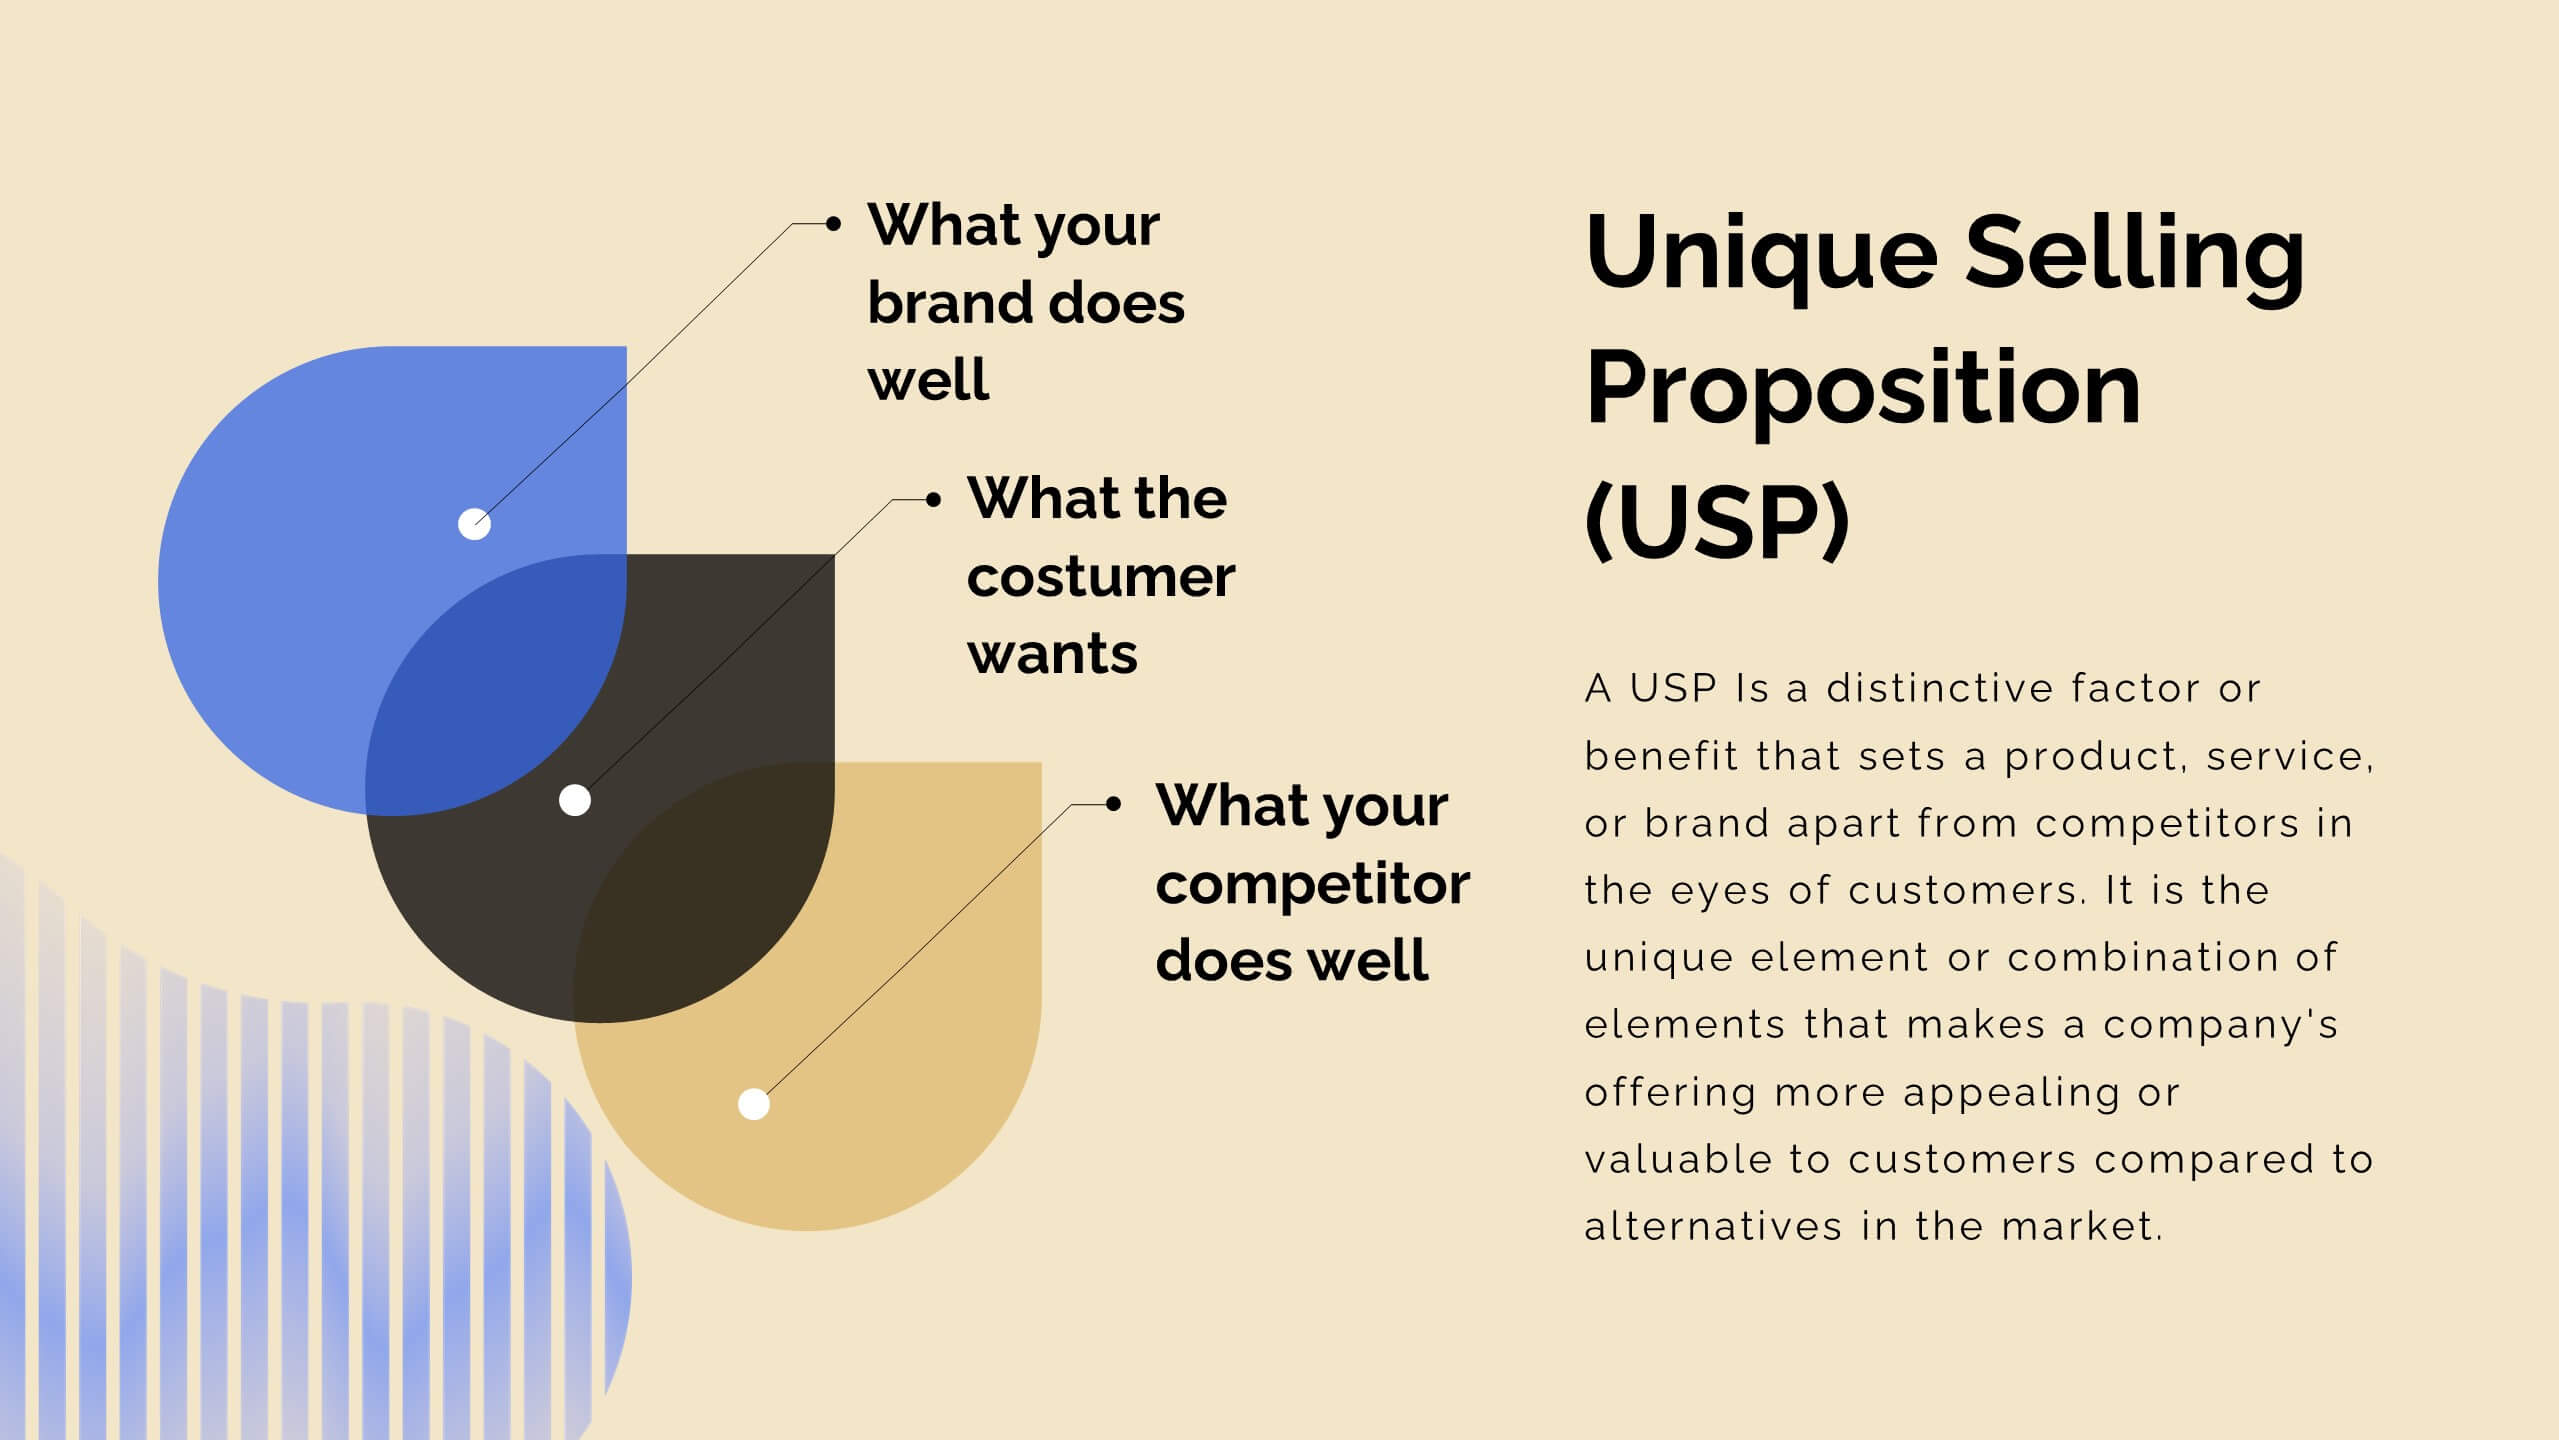
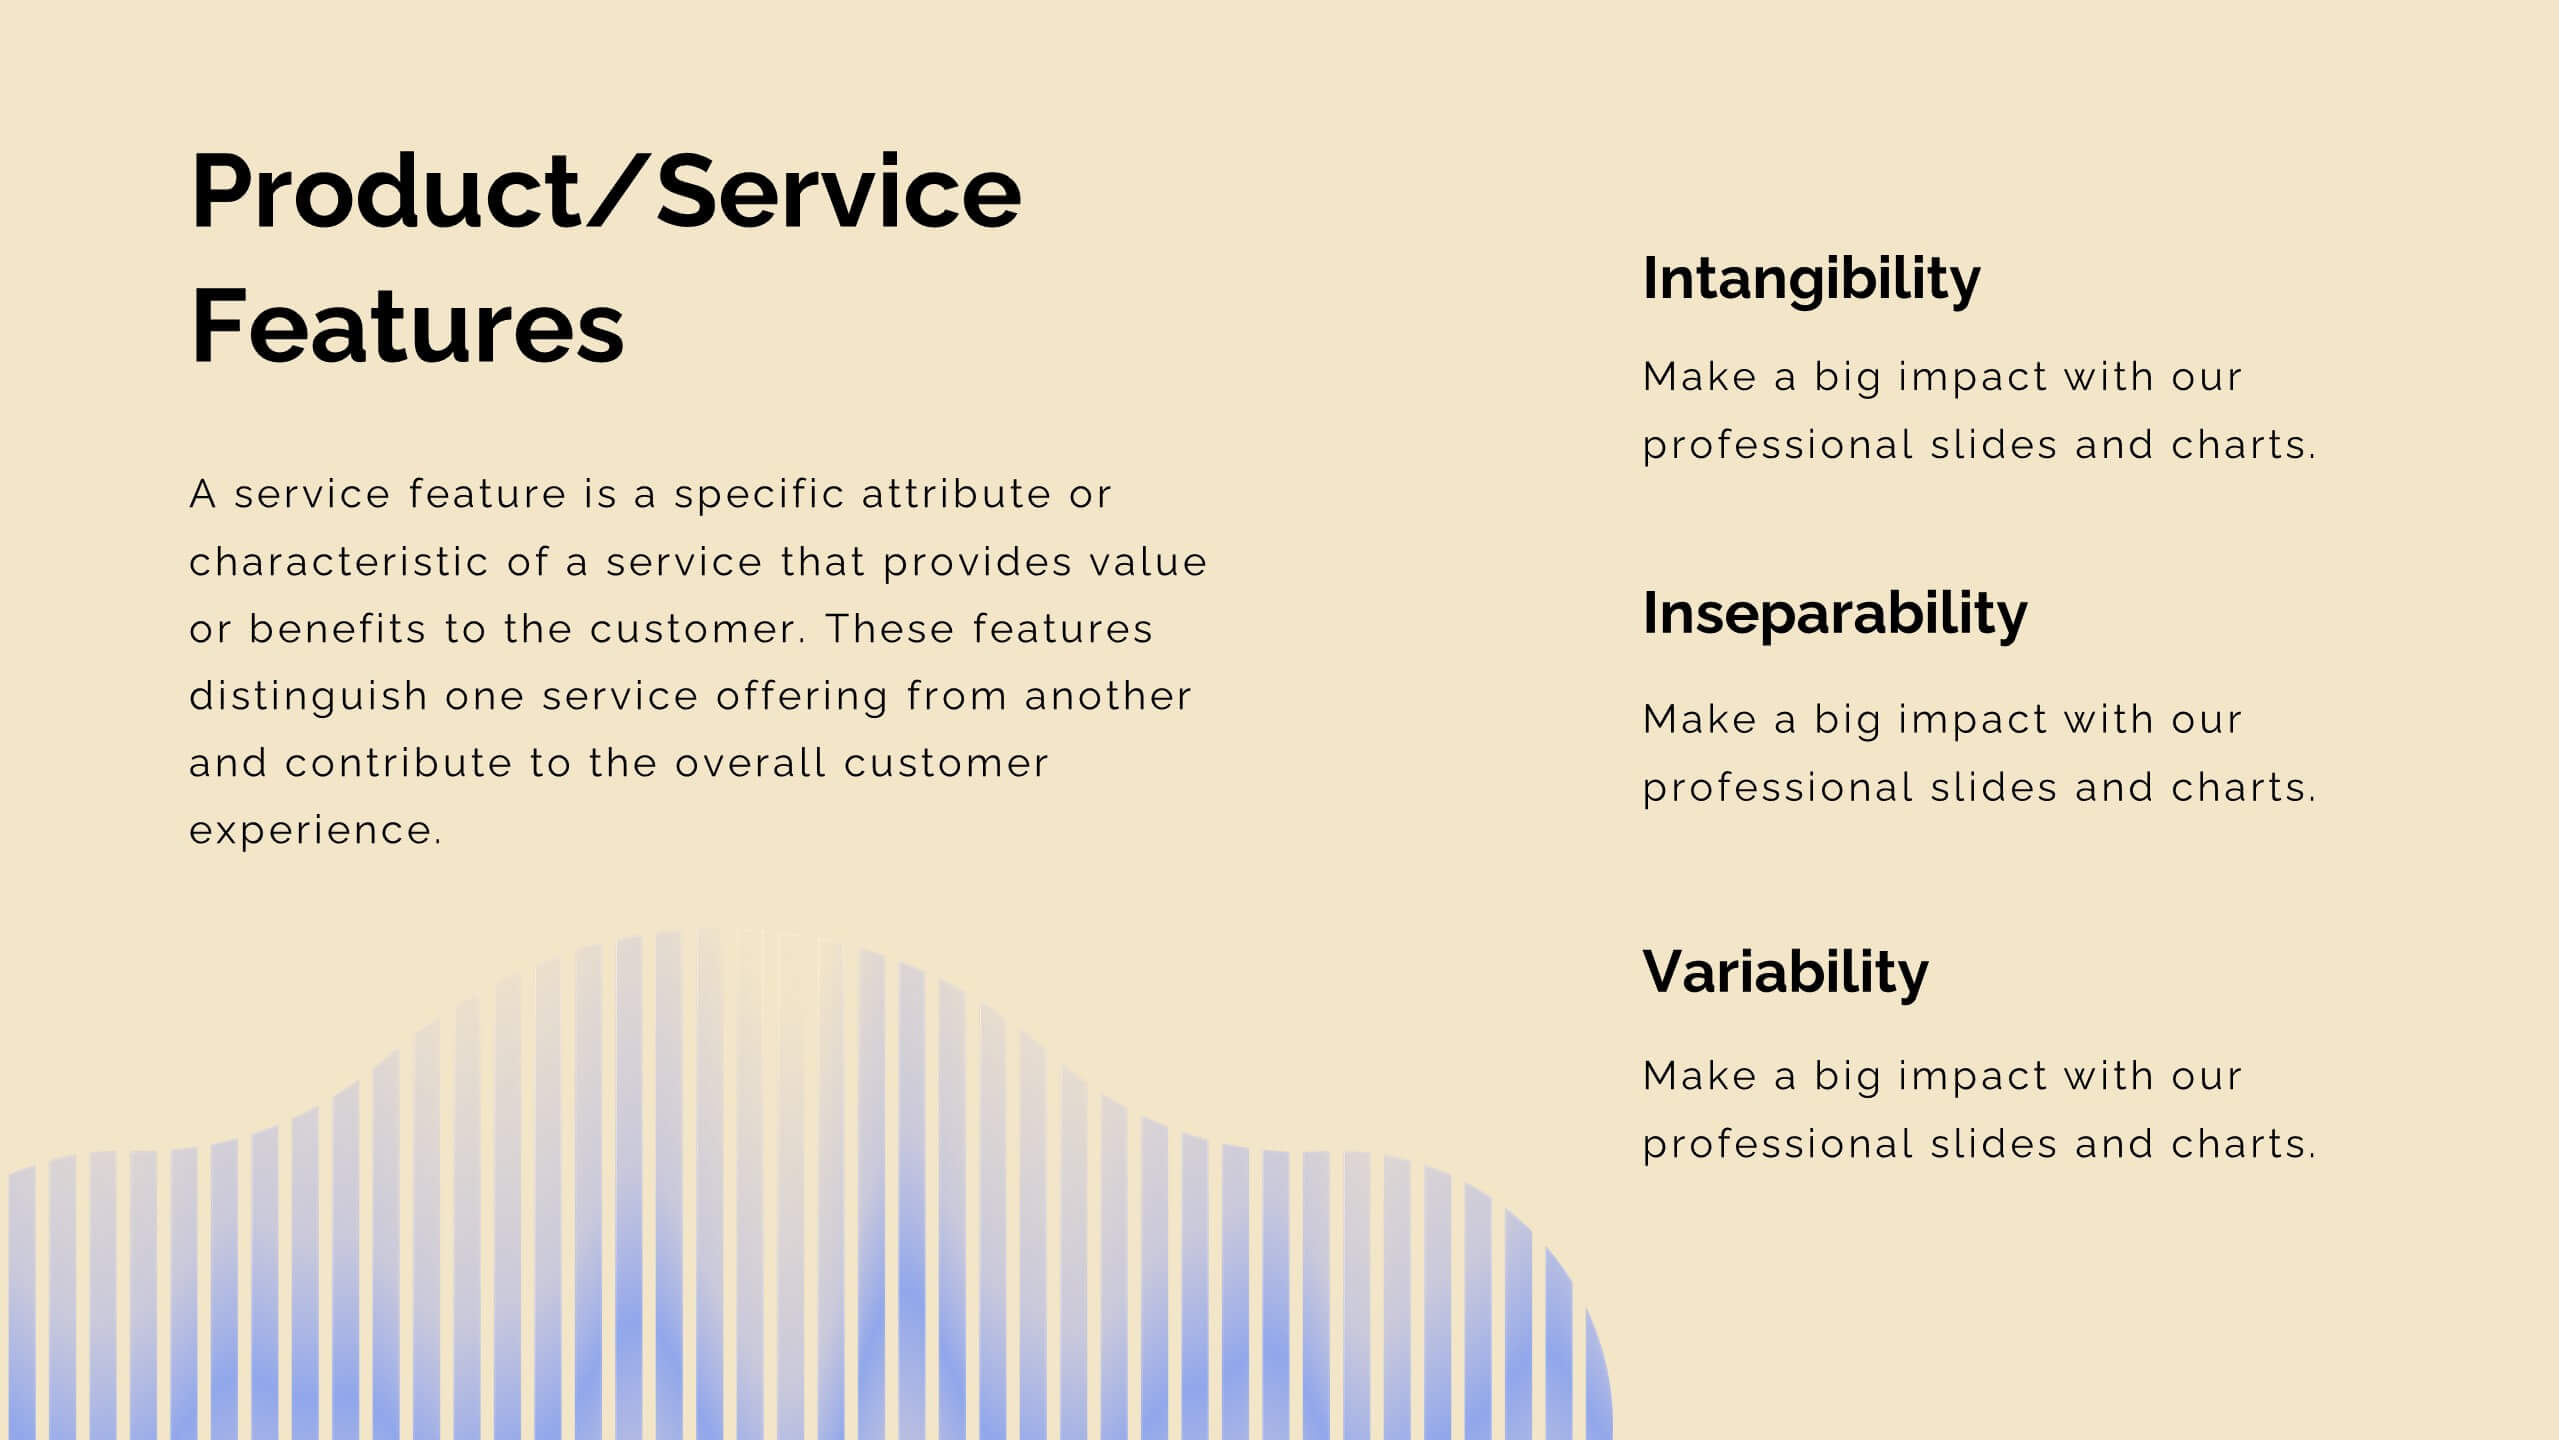
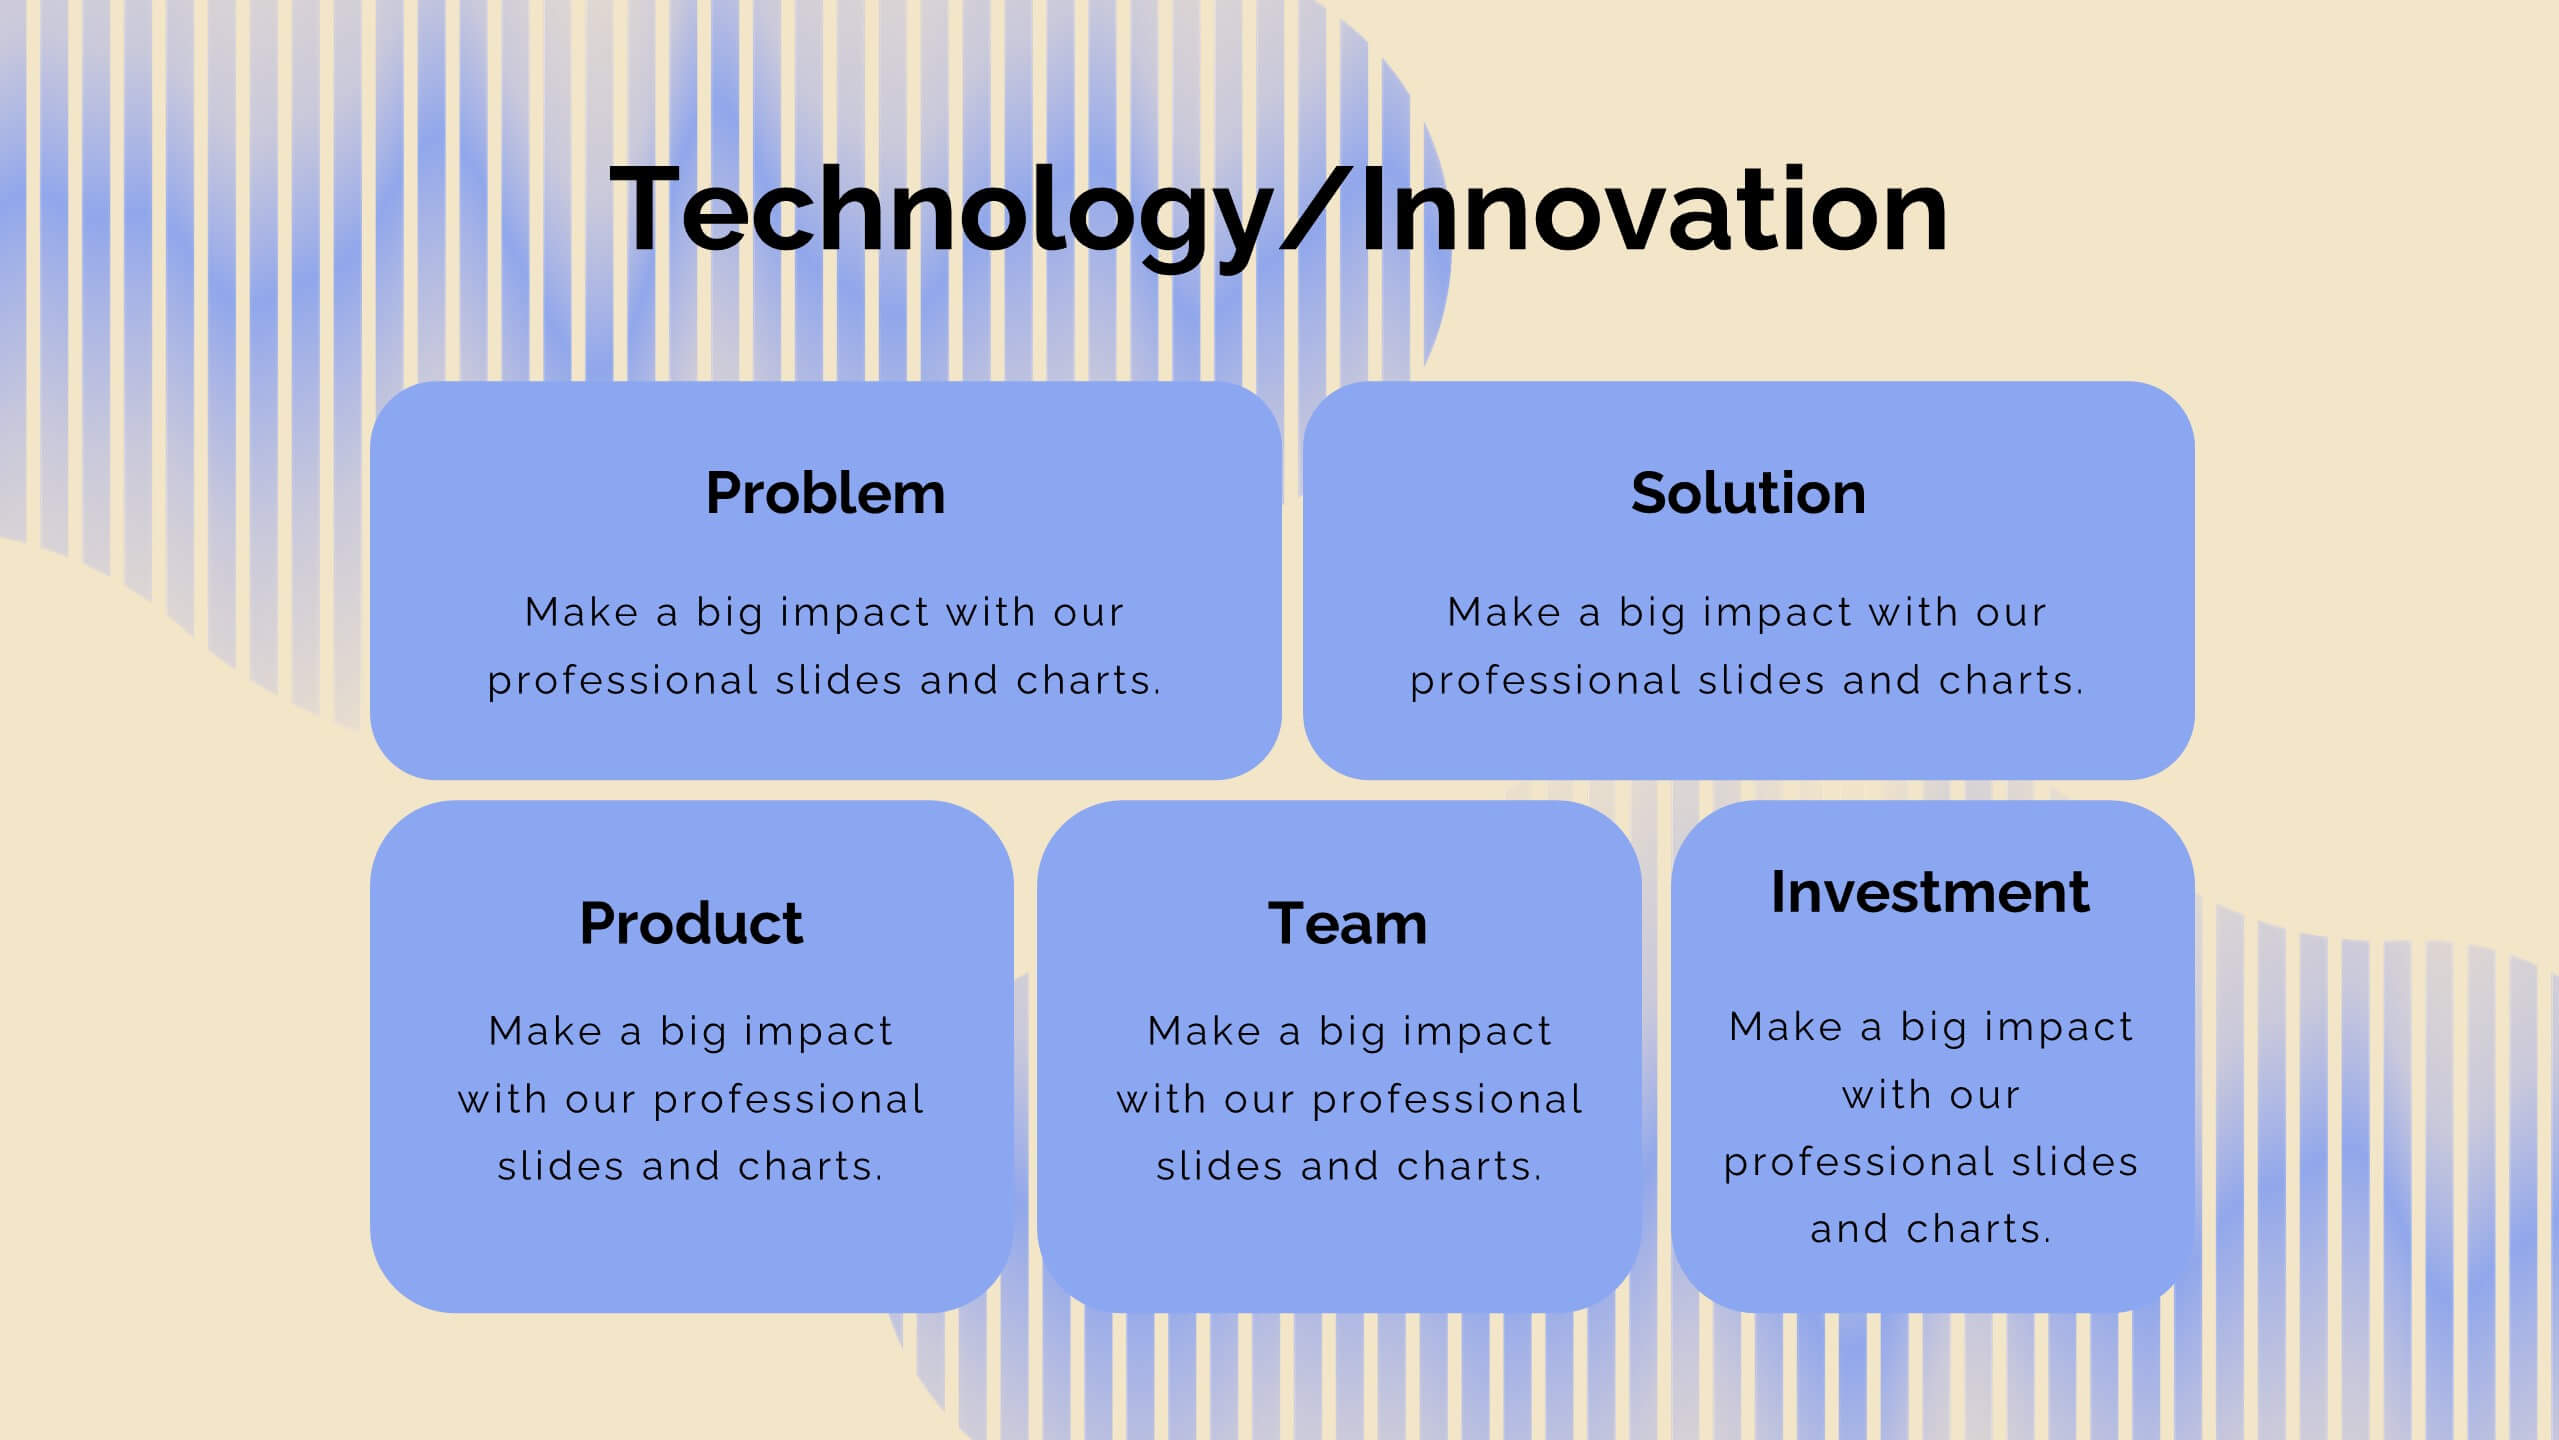
Journey Product Roadmap Presentation
Embark on a seamless journey through your product’s lifecycle with this comprehensive roadmap template! Perfect for illustrating key milestones, business models, and market opportunities, it’s your go-to for clear and engaging presentations. Dive into competitive analysis, showcase your unique selling proposition, and outline your growth projections with style. Compatible with PowerPoint, Keynote, and Google Slides.


6 diapositivas
STEM Education and Discovery Presentation
Showcase your STEM insights with this vibrant puzzle-piece infographic. Each piece highlights a key point in science, technology, engineering, or math—perfect for lesson plans, research summaries, or discovery processes. Fully customizable in PowerPoint, Keynote, and Google Slides, making it ideal for educators, researchers, or curriculum developers.


6 diapositivas
Project Scope and Expansion Scale Presentation
Display growth areas and operational coverage with this segmented radial chart. Ideal for showcasing project reach, departmental impact, or phase distributions, each section includes editable icons and labels. Perfect for strategy updates, expansion pitches, or status reporting. Fully customizable in PowerPoint, Keynote, and Google Slides for professional presentations.


5 diapositivas
Workflow Management Diagram Presentation
Simplify your process visuals with a clean, modern layout designed to clarify every step. This presentation helps you map workflows, define responsibilities, and streamline communication across teams. Perfect for project planning and operations, it’s fully compatible with PowerPoint, Keynote, and Google Slides for effortless customization and professional presentation delivery.


6 diapositivas
Workforce Development Strategy Presentation
Enhance your workforce development strategies with our "Workforce Development Strategy Presentation" template. This infographic effectively displays essential workforce statistics and initiatives, organizing data into visually distinct segments for clarity. It covers various demographics and departmental roles, color-coded to differentiate data points like gender distribution and participation rates. Ideal for HR professionals and corporate trainers, this template supports strategic decisions in talent management and training. It simplifies complex information, making it accessible for all stakeholders. Compatible with PowerPoint, Keynote, and Google Slides, this template is essential for delivering impactful and strategic human resource presentations.


4 diapositivas
Break-Even Point Financial Analysis Presentation
Clearly define profitability with this break-even point financial analysis template. It visually maps costs, revenue, and profitability, helping businesses assess when they'll cover expenses and start making a profit. Perfect for financial forecasting and business planning. Fully customizable and compatible with PowerPoint, Keynote, and Google Slides for seamless editing and presentation.


7 diapositivas
Law Infographics Presentation Template
Featuring our Law Infographic template it is a modern and stylish template for making a presentation about law. It comes with a clean design, typography and plenty of space for annotations and is compatible with powerpoint. This template is suitable for a presentation about business, management, finance or marketing. It contains a one page design, illustrations and many different elements to help you build a strong and compelling presentation. Essential and easy to use, this law Infographic template is a great tool for anyone who wants to make an attractive and professional presentation.


6 diapositivas
Product and Service Benefits Presentation
Highlight the unique value of your offerings with this Product and Service Benefits Presentation. Designed for clarity and impact, this visual layout allows you to break down six key features or advantages side-by-side. Perfect for product launches, sales decks, or service comparisons. Easily customizable in PowerPoint, Keynote, and Google Slides — ideal for marketers, sales teams, and consultants.


5 diapositivas
Relationship Mapping Diagram Presentation
Bring clarity to complex connections with this clean and modern visual layout designed to map relationships, processes, or ideas effortlessly. Perfect for presentations that require structure and flow, it balances simplicity with professionalism. Fully customizable and compatible with PowerPoint, Keynote, and Google Slides for seamless design flexibility.


5 diapositivas
Client Engagement Journey Touchpoints
Map out every stage of client interaction with the Client Engagement Journey Touchpoints Presentation. This visual slide template highlights four key customer touchpoints, with a central user icon to emphasize the client-centric approach. Ideal for showcasing brand awareness, first contact, engagement strategies, and conversion steps. Easily customizable in PowerPoint, Keynote, and Google Slides.


6 diapositivas
Demographic and Behavioral Customer Profile Presentation
Understand your audience better with the Demographic and Behavioral Customer Profile Presentation. This visually engaging template separates key demographic details from behavior-based insights to help you build more effective marketing strategies. Fully customizable in Canva, PowerPoint, or Google Slides—perfect for marketers, strategists, and sales teams targeting customer segmentation.