


Características


¿Tienes alguna pregunta?
Recomendar

22 diapositivas
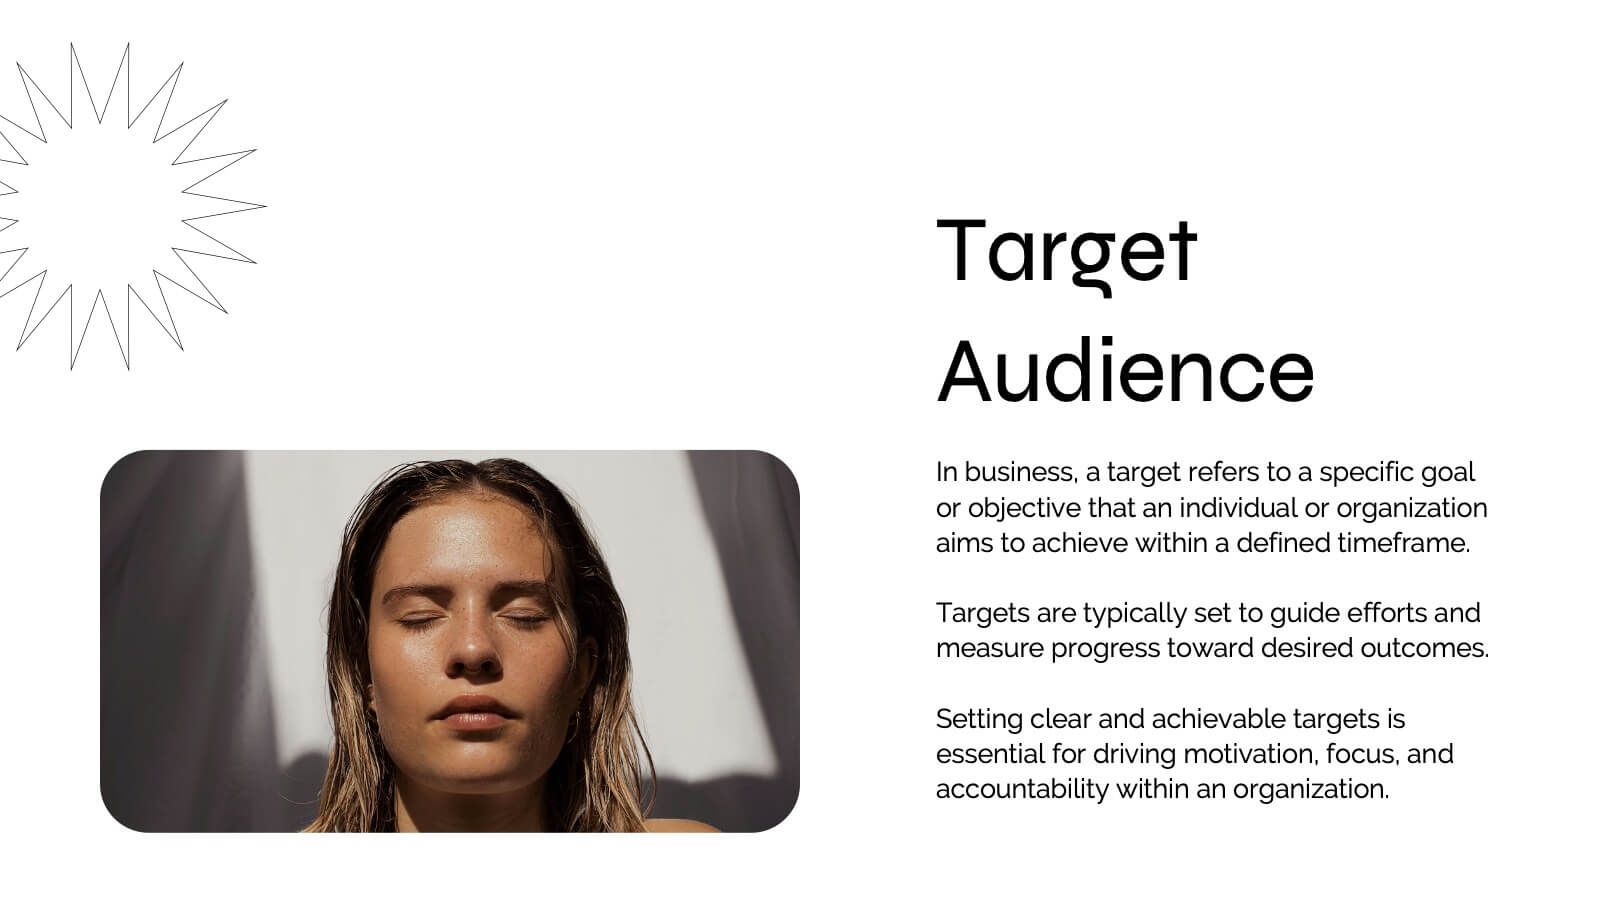
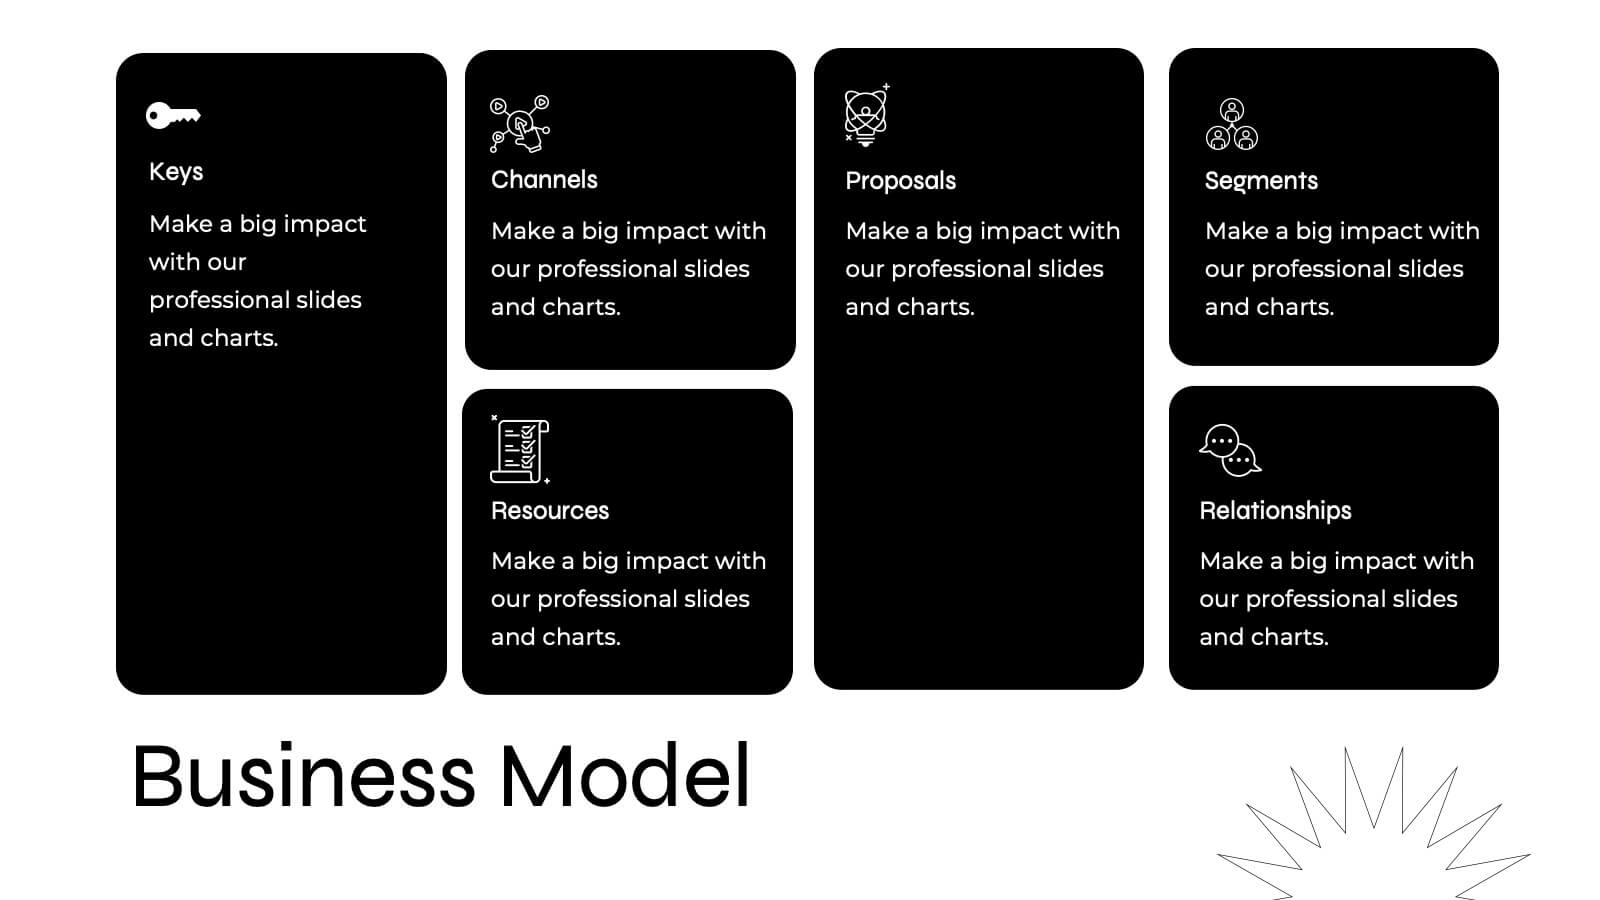
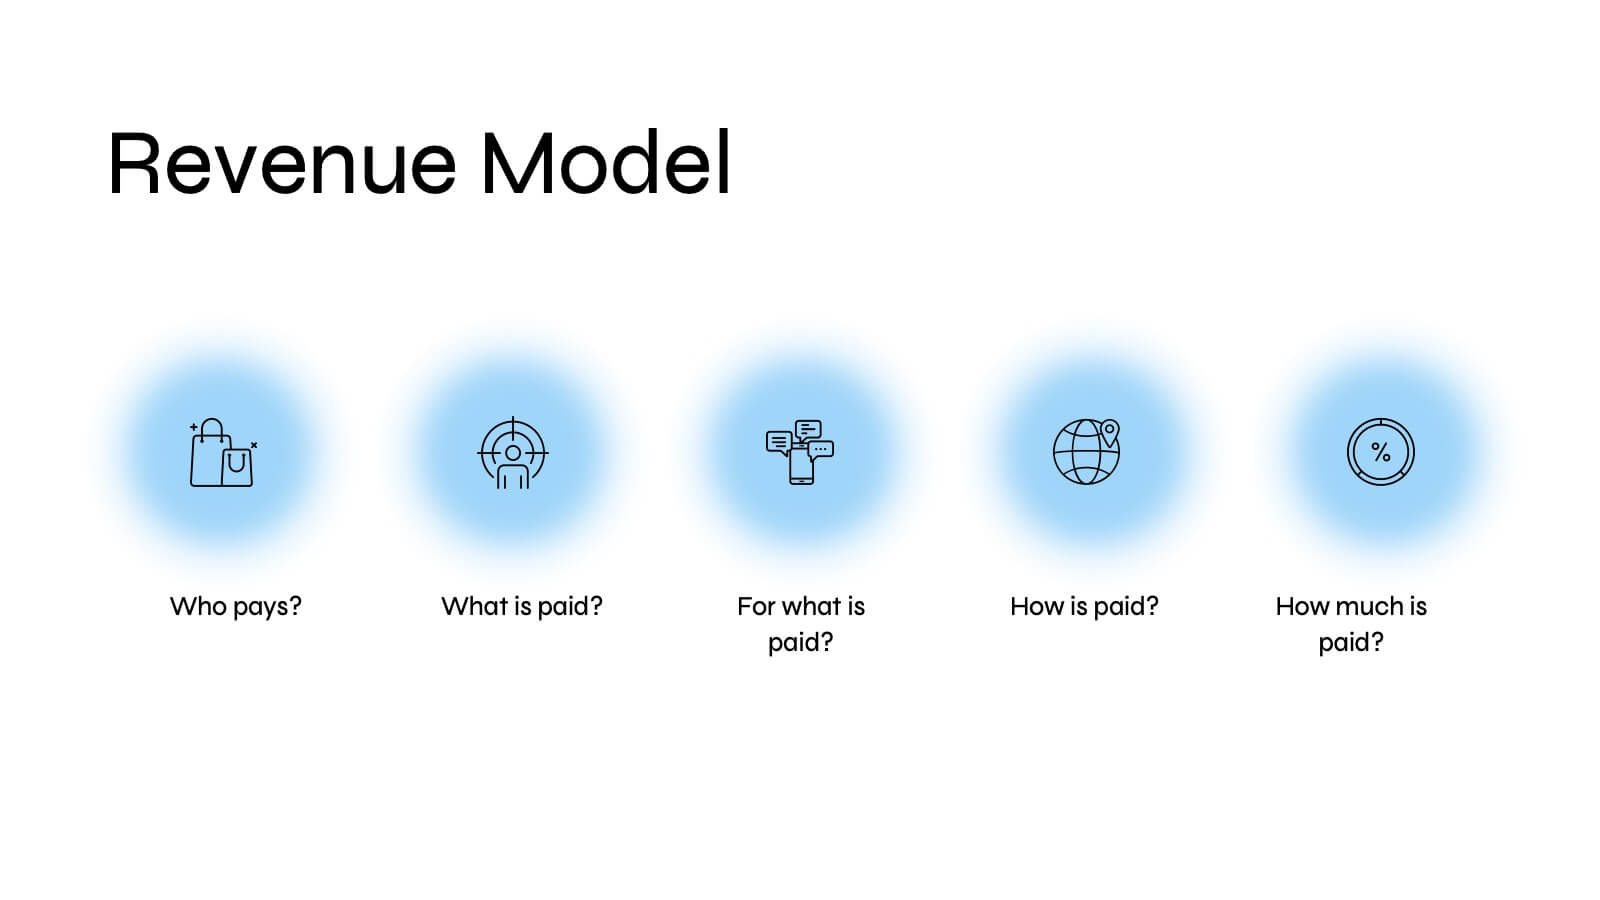
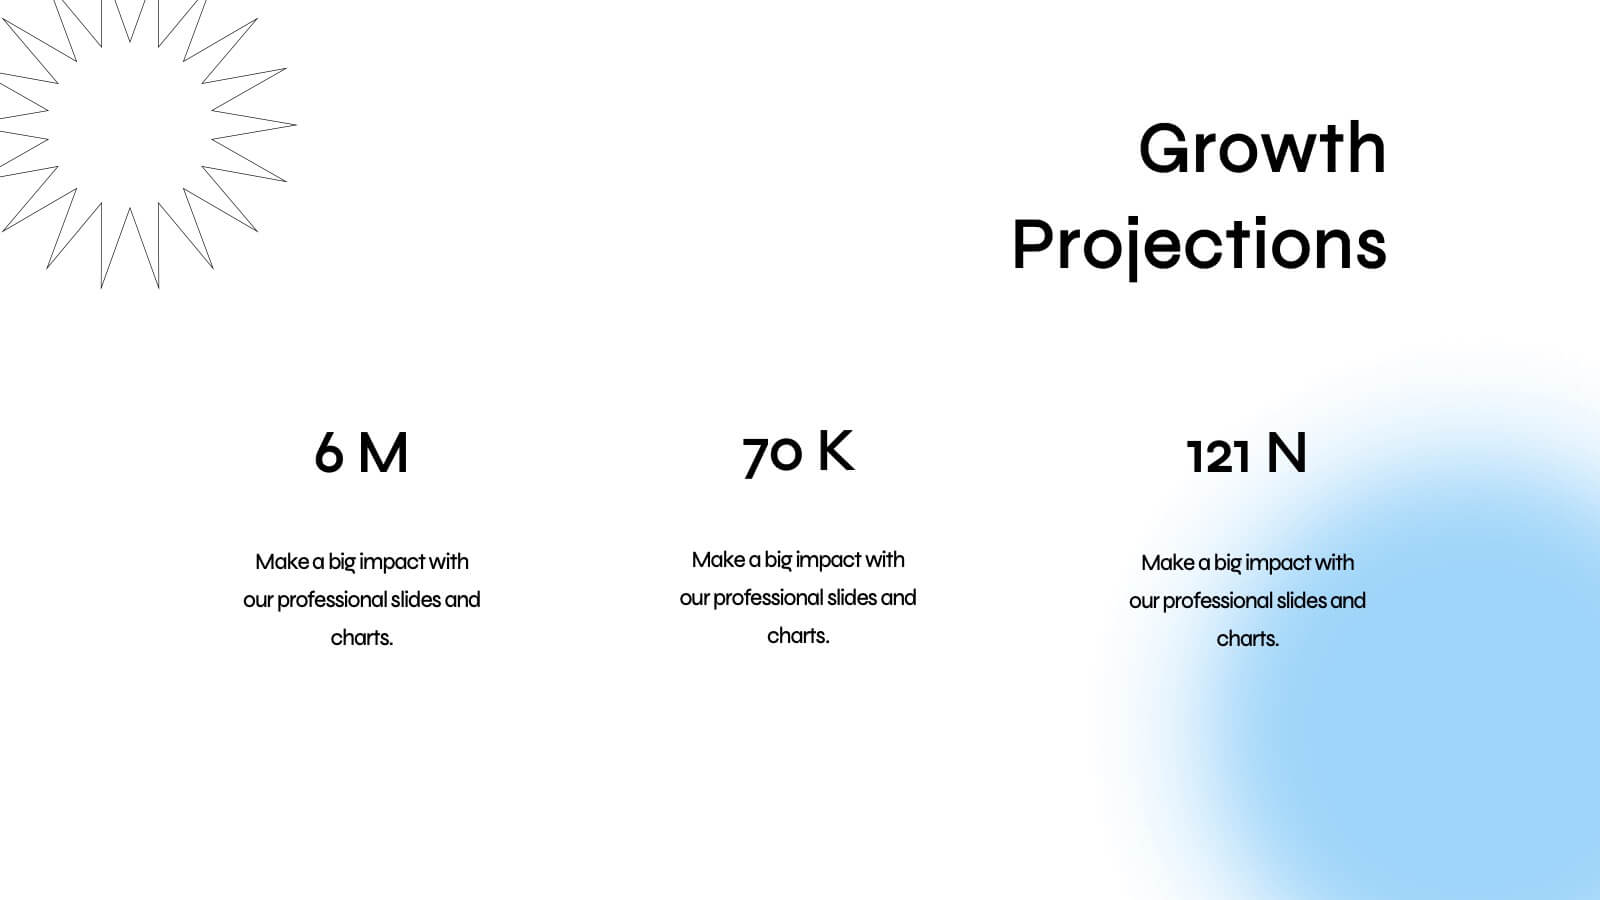
Quirinus Investor Pitch Presentation
Ready to impress investors and stakeholders? This sleek and modern pitch deck template covers all the essentials, from problem statements and market opportunities to revenue models and growth projections. Each slide is designed to convey clear and compelling information for maximum impact. Fully compatible with PowerPoint, Keynote, and Google Slides, making it the perfect tool for your next product launch!


26 diapositivas
Fashion Brand Shop Aesthetic Presentation
A fashion brand shop is a retail store that exclusively sells products from a particular fashion brand. This presentation template has a stylish design that perfectly reflects the essence of a high-end fashion brand. Whether you're launching a new collection, presenting your brand's story, or showcasing your latest fashion products, this template will captivate your audience. The presentation boasts sleek and elegant slides, featuring a blend of colors and images that will resonate with your brand's aesthetic. With its customizable elements, you can easily tailor the presentation to align with your brand's unique identity and aesthetics.


7 diapositivas
Sustainability Business Management Infographic Presentation
Sustainability Management presents information related to sustainable business practices and management strategies. The goal of this template is to help you create a balance between environmental factors to ensure long-term success for a business or organization. This infographic can cover a variety of topics, including sustainable supply chain management, energy, resource efficiency, and waste reduction. This template has different layouts including diagrams and graphs. It also includes icons, symbols, and color-coding to make the information more accessible and easier to understand.


6 diapositivas
Decision Flow Diagram Presentation
Make complex decisions easier to follow with the Decision Flow Diagram Presentation. This clean and logical layout breaks down two main options and guides viewers through possible outcomes using a visual tree structure. Featuring checkmark and X icons to clearly denote decisions, this template is ideal for strategic planning, operations, or troubleshooting. Includes light and dark modes, editable in PowerPoint, Keynote, and Google Slides.


7 diapositivas
Alphabet Infographic Presentation Template
Our Alphabet Infographic features a well-designed set of icons, letters and numbers. This template is perfect for PowerPoint presentations and will allow you to enhance your business/school design. Make your data sets easily readable, attractive and concise with this template. This Alphabet Infographic template is perfect for making your pitch stand out, with a bold and catchy design. It features a modern look that captures viewer's attention, but also contains plenty of details for them to explore. The colors are bright and vibrant, so you know the message won't be forgotten easily.


6 diapositivas
Building High-Performing Teams Presentation
Unlock your team's full potential with this dynamic Building High-Performing Teams template. Featuring a sleek 3-part circular layout, it's perfect for showcasing leadership roles, collaboration pillars, or performance drivers. Use it for HR meetings, training sessions, or team development plans. Fully editable in PowerPoint, Keynote, and Google Slides.


4 diapositivas
Science Lab Results and Data Analysis Presentation
Visualize lab data with clarity using this science-themed infographic. Featuring test tubes in a rack, it’s ideal for presenting experimental results, sample comparisons, or analysis summaries. Each tube aligns with icons and key points for easy interpretation. Fully customizable in PowerPoint, Keynote, and Google Slides to match your findings.


7 diapositivas
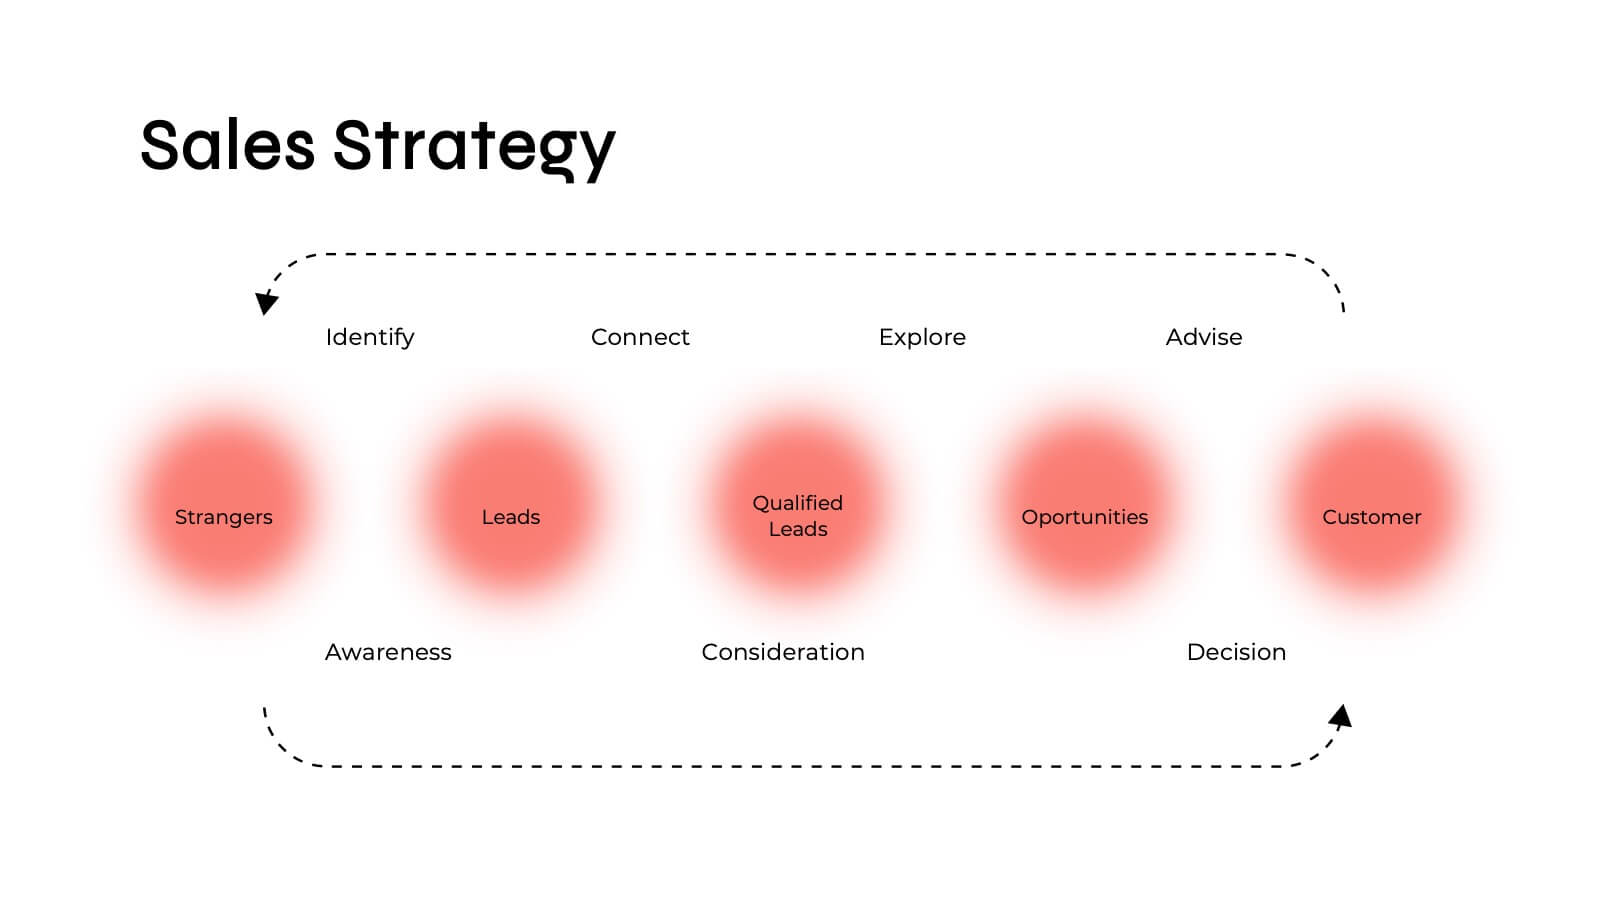
Customer Success Journey Infographic
A customer journey infographic is a visual representation of your customer's experience with your company. It can help you gain insight into where they're struggling and how they feel about your product or service. This infographic template will help you understand the top factors that influence your customers' decisions, including the most common problems they face. With this template you'll also learn how their behaviors change over time—and how to structure marketing campaigns that stay with them throughout their journey. Fully customizable and compatible with Powerpoint, Keynote, and Google Slides.


7 diapositivas
Health Program Infographic
Introducing the health program infographic, a visual guide that seamlessly blends informative content with simplicity, tailored to the needs of health professionals and organizations. This template is designed to elucidate the core elements and steps of any health program, ensuring viewers understand its intricacies and objectives with ease. Set against a pristine white canvas, the infographic employs various shades of calming blue. Intuitive icons punctuate each segment of the infographic, aiding in the comprehension of the health program's various components. Compatible with PowerPoint, Keynote, and Google Slides, ensures a clear and concise presentation.


8 diapositivas
Breast Cancer Research and Support Presentation
Dive into the pivotal world of healthcare with the Breast Cancer Research and Support template. This presentation emphasizes the critical aspects of breast cancer research and community support, providing a deep exploration of both scientific advancements and compassionate outreach. Suitable for PowerPoint, Keynote, and Google Slides, it effectively highlights statistical data, support resources, and key information with easy-to-understand graphics and dedicated spaces for comprehensive details, ideal for educational sessions and health advocacy meetings.


26 diapositivas
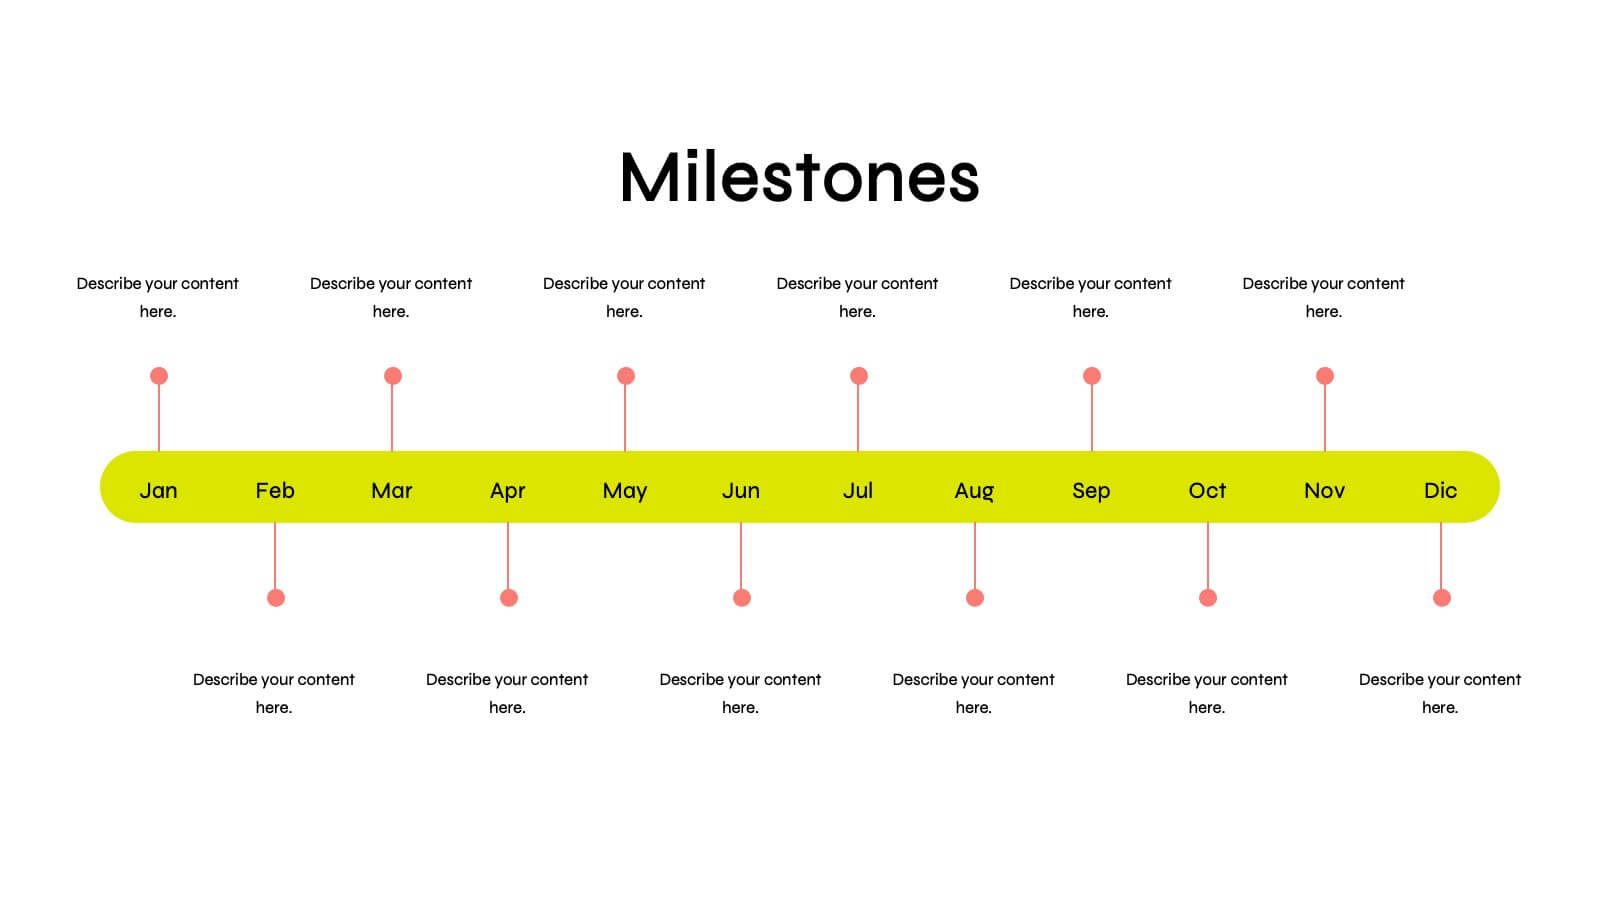
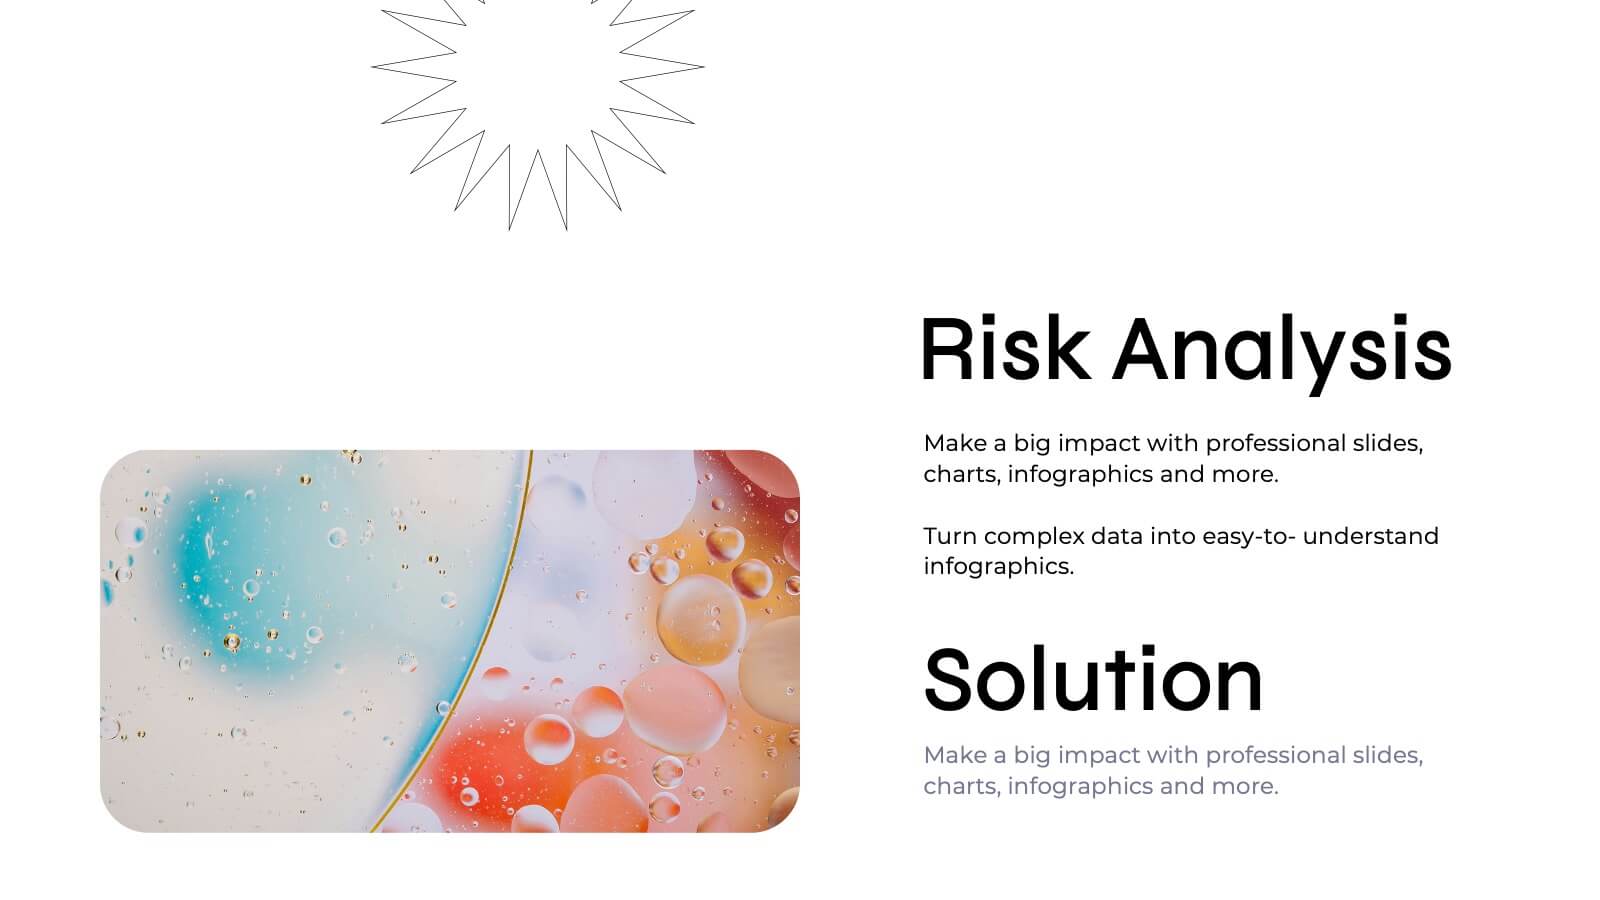
Azahar Presentation Template
Azahar is a perfect modern template with a clean and professional feel. This theme can help your business connect with clients through an easy to understand template. Azahar was designed by professionals to help businesses connect with their audience. It has a modern, chic aesthetic and very detailed look. The colors are fresh which help keep the look clean and easy to read. The theme comes packed with features to target your audience and get your message across. Charts, timelines and easy to edit text, this template is perfect for businesses seeking to make an impression on their audience.


8 diapositivas
Geographic Data for Europe Slide Presentation
Visualize key regional data clearly with the Geographic Data for Europe Slide Presentation. This editable map layout highlights specific European countries alongside icon-based text boxes, perfect for presenting statistics, demographics, or business metrics. Use color-coded markers to tell a geographic story with visual clarity. Compatible with PowerPoint, Keynote, Google Slides, and Canva.


5 diapositivas
Real-Time Data Dashboard Presentation
Bring your data to life with a dynamic layout that tracks key metrics as they shift by the moment. This presentation helps you present trends, performance indicators, and live insights with clarity and impact, ideal for fast-moving teams. Fully compatible with PowerPoint, Keynote, and Google Slides.


5 diapositivas
Rental Business Milestone Timeline Presentation
Showcase your company's growth journey with this clean Rental Business Milestone Timeline layout. Designed for tracking key achievements, it features a horizontal timeline with icons and customizable date markers. Perfect for business reviews or investor updates, it’s fully editable in PowerPoint, Keynote, and Google Slides for a professional presentation


4 diapositivas
HR Policies and Employee Management Presentation
Clearly outline your workplace strategies with this HR Policies and Employee Management slide. Featuring four color-coded segments alongside an illustration of employee analysis, this layout is ideal for presenting onboarding steps, employee benefits, internal policies, or training procedures. Fully editable and compatible with PowerPoint, Keynote, and Google Slides for seamless customization.


6 diapositivas
Product Development Cycles Presentation
A great product starts with a clear, engaging story—this presentation brings that journey to life. It outlines each stage of the development cycle in a simple, visual flow that helps teams communicate progress, milestones, and next steps. Perfect for strategy, planning, and updates. Fully compatible with PowerPoint, Keynote, and Google Slides.


4 diapositivas
Sustainability in Water Conservation Presentation
Highlight your eco-initiatives with this visually engaging Sustainability in Water Conservation presentation. Featuring a puzzle-style water drop diagram, this slide helps communicate four core strategies or ideas clearly and effectively. The clean layout and modern icons ensure your message is both professional and impactful, making it ideal for presentations on sustainability goals, environmental education, or water-saving initiatives. Fully editable and compatible with PowerPoint, Keynote, and Google Slides.