


Características


¿Tienes alguna pregunta?
Recomendar


6 diapositivas
Pillar Ideas Infographic
"Pillar ideas" usually refer to the fundamental principles, concepts, or key components that form the foundation of a particular topic, strategy, or framework. This infographic template outlines and explains the core pillars or key principles of a particular topic, concept, or strategy. These pillars are essential for understanding and implementing the core aspects of that subject. The pillars included in the infographic provide structure and a clear understanding of the foundational elements that contribute to the success and effectiveness of various endeavors. This template is compatible with Powerpoint, Keynote, and Google Slides.


4 diapositivas
Business Role Structure Diagram Presentation
Bring your team structure to life with a clear, engaging visual that makes every role instantly understandable. This presentation helps you map relationships, outline responsibilities, and communicate workflow with ease. Designed for simple customization and professional clarity, it supports PowerPoint, Keynote, and Google Slides for seamless editing across platforms.


4 diapositivas
Daily Plan and Talking Points Agenda Presentation
Stay aligned and focused with this Daily Plan and Talking Points Agenda presentation. Perfect for team standups or morning meetings, this layout organizes discussion into three clear sections: Yesterday, Today, and Blockers. Fully editable in Canva, PowerPoint, and Google Slides—customize effortlessly to keep your team in sync


20 diapositivas
Air Slash Artist Portfolio Template Presentation
The Air Slash Artist Portfolio template is your perfect canvas for showcasing creativity and professionalism! Designed with a minimalist yet dynamic aesthetic, this template helps you present your projects and artistic journey with flair. Start with a compelling introduction and an "About Me" section that tells your story, followed by a detailed portfolio overview. Highlight your best work with project showcases, and explain your unique style and creative process. The template also features dedicated sections for collaborations, client testimonials, awards, and recognitions, ensuring you capture every aspect of your creative achievements. With slides for services offered, pricing, and contact information, you can connect with potential clients effortlessly. Whether you're a freelance artist, designer, or creative professional, this template is fully customizable and compatible with PowerPoint, Keynote, and Google Slides, making it a versatile choice for all your presentation needs.
20 diapositivas
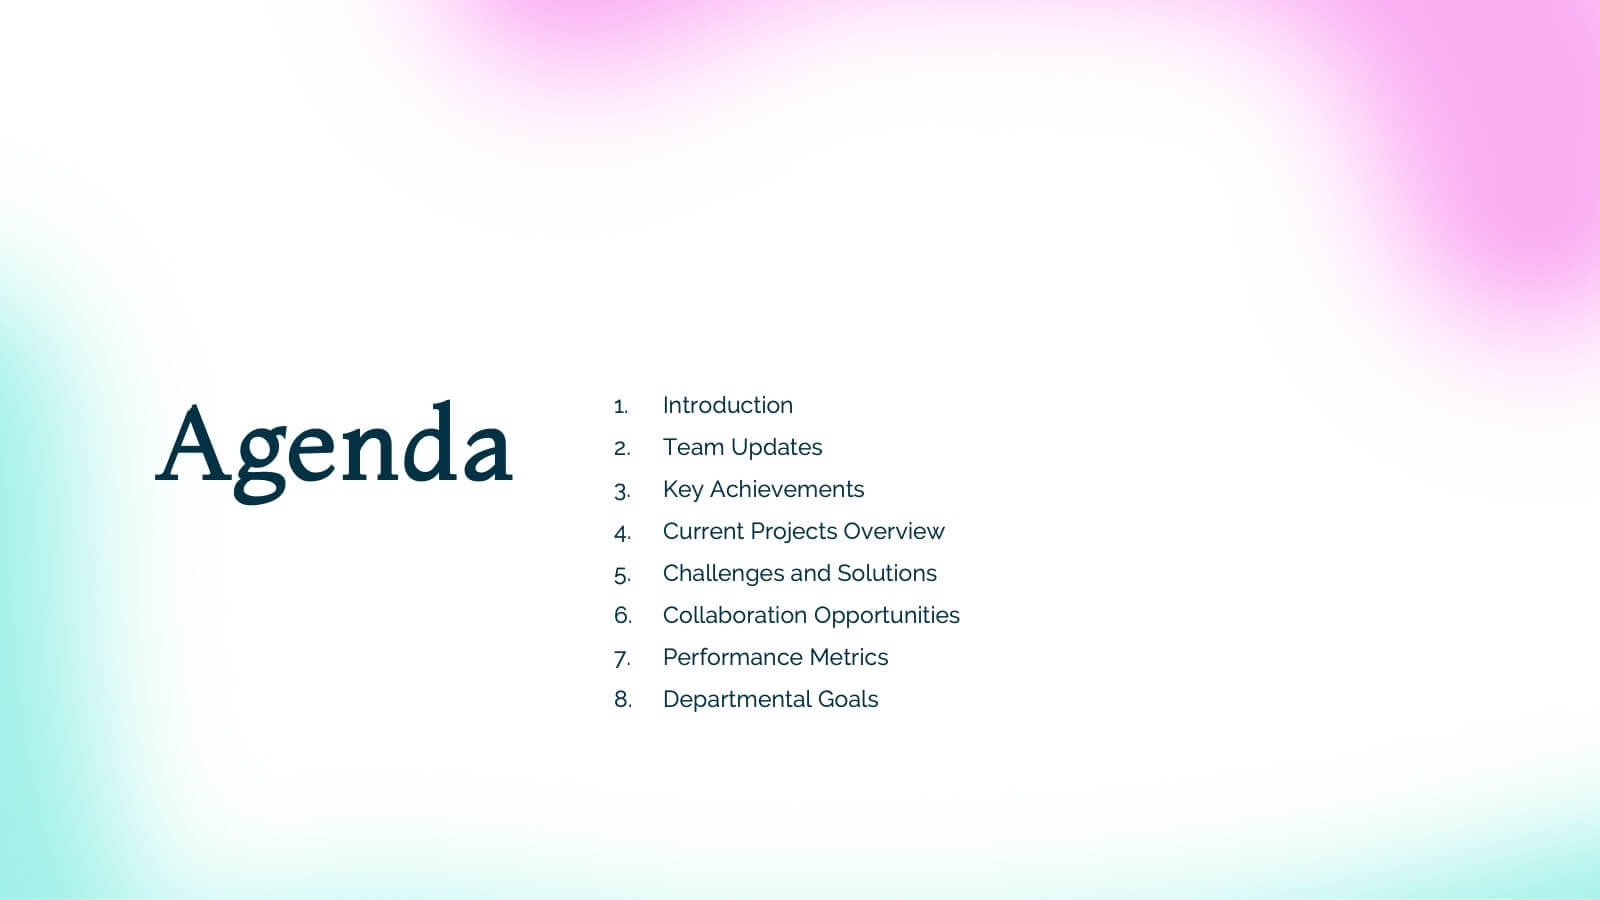
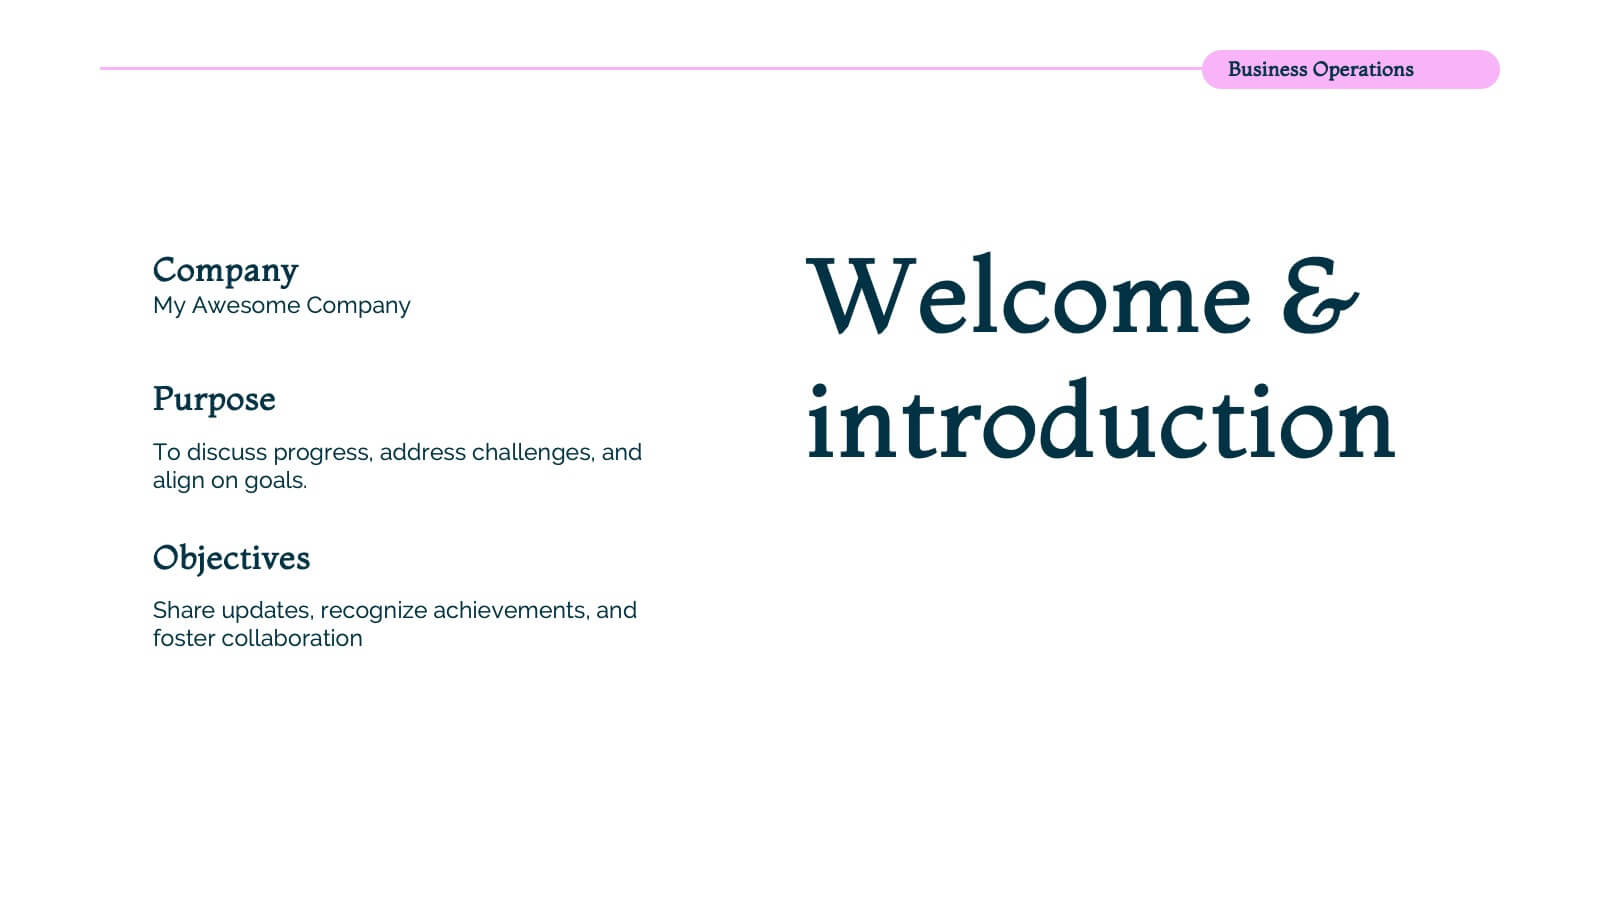
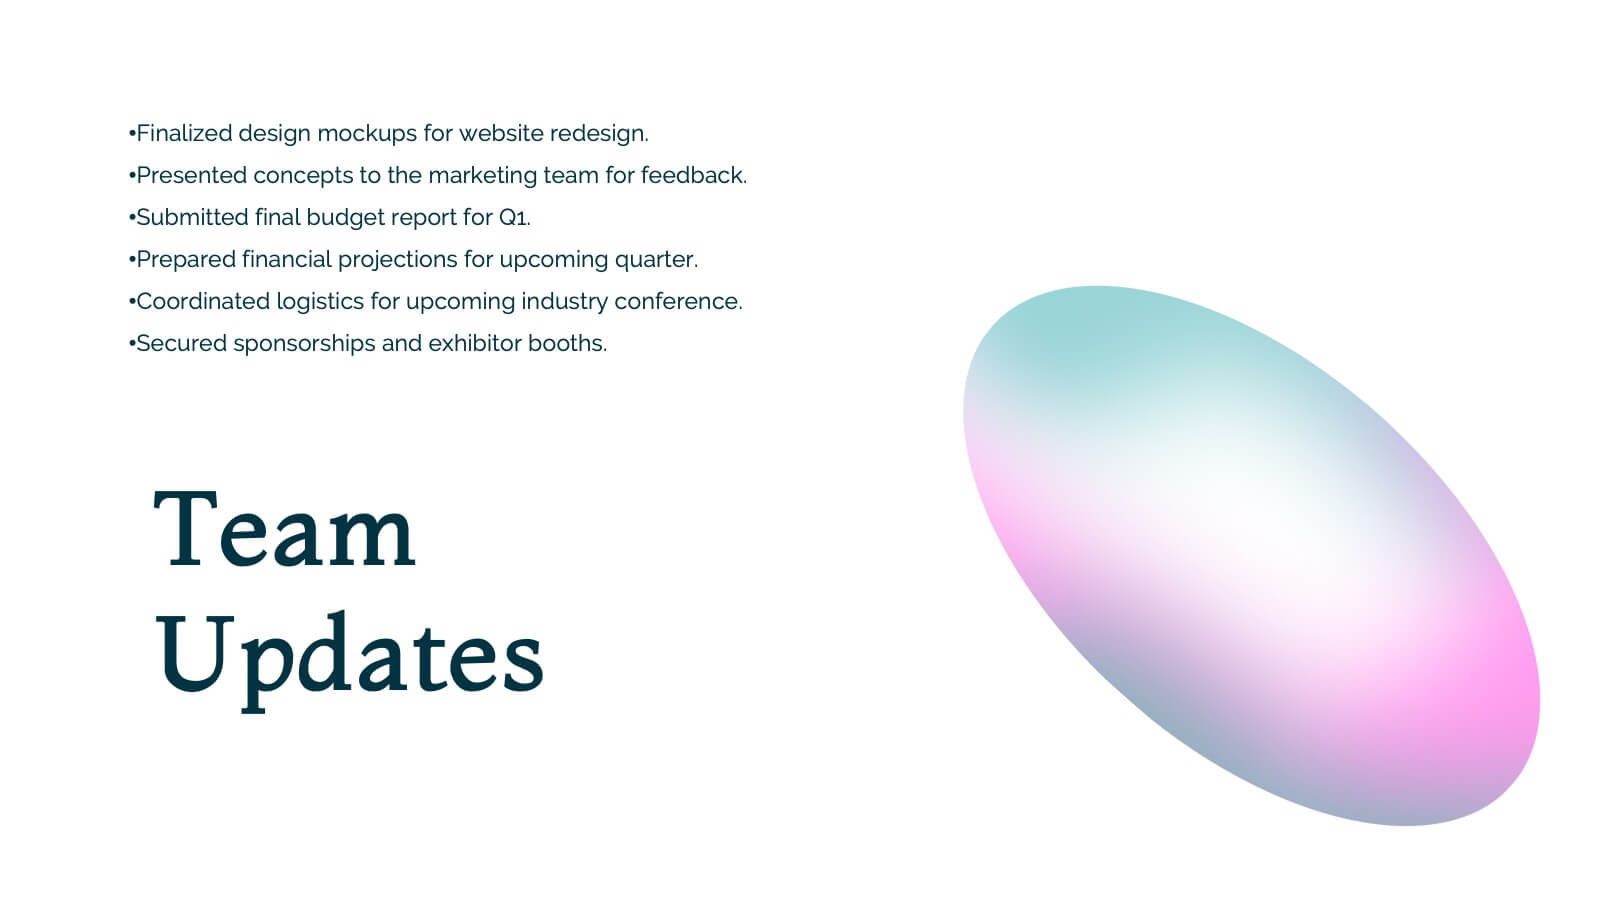
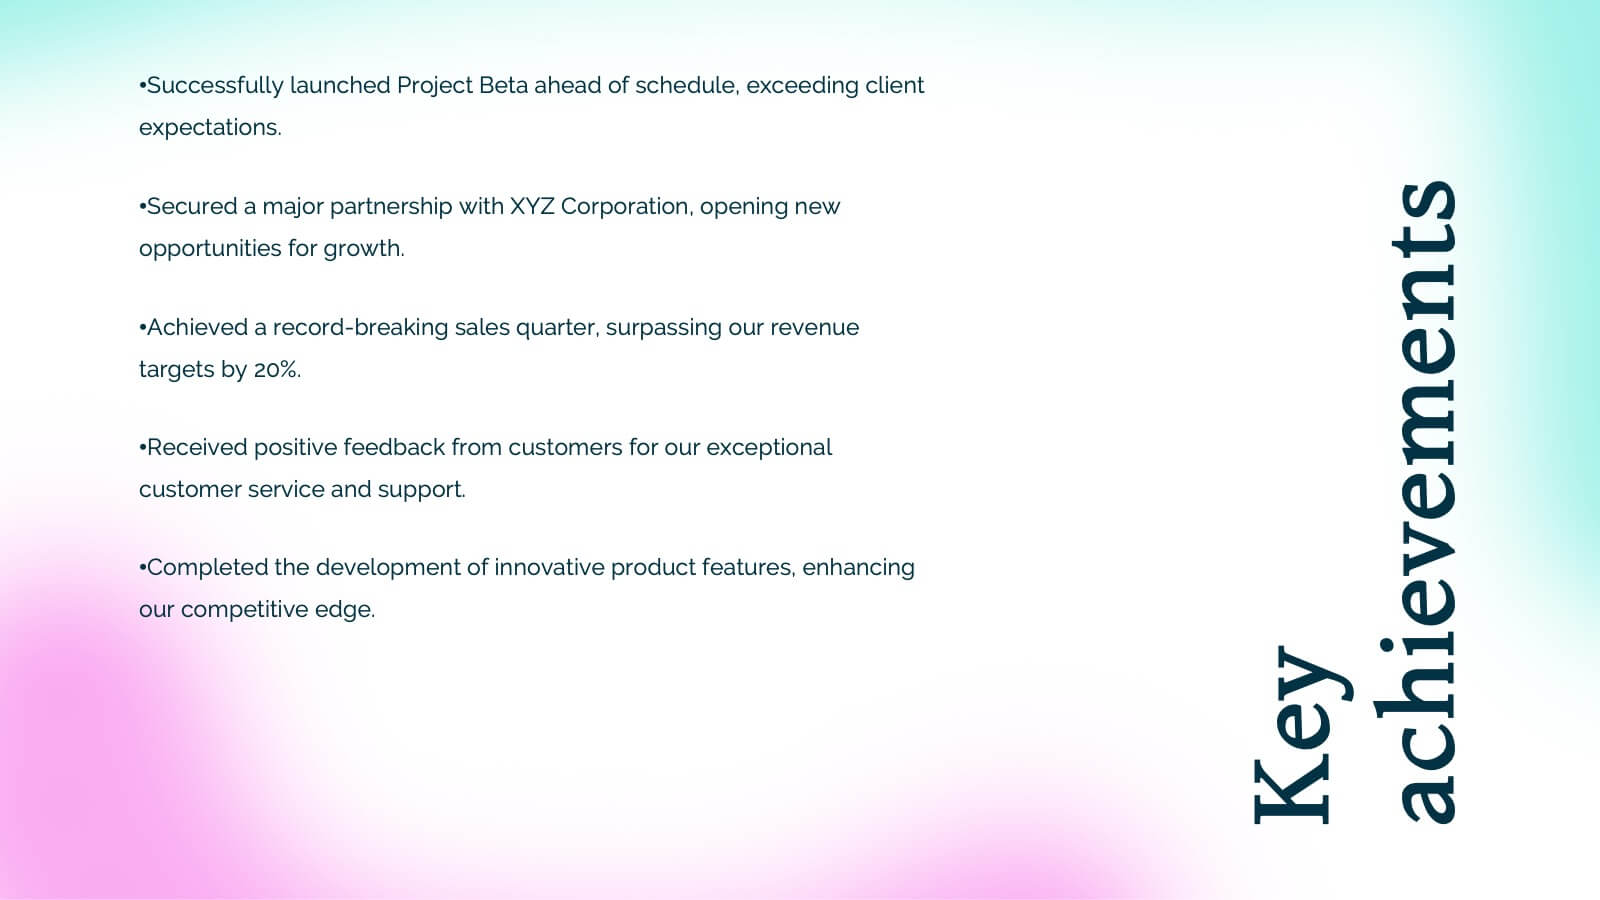
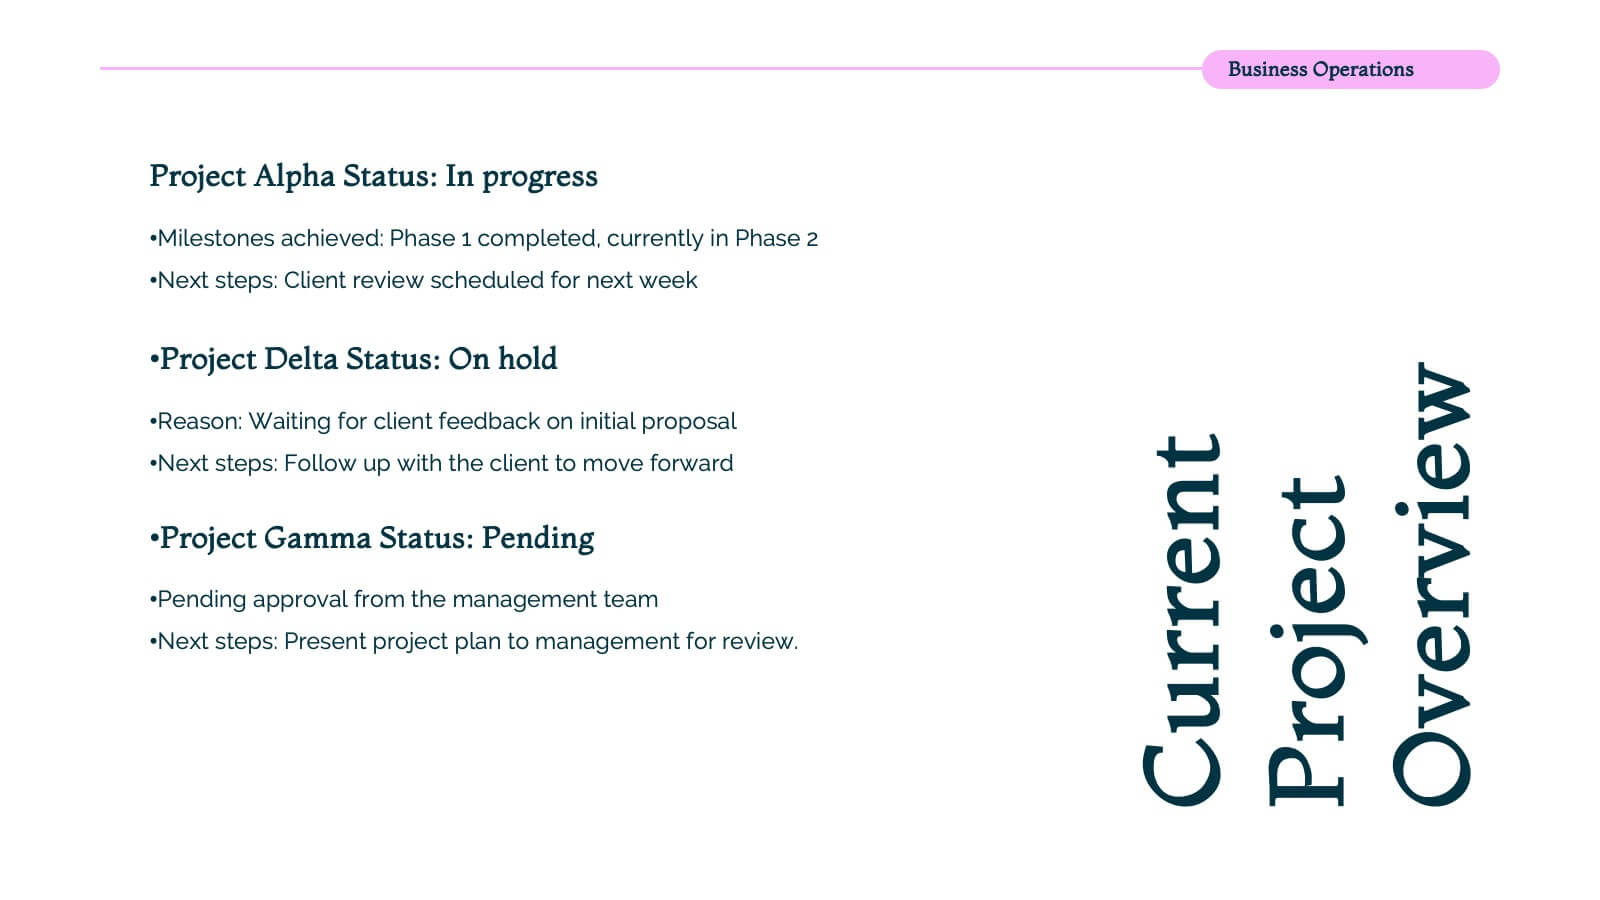
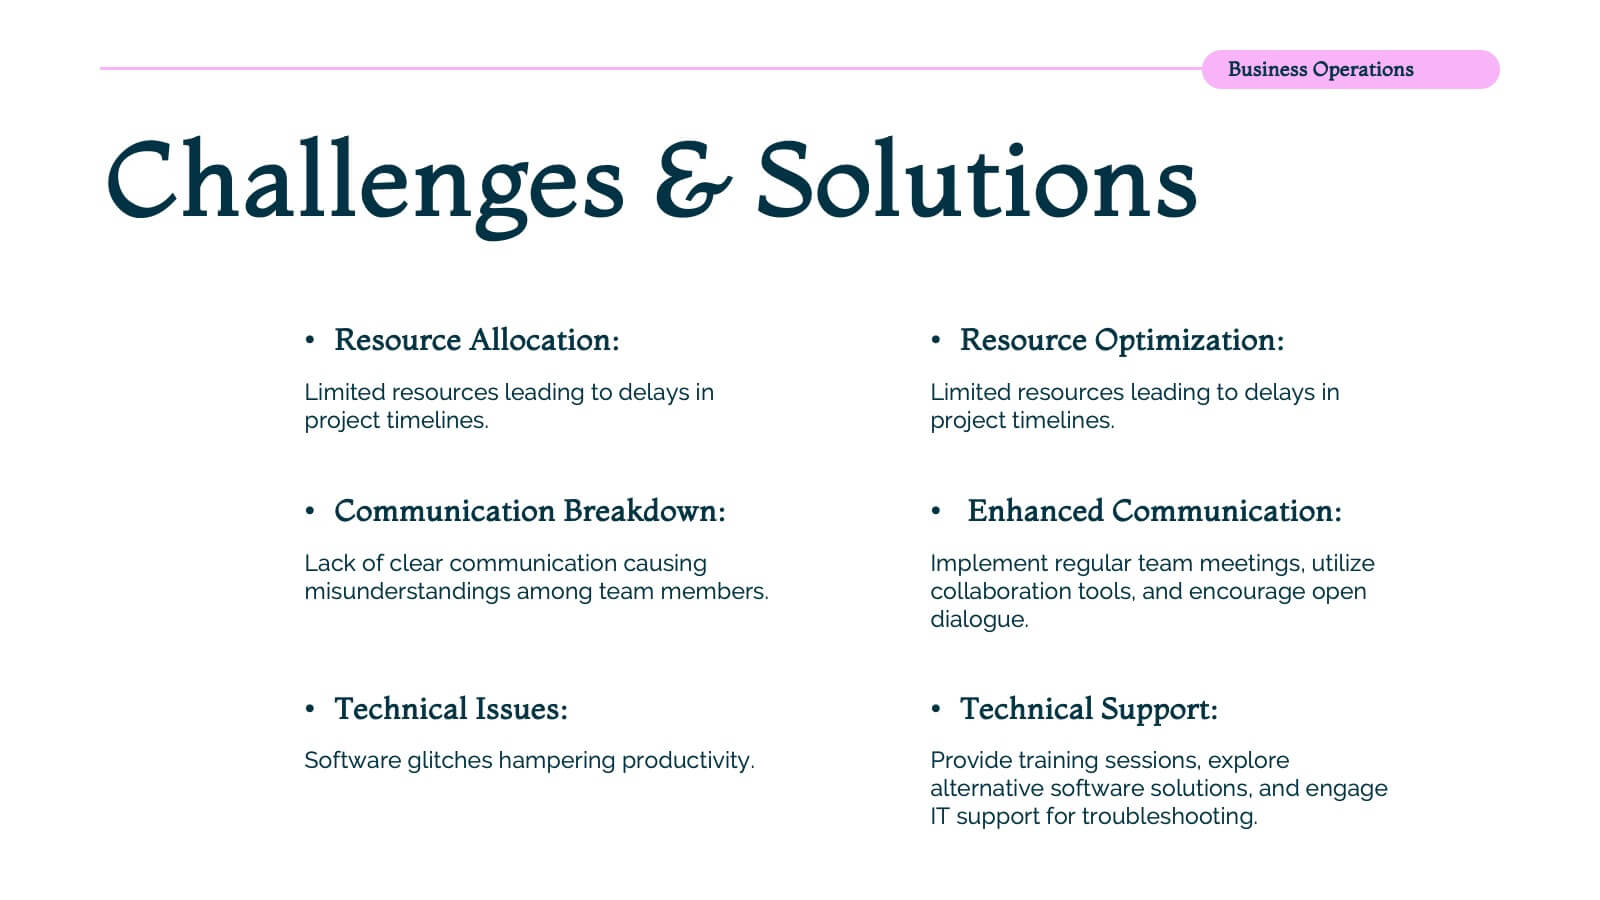
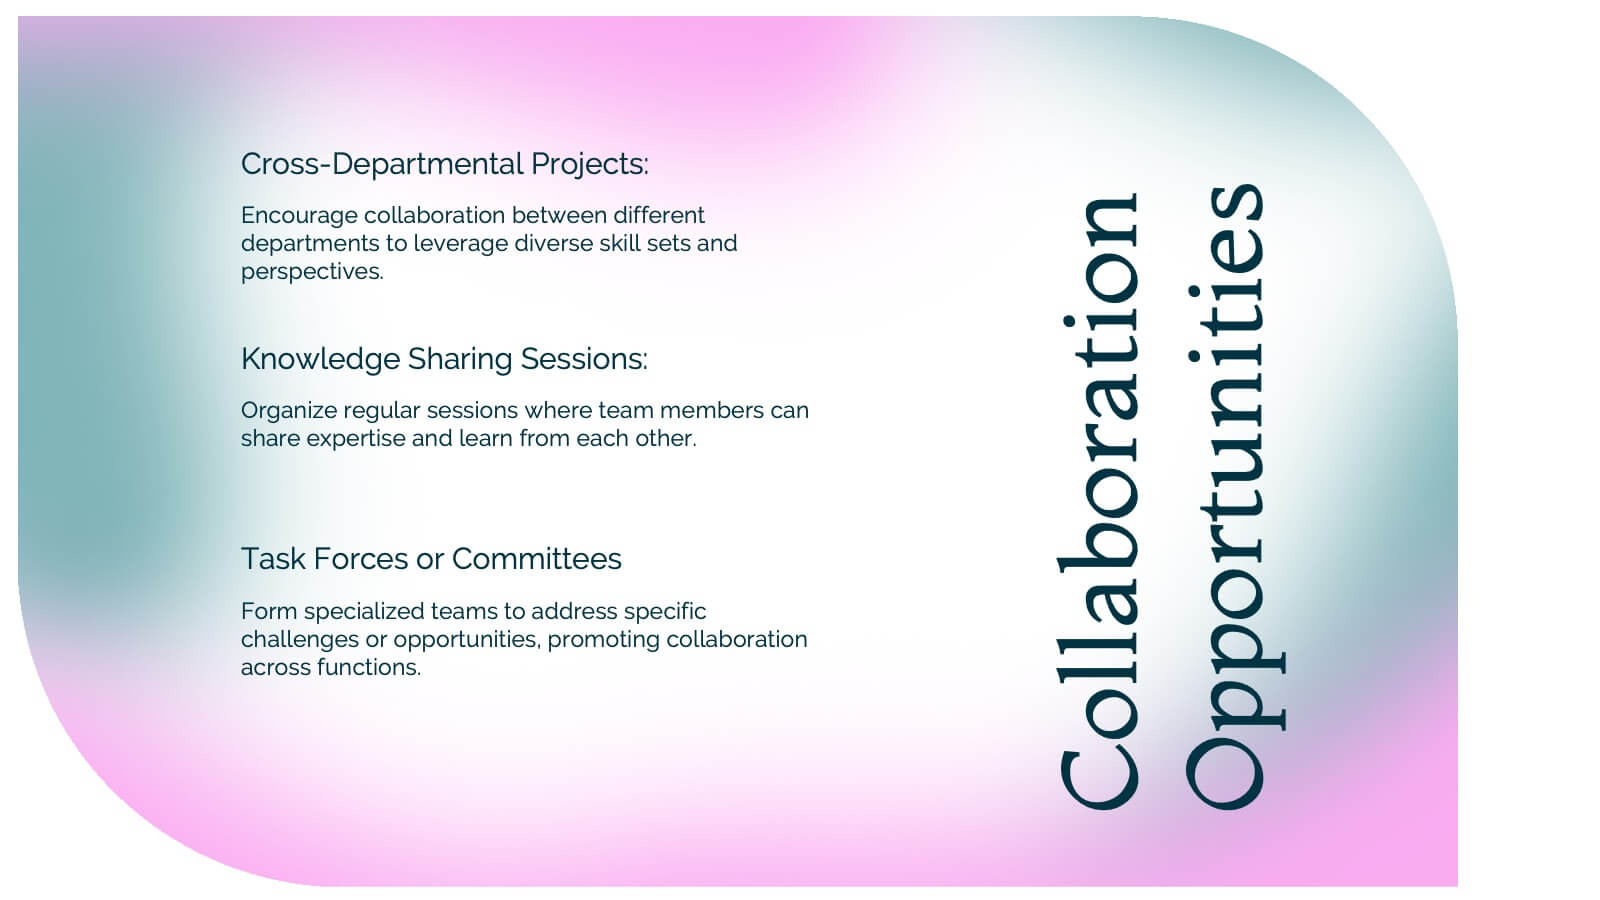
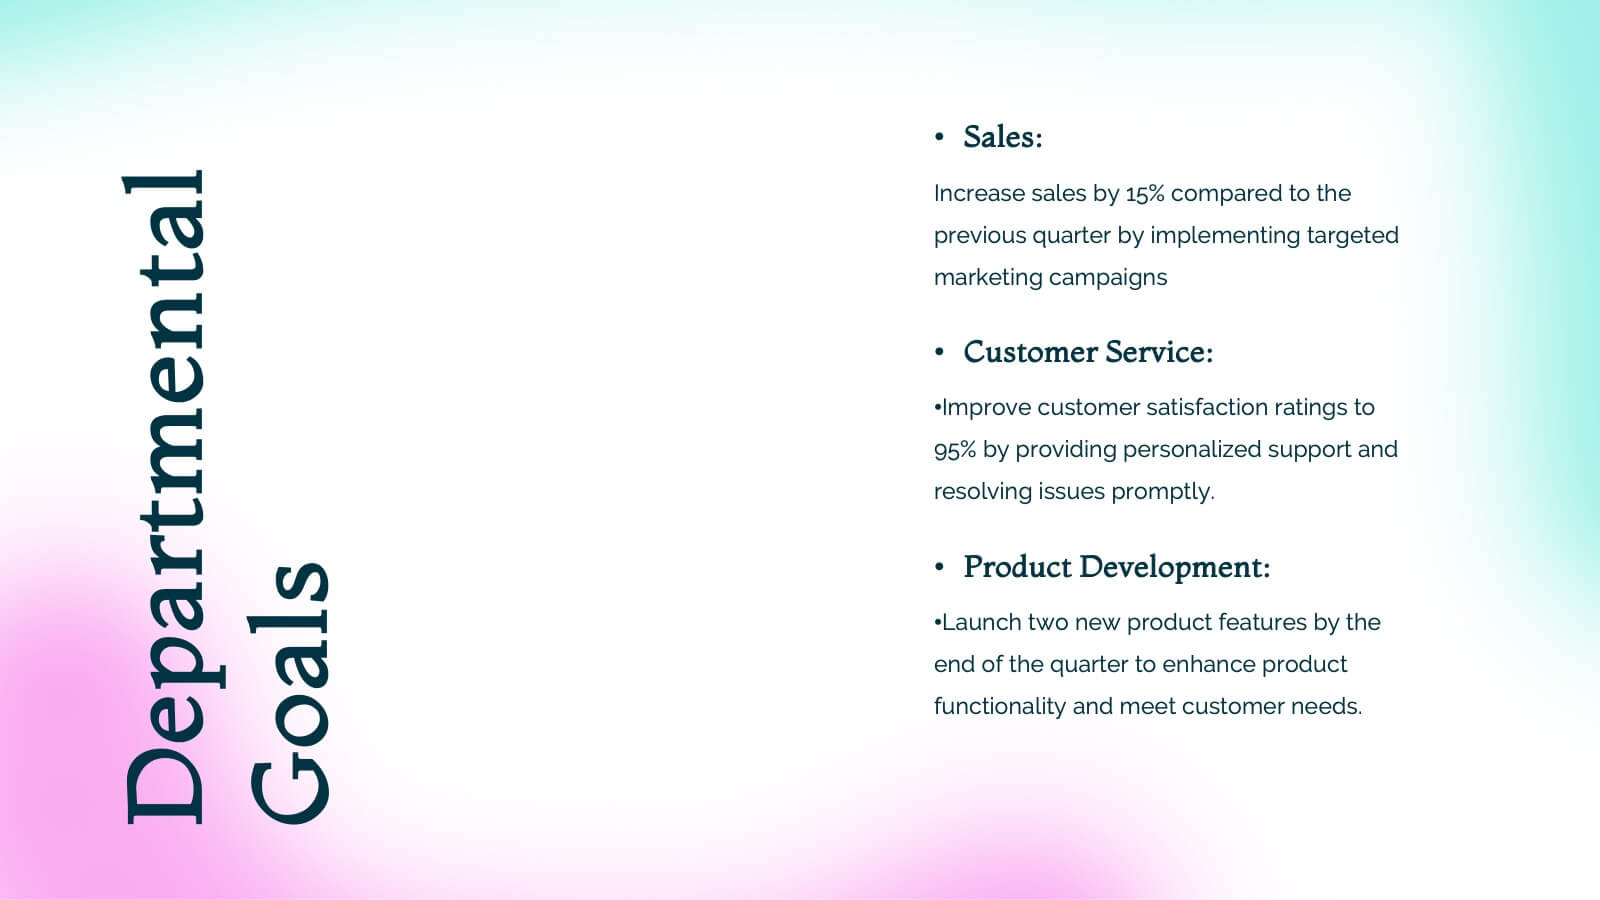
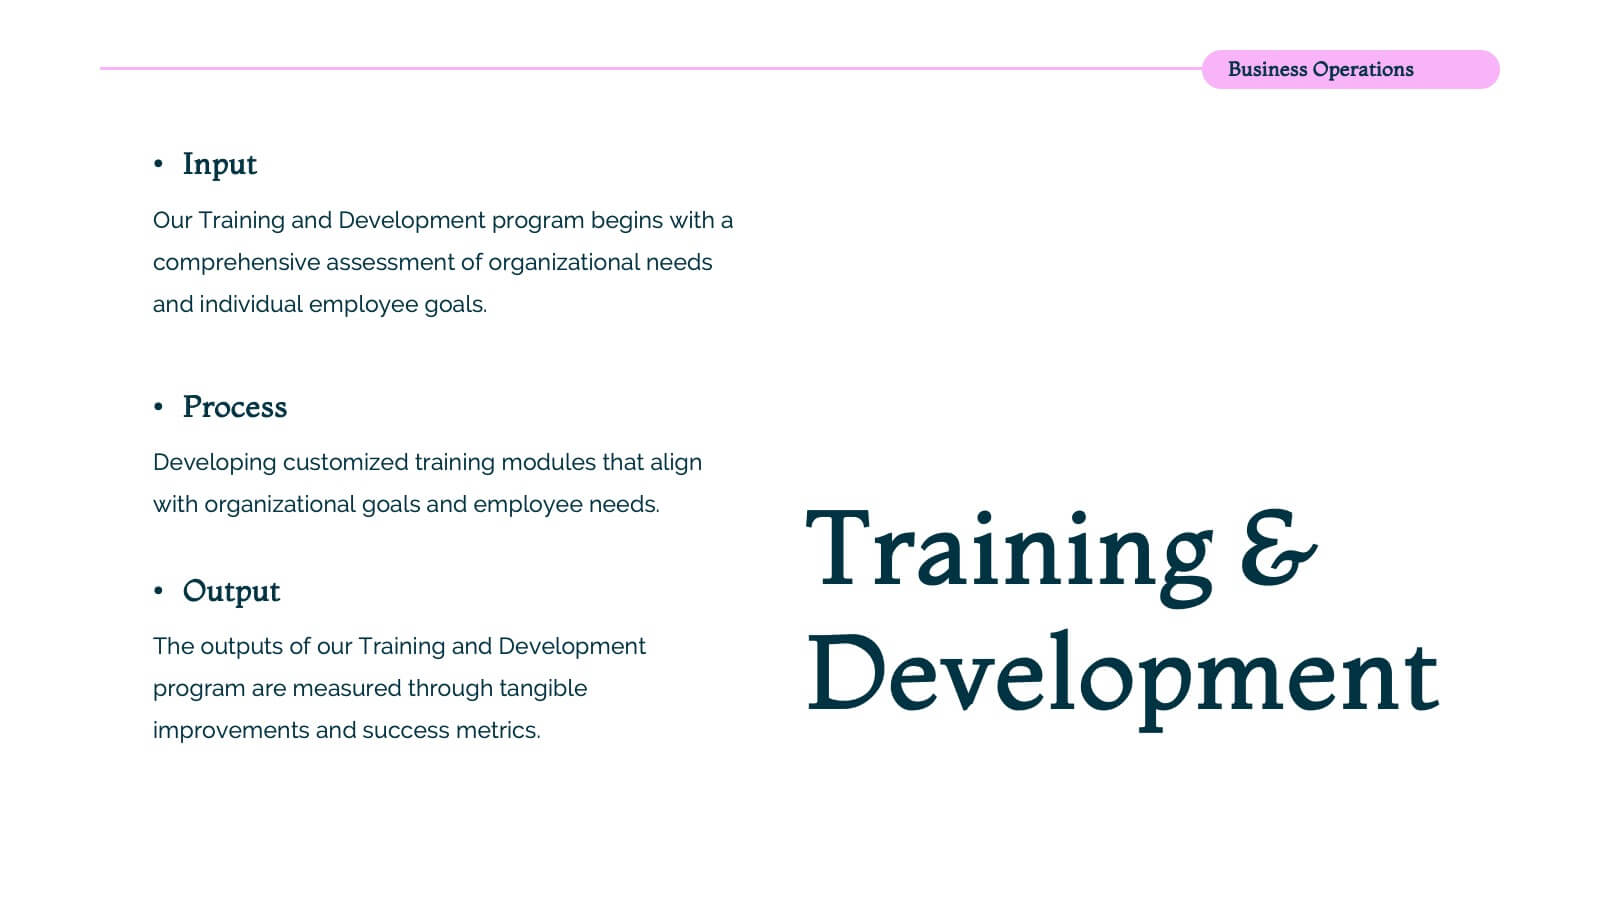
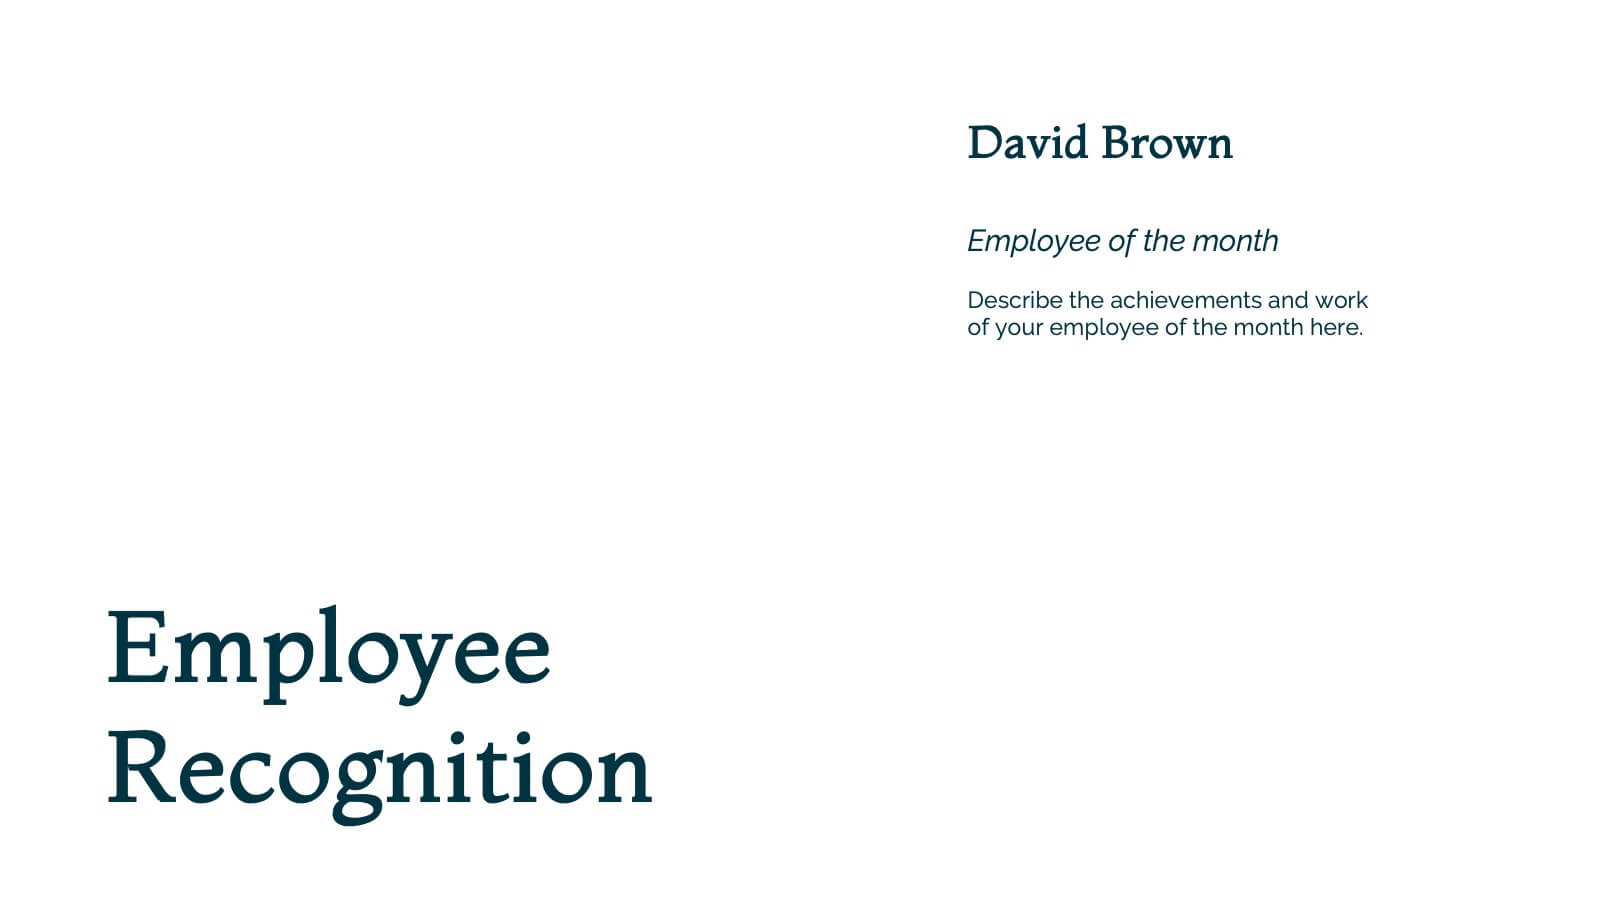
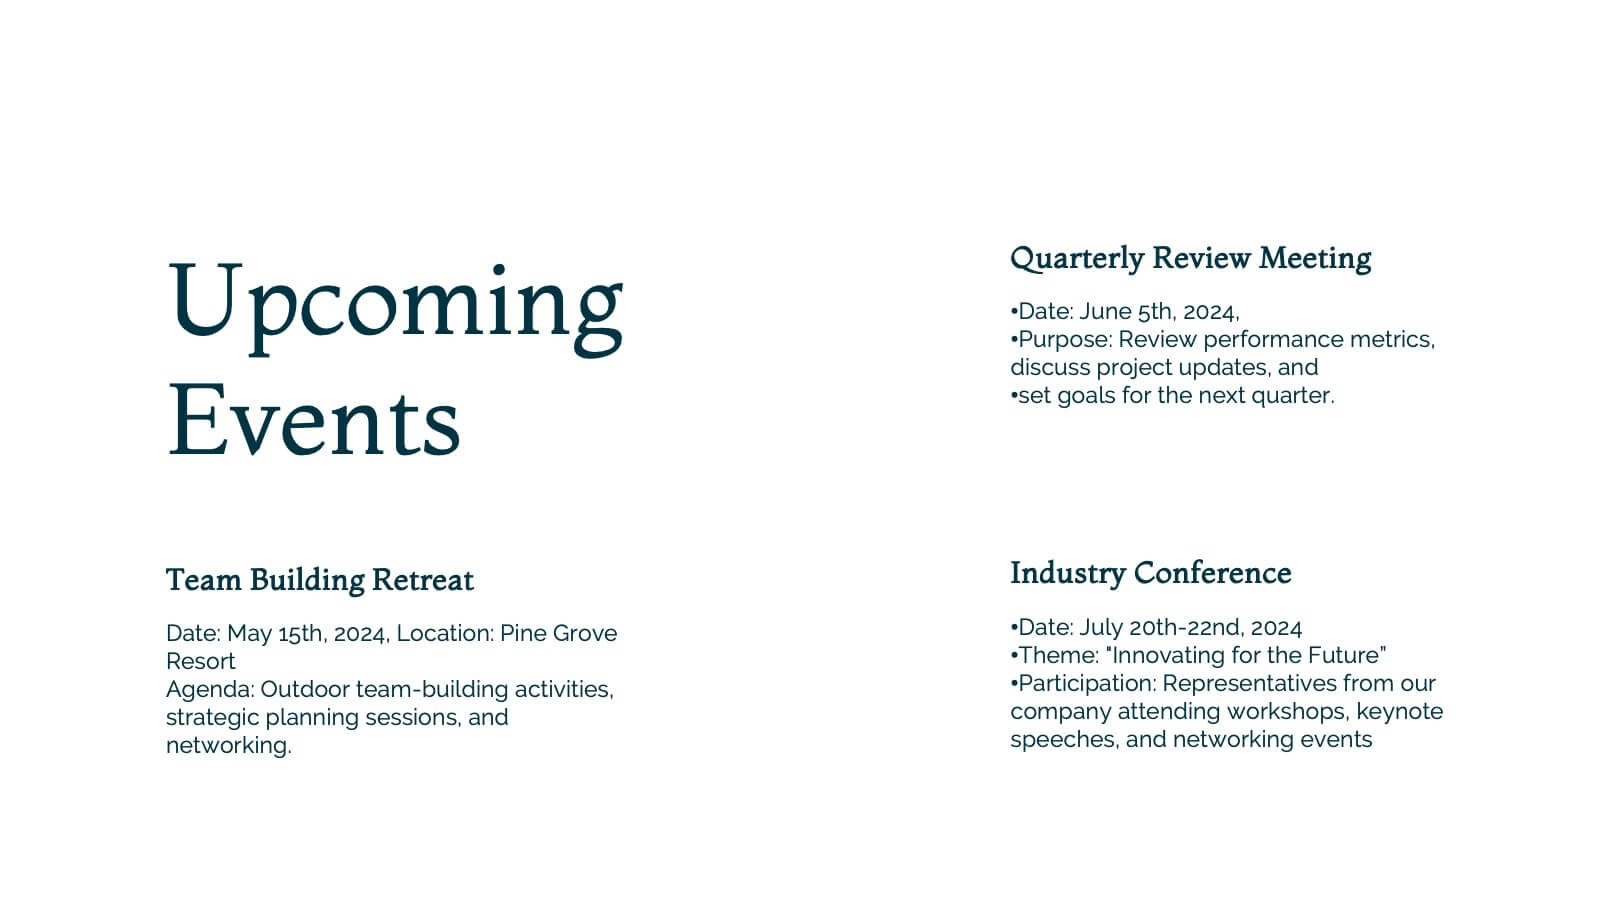
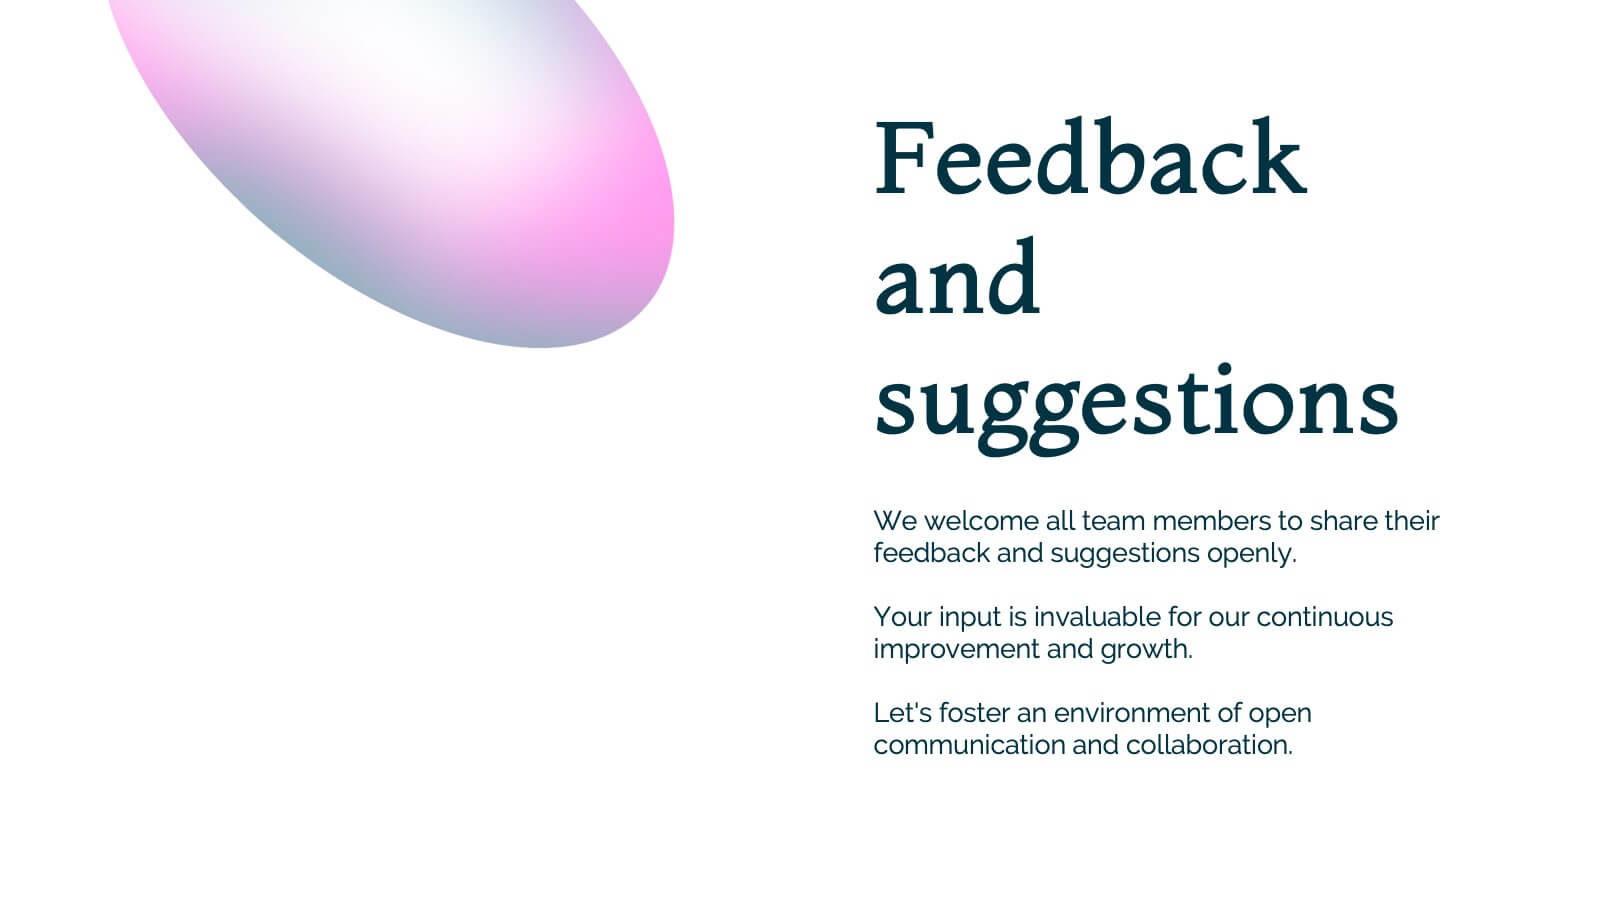
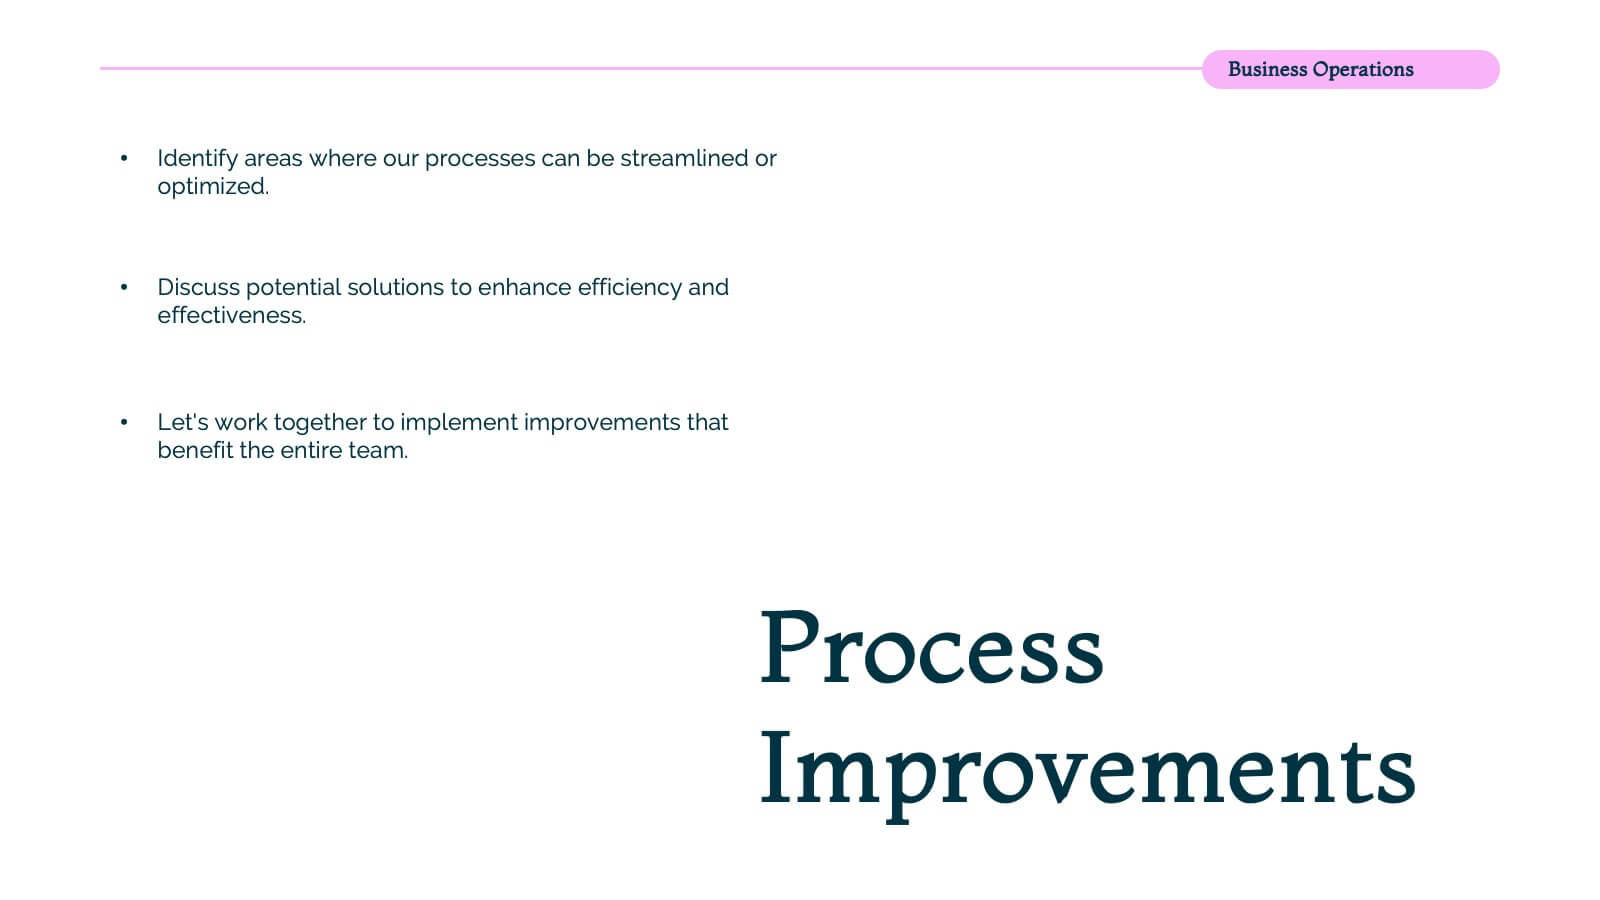
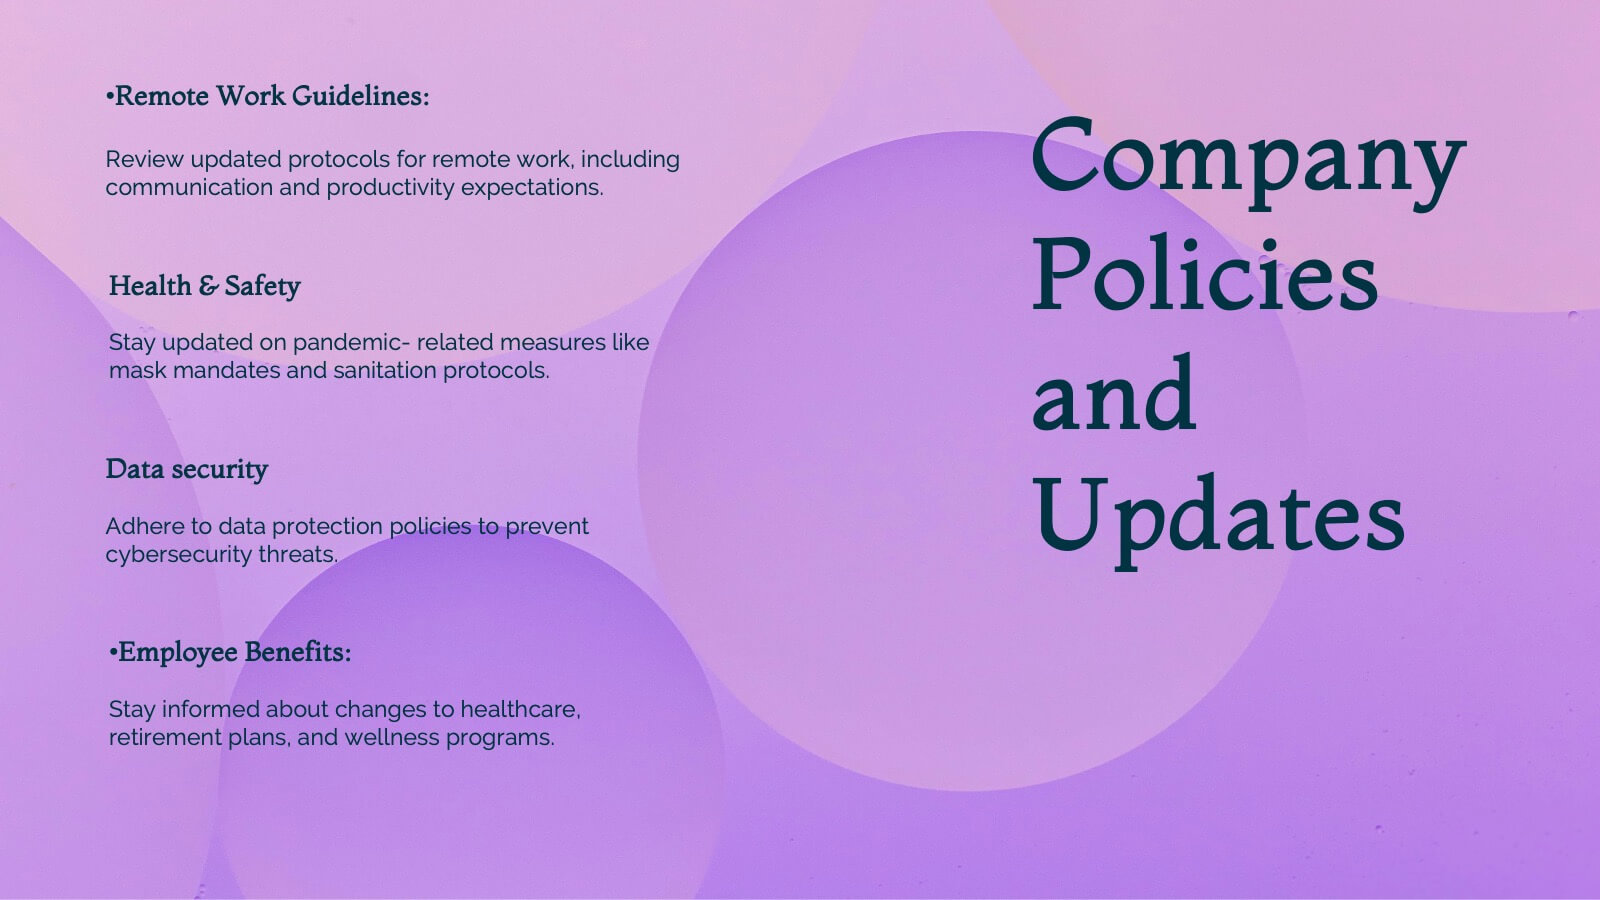
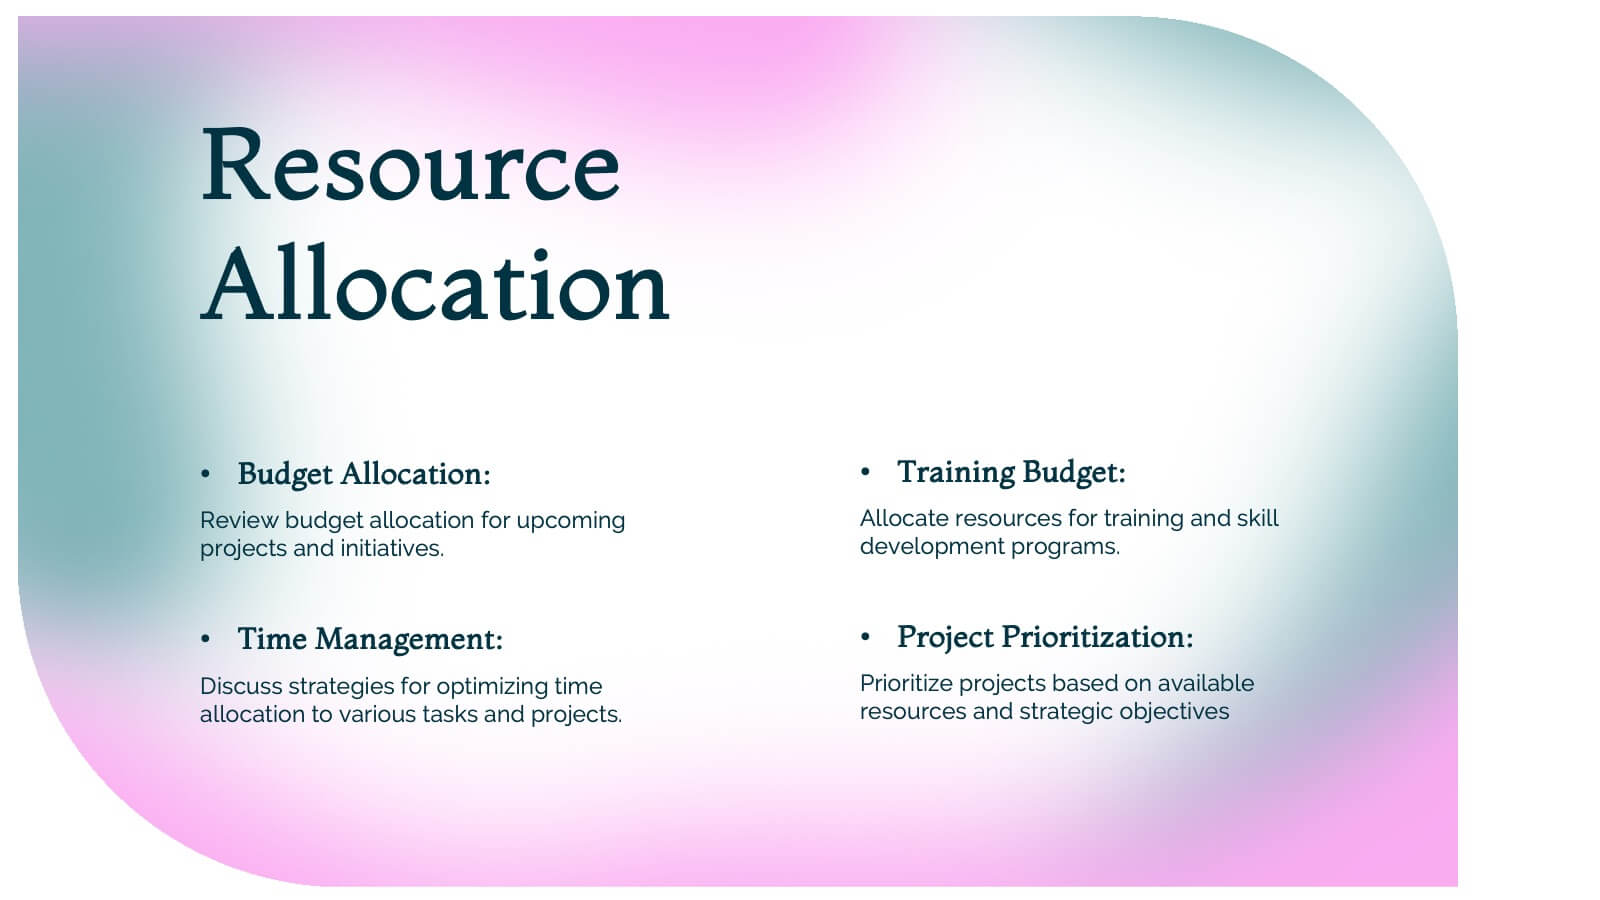
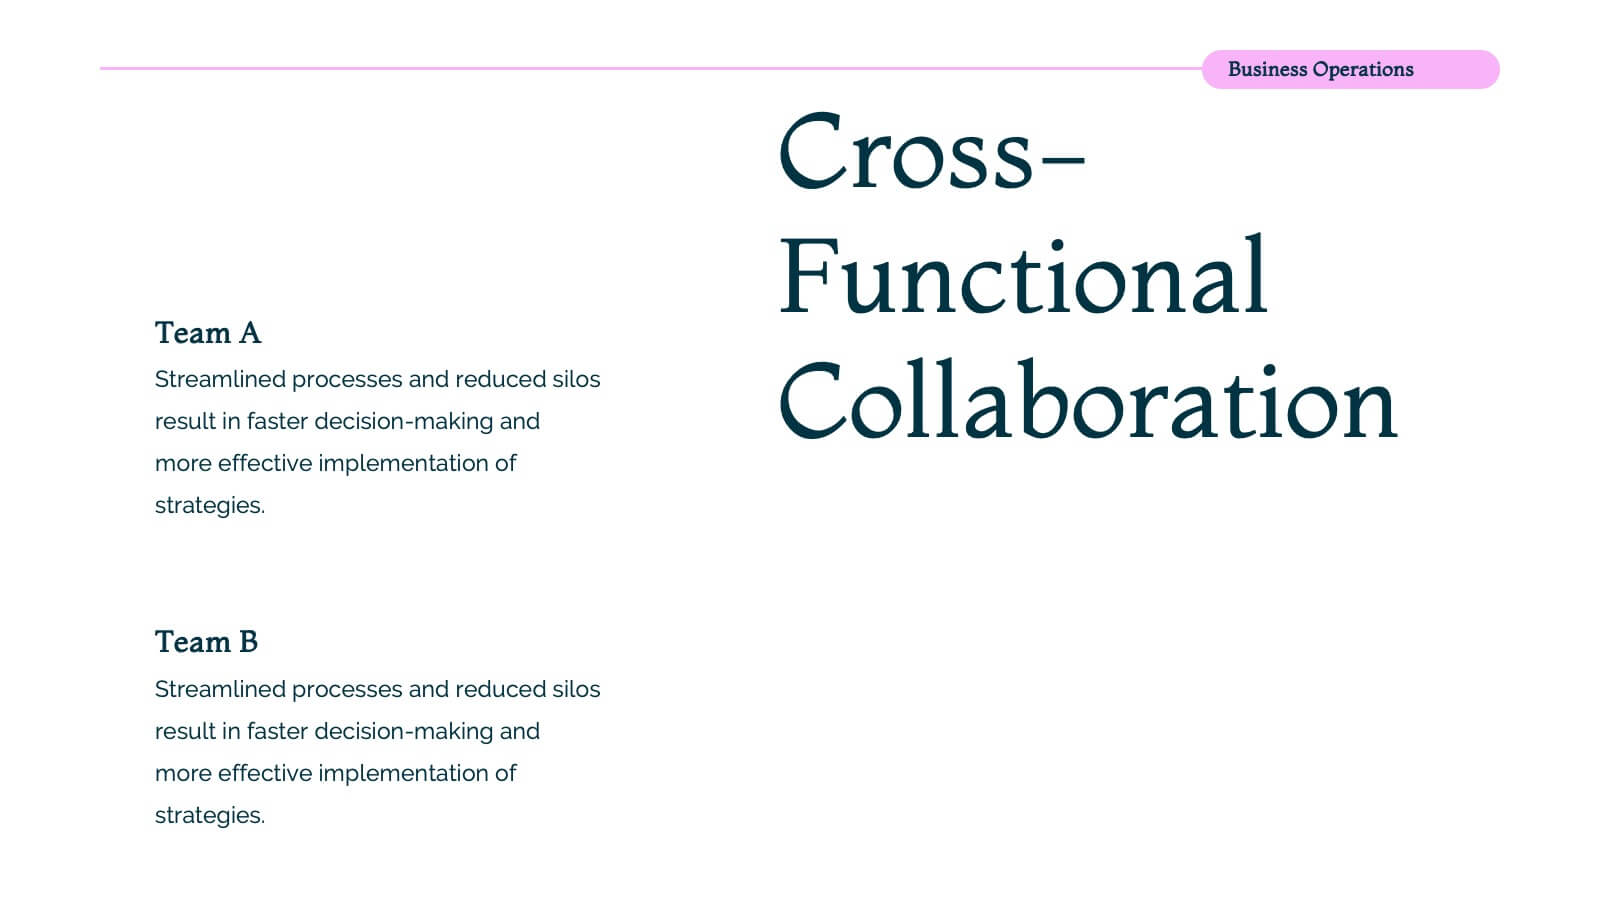
Nova Business Operations Plan Presentation
Create a polished business operations plan with this modern and organized template! It covers everything from team updates and project overviews to resource allocation and collaboration opportunities. Perfect for structuring departmental goals, process improvements, and employee recognition. Compatible with PowerPoint, Keynote, and Google Slides for a seamless, professional presentation.


12 diapositivas
Compliance and Policy Management Presentation
Visualize your compliance ecosystem with the Compliance and Policy Management Presentation. Designed around a planetary orbit concept, this slide maps core policies at the center with surrounding regulations and enforcement layers. Each orbit can represent levels of governance, department roles, or regulatory zones—making it ideal for risk teams, auditors, and legal advisors. Fully customizable in PowerPoint, Keynote, and Google Slides for seamless use.


5 diapositivas
Professional Relationship Network Presentation
Map out key business connections using this Professional Relationship Network template. Ideal for showcasing client relationships, internal team dynamics, or communication hierarchies. This clean, modern design helps clarify roles and links across stakeholders. Fully editable and compatible with PowerPoint, Keynote, and Google Slides for flexible use in any setting.


6 diapositivas
Agile Delivery Framework for Projects Presentation
Visualize agile project phases with this spiral delivery framework slide. Ideal for project managers and scrum teams to outline each step in a continuous delivery process. Features six clearly labeled stages, icons, and bold colors. Fully editable in PowerPoint, Keynote, and Google Slides for clear, structured agile workflow presentations.


7 diapositivas
Modern Artificial Intelligence Infographic
Modern Artificial Intelligence refers to the contemporary state of AI technology, methods, and applications that have evolved significantly in recent years, especially from the early 21st century onwards. This infographic template is designed to present complex information in a clear and engaging manner. This template uses visuals like charts, graphs, icons, and text to enhance understanding. The objective of this infographic is to provide a visual and informative snapshot of the contemporary landscape of artificial intelligence, making complex concepts accessible to a broad audience.


12 diapositivas
Corporate Hierarchy Structure Presentation
Showcase your Corporate Hierarchy Structure with a sleek and professional design. This template helps visualize organizational roles, reporting relationships, and team structures for clear communication. Perfect for HR teams, business leaders, and project managers, it’s fully customizable and compatible with PowerPoint, Keynote, and Google Slides for easy editing.


8 diapositivas
Achievements and Goals Milestone
Illustrate your team's journey with this visually engaging milestone roadmap. Featuring a step-by-step block design with space for five key accomplishments, it's perfect for goal tracking, progress reviews, or roadmap presentations. Fully editable in PowerPoint, Keynote, and Google Slides.


7 diapositivas
Structure Diagram Infographics
Structure is important because it provides a framework for organization and order, which helps to facilitate efficiency, productivity, and success in many different areas of life. This template is a powerful tool that can help you organize, visualize, and present your data in a compelling way. This infographic template is designed to illustrate the structure and workings of a company or organization. It includes a variety of customizable photo layouts and charts so you can edit the look to suit your needs. This presentation is designed for use in Powerpoint, Keynote and Google Slides.


7 diapositivas
Alphabet Letters Infographic
An alphabet infographic is a visual representation or graphic that presents information related to the alphabet, often used for educational purposes or to convey information in a creative and engaging manner. Get ready to embark on a joyful journey through the wonderland of letters and words with our alphabet letters infographic. This infographic template includes various elements like letters, words, examples, pronunciation guides, or related images. This is more than just an infographic—it's a vibrant celebration of language, learning, and pure happiness. Dive into the kaleidoscope of alphabets and spread the cheer!


4 diapositivas
Team Collaboration Puzzle Slide Presentation
Showcase team synergy with the Team Collaboration Puzzle Slide Presentation. This engaging design uses interlocking human figures to symbolize unity and contribution, making it perfect for presenting roles, responsibilities, or collaborative workflows. Fully editable in Canva, PowerPoint, or Google Slides—ideal for team introductions, project planning, or partnership overviews.


7 diapositivas
Short Term Goals Infographic Presentation
Short-term Goals are important because they provide a clear focus and direction for individuals or organizations to achieve their long-term objectives. Get started on your goals in no time with this template. It is professional, clean and has everything you need to create a presentation. It's a good choice for career advancement and pitches. This template is designed to help your audience visualize the impact of your goals. Use this template as a base to brainstorm your vision and objectives with your team. The goal-oriented design will bring awareness and create excitement about your goals.


10 diapositivas
Lean Six Sigma Business Strategy Presentation
Enhance your operational efficiency with our Lean Six Sigma Business Strategy template! This user-friendly guide helps you navigate through the core stages—Define, Measure, Analyze, Improve, and Control—optimizing processes and reducing waste. Compatible with PowerPoint, Keynote, and Google Slides, this template is perfect for professionals aiming to drive business excellence through structured problem-solving.


6 diapositivas
Bitcoin and Blockchain Technology Presentation
Unlock the potential of cryptocurrency and distributed ledger technology with our "Bitcoin and Blockchain Technology" presentation templates. These templates are designed to elucidate complex concepts in an understandable format, making them ideal for educators, technologists, and business professionals. Compatible with PowerPoint, Keynote, and Google Slides, they are a versatile tool for anyone looking to explain or explore the innovative world of blockchain.