


Características


¿Tienes alguna pregunta?
Recomendar


6 diapositivas
Data Science and AI Big Data Presentation
Transform complex data concepts into engaging visuals with the Data Science and AI Big Data Presentation. This fully editable template highlights key areas such as machine learning, predictive analytics, automation, and data-driven decision-making. Perfect for data analysts, AI specialists, and business leaders, it’s available for PowerPoint, Keynote, and Google Slides, ensuring a modern and structured presentation.


7 diapositivas
Performance Summary Infographic
Boost your reporting capabilities with our Infographic Templates, designed to deliver exceptional clarity and impact. This series is perfectly suited for professionals seeking to present performance data compellingly and concisely. With a variety of designs including radial graphs, tiered lists, and comparative bars, these templates allow for an informative and aesthetically pleasing showcase of critical metrics. Each template is customizable, letting you adjust the color schemes and text to fit your corporate style, enhancing both visual appeal and brand consistency. Whether used in PowerPoint, Google Slides, or Keynote, these tools are vital for anyone looking to articulate achievements, assess comparative results, and plan based on solid data insights. They are indispensable for consultants, managers, and team leaders who require clear, persuasive presentation resources to drive decisions and highlight successes.


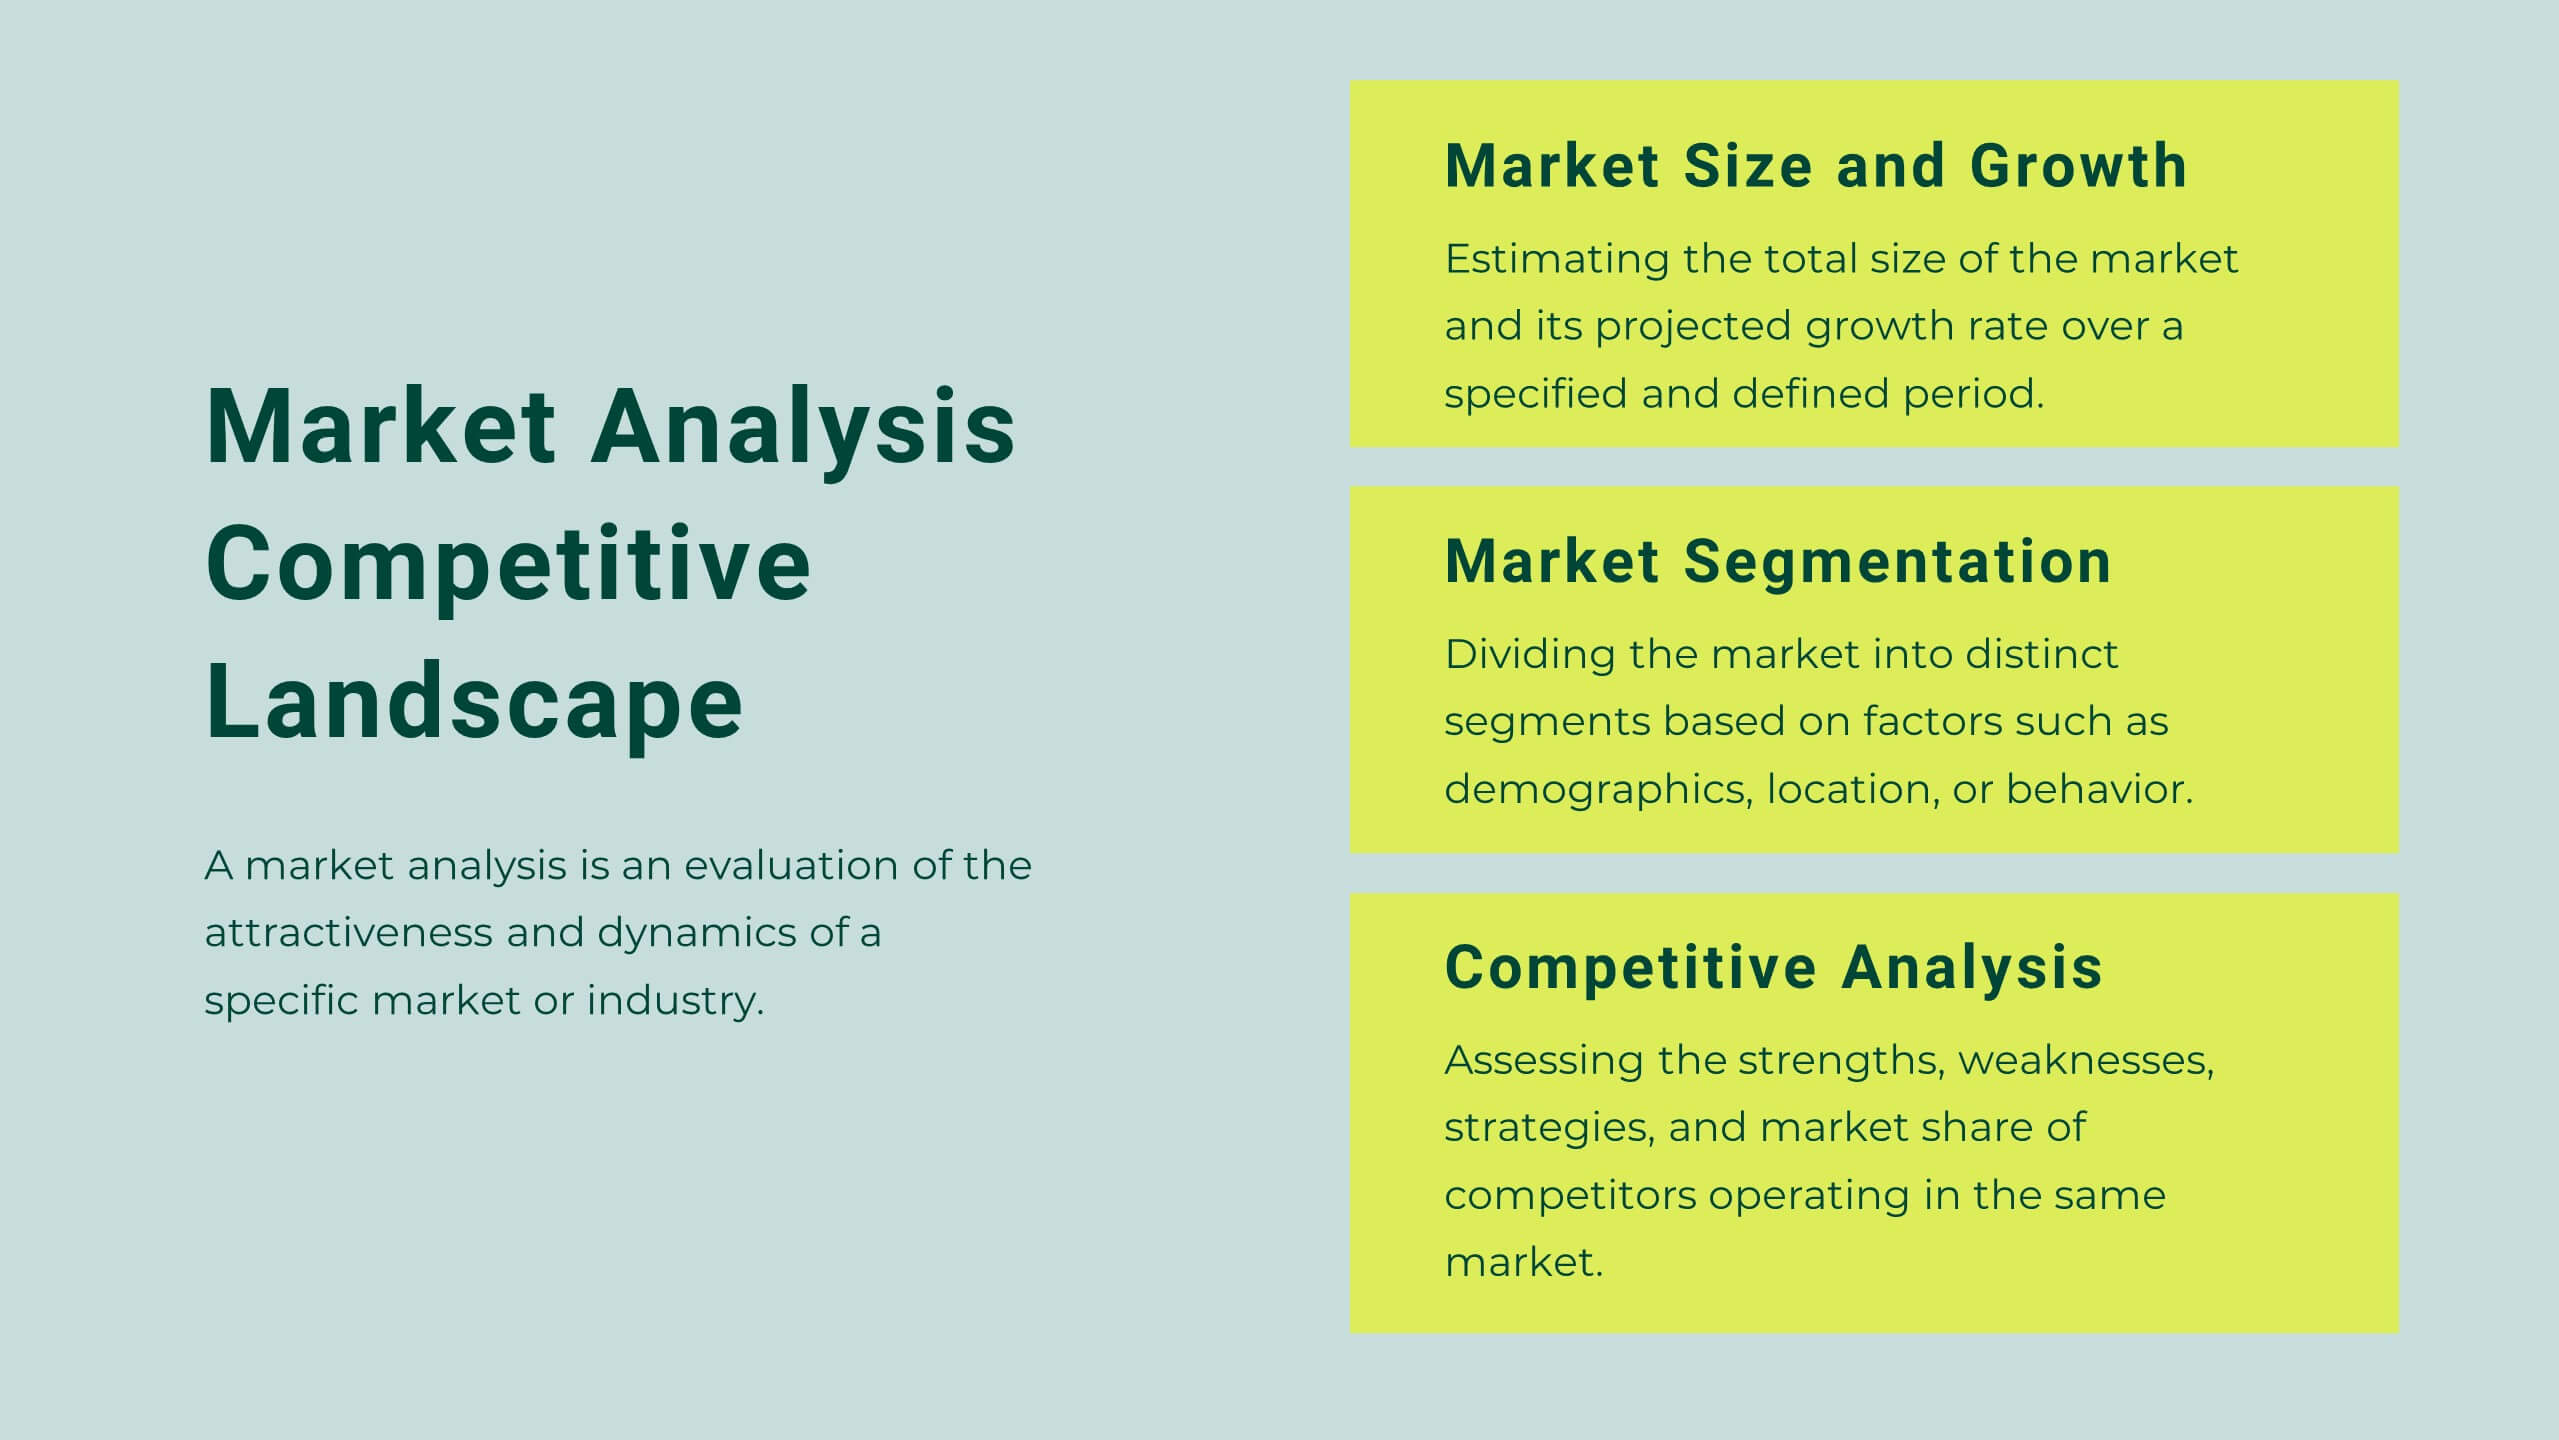
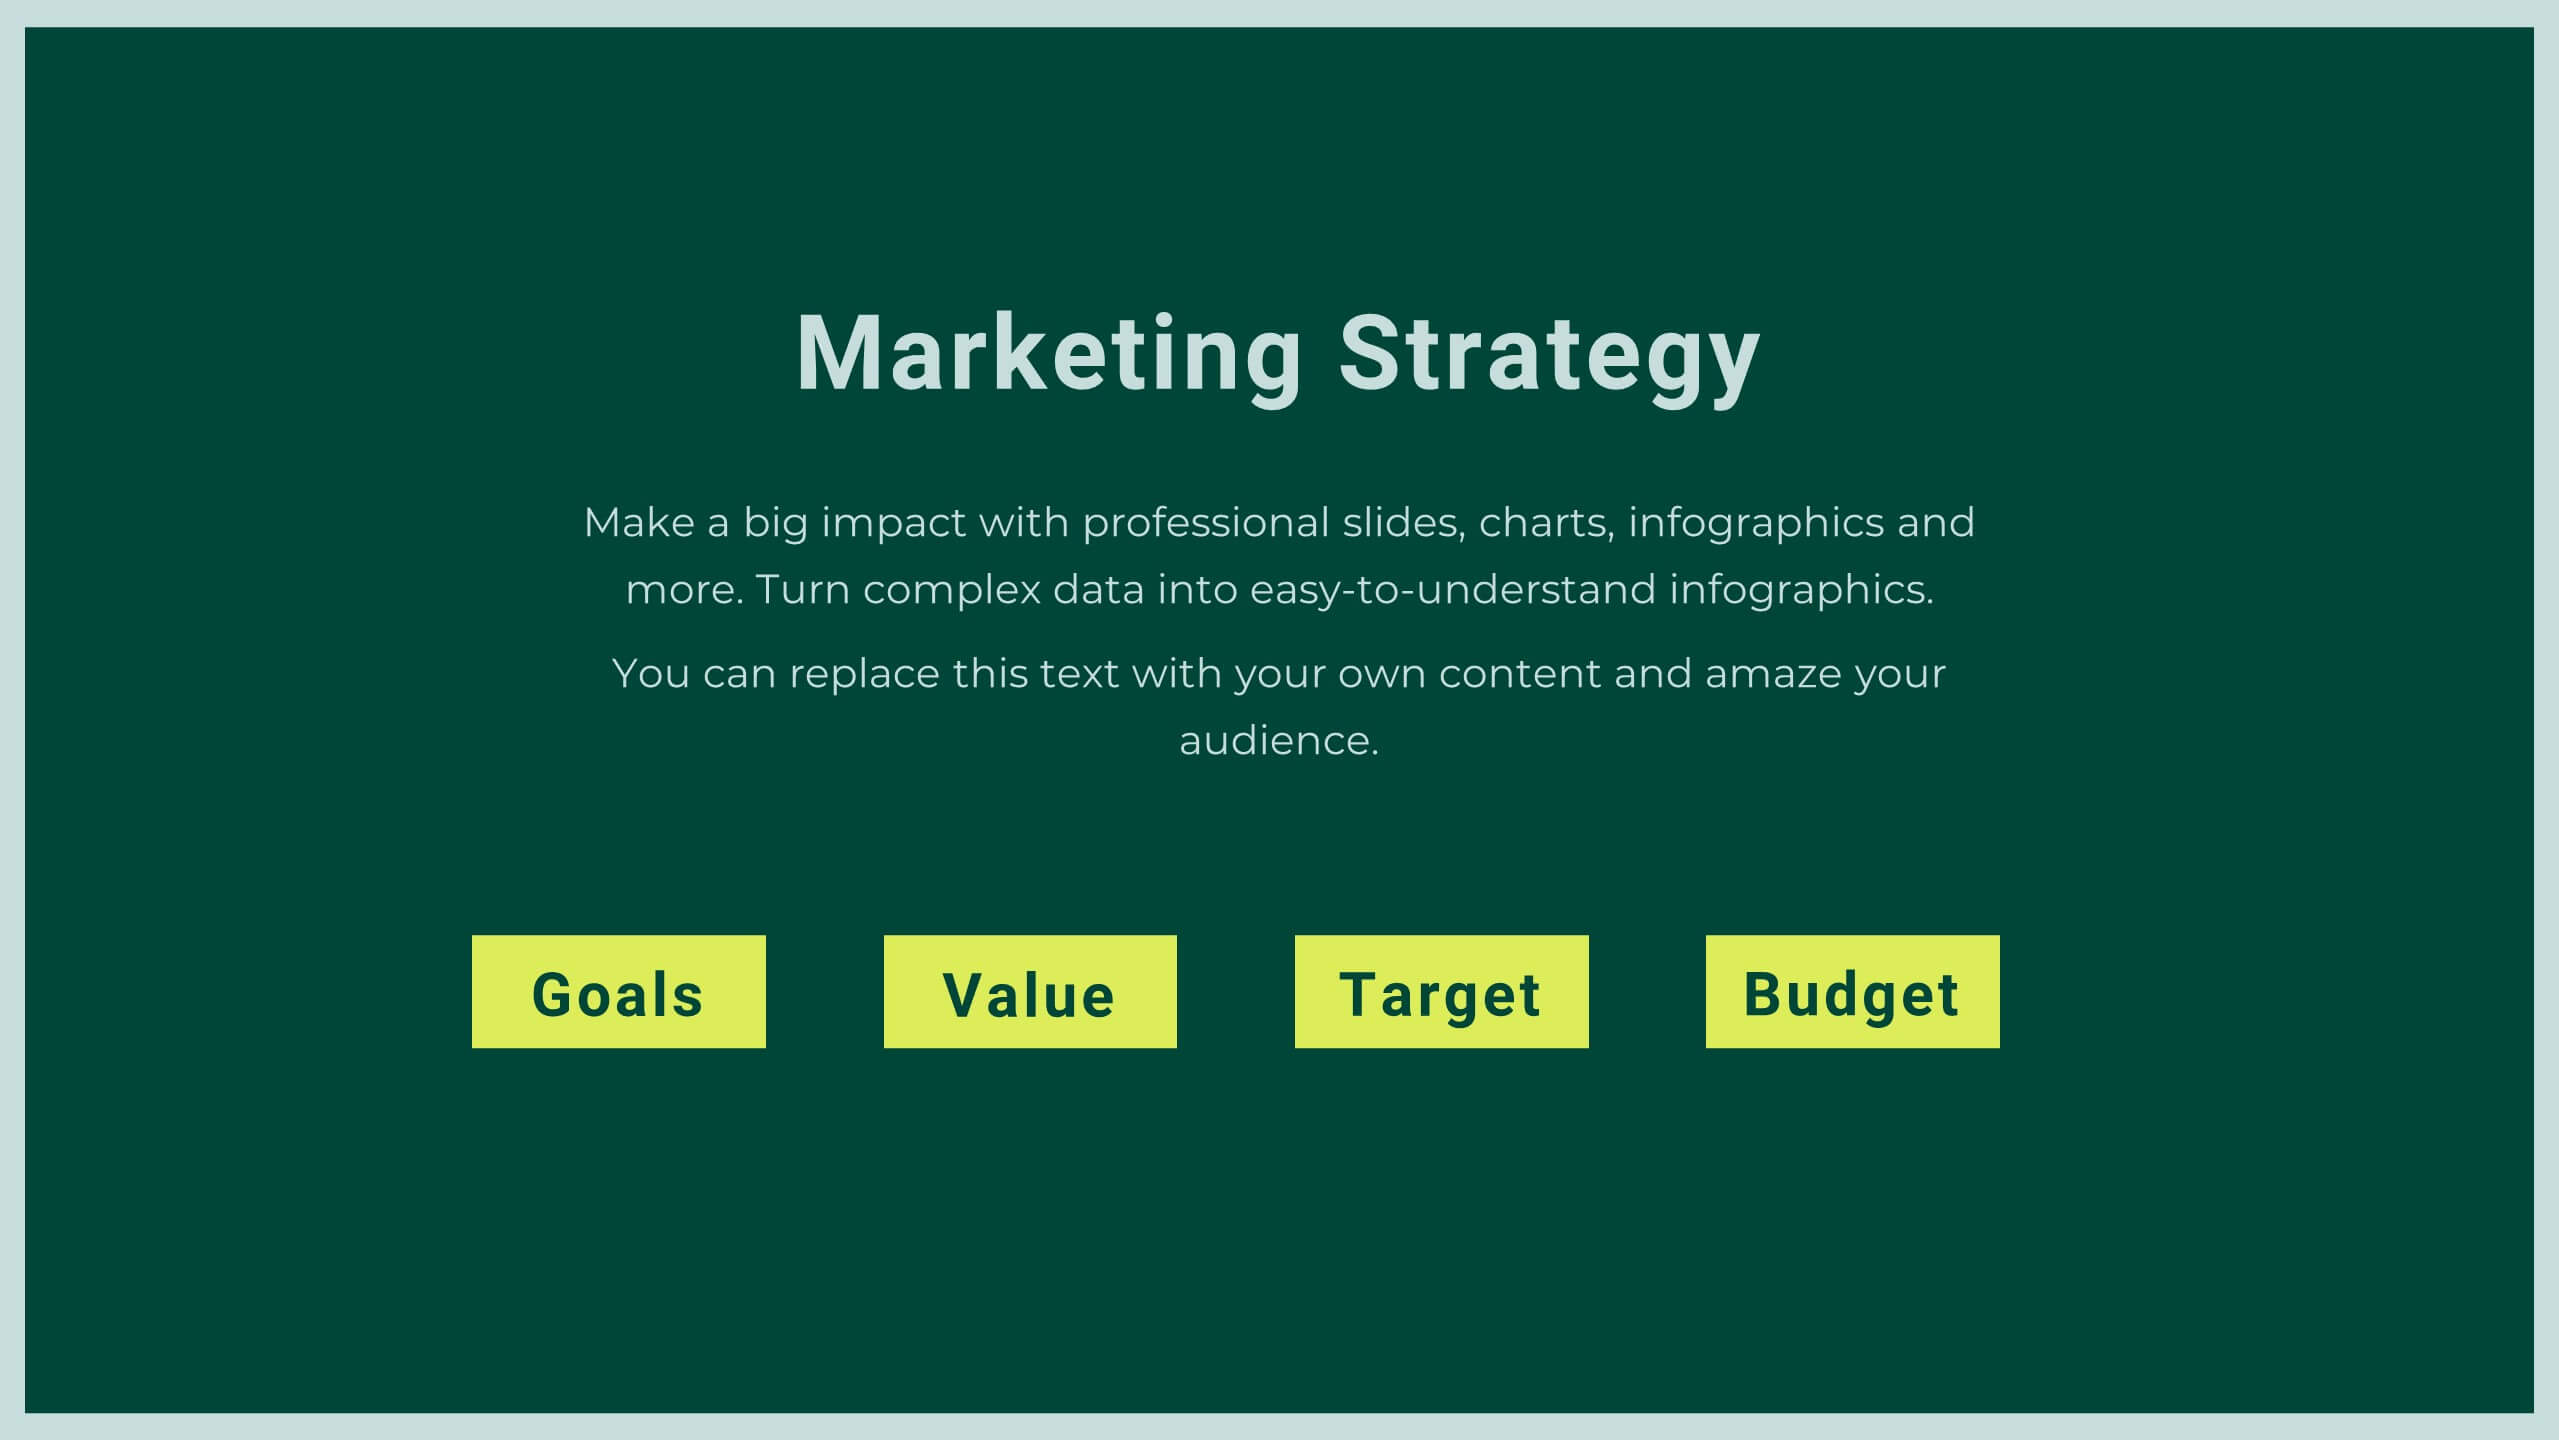
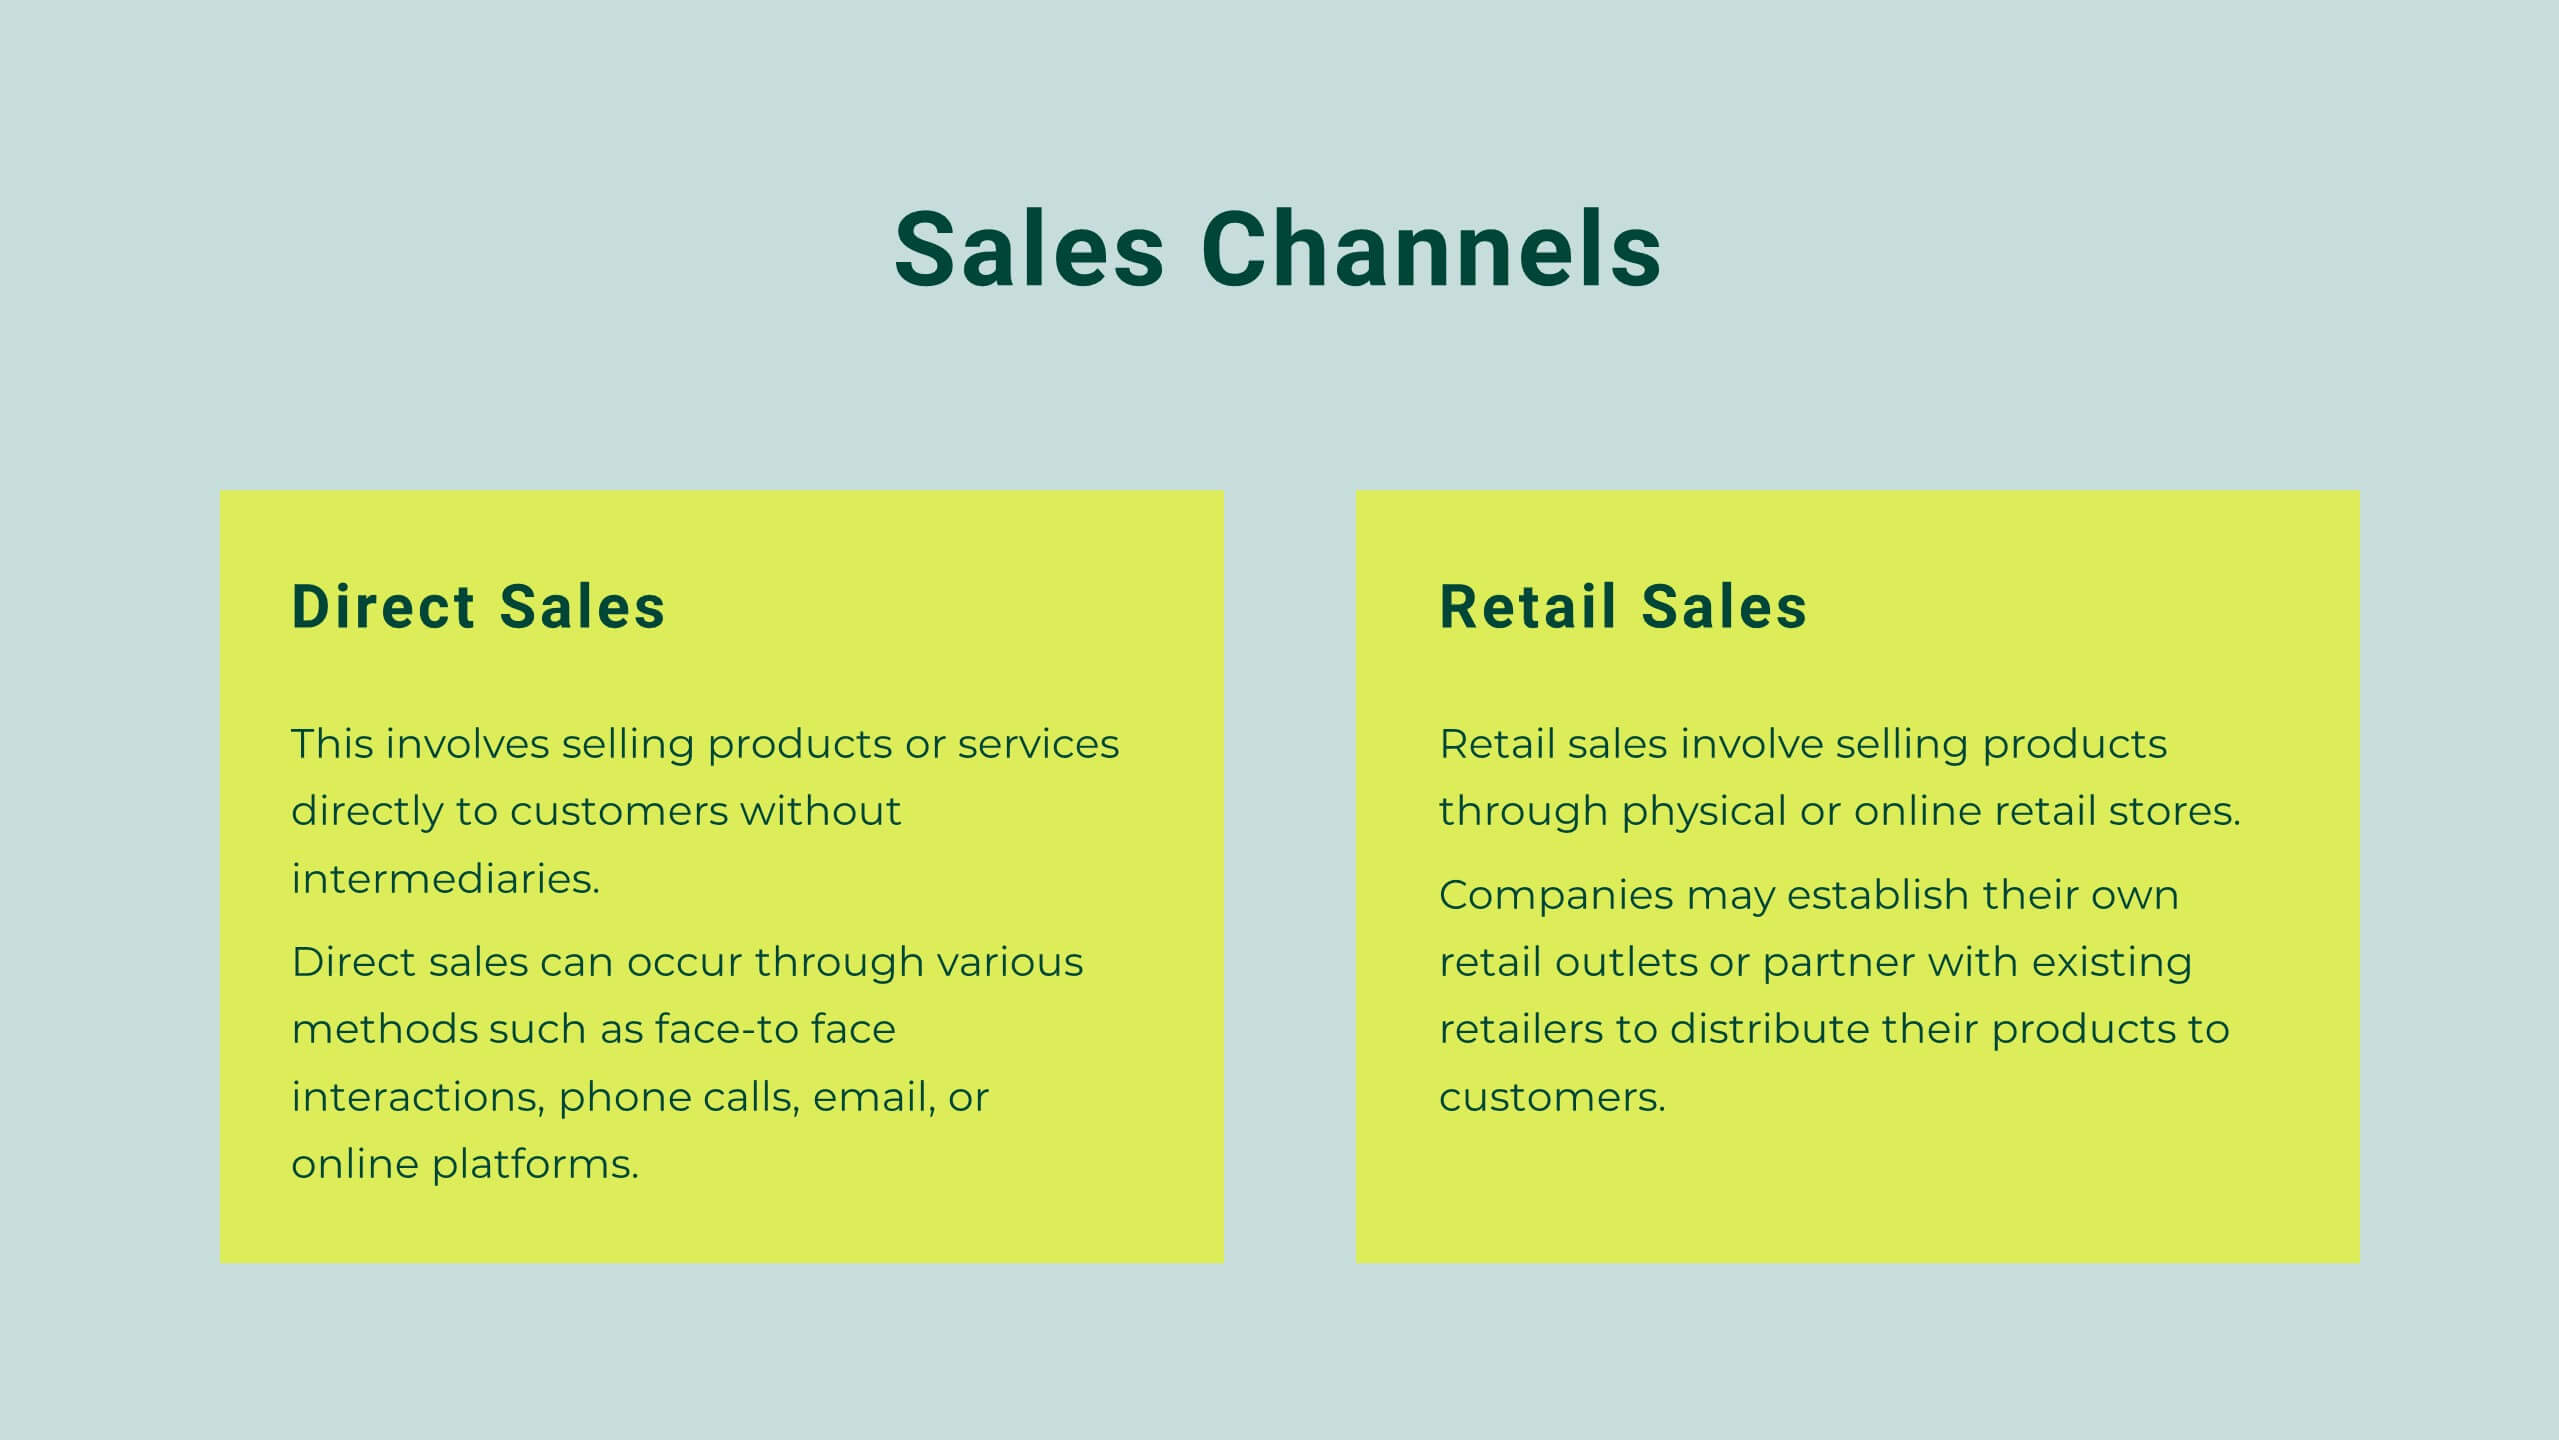
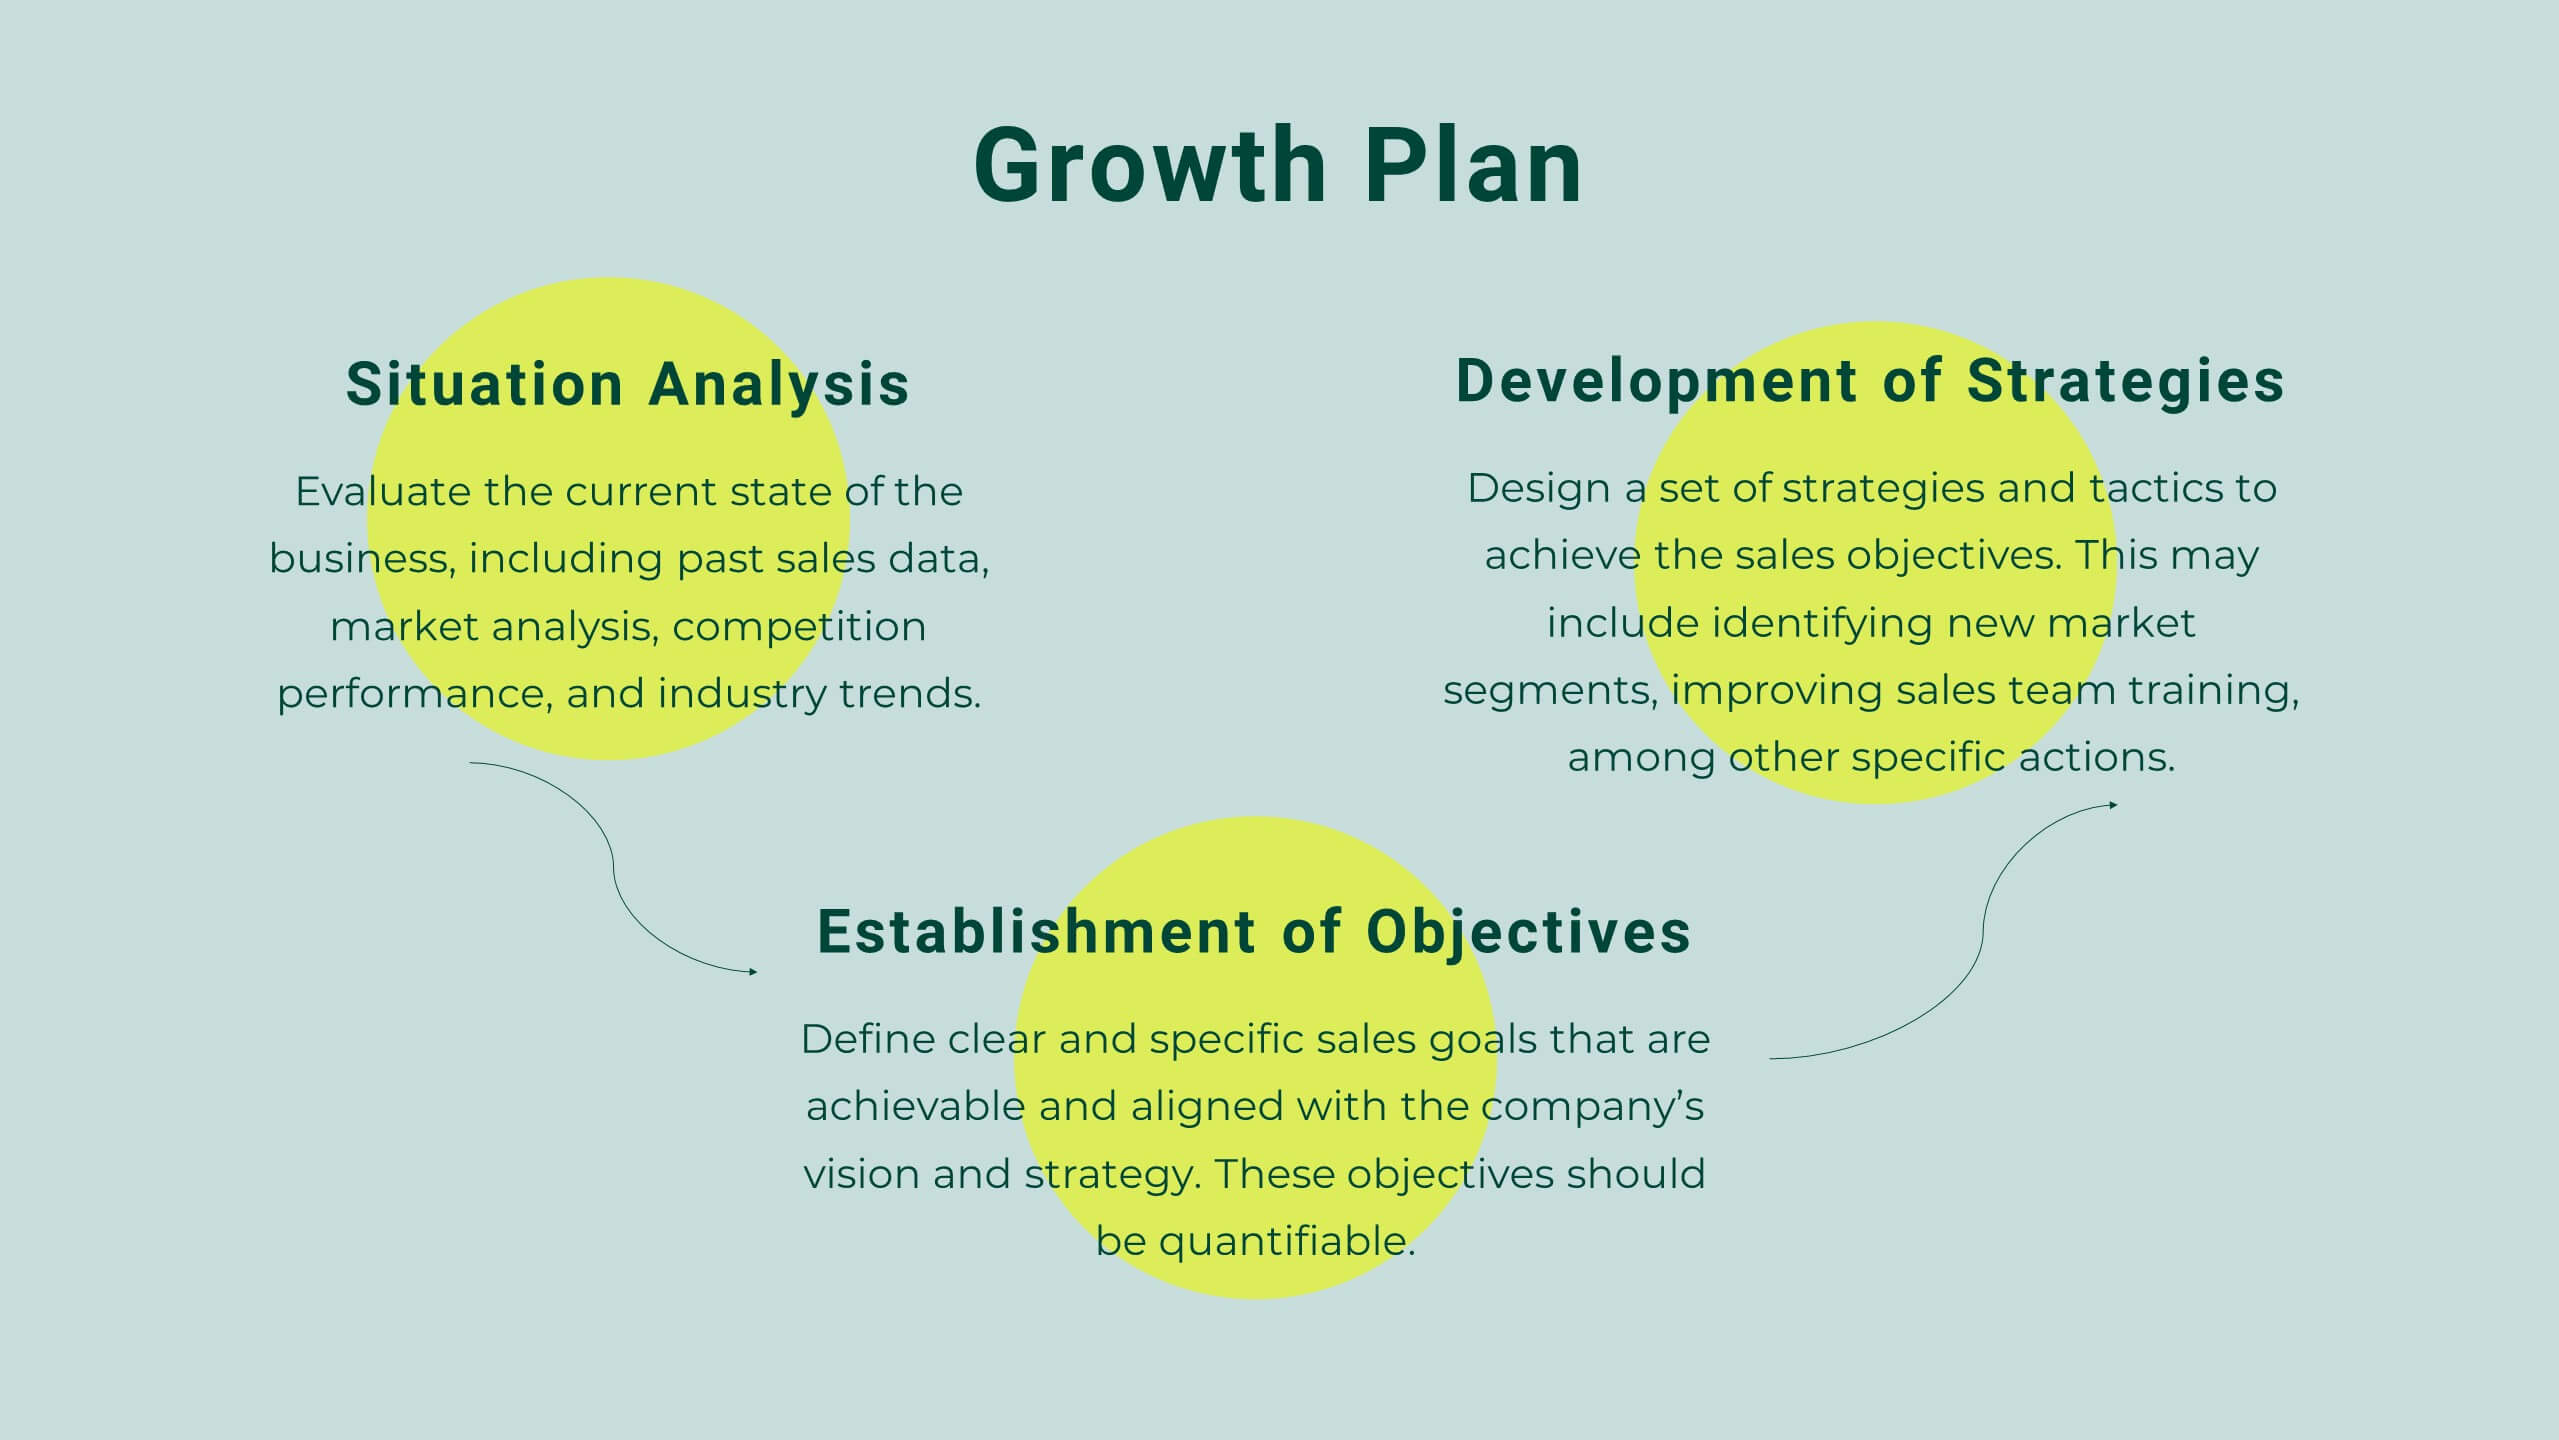
23 diapositivas
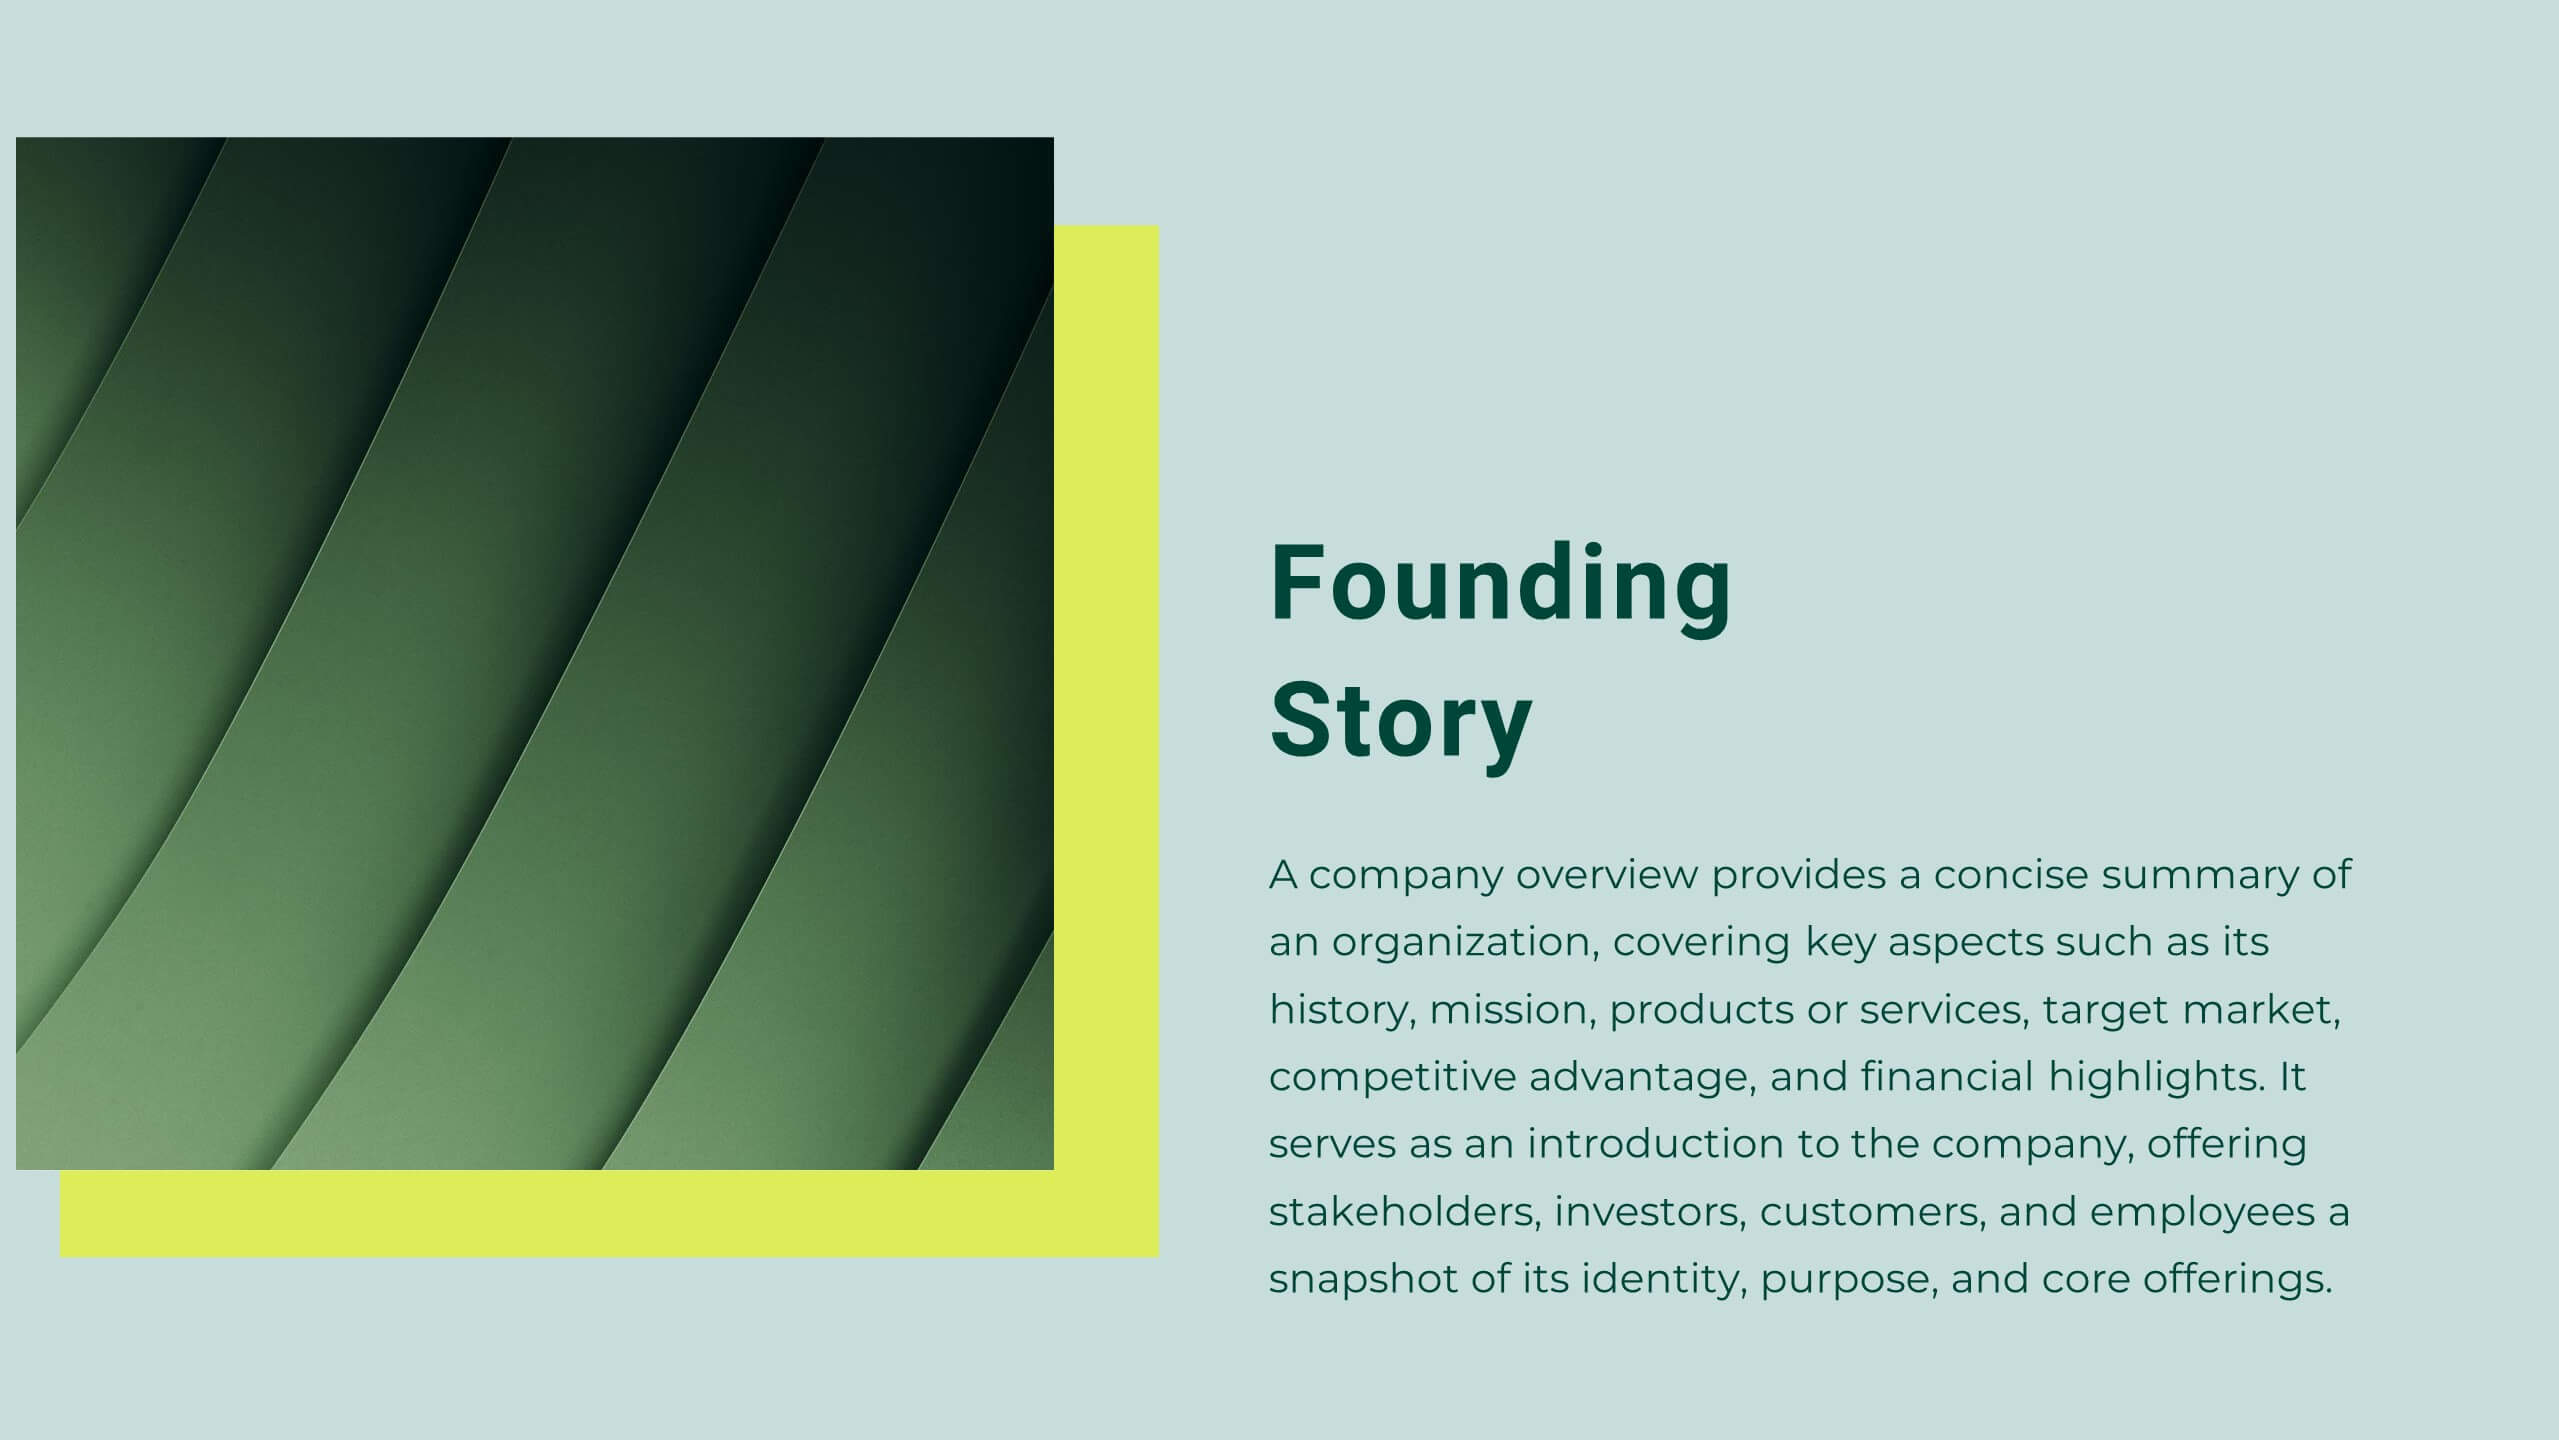
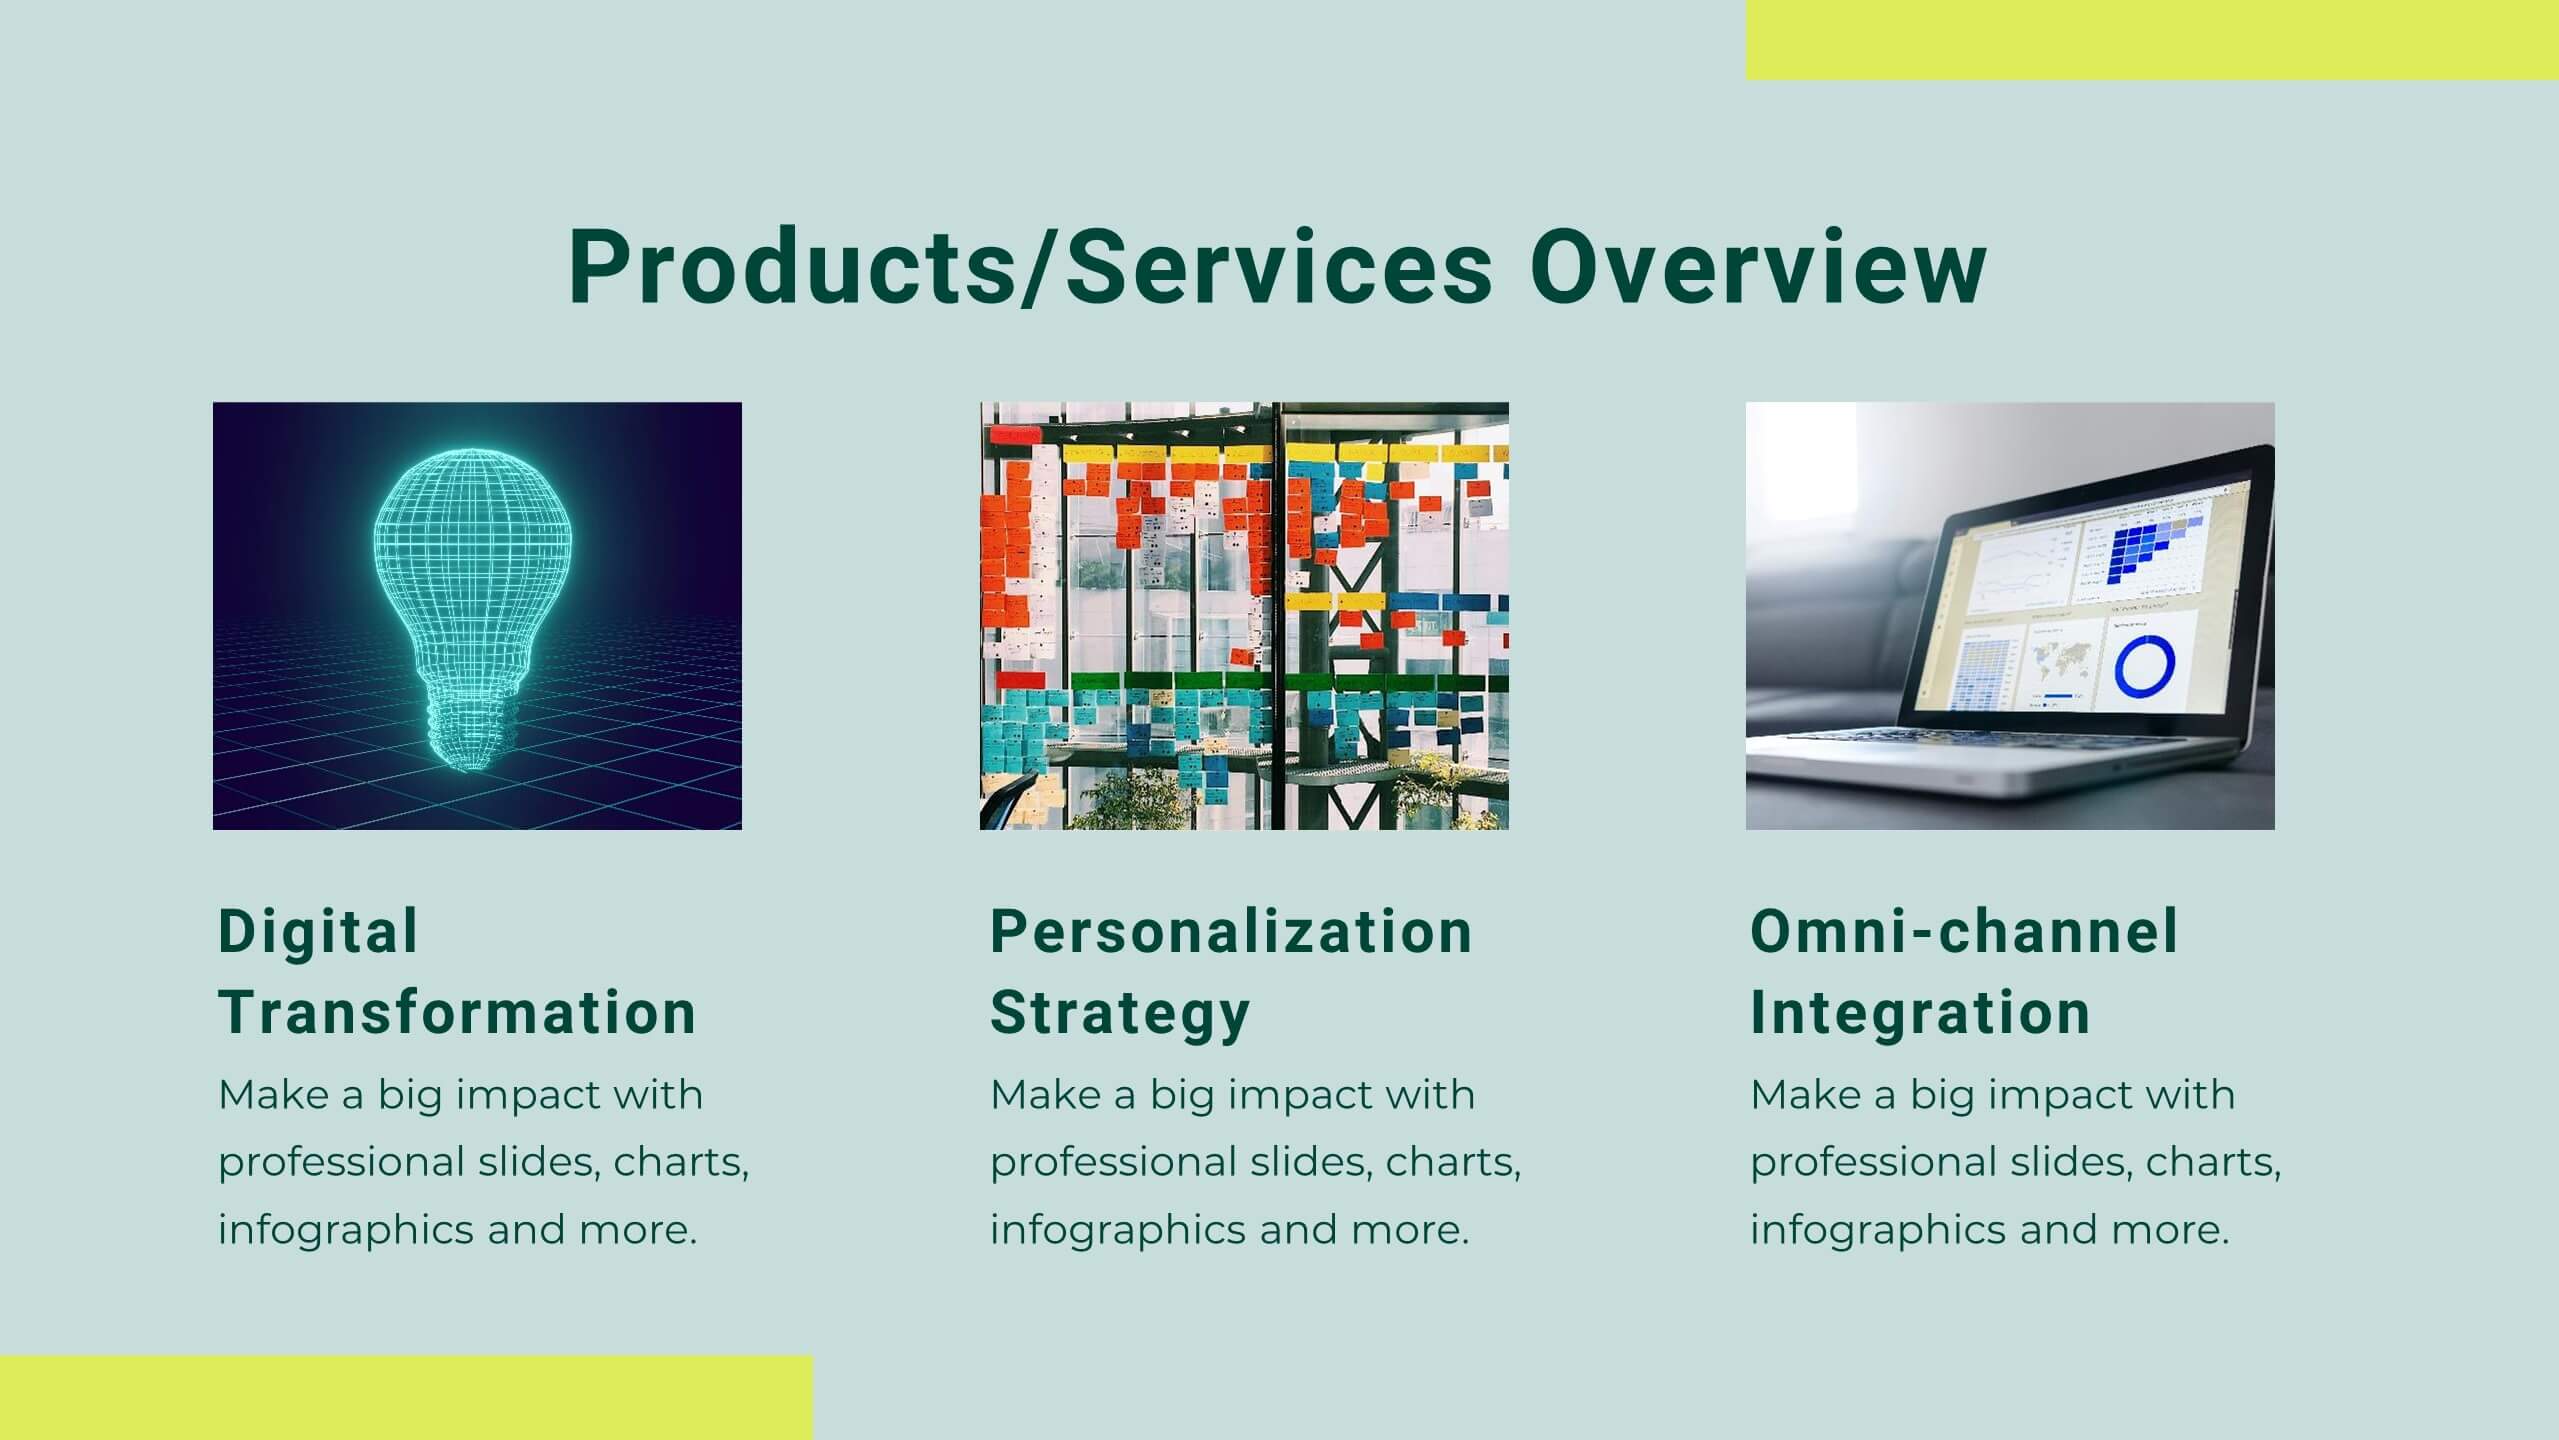
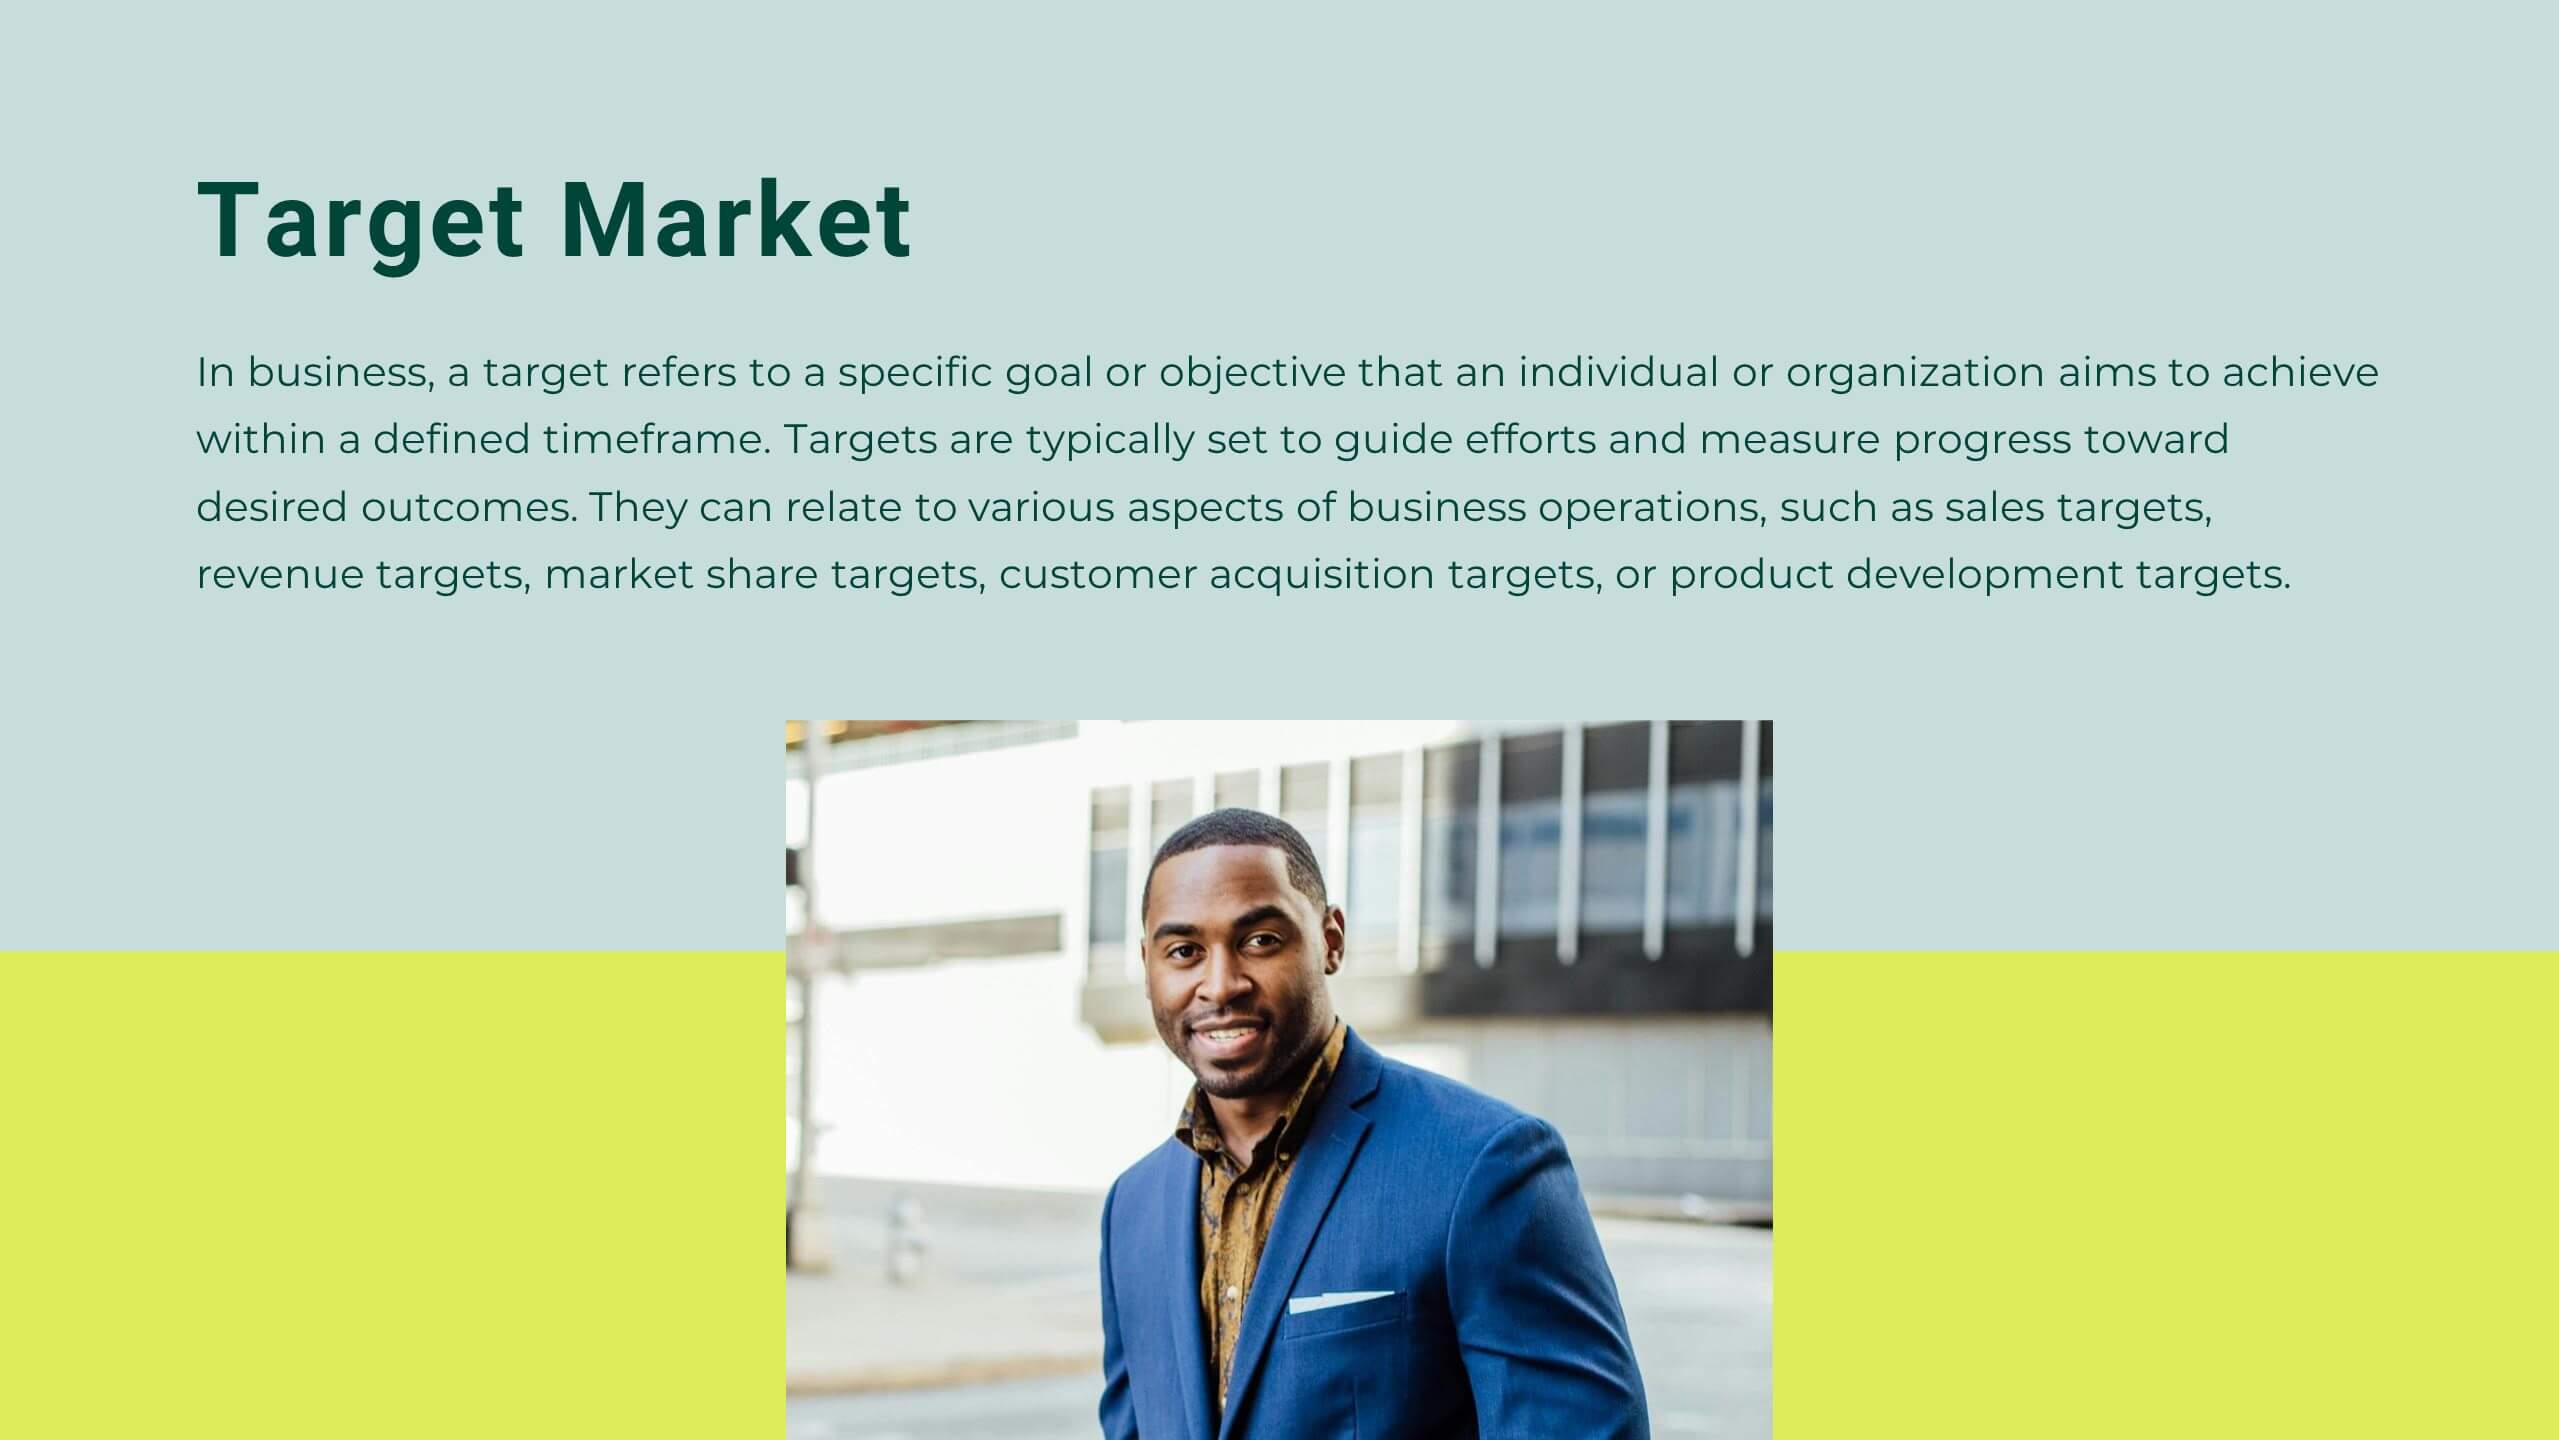
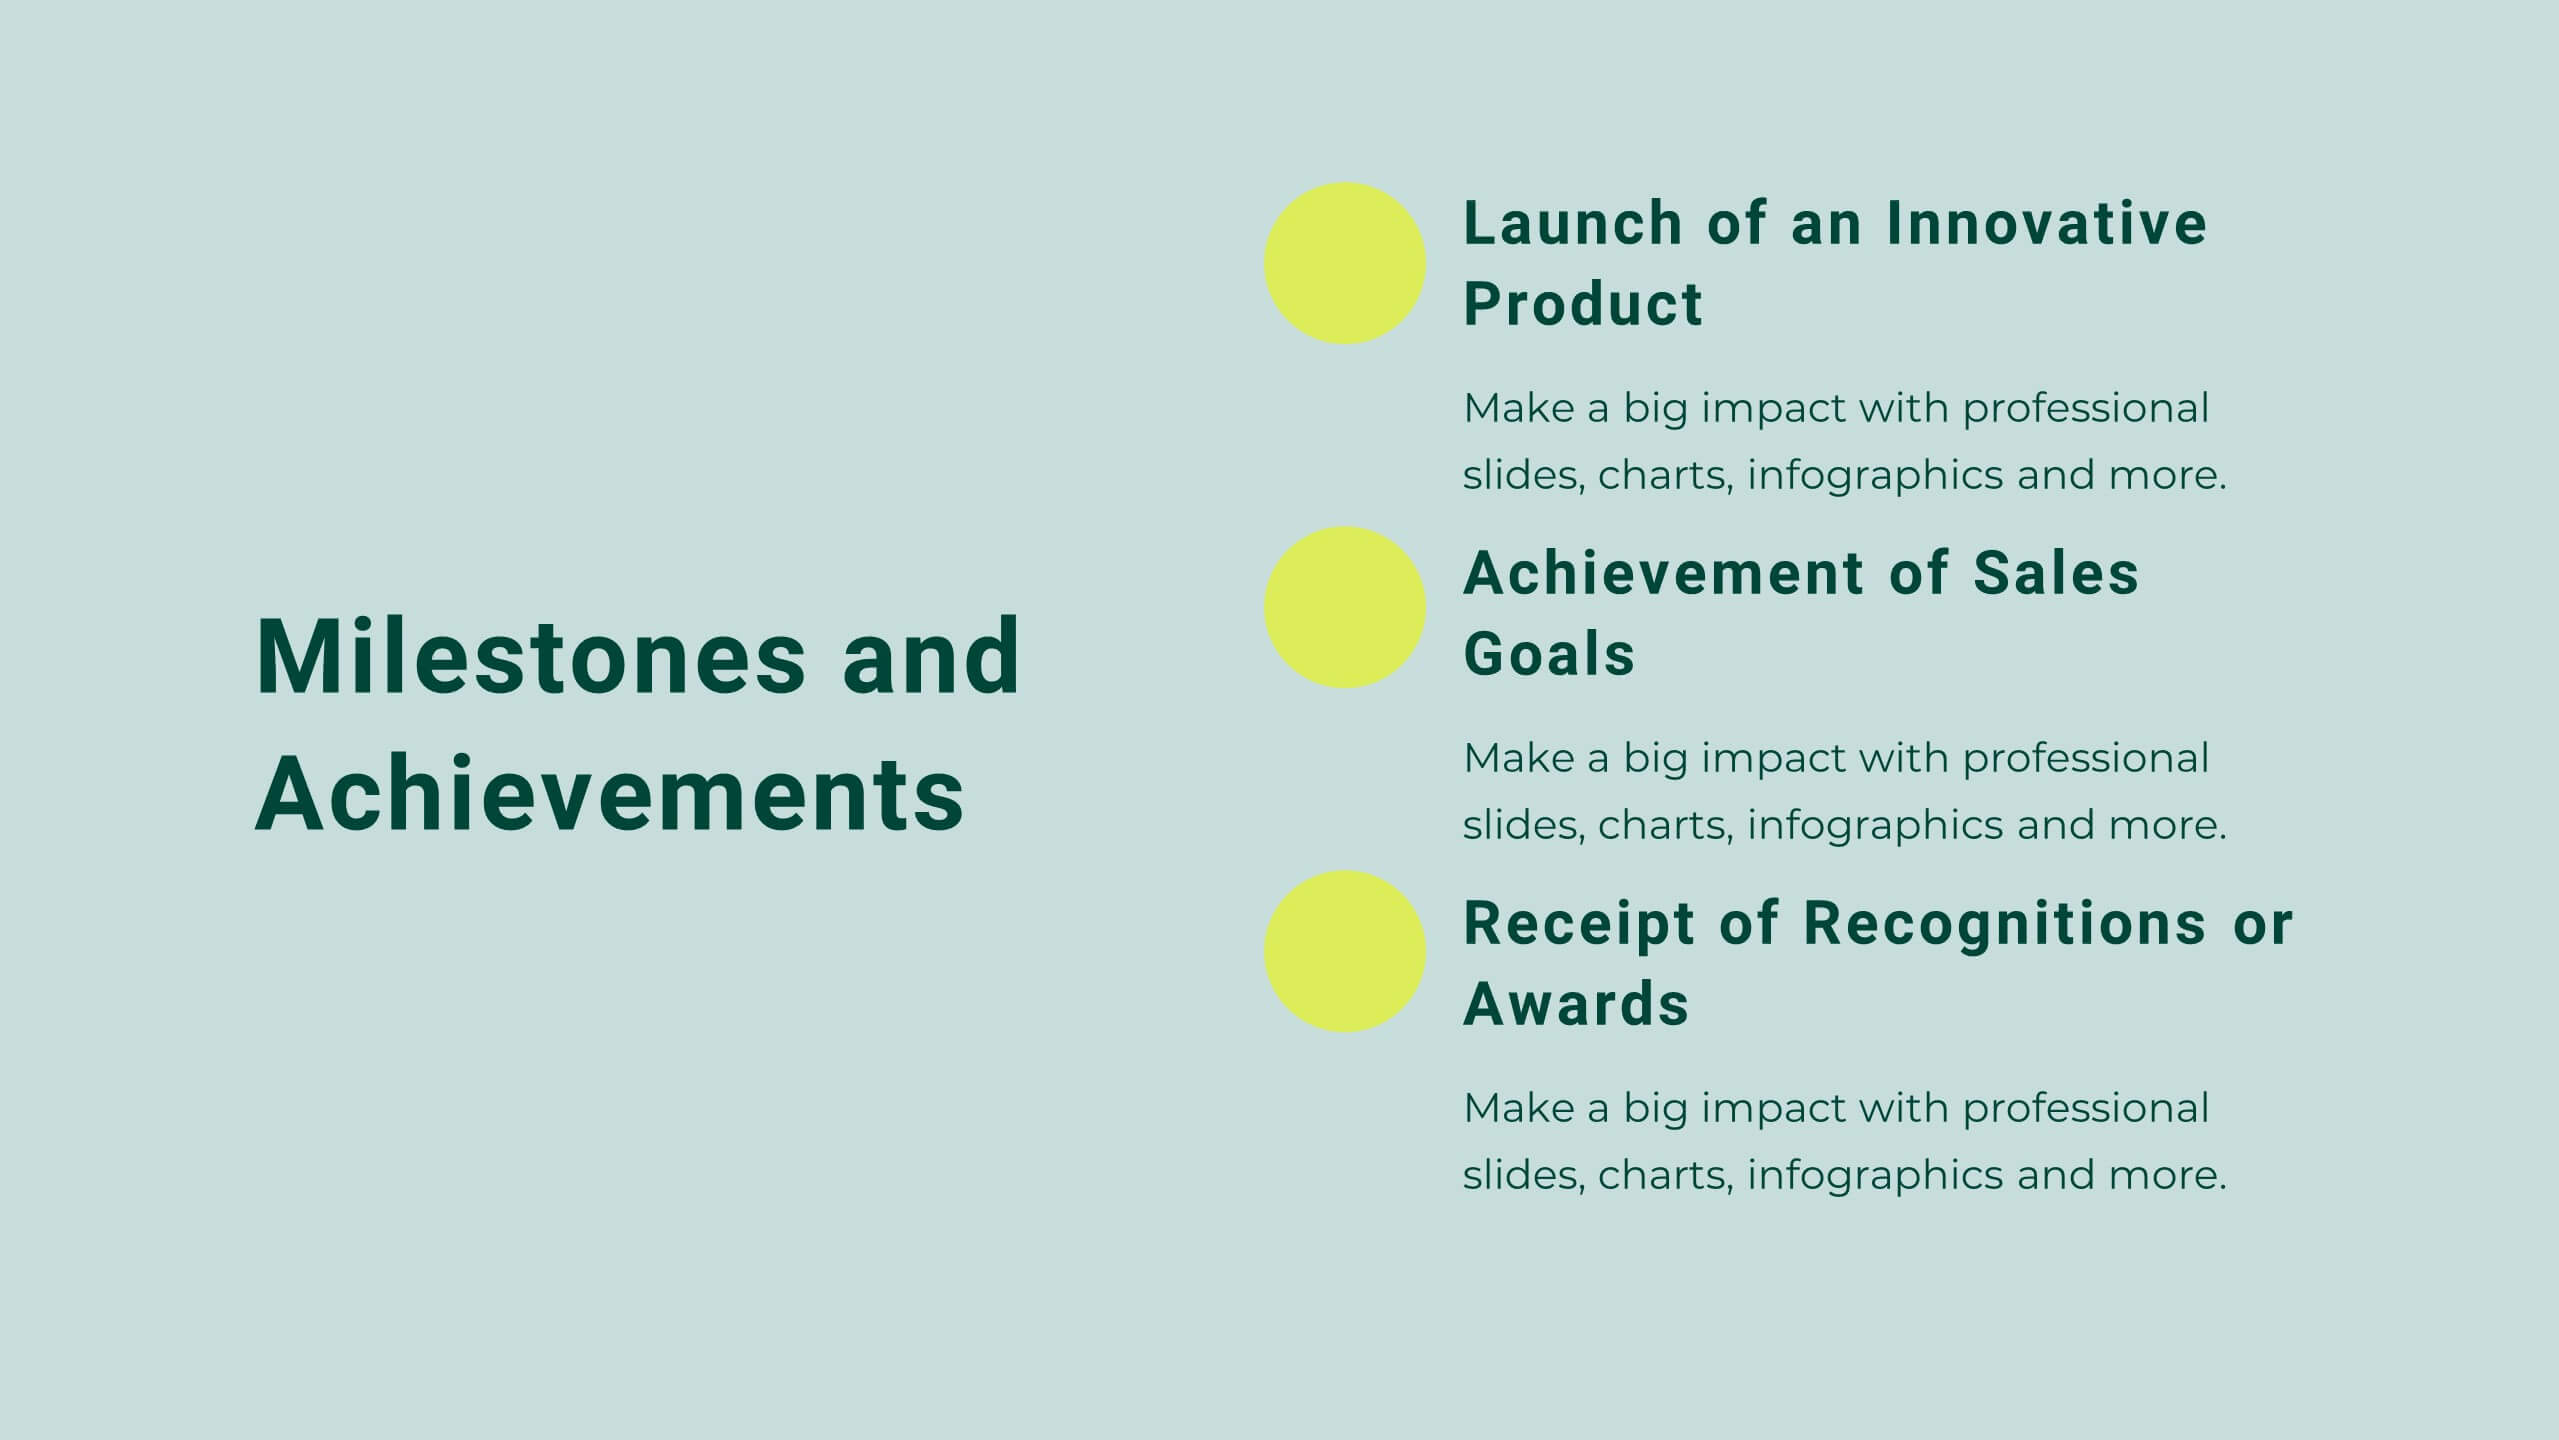
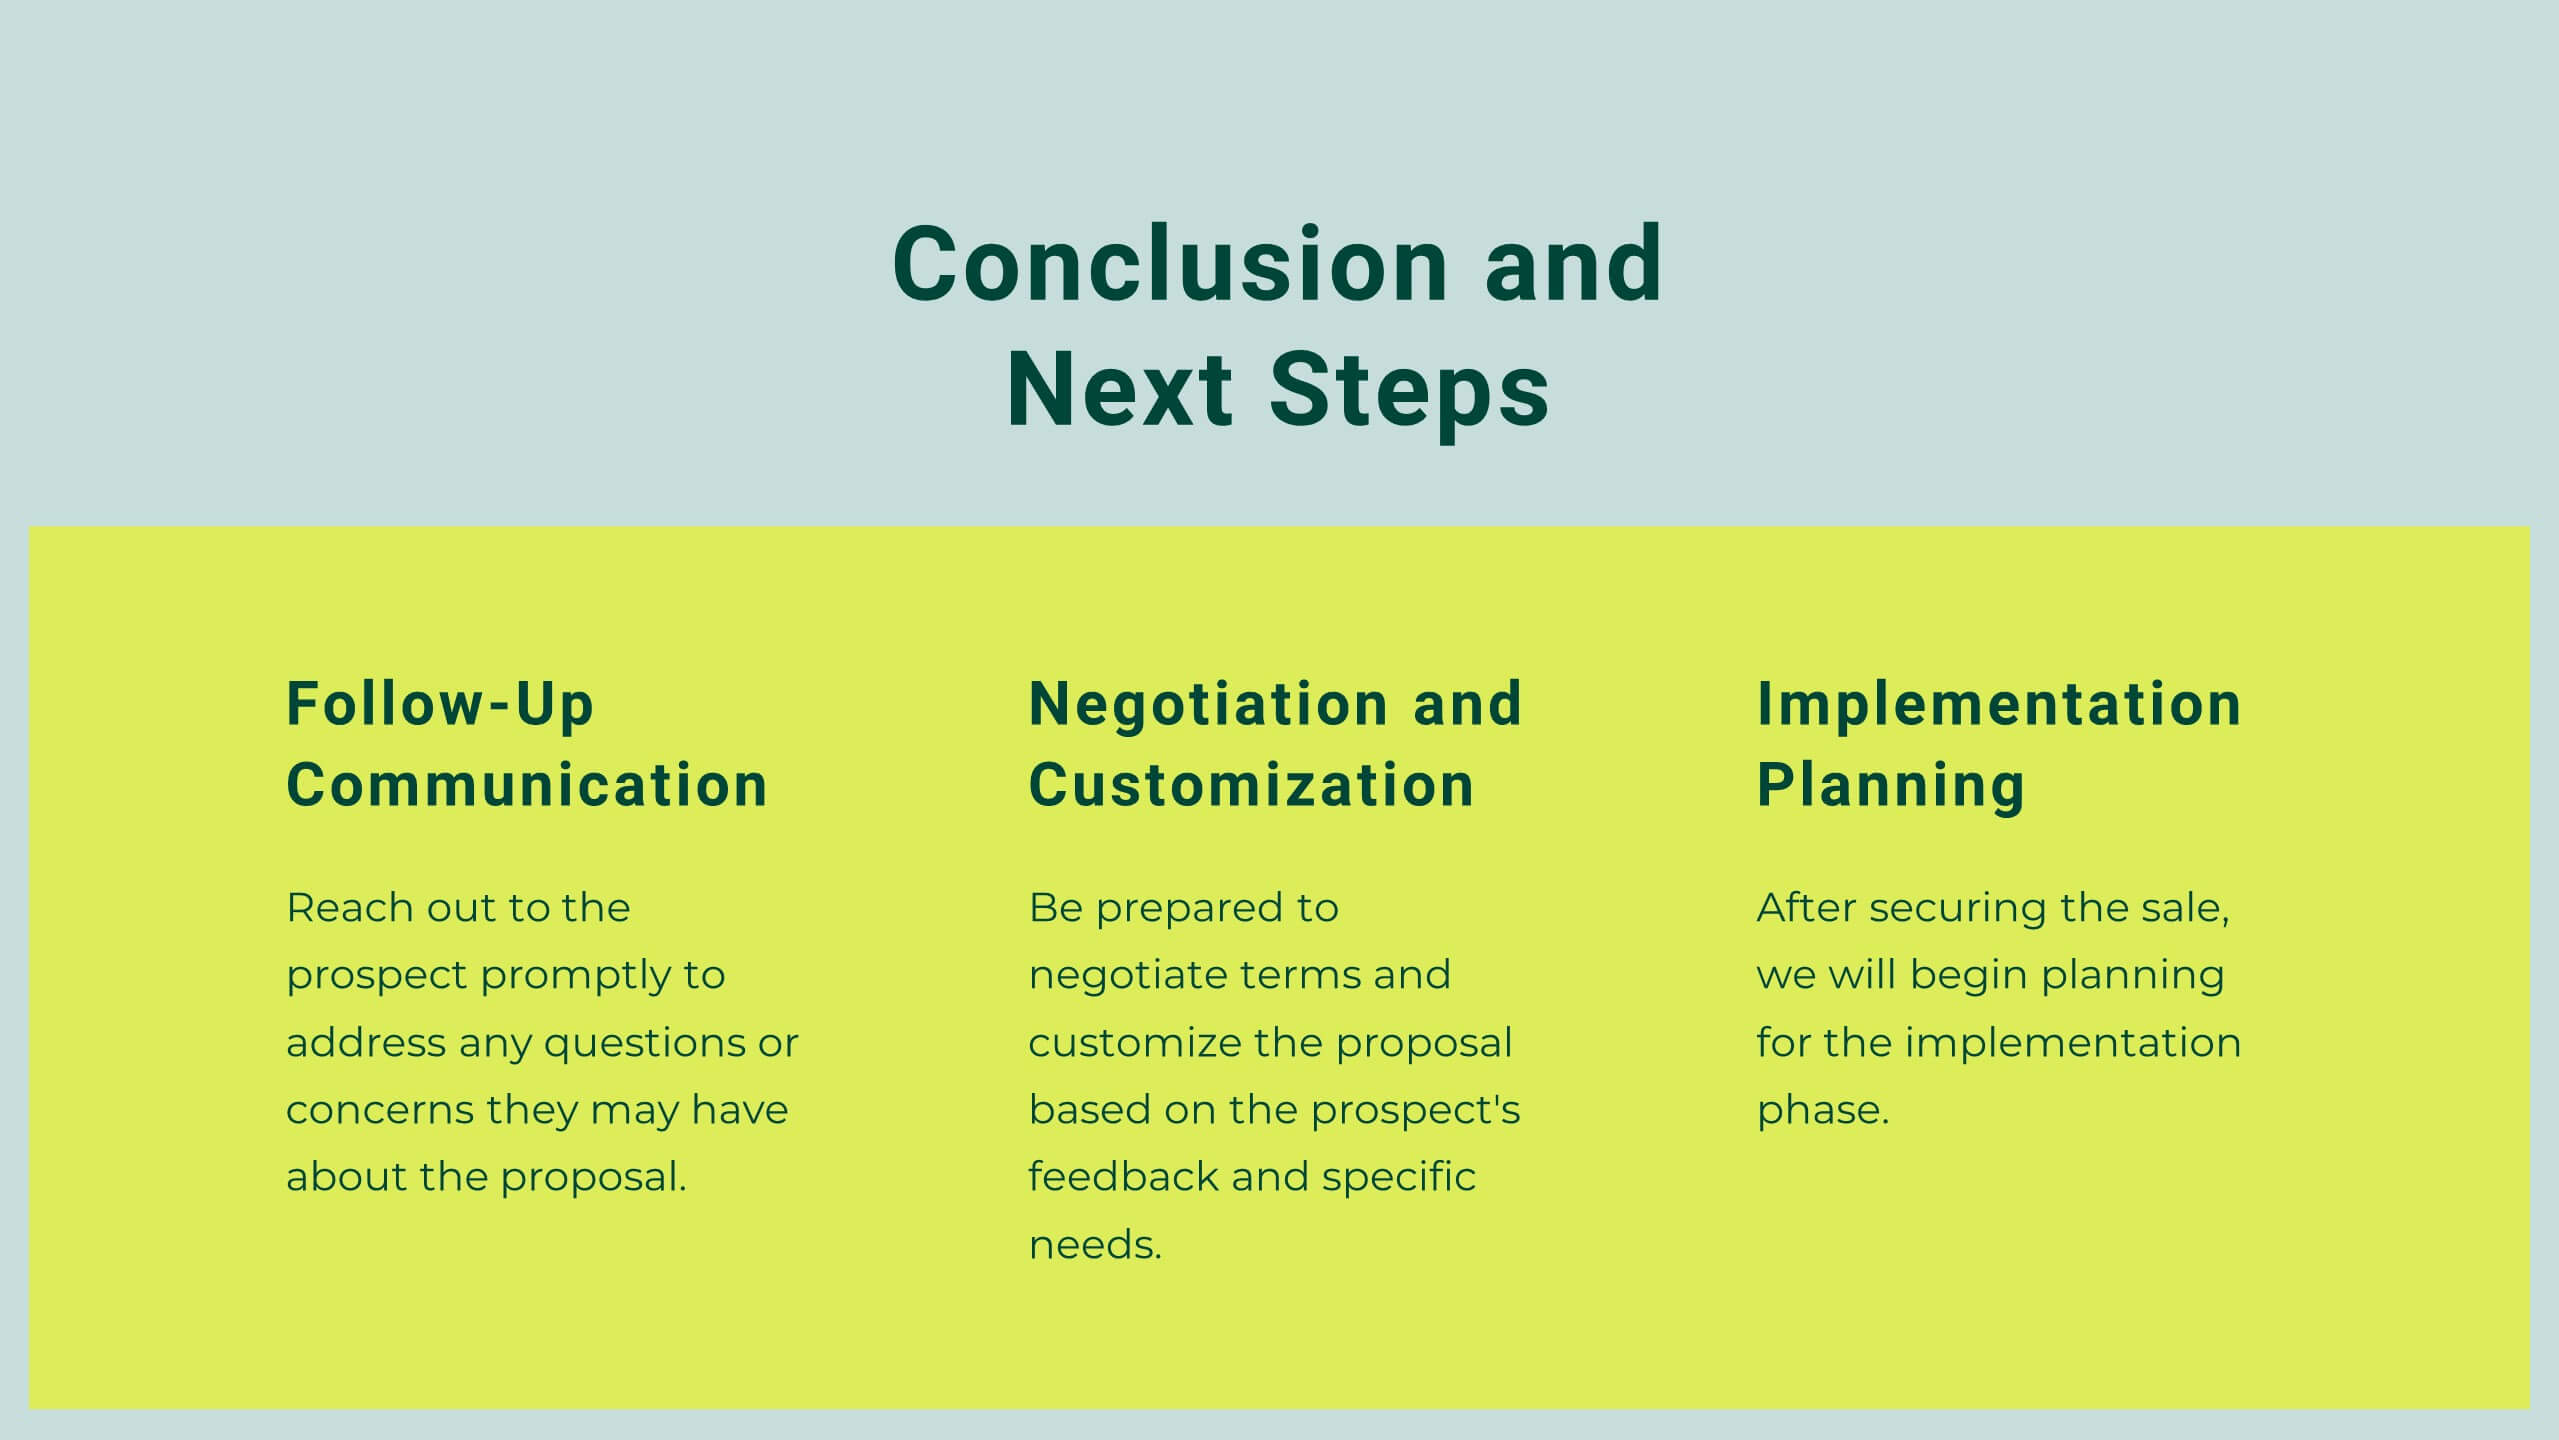
Twilora Business Plan Presentation
Present your business strategy with a comprehensive and visually engaging template designed to impress stakeholders and investors. This template covers key elements of a business plan, including company background, market opportunities, business objectives, and key milestones. Showcase your product offerings, target audience, and competitive advantages through clear, professional visuals and data-driven charts. Highlight your financial performance, investment opportunities, and operational plans with precision and clarity. Tailor the design to reflect your brand's identity and goals. Fully compatible with PowerPoint, Google Slides, and Keynote, this versatile template is perfect for startups, established businesses, and entrepreneurs aiming to present a strong and compelling business case.


5 diapositivas
Easy Homemade Recipes Infographics
Introducing our Easy Homemade Recipes Infographics, these are graphic representations of simple and delicious recipes that can be made at home. These vibrant vertical infographics provide a step-by-step guide to creating tasty meals and snacks using ingredients that are readily available. This template includes detailed instructions for preparing the dishes, as well as the ingredients needed and the cooking time required. They are designed to be visually appealing, with colorful illustrations and fully editable easy-to-read text. These are perfect for anyone looking to learn new recipes or expand their culinary skills!


6 diapositivas
Scrum and Kanban Agile Delivery Presentation
Streamline your Agile processes with this modern Scrum and Kanban workflow slide. Highlight six key stages in your delivery cycle using a sleek, color-coded format with icons. Ideal for project managers, developers, and Agile teams. Fully editable in PowerPoint, Keynote, and Google Slides. Clean, professional layout for maximum clarity.


6 diapositivas
Training Center Infographic
A training center is a facility or institution dedicated to providing education, skills development, and training to individuals or groups in various fields. This infographic provides a visual overview of the training programs, courses, and facilities offered by a training center. This template highlights the key information that potential learners or clients need to know. This infographic is fully customizable and compatible with Powerpoint, Keynote, and Google Slides. Allowing you to ensure that the colors, fonts, and graphics used align with your training center's branding.


7 diapositivas
Investment Bank Infographic Presentation
An investment infographic helps investors understand complex investment concepts by presenting information in a clear and concise manner. This is a professional Investment template with all the elements you need to make a great impact. Use this presentation to help you explain a new investment opportunity, or show the benefits of your product or service. Designed for use in PowerPoint, Keynote and Google Slides, it is easy to customize and fully editable, making it a perfect starting point for any investor or financial pitch. You can change the texts, image and shapes as you wish!


5 diapositivas
Historical Event Timeline Overview Presentation
Bring history to life with the Historical Event Timeline Overview Presentation. This visually engaging slide is perfect for educators, researchers, or historians looking to showcase five key milestones in chronological order. Fully editable in Canva, PowerPoint, Keynote, and Google Slides—making it easy to adapt for any historical topic.


4 diapositivas
Sales Funnel Journey Mapping Presentation
Visualize your customer conversion process with the Sales Funnel Journey Mapping Presentation. This slide helps you break down key touchpoints from awareness to decision, ideal for marketing strategies, lead analysis, or CRM reporting. Fully editable in PowerPoint, Canva, and Google Slides for easy customization.


5 diapositivas
Cognitive Psychology Framework Presentation
Unlock insights in the most visual way possible with this bold, brain-powered slide! This presentation template helps simplify complex ideas behind how we think, reason, and remember—perfect for research, education, or team workshops. Fully customizable and compatible with PowerPoint, Keynote, and Google Slides for seamless editing across platforms.


5 diapositivas
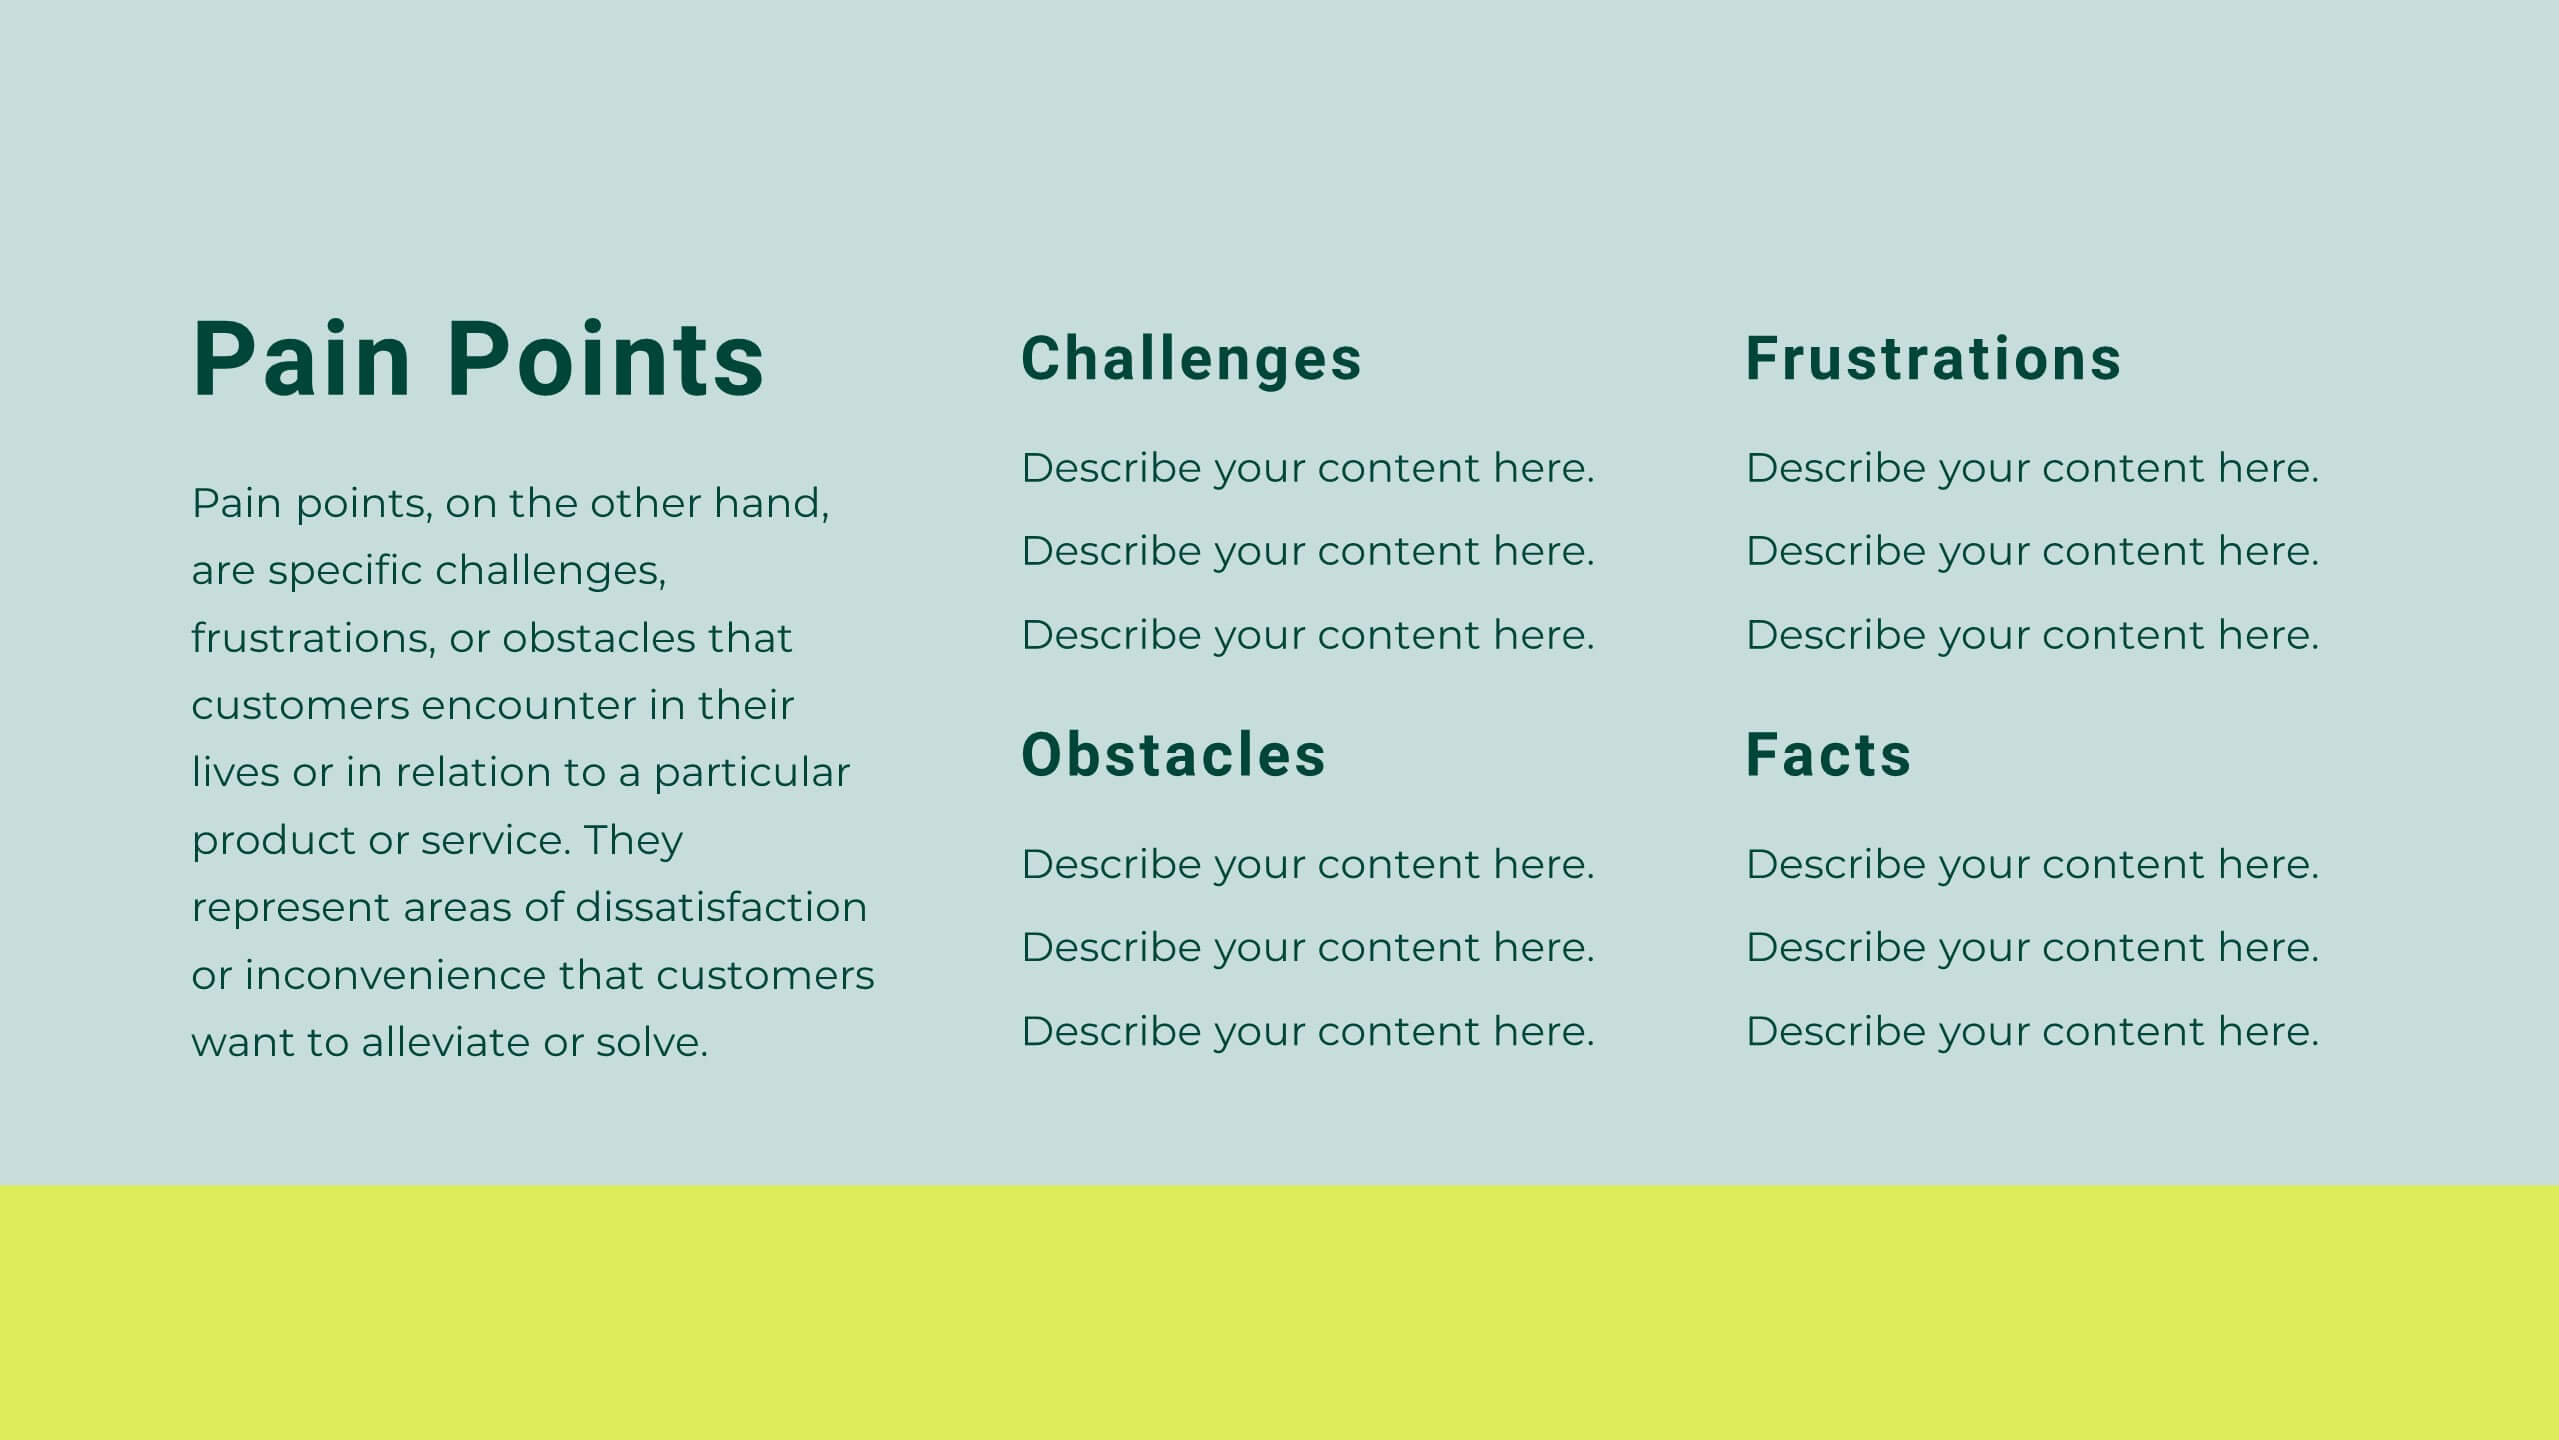
Likelihood vs Impact Risk Matrix Presentation
Clearly prioritize your risks with the Likelihood vs Impact Risk Matrix Presentation. This intuitive grid layout lets you map potential threats based on severity and probability, helping teams focus on what matters most. Ideal for strategic planning, audits, and project risk reviews. Editable in PowerPoint, Canva, Keynote, and Google Slides.


4 diapositivas
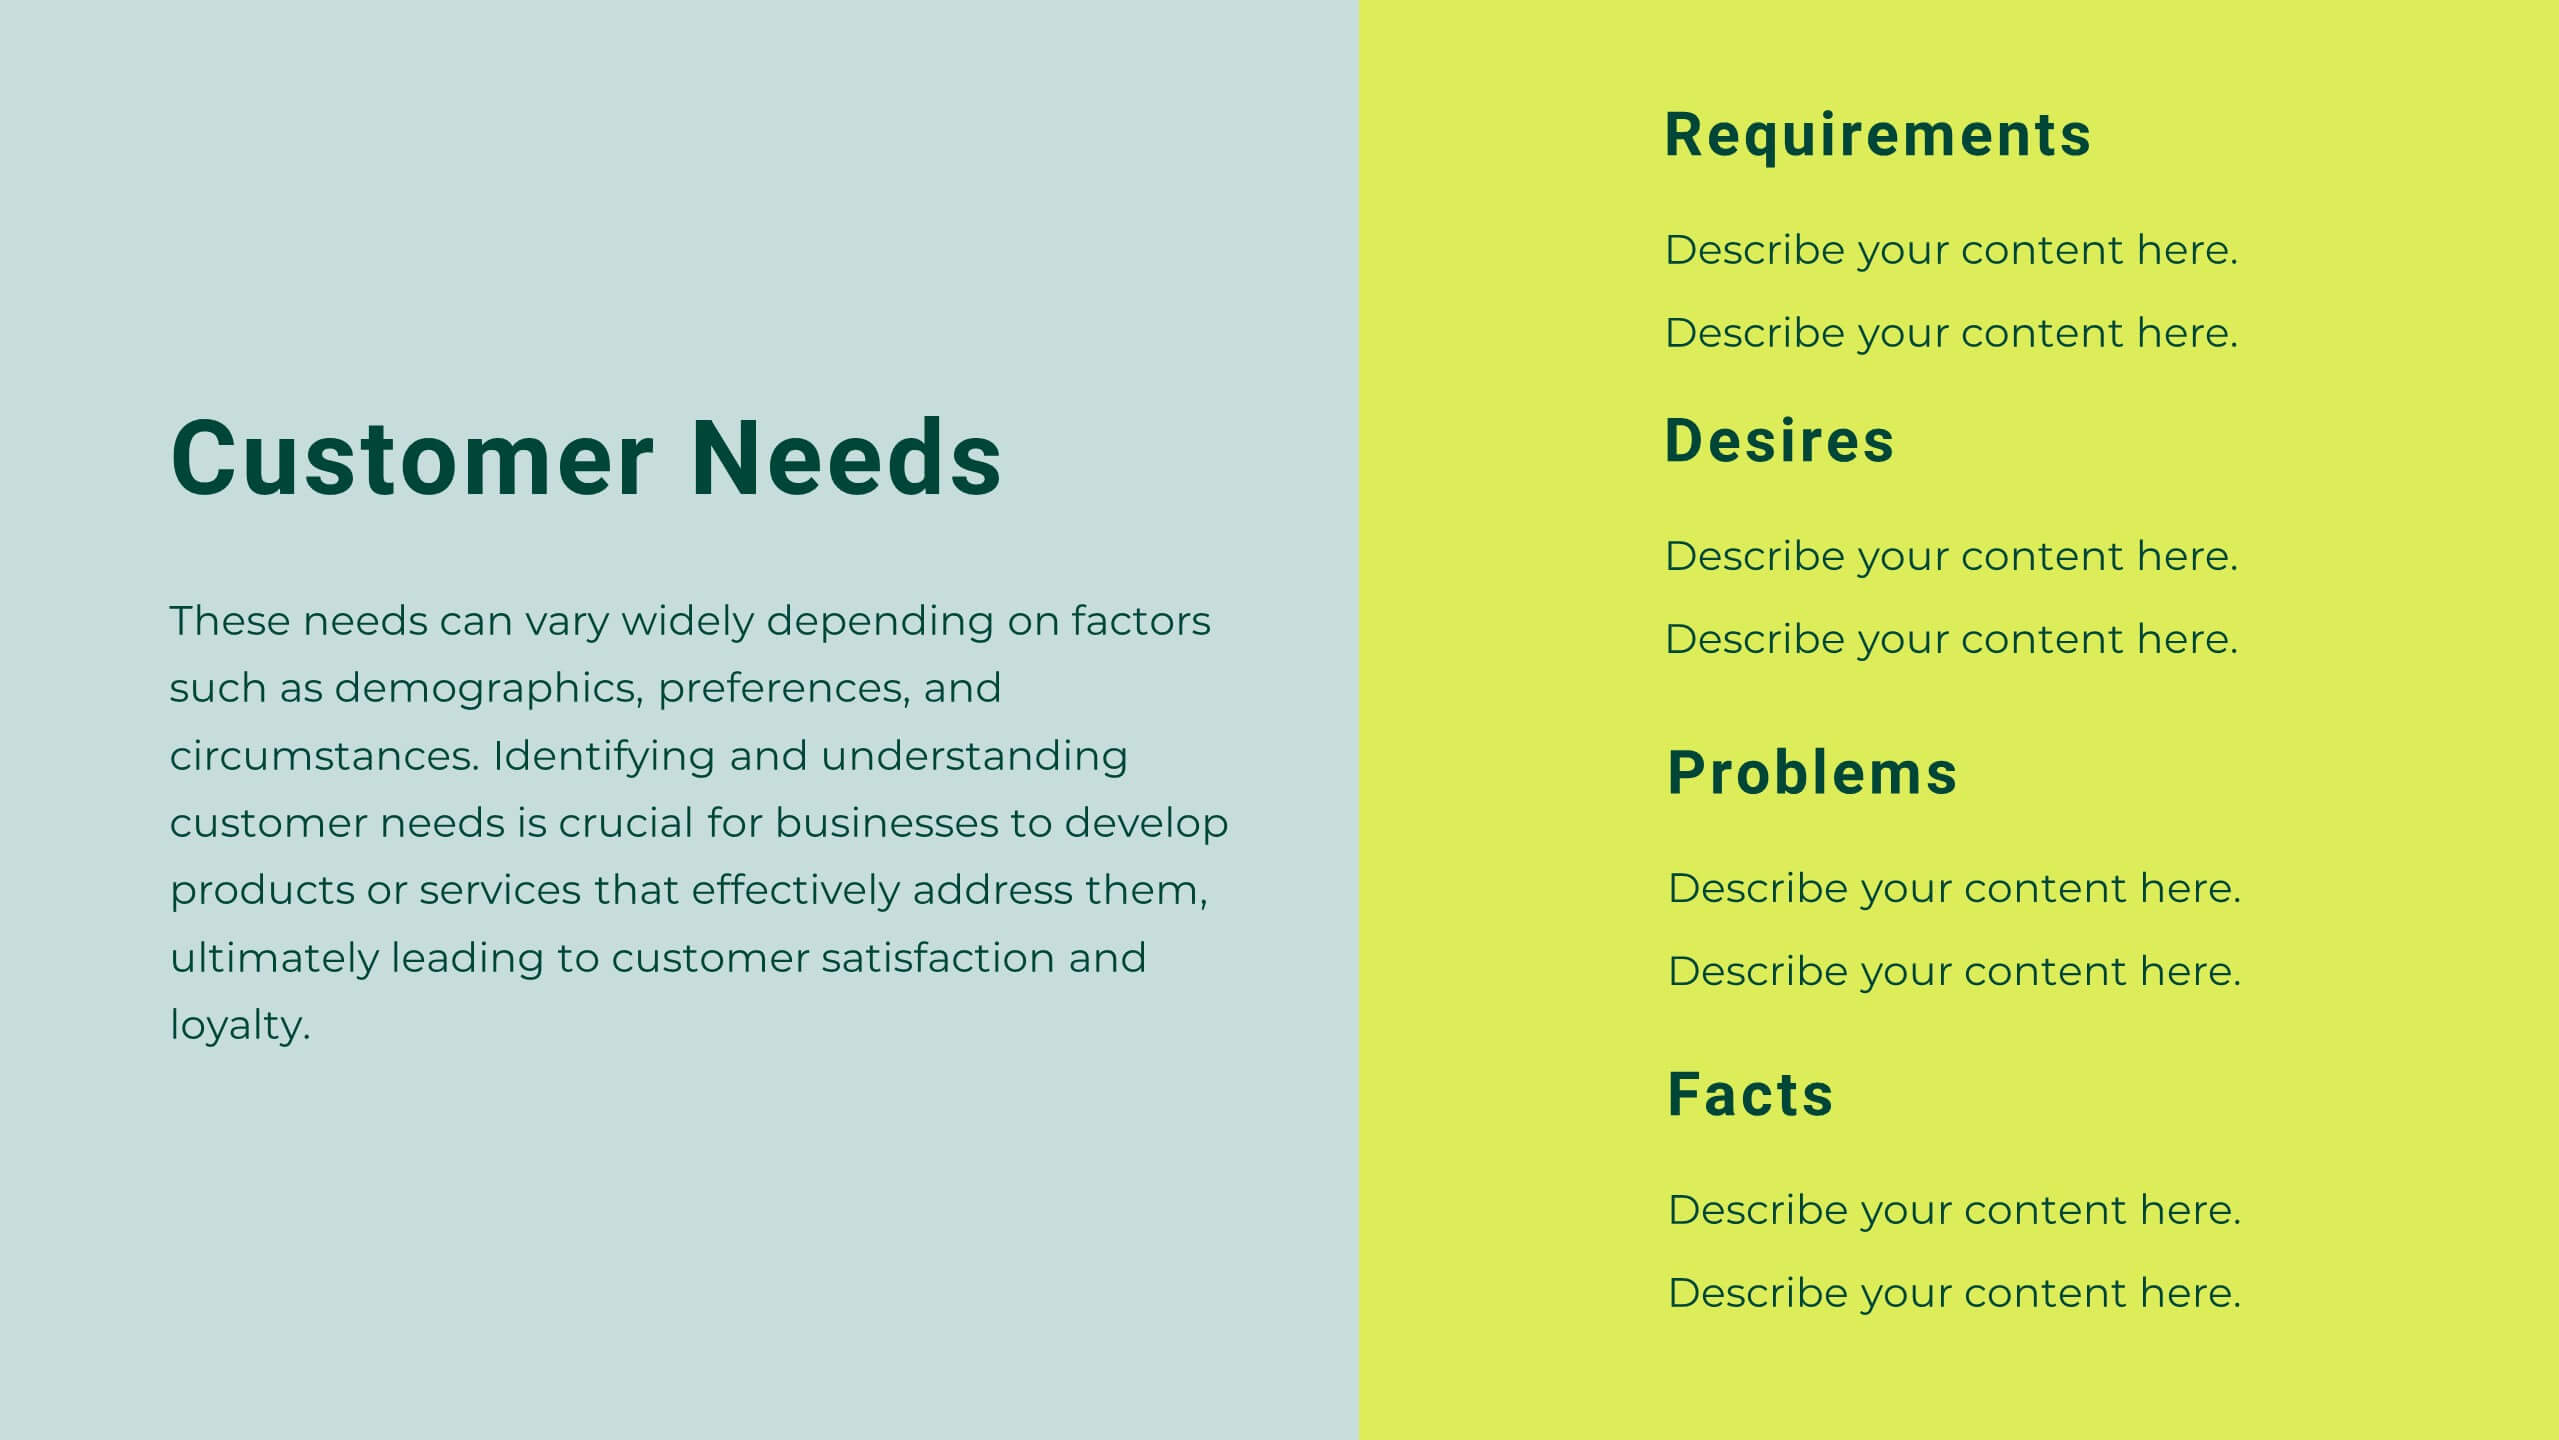
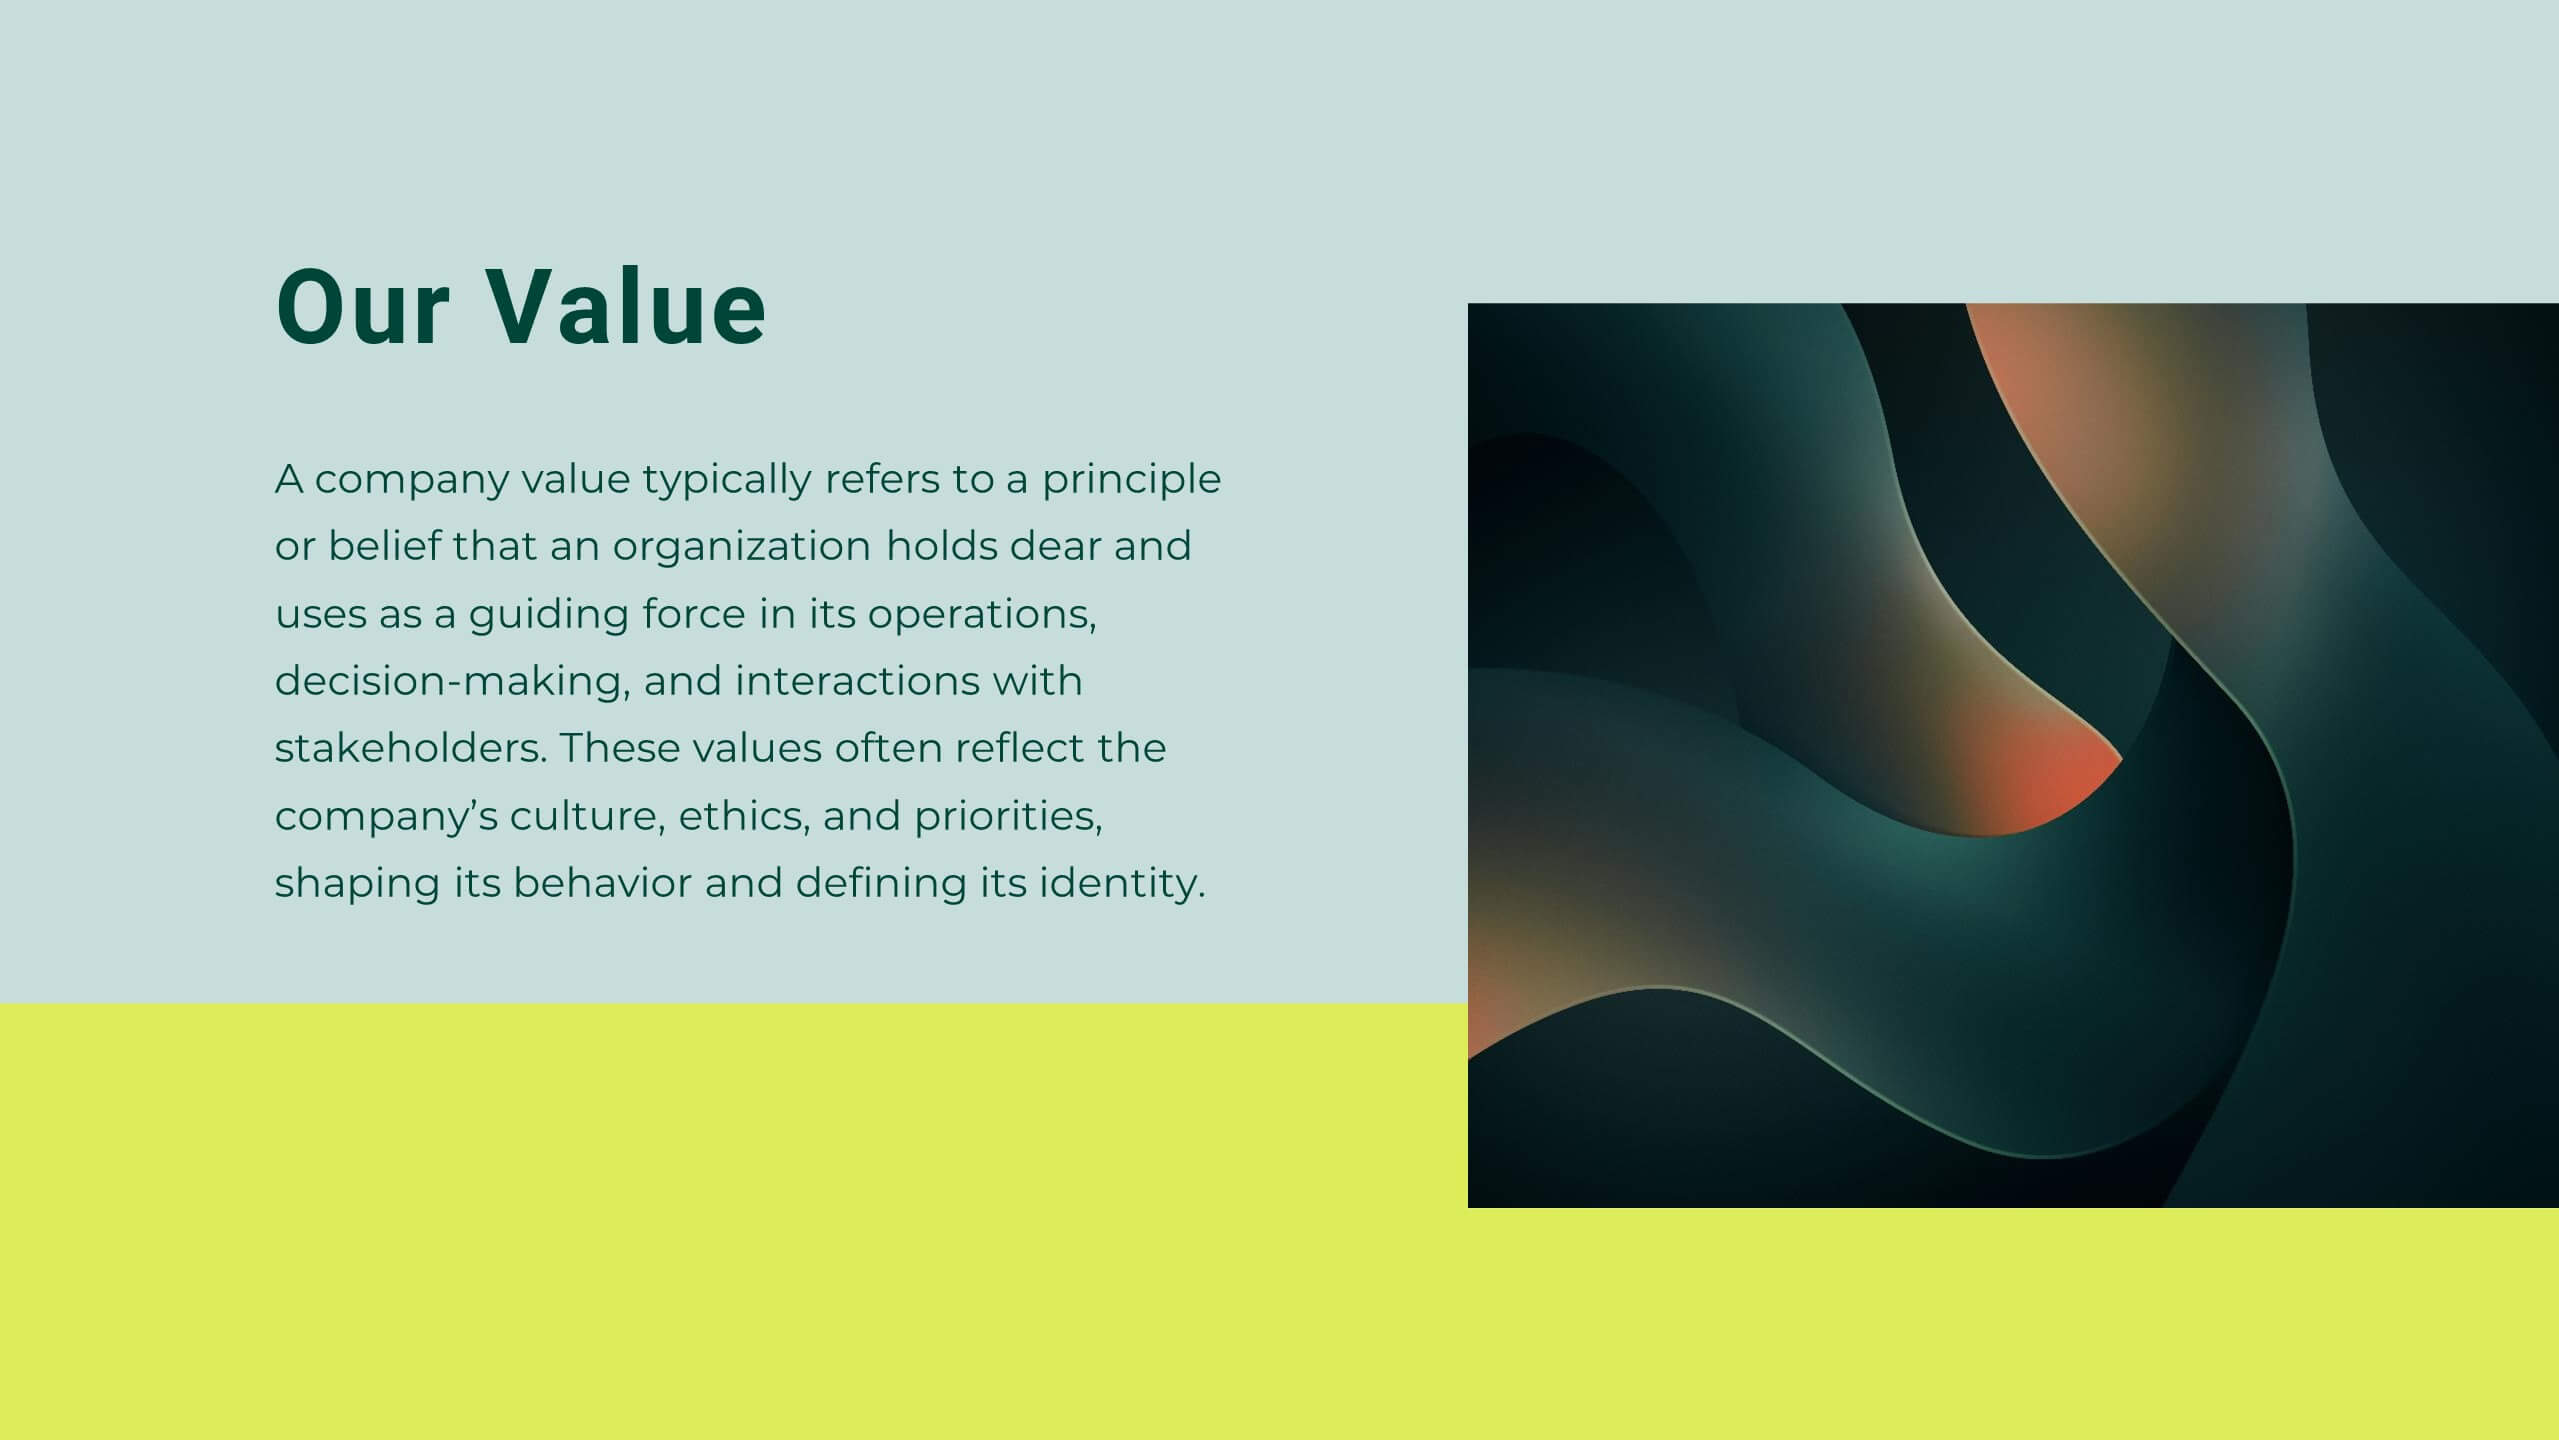
Core Company Value Mapping Presentation
Spotlight your business strengths with the Core Company Value Mapping Presentation. This slide design helps you break down and compare key value drivers using a structured visual format—ideal for internal strategy discussions, executive briefings, or stakeholder updates. Highlight metrics, priorities, or departments with side-by-side percentage comparisons and icon indicators. Fully editable in PowerPoint, Keynote, and Google Slides. A must-have for operations teams, consultants, and leadership presentations.


4 diapositivas
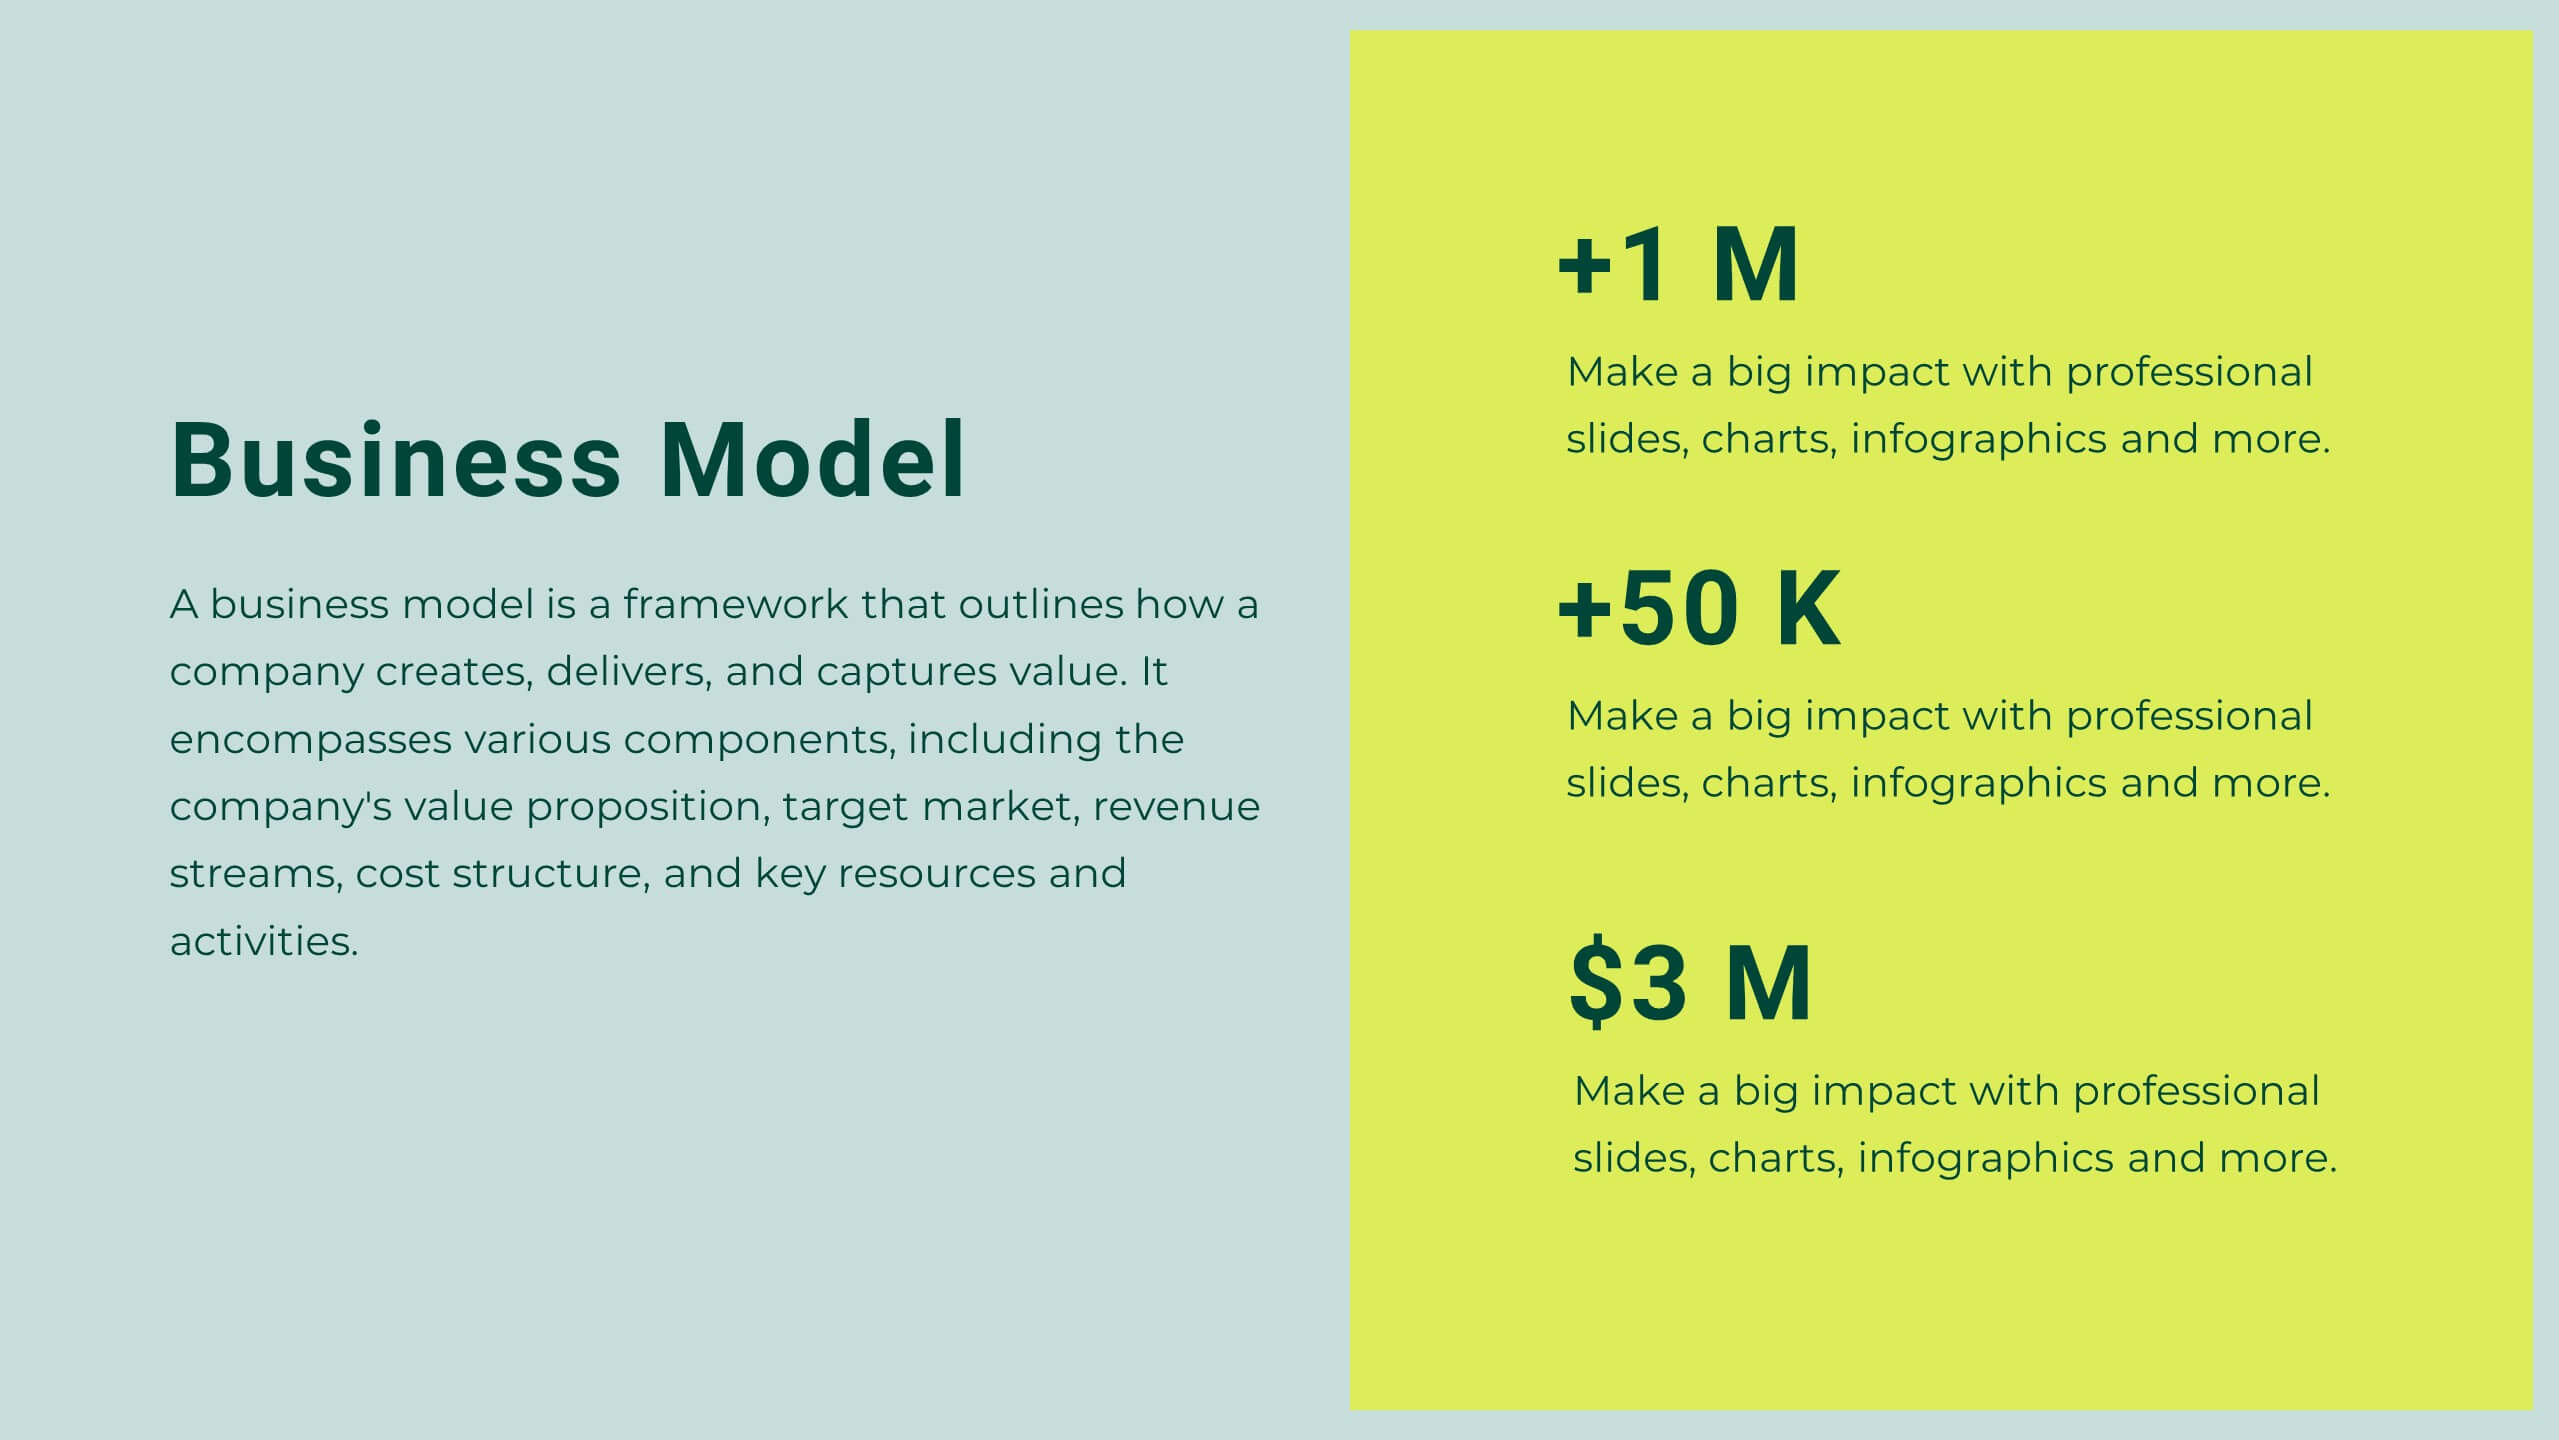
Executive Data Overview Dashboard Presentation
Drive informed decision-making with the Executive Data Overview Dashboard Presentation. This sleek, data-centric slide layout features clean blocks for KPIs, progress percentages, and simple bar or donut charts—ideal for summarizing business insights, performance metrics, or operational updates. Fully editable in PowerPoint, Keynote, and Google Slides, it's designed for clarity, speed, and high-level reporting.


6 diapositivas
Market Share Visualization Pie Chart Presentation
Showcase percentage breakdowns with impact using the Market Share Visualization Pie Chart Presentation. This infographic slide features a bold, segmented pie chart styled with cloud-shaped backdrops and colorful wedges, ideal for presenting market analysis, segment comparisons, or share allocation. Each slice is clearly labeled with percentage values and customizable titles, while matching icons reinforce your data points visually. Whether you're pitching to stakeholders or presenting internal reports, this design ensures clarity and engagement. Fully editable in PowerPoint, Keynote, and Google Slides.


6 diapositivas
Break Even Point Presentation
Turn your data into a story of profit and precision with this clean and modern presentation design. Ideal for showcasing financial performance, cost analysis, or revenue forecasts, it helps visualize where your business meets success. Fully customizable and compatible with PowerPoint, Keynote, and Google Slides for smooth editing.


21 diapositivas
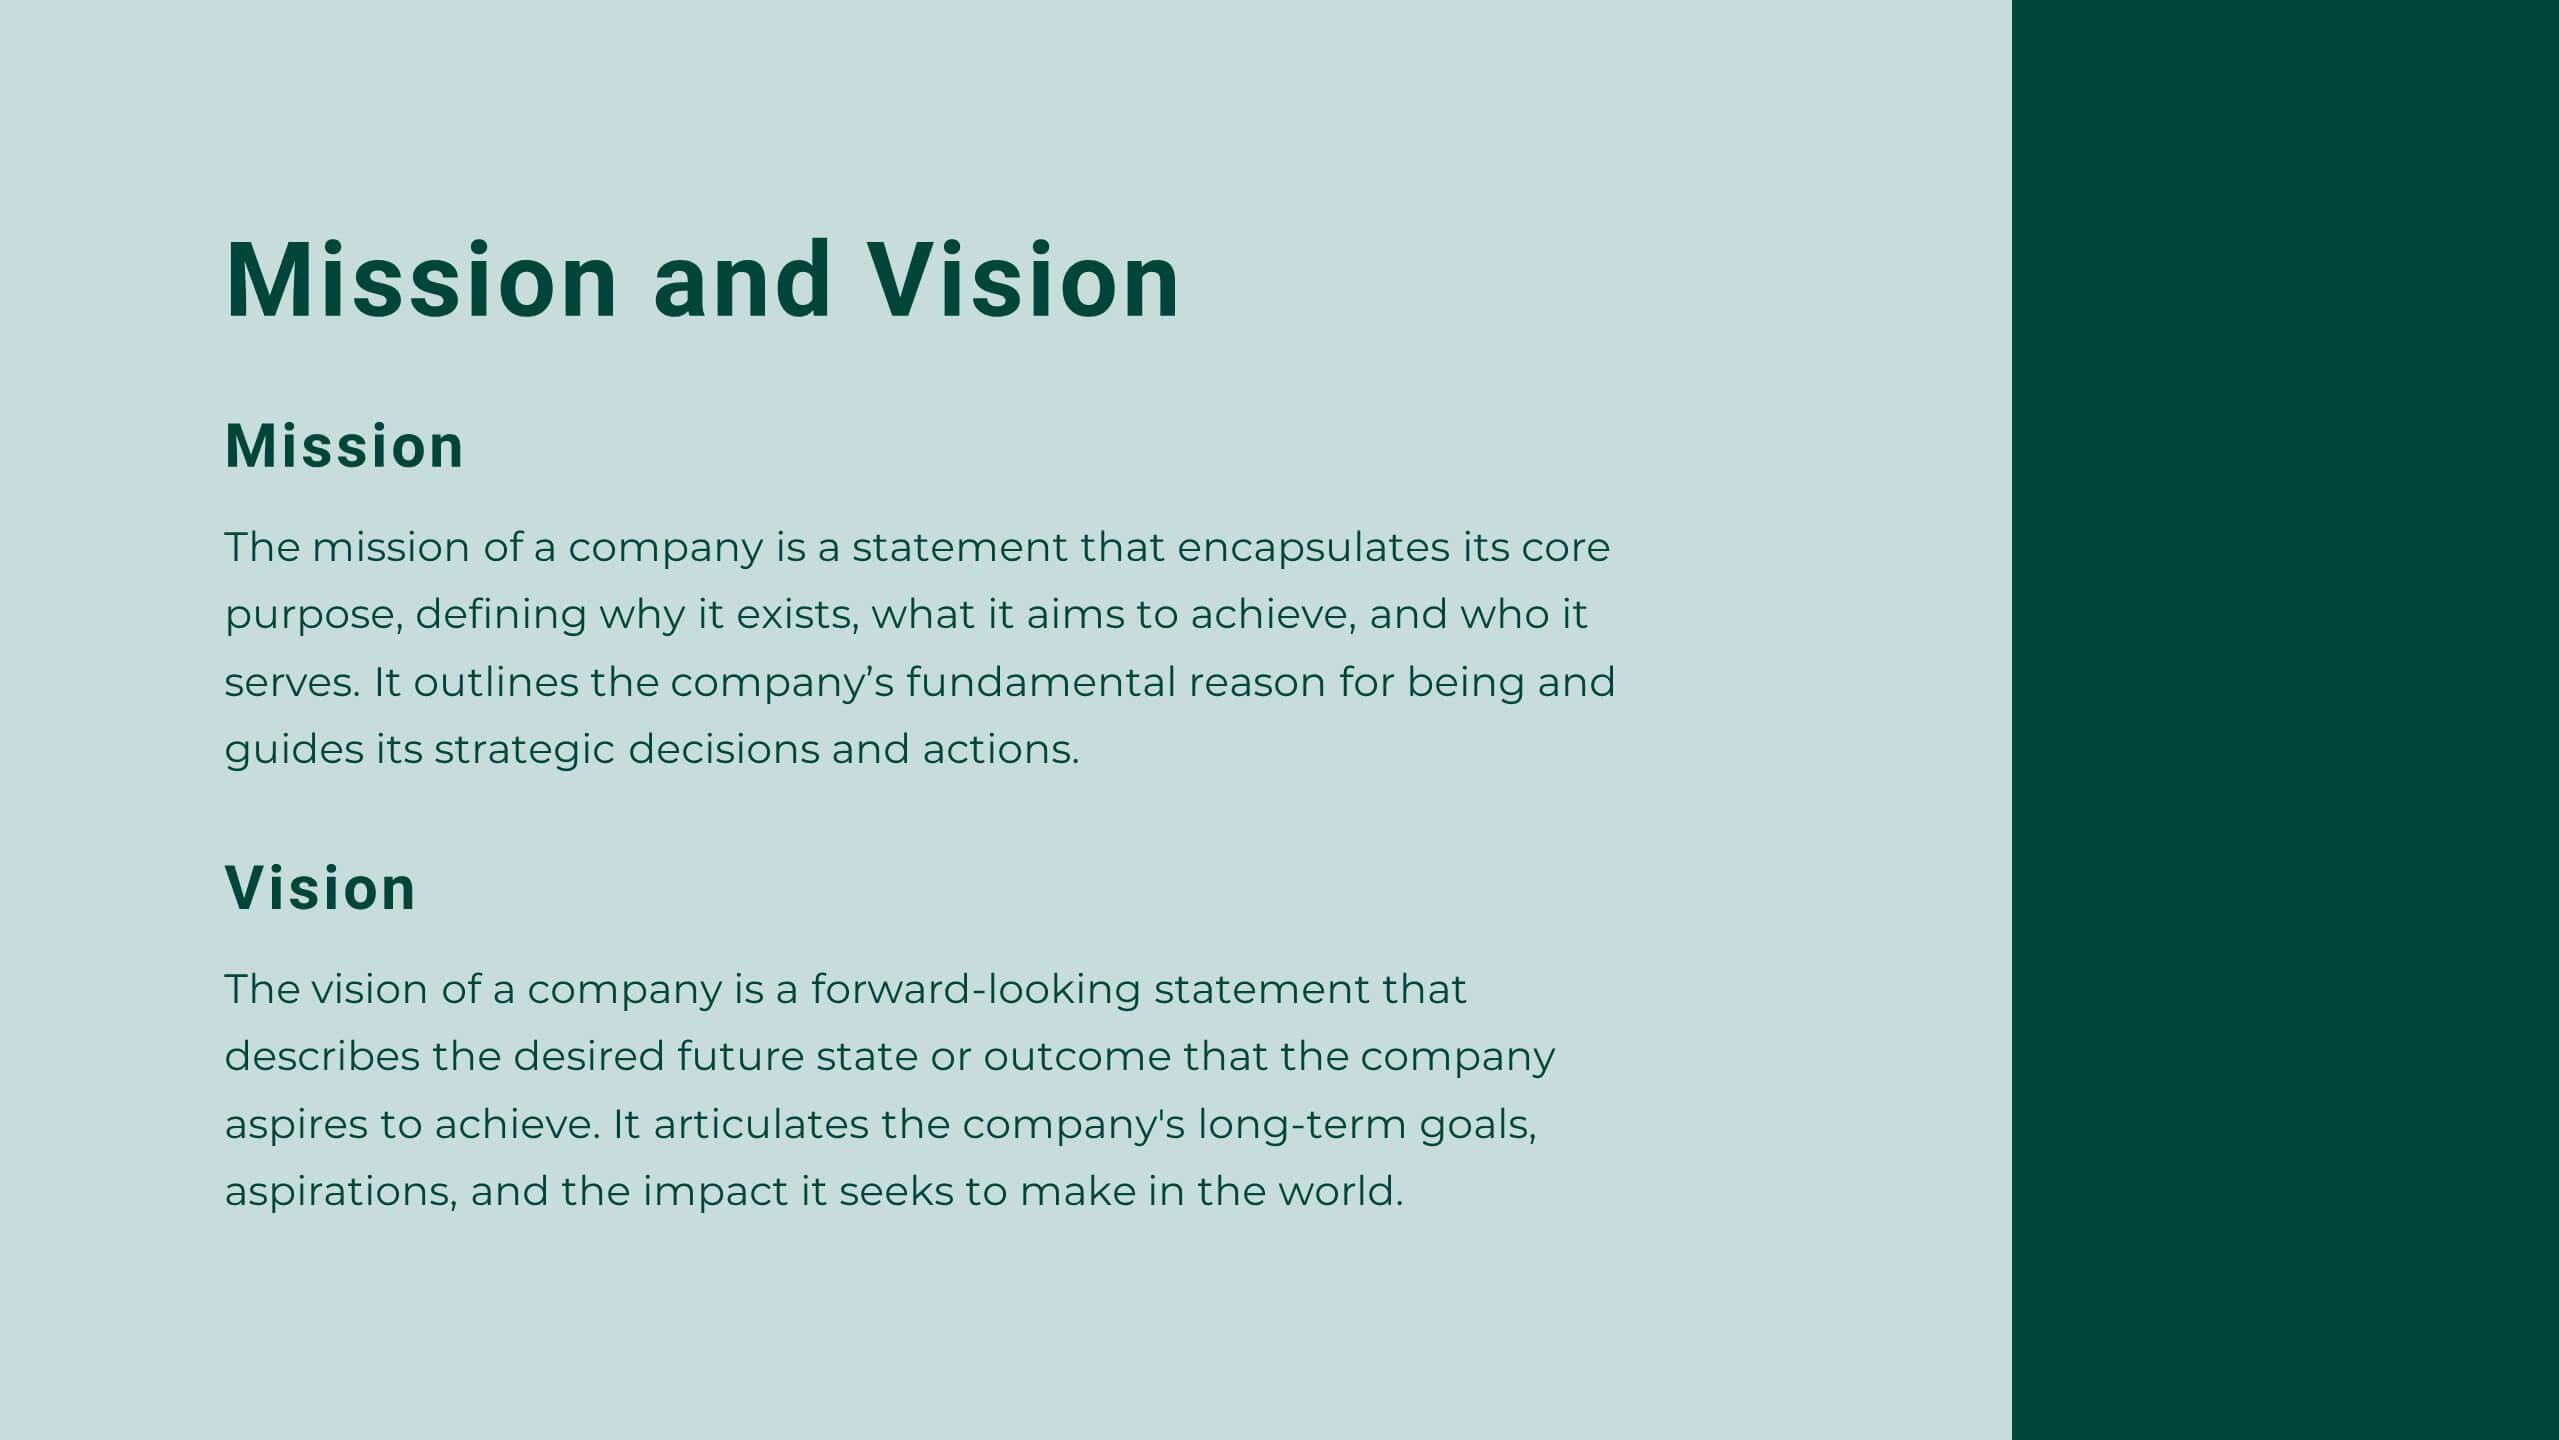
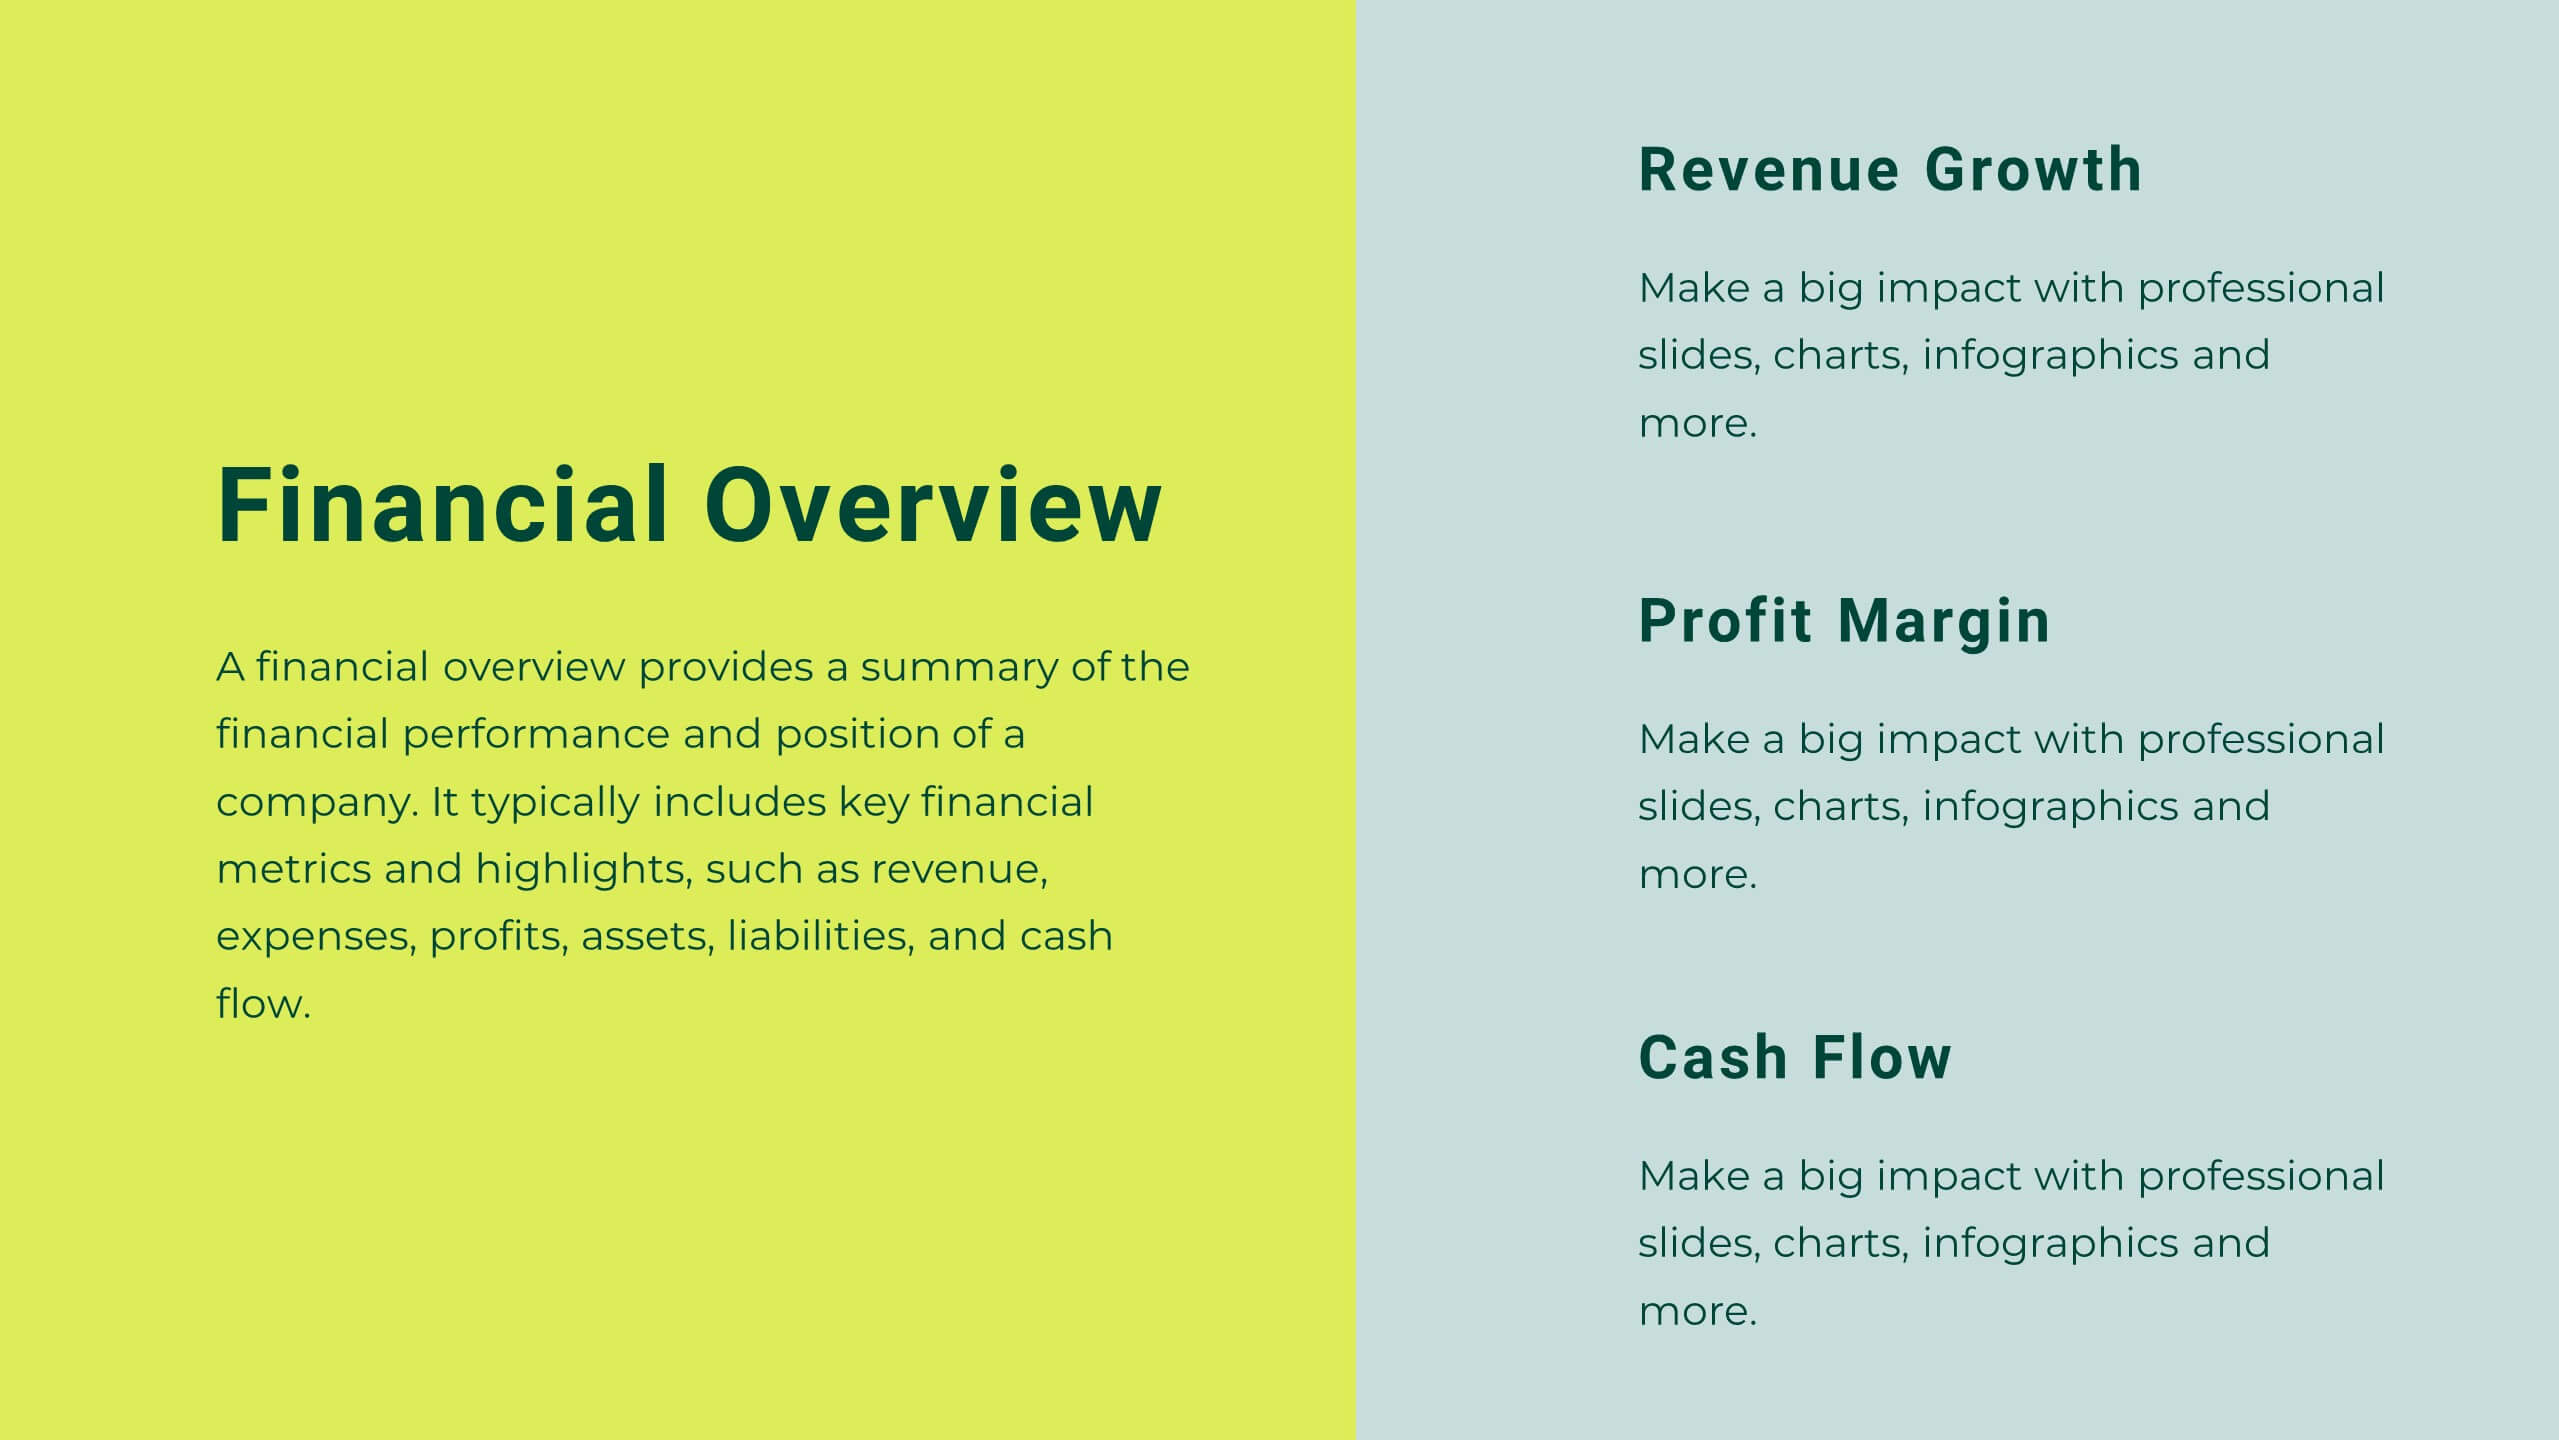
Nimbus Startup Growth Plan Presentation
Supercharge your startup's growth with this vibrant presentation template! Ideal for outlining your business plan, it includes slides for mission, market analysis, and financial overview. Capture investor attention with clear visuals and compelling content. Compatible with PowerPoint, Keynote, and Google Slides for a seamless presentation experience on any platform.


6 diapositivas
Supply Chain Management Strategy Presentation
Enhance your logistics planning with the Supply Chain Management Strategy template. This visually structured design simplifies key supply chain components, from procurement to distribution, making it ideal for analysts and operations teams. Fully customizable and compatible with PowerPoint, Keynote, and Google Slides for a seamless and professional presentation experience.