


Características


¿Tienes alguna pregunta?
Recomendar


4 diapositivas
AIDA Marketing Funnel Slide Presentation
Capture attention from the very first slide with a bold, structured layout that turns each stage of your message into a clear, engaging flow. This presentation helps simplify complex decision paths and guide viewers through each step with ease. Fully editable and compatible with PowerPoint, Keynote, and Google Slides.


4 diapositivas
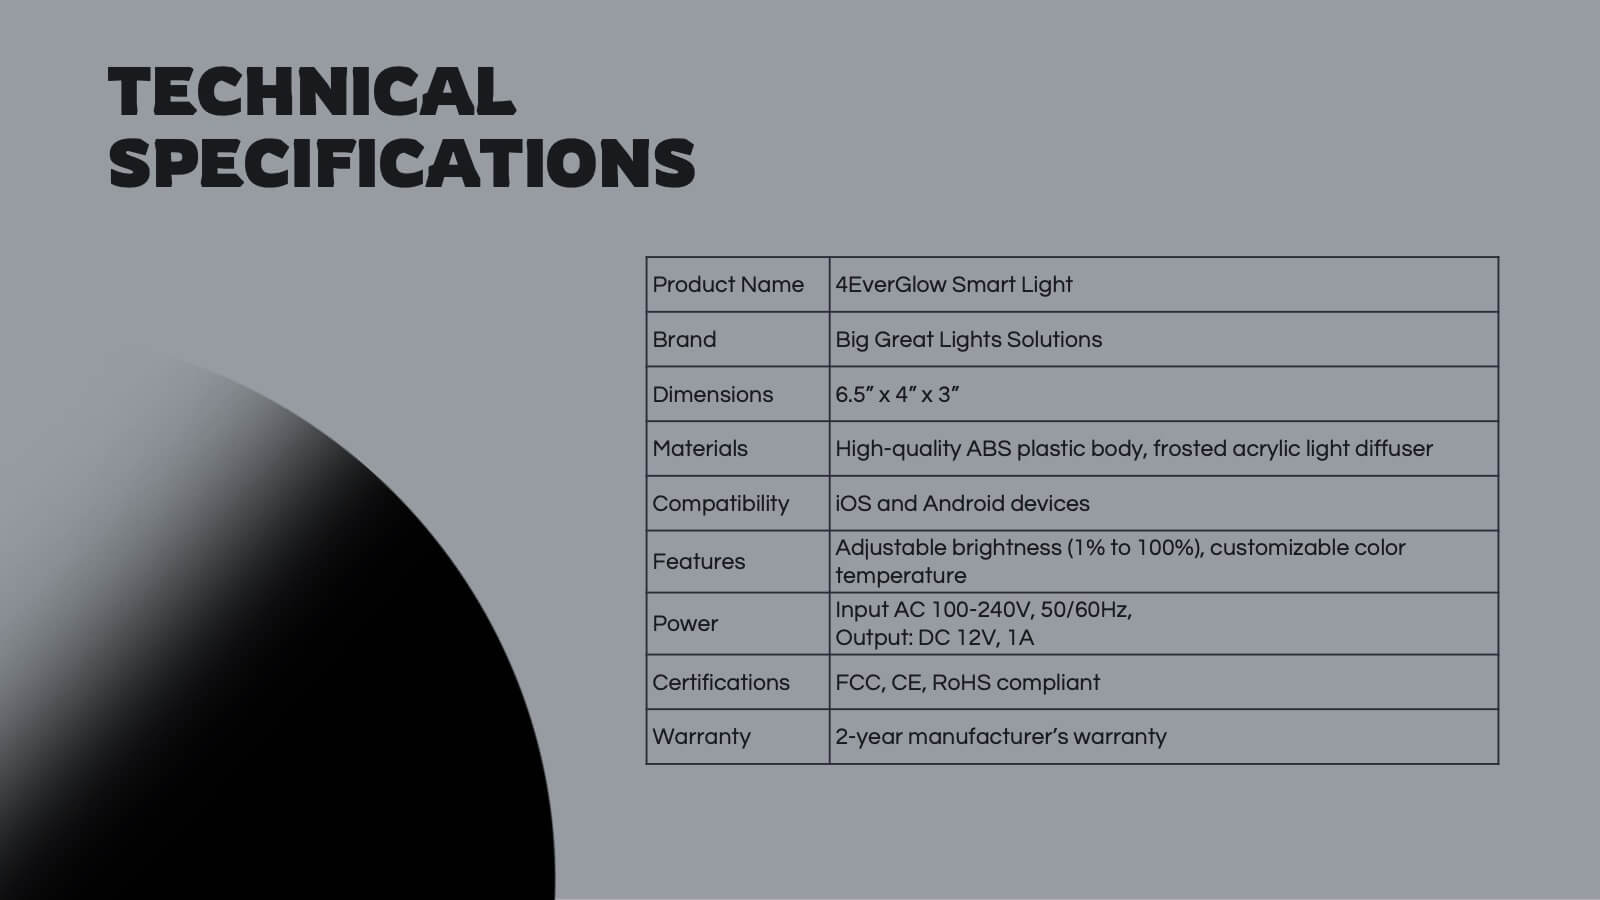
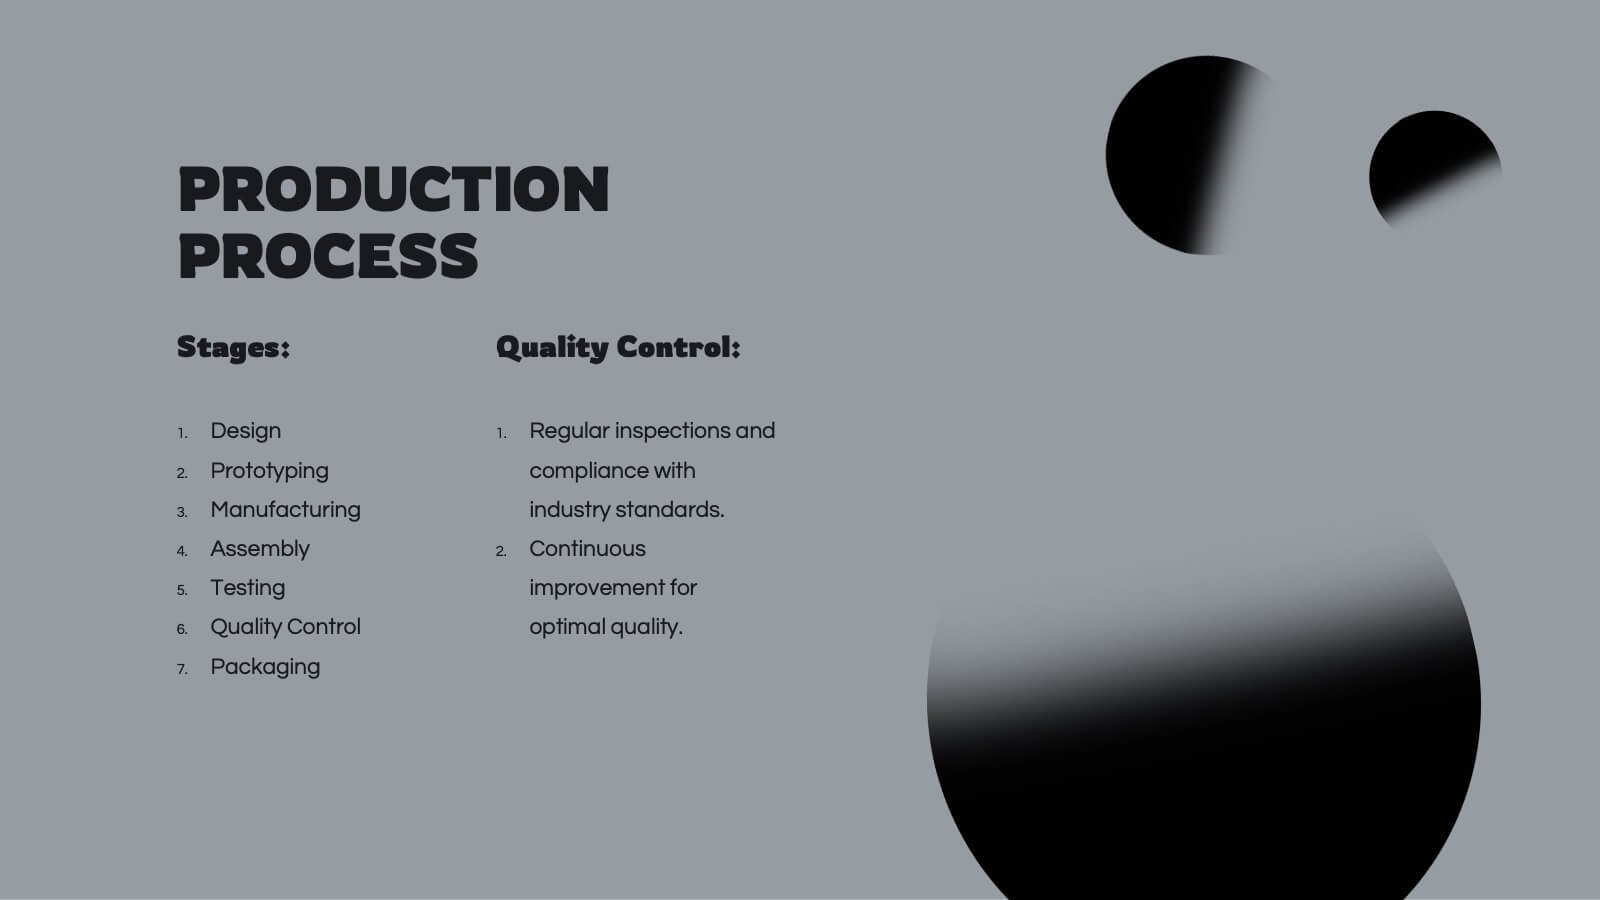
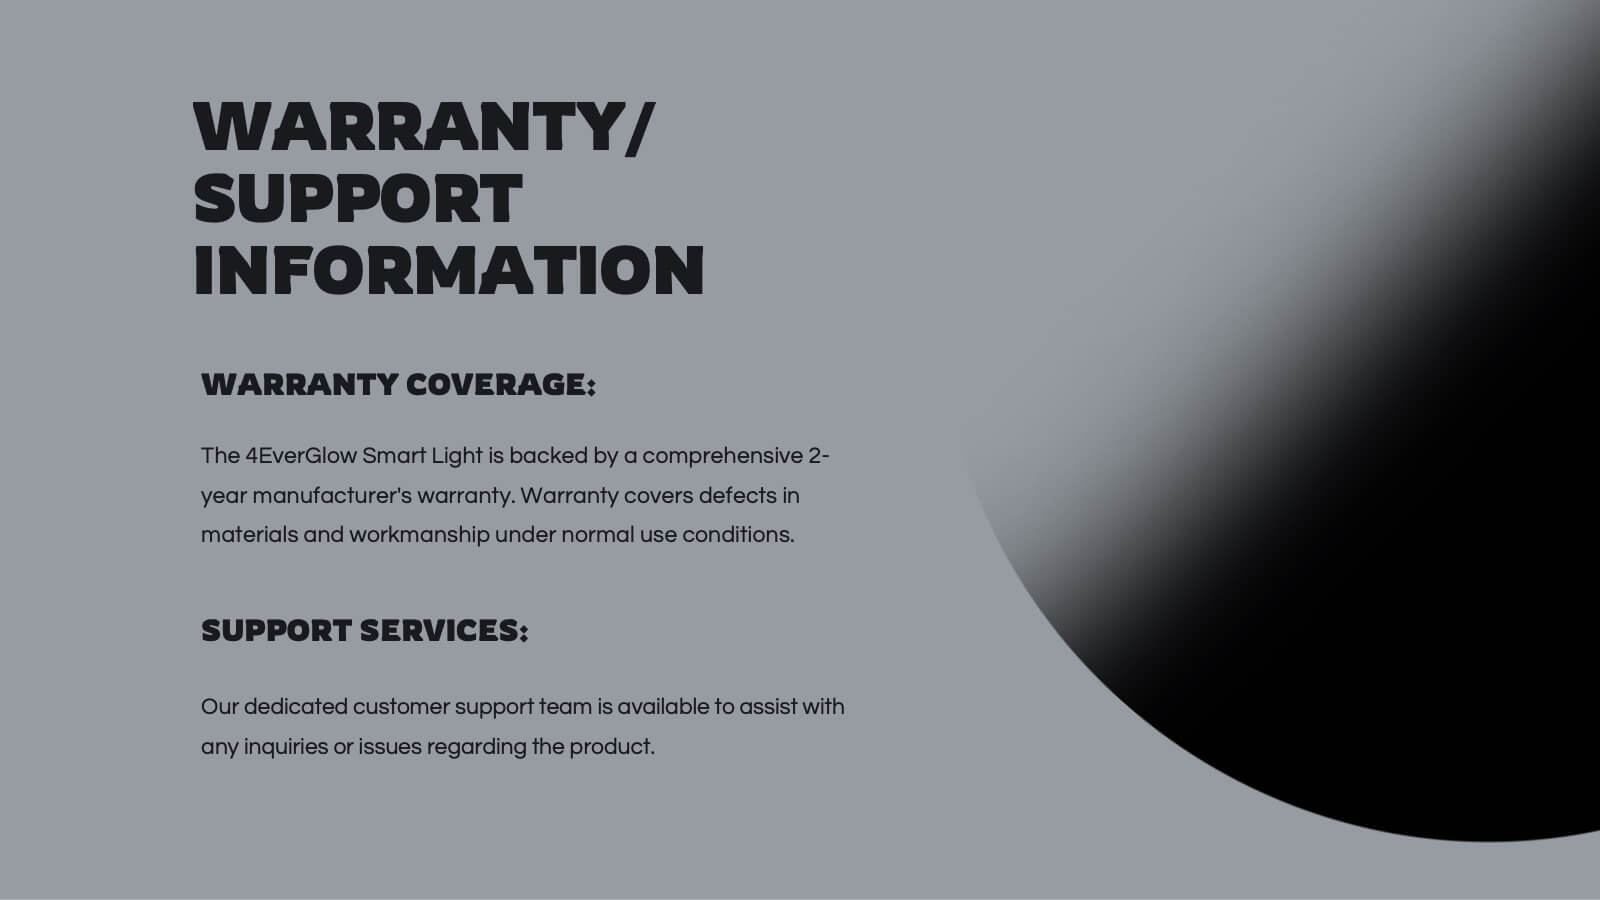
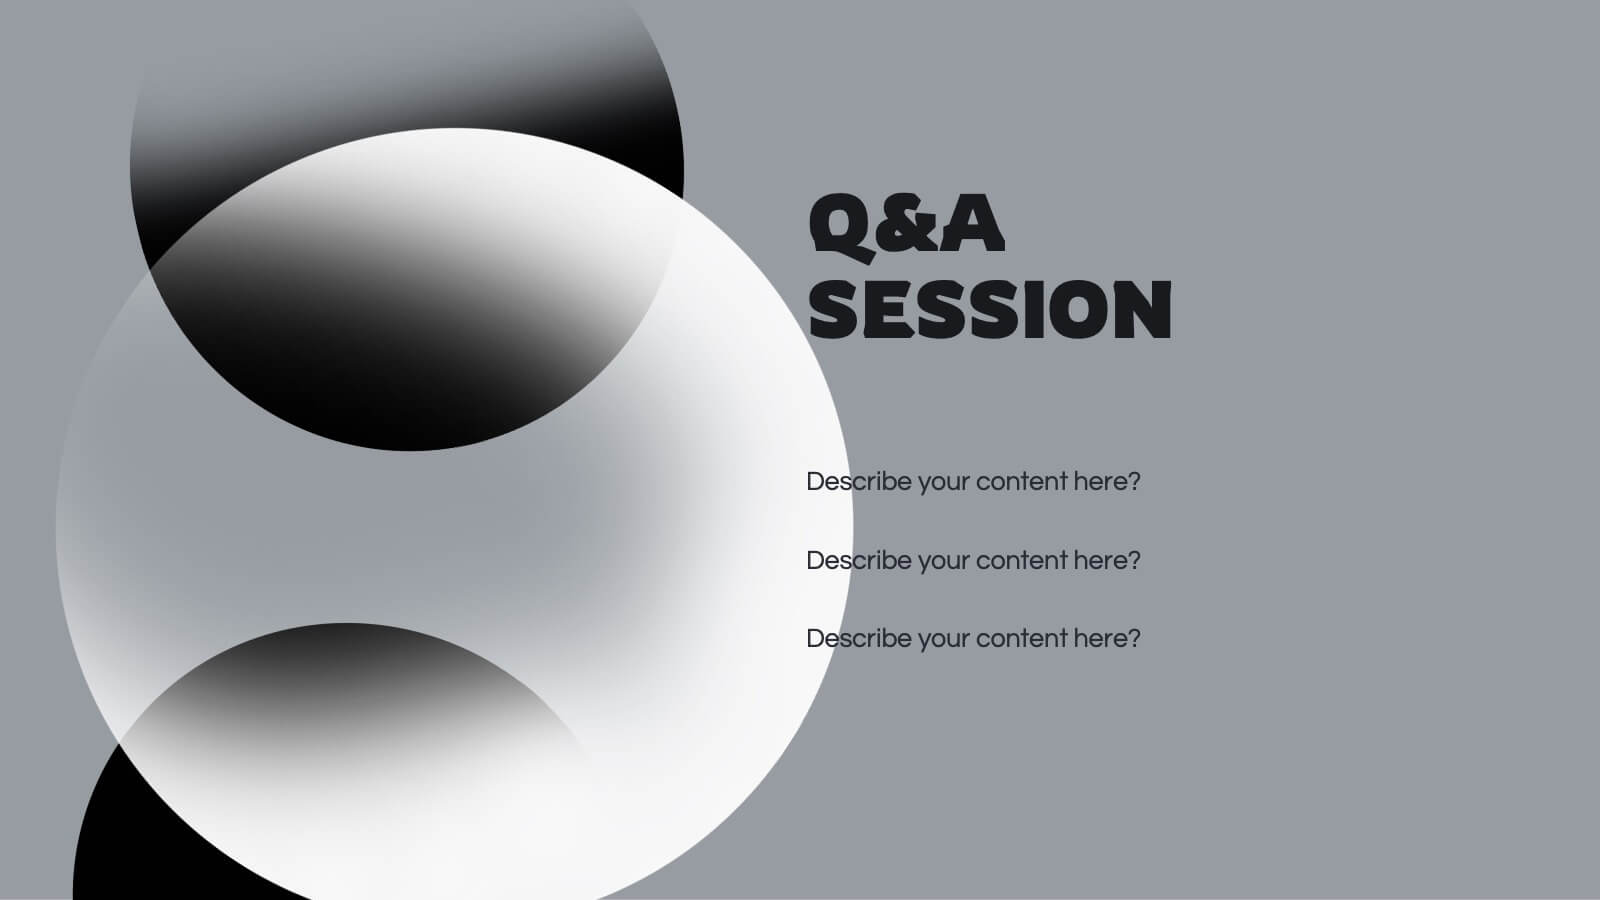
IT Security Infrastructure Overview Presentation
Lock in your audience's attention with a clean, modern visual that breaks down tech barriers. This presentation template offers a snapshot of critical IT security components—think firewalls, cloud infrastructure, and data safeguards—making it easier to explain complex systems. Fully editable and compatible with PowerPoint, Keynote, and Google Slides for effortless customization.


8 diapositivas
Business Challenge & Solution Presentation
Address complex issues with clarity using this business challenges and solutions presentation. Featuring a chess knight visual, it helps outline problems and corresponding strategies. Ideal for strategic planning, risk management, and executive briefings. Fully customizable in PowerPoint, Keynote, and Google Slides to fit your corporate or consulting presentation needs.


7 diapositivas
Startup Infographic Presentation Template
A Startup Infographic is a visual representation of information related to starting a new business, including important data, statistics, and information about the process of launching a startup company. The aim of our startup infographic is for you to present information in an easily digestible and visually appealing manner. Help to communicate complex concepts to an audience and the steps involved in starting a new business. Use this template to make presentations that’ll blow your audience away. This layout is flexible, adaptable and compatible with Powerpoint, Keynote, and Google Slides.


20 diapositivas
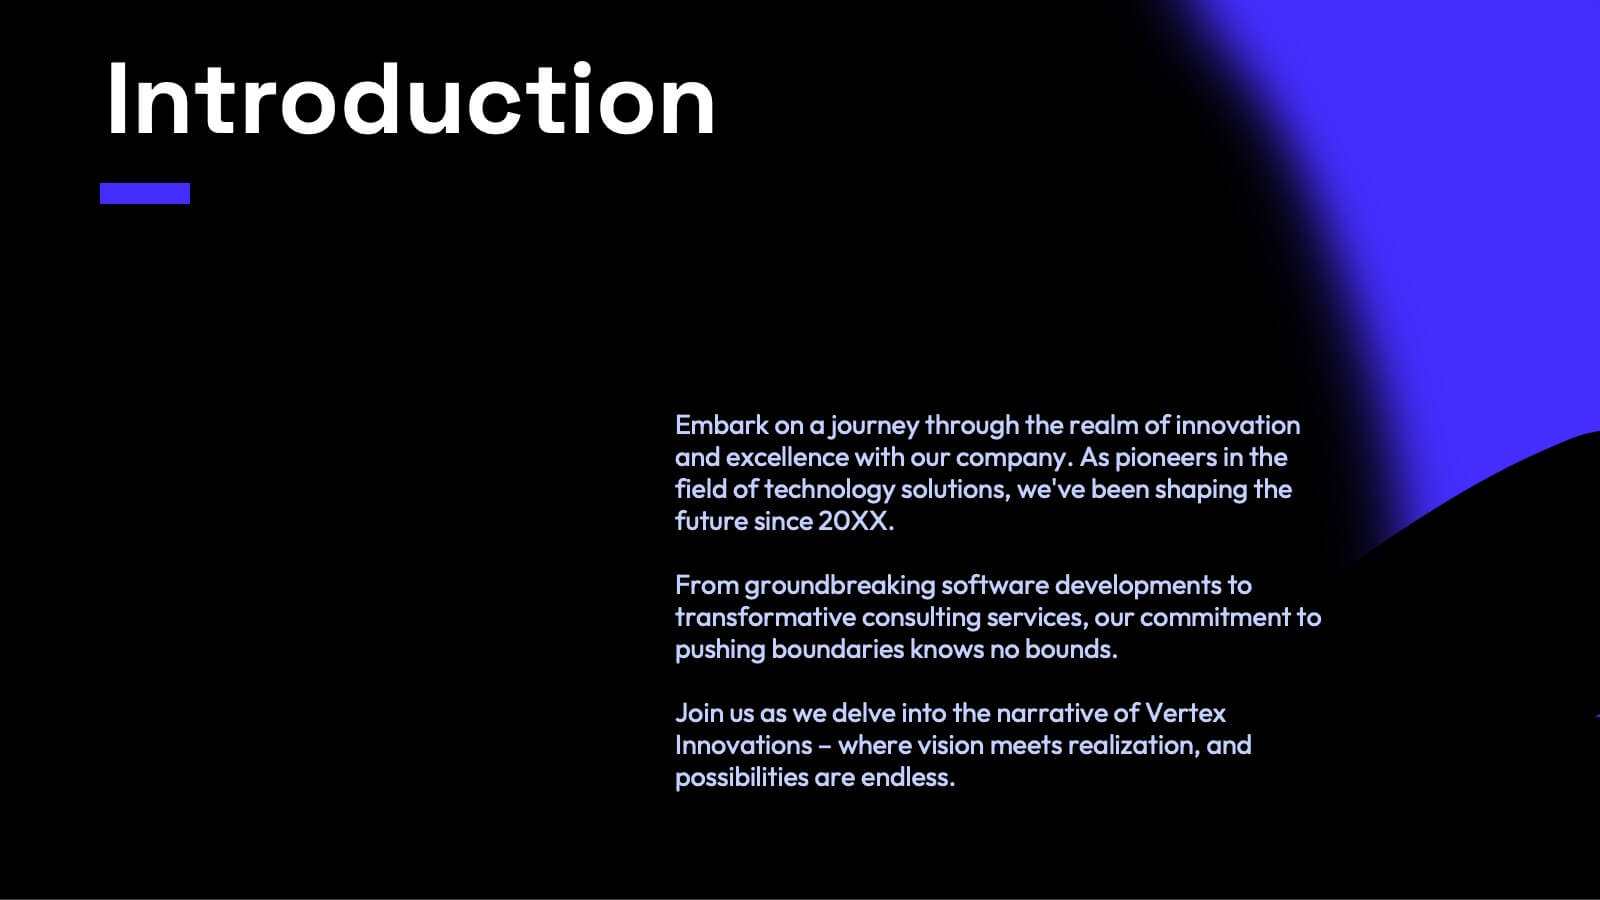
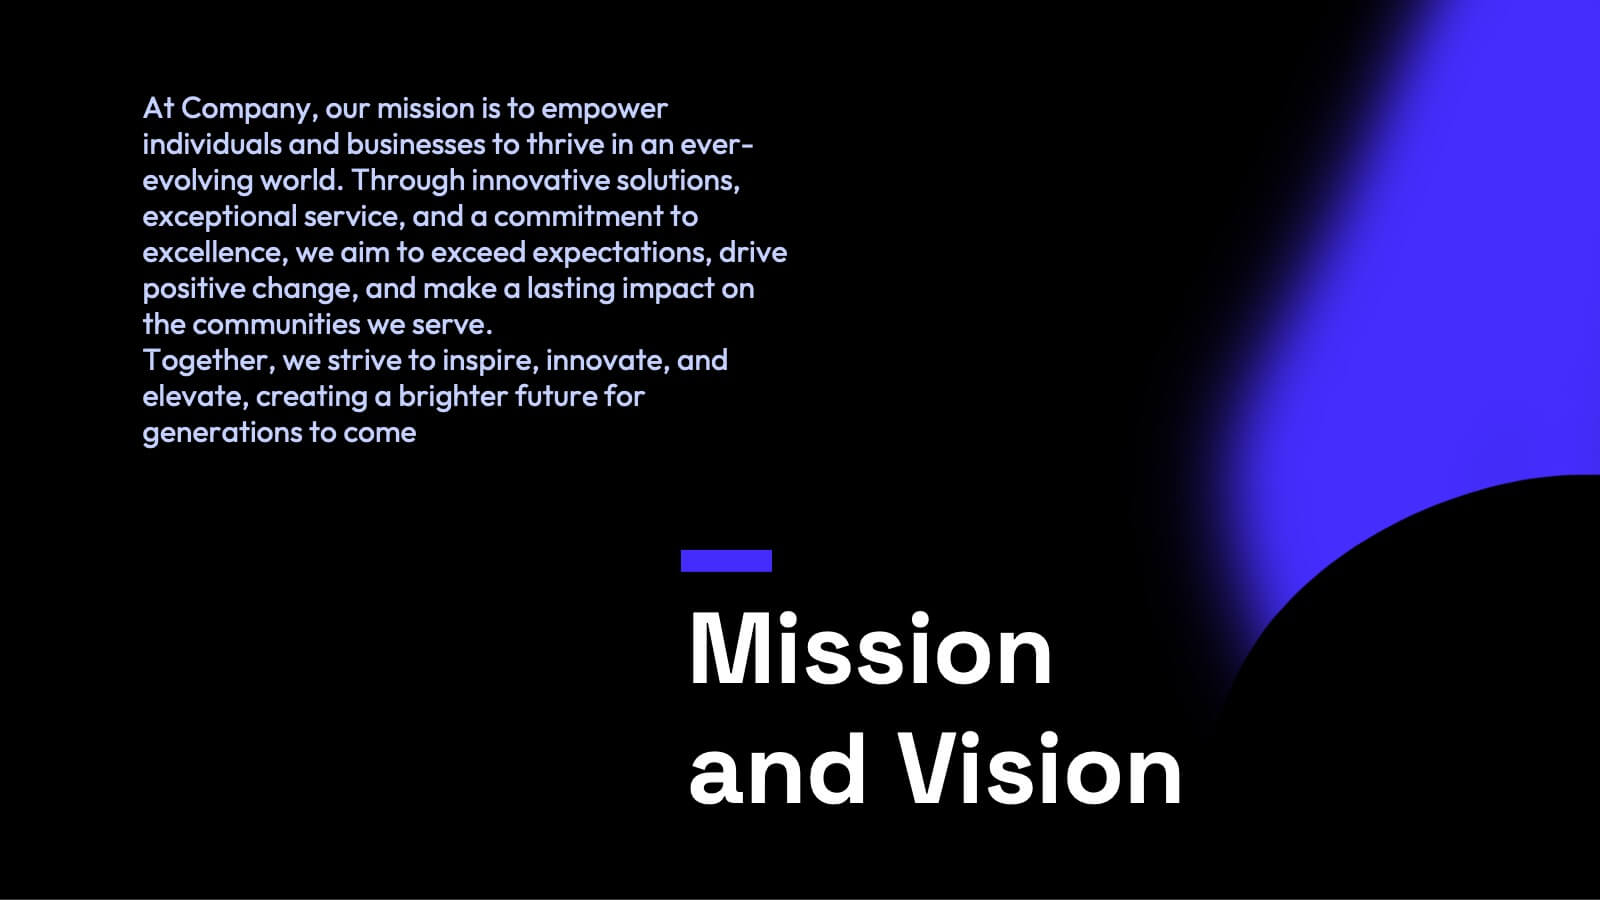
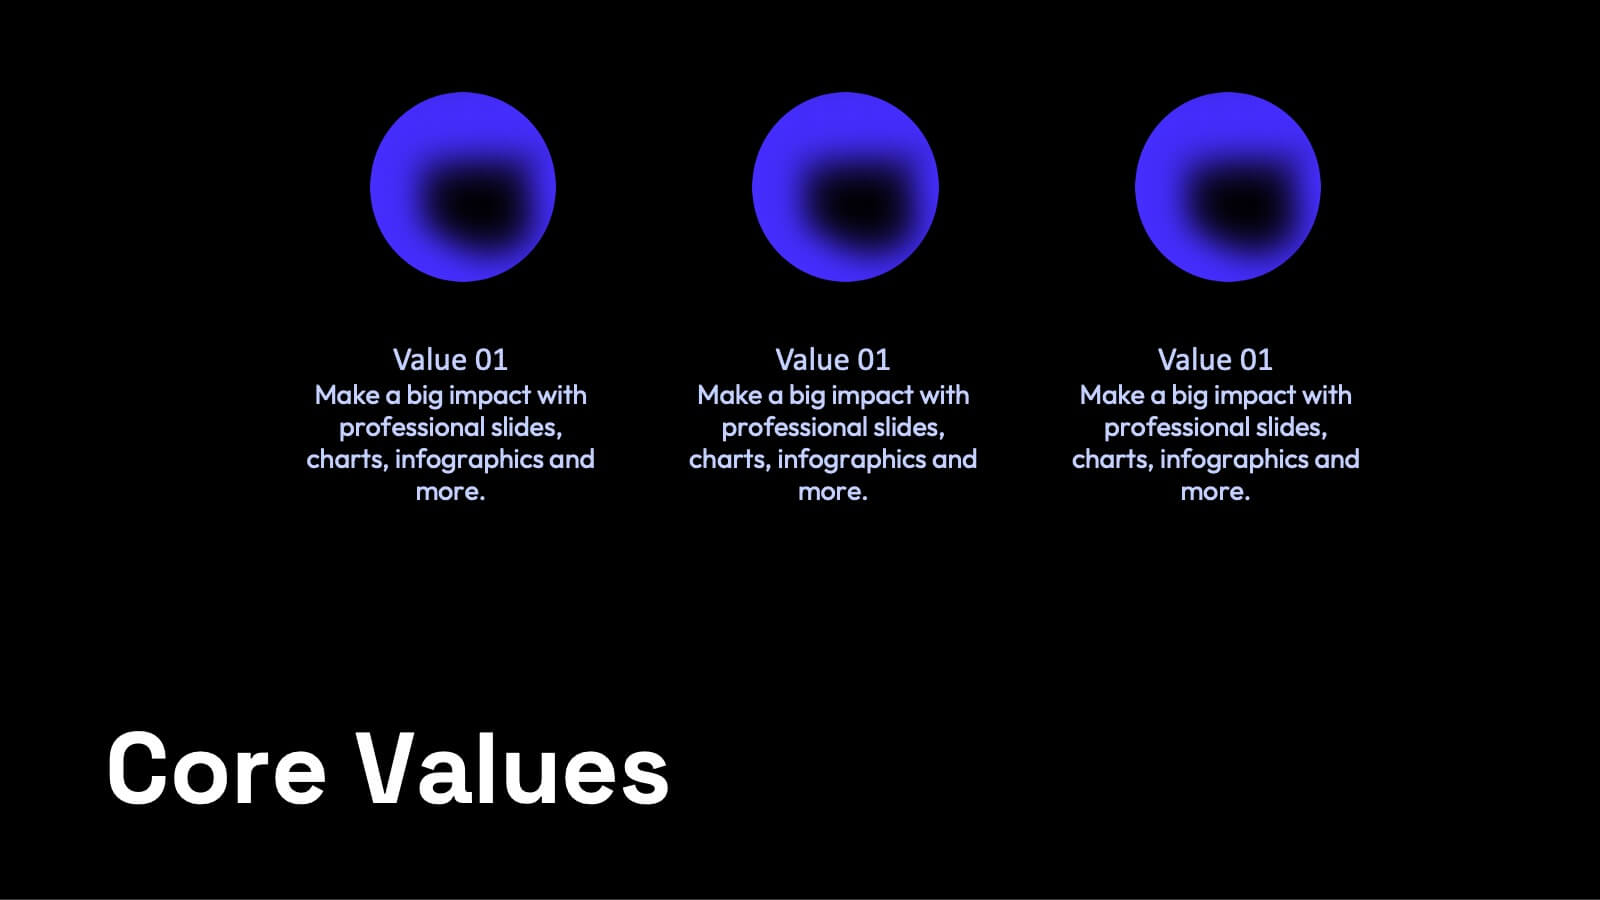
Apex Content Marketing Pitch Deck Presentation
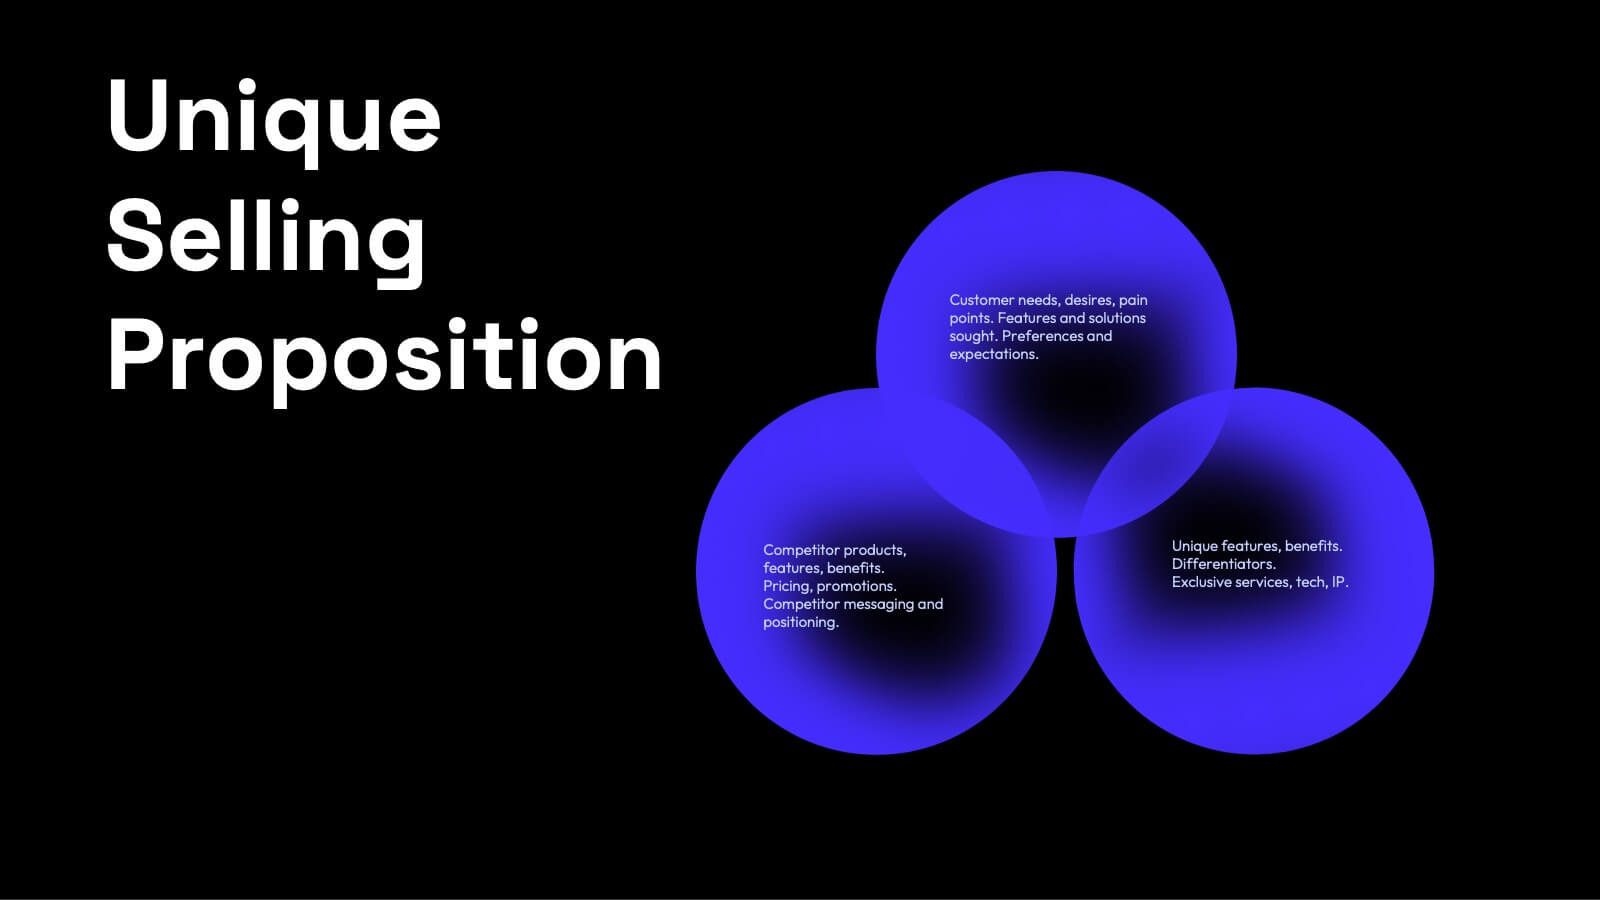
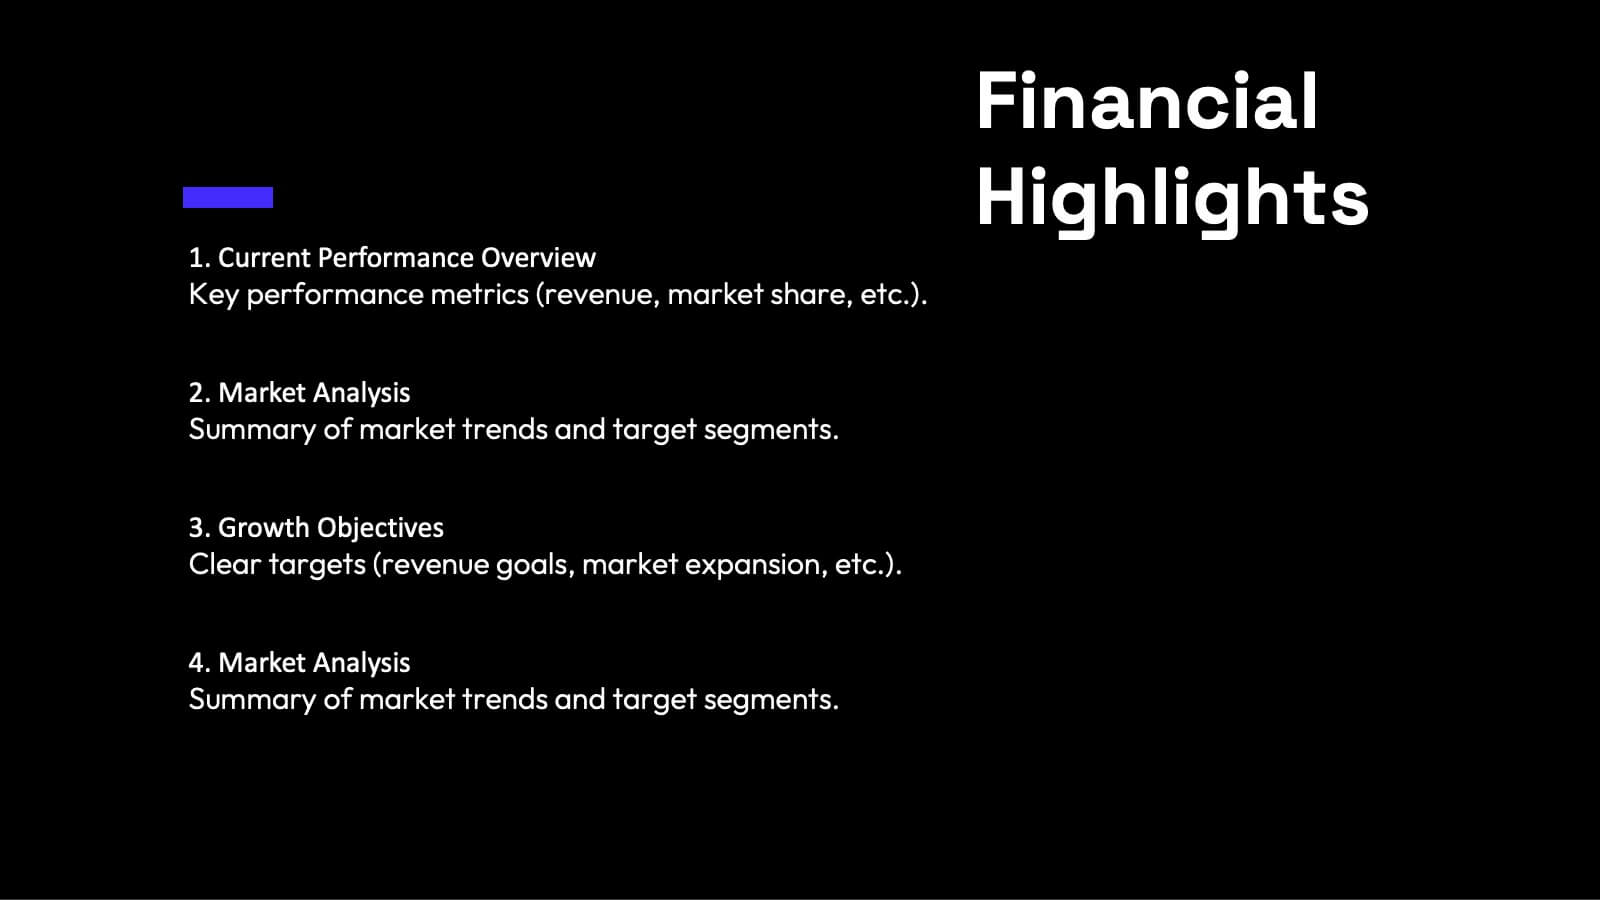
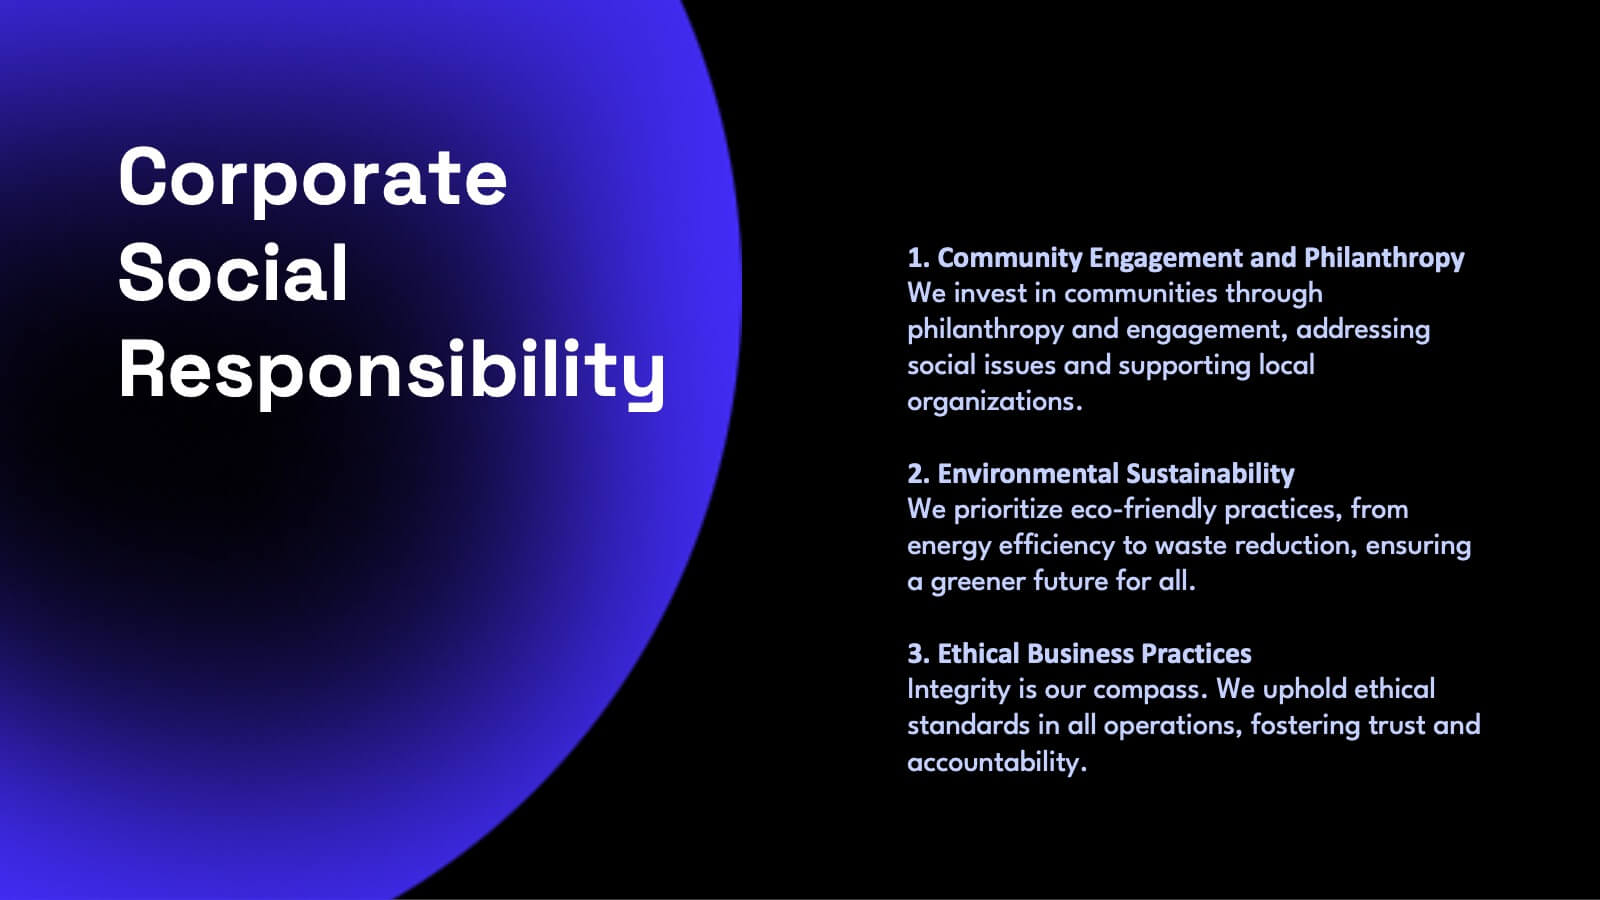
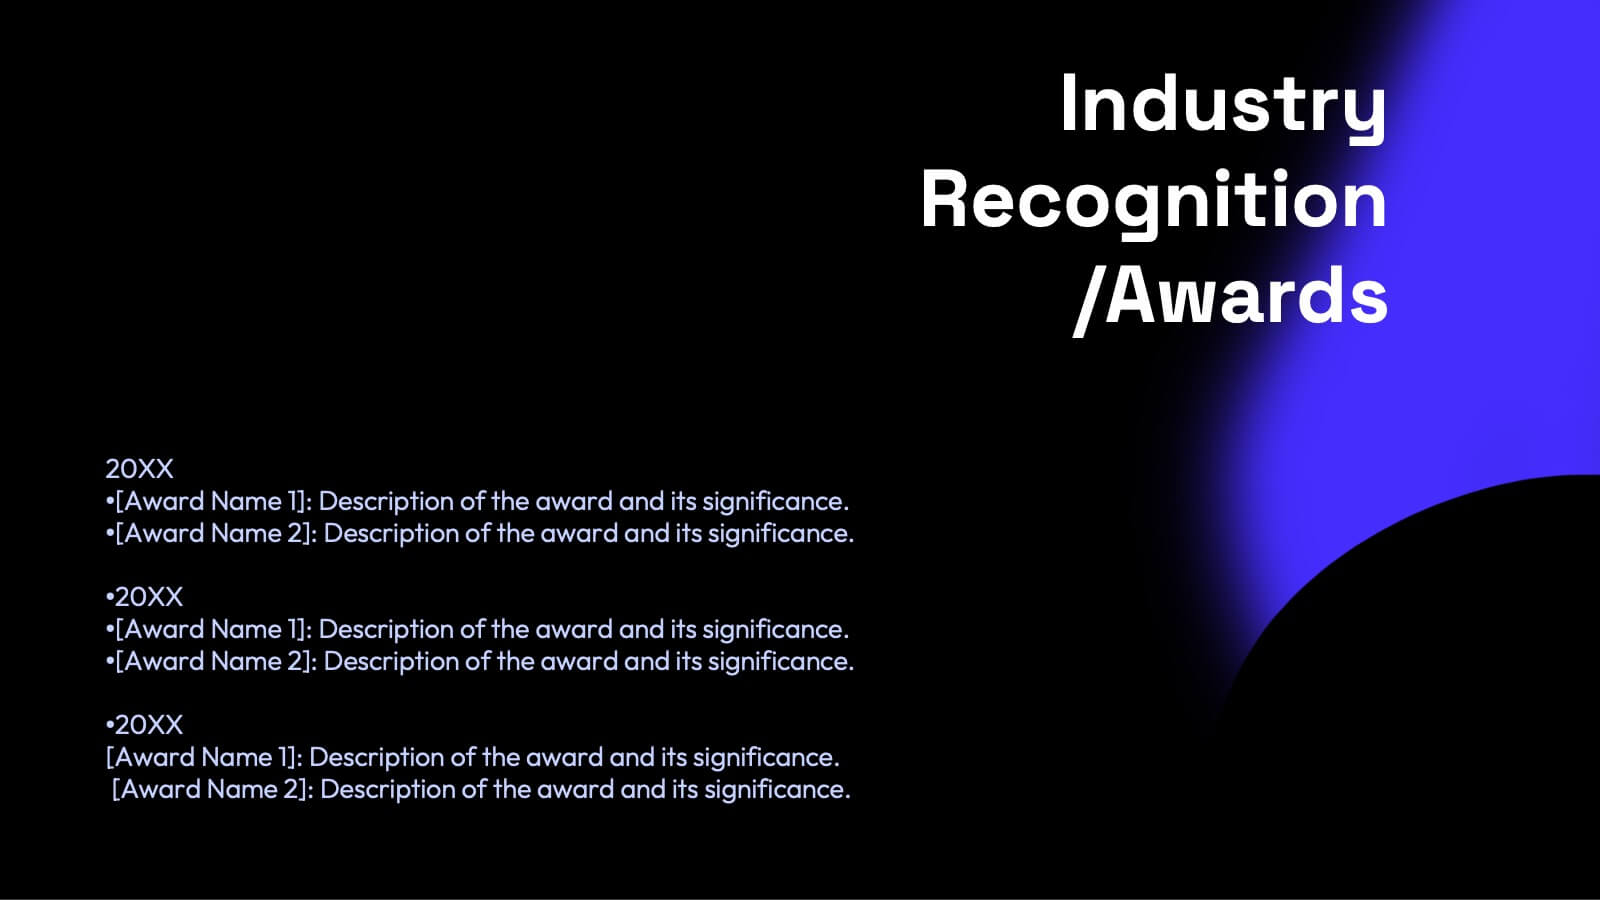
Ignite your marketing strategy with this captivating pitch deck! Perfect for showcasing content marketing plans, it features slides on company history, target audience, and unique selling propositions. Make a lasting impression with sleek, modern designs and compelling content. Compatible with PowerPoint, Keynote, and Google Slides for a smooth presentation experience on any platform.


20 diapositivas
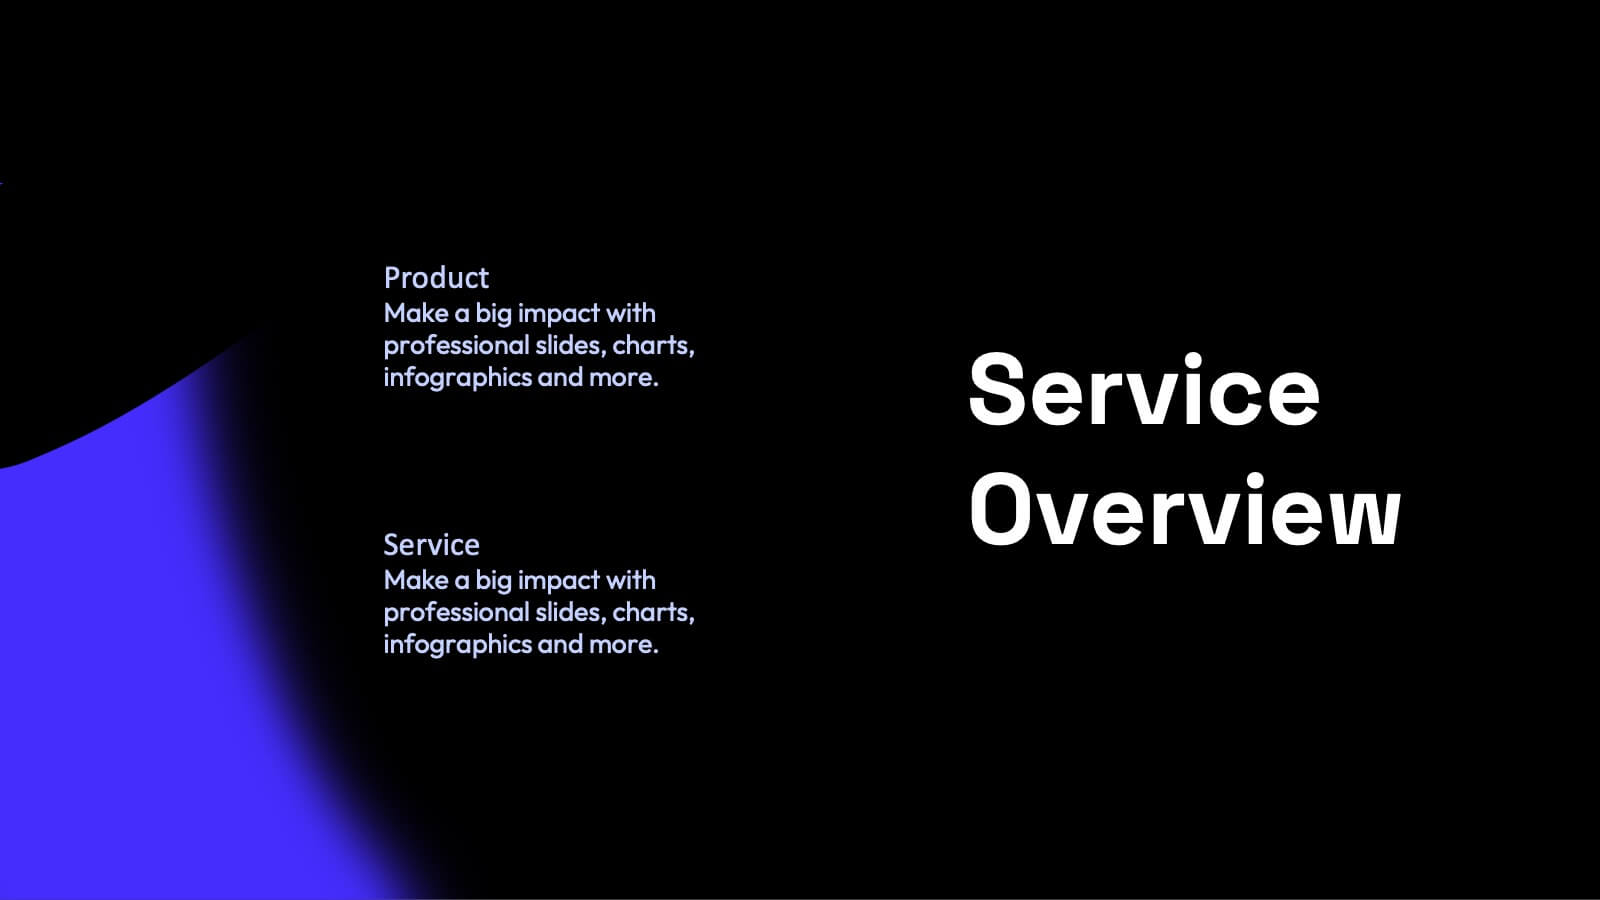
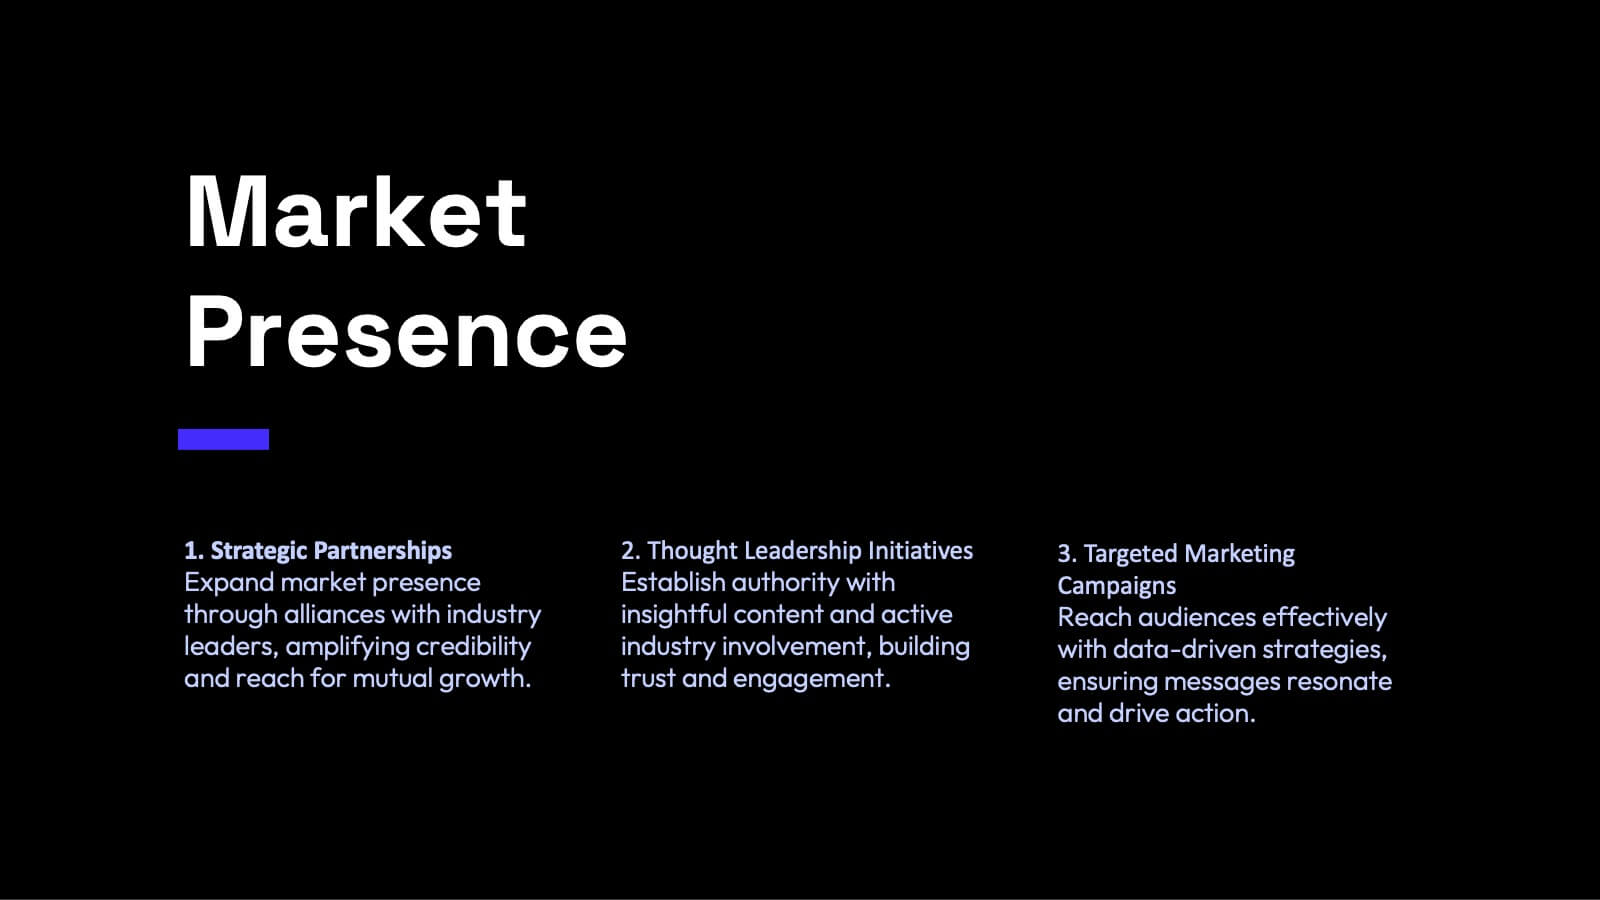
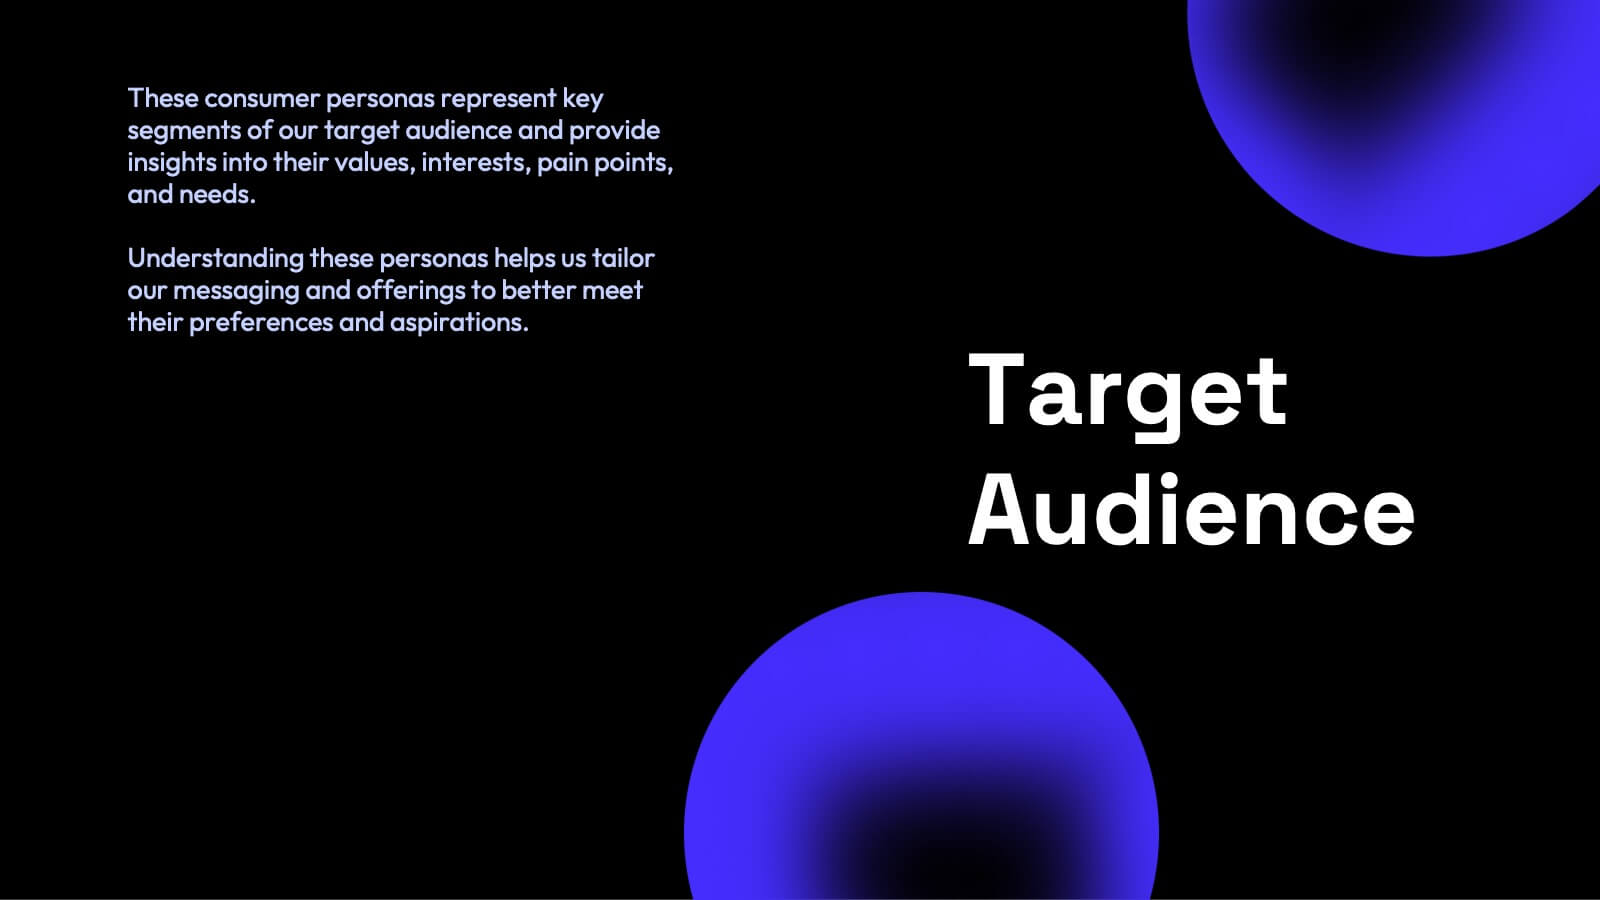
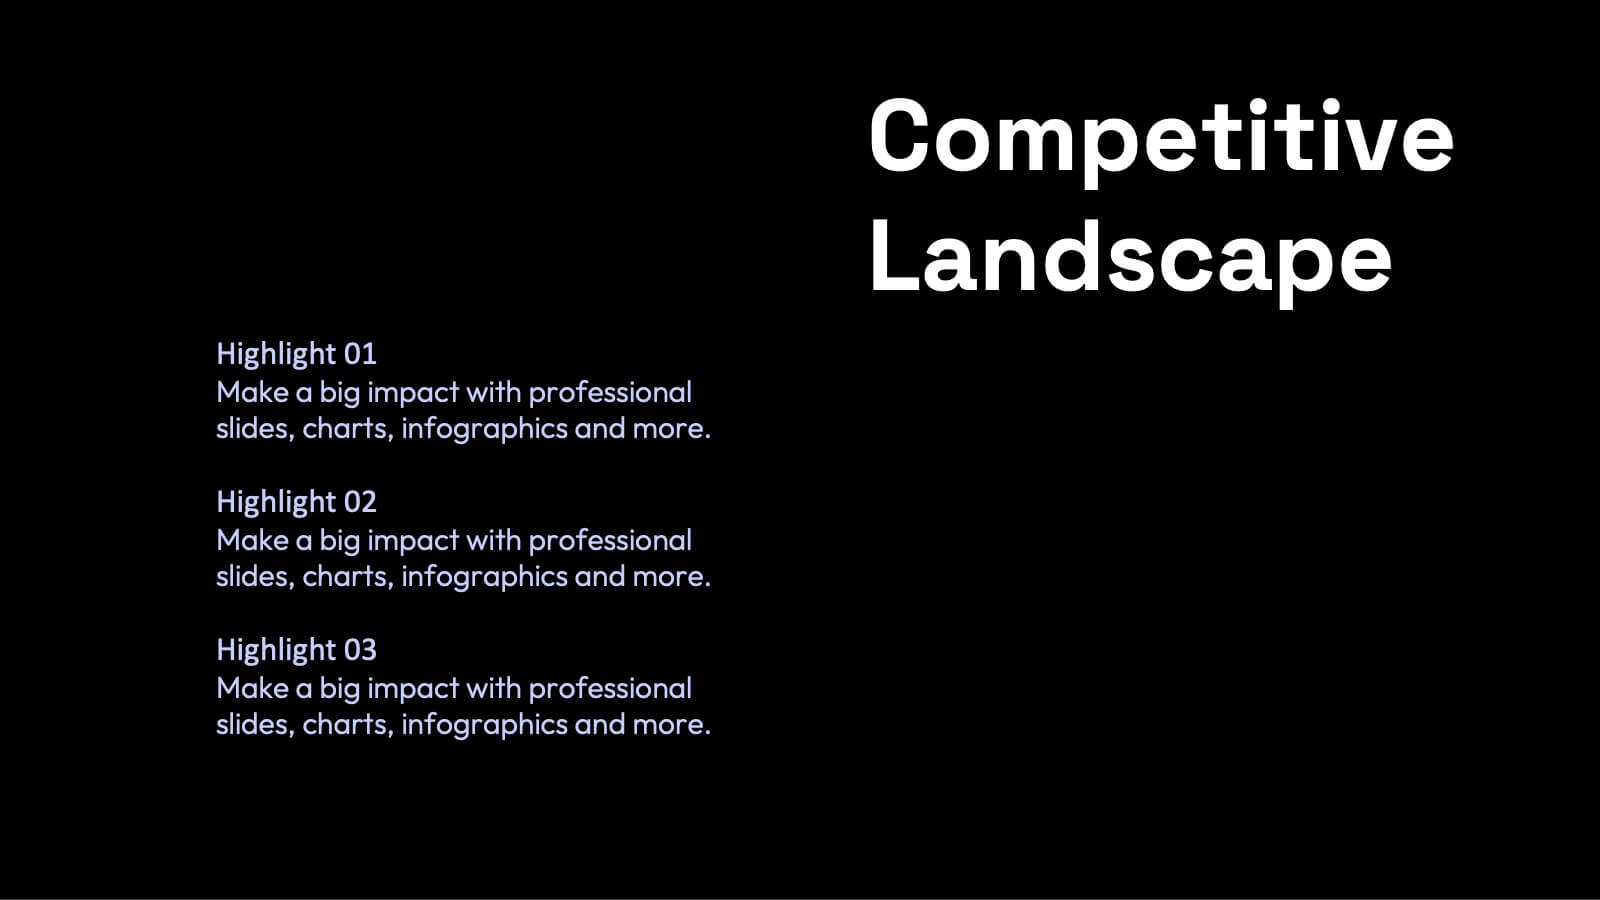
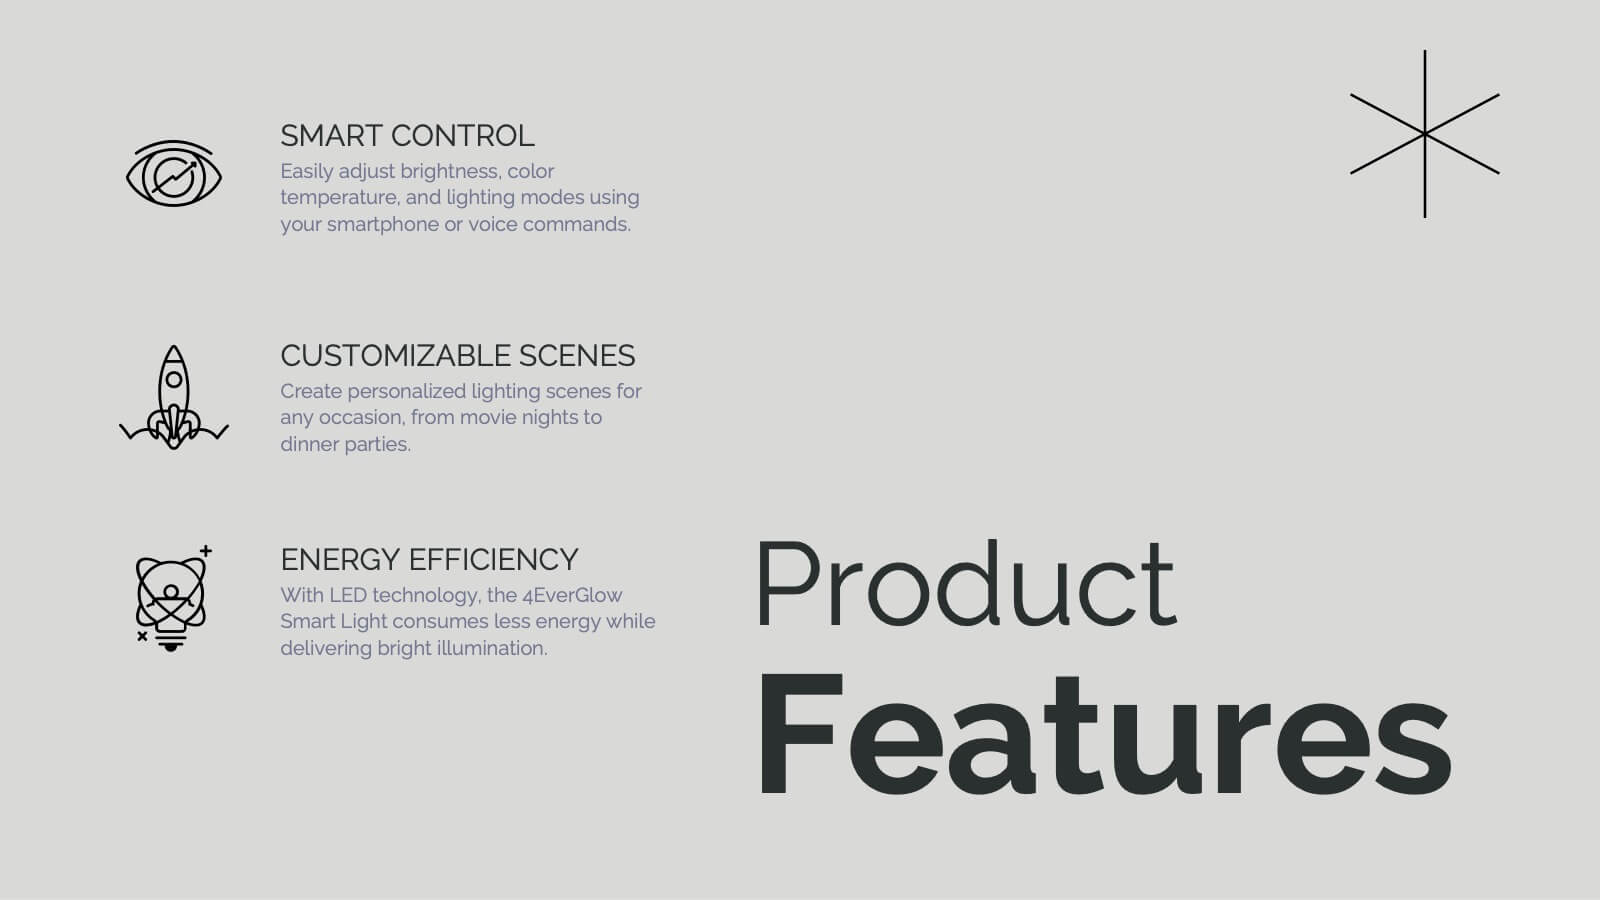
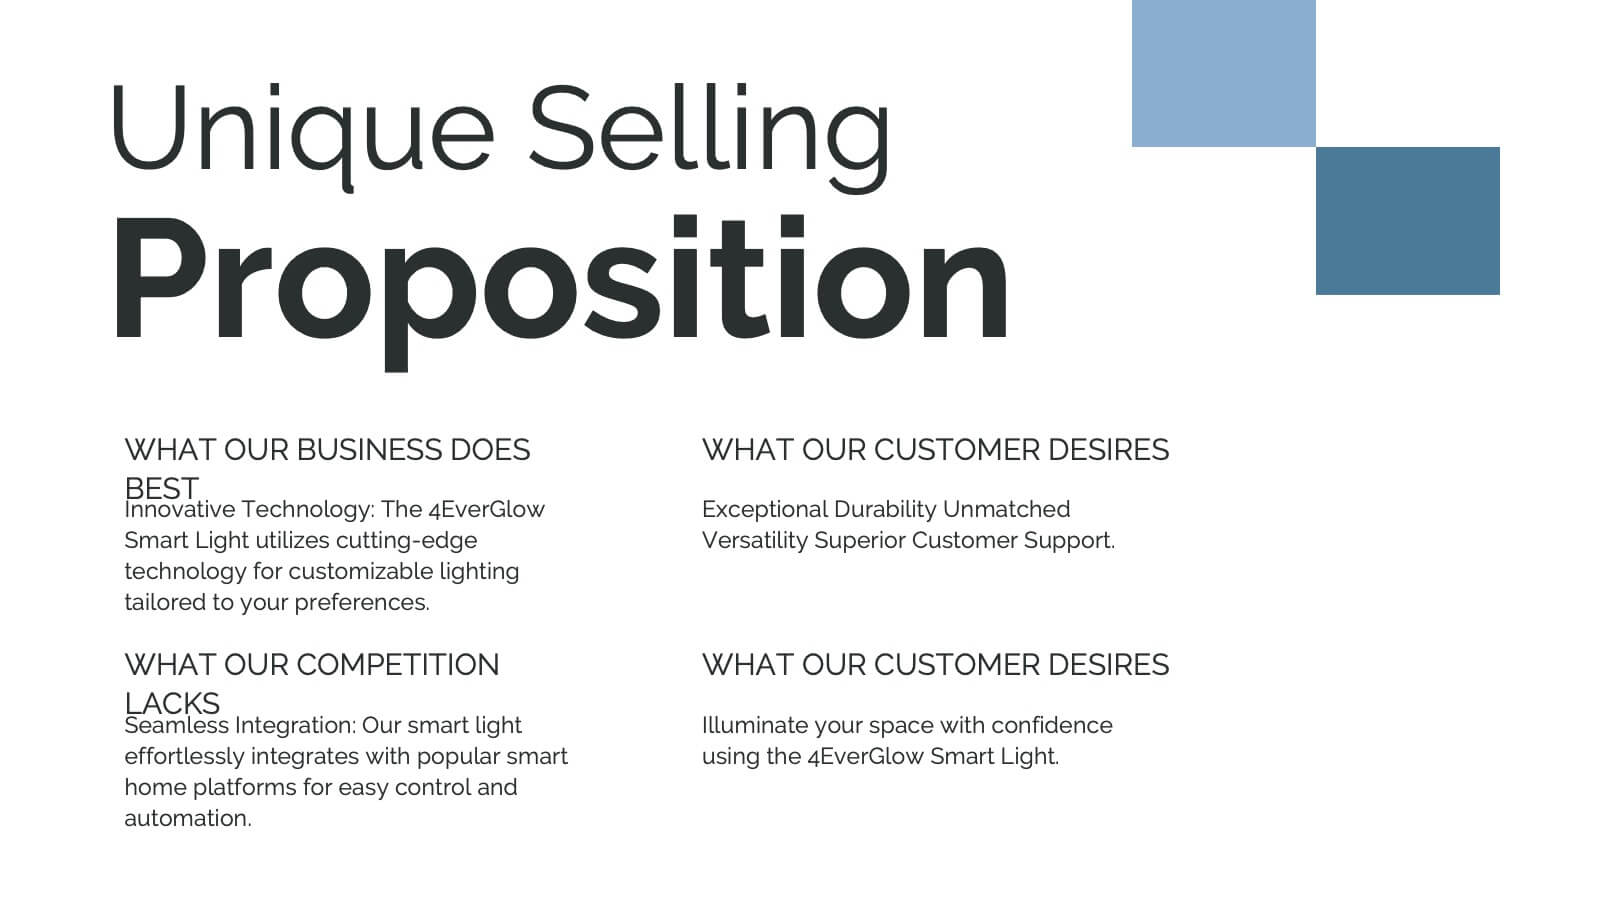
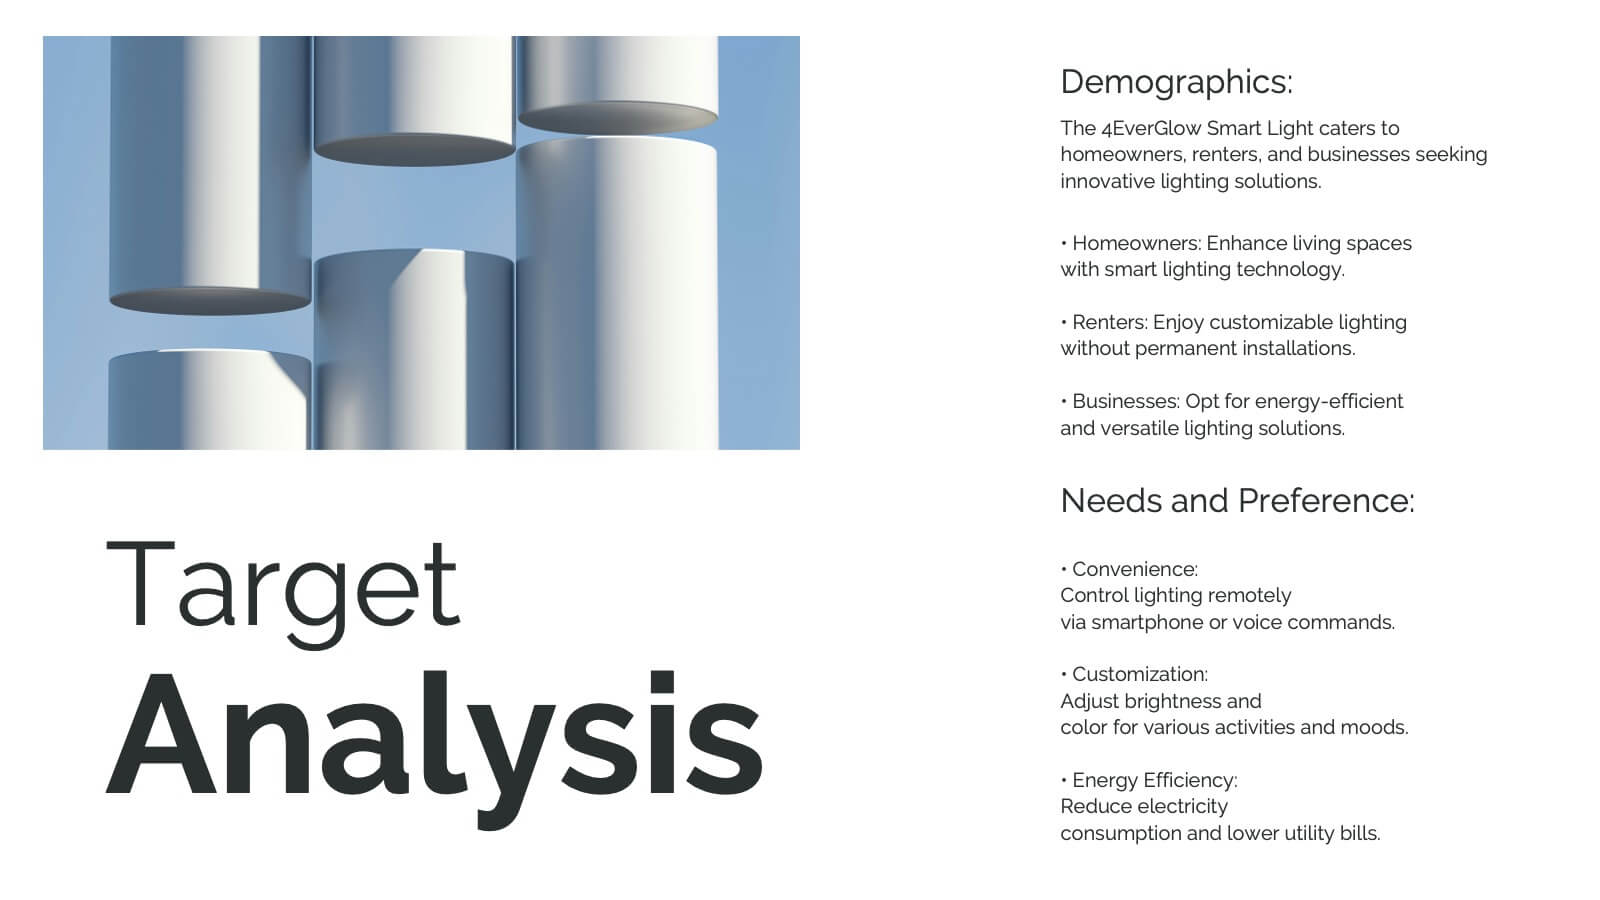
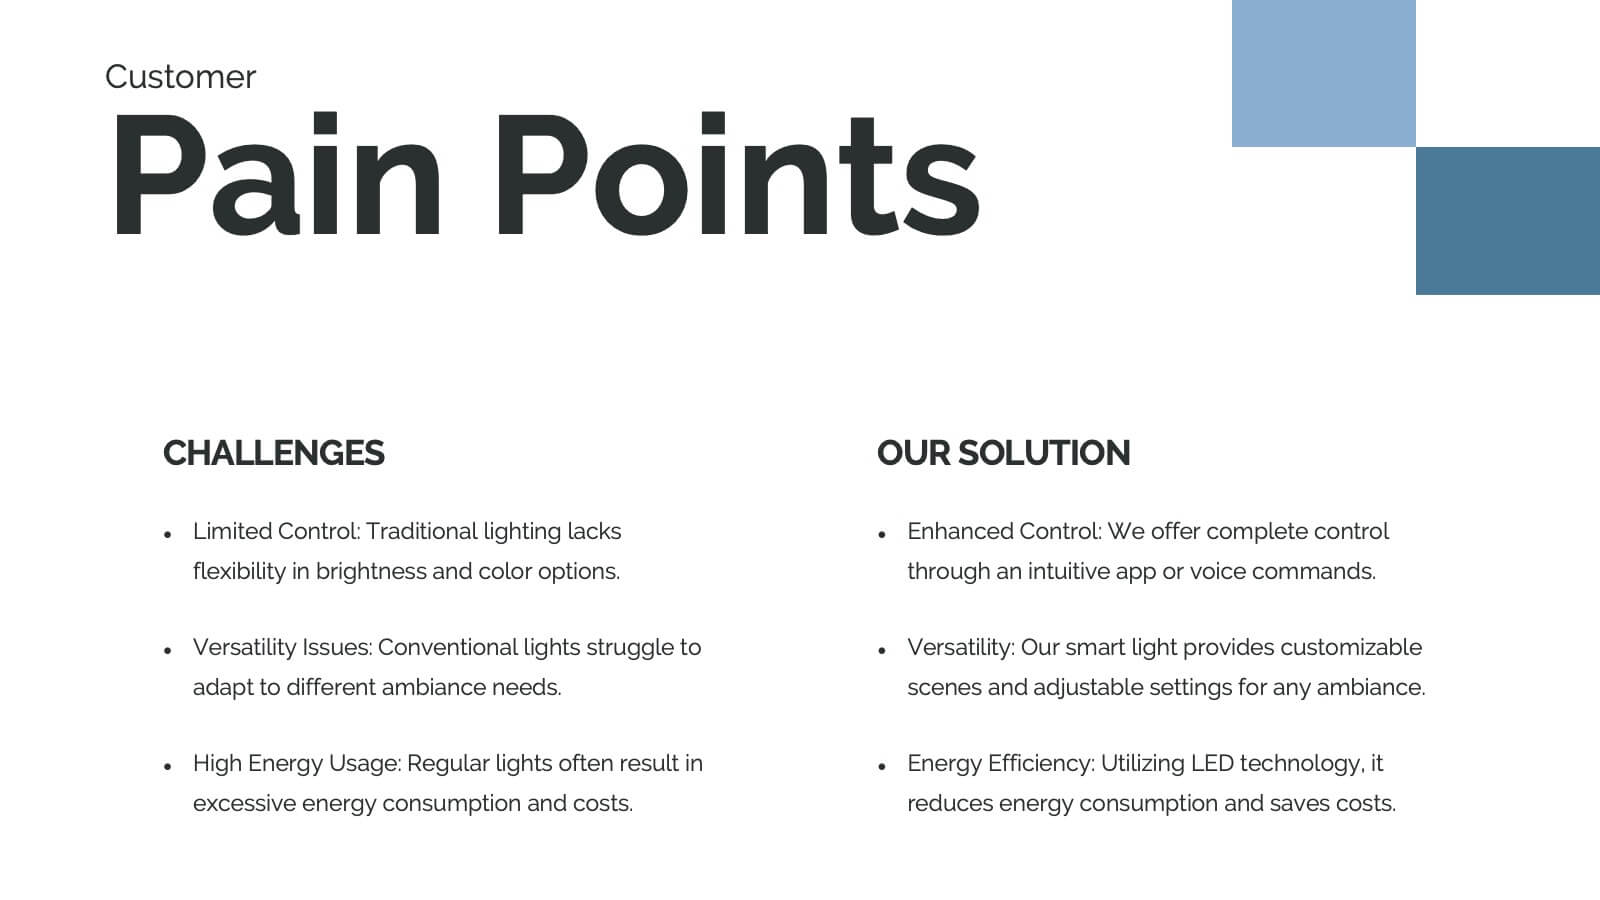
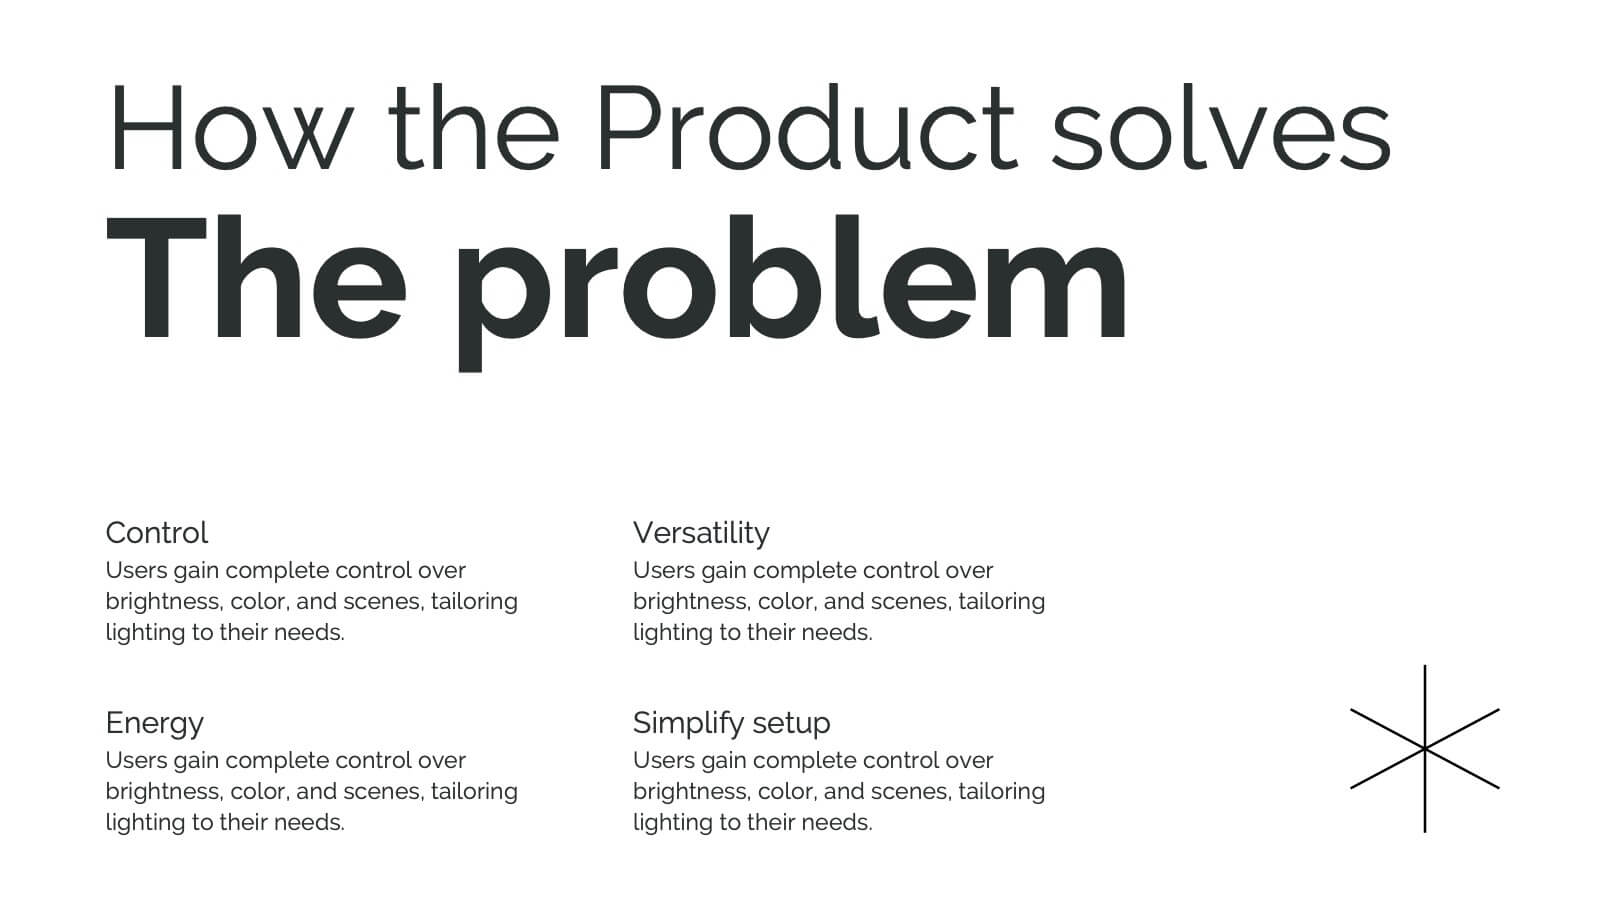
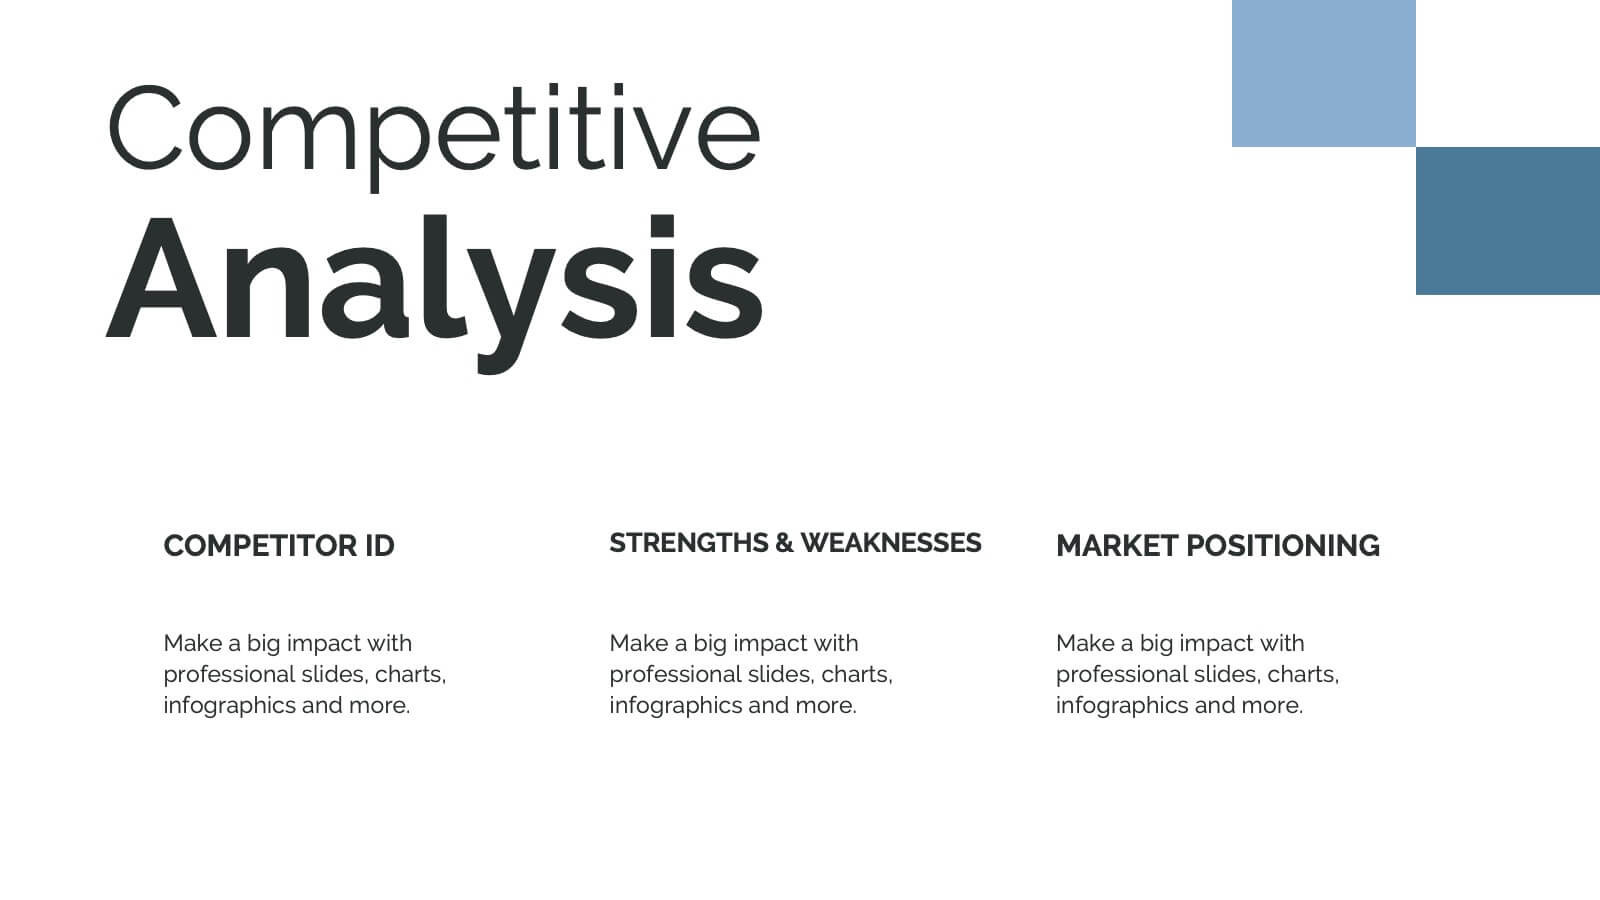
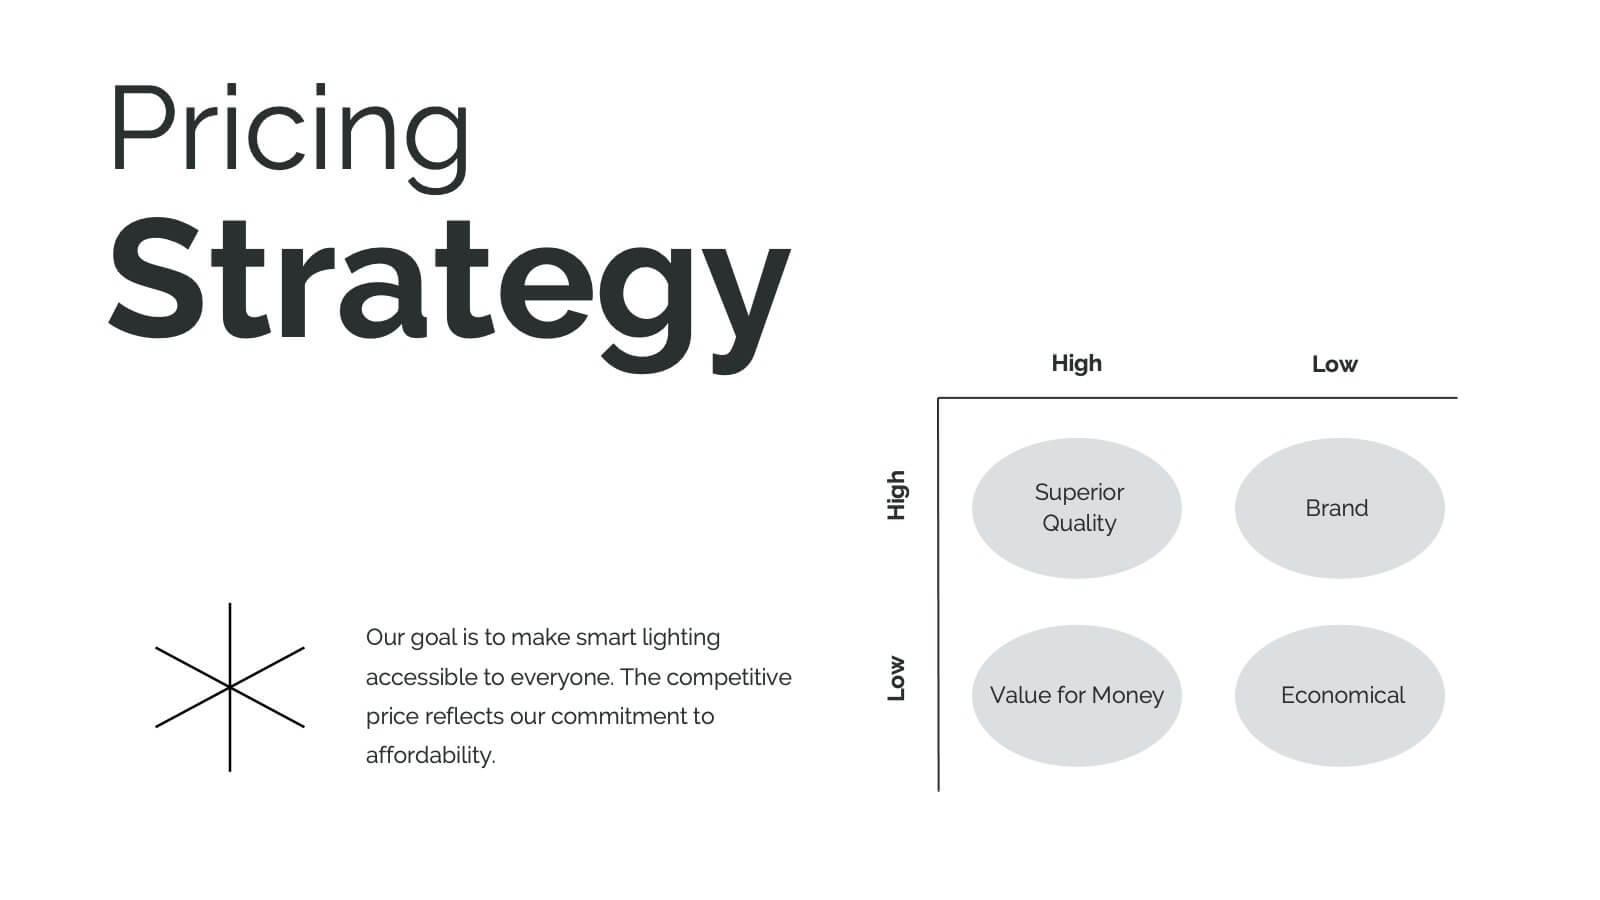
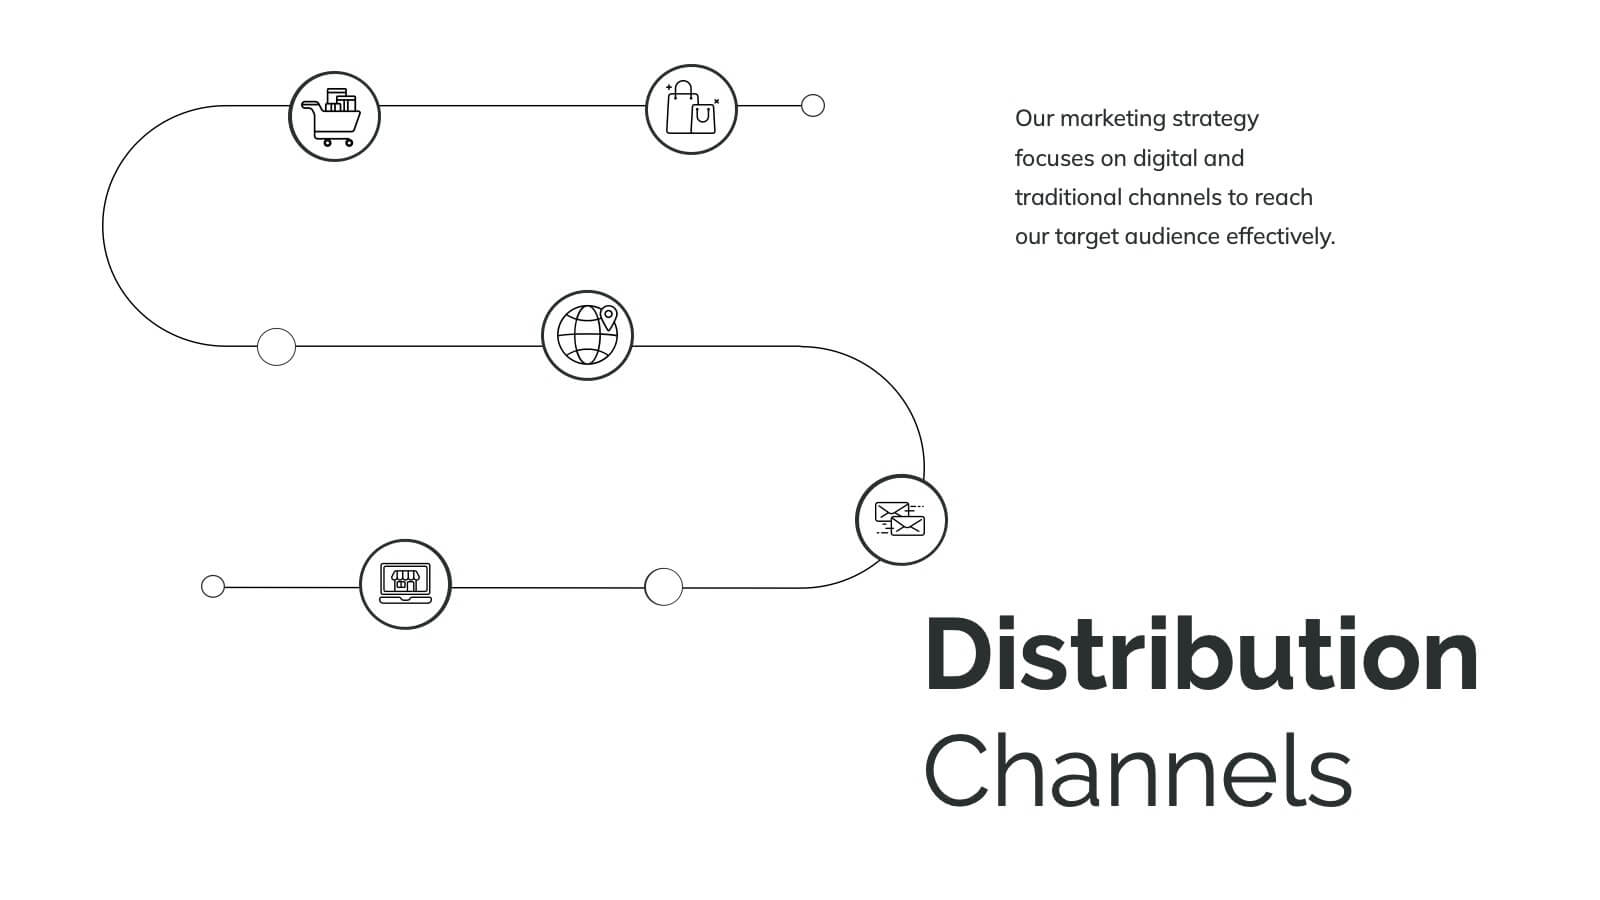
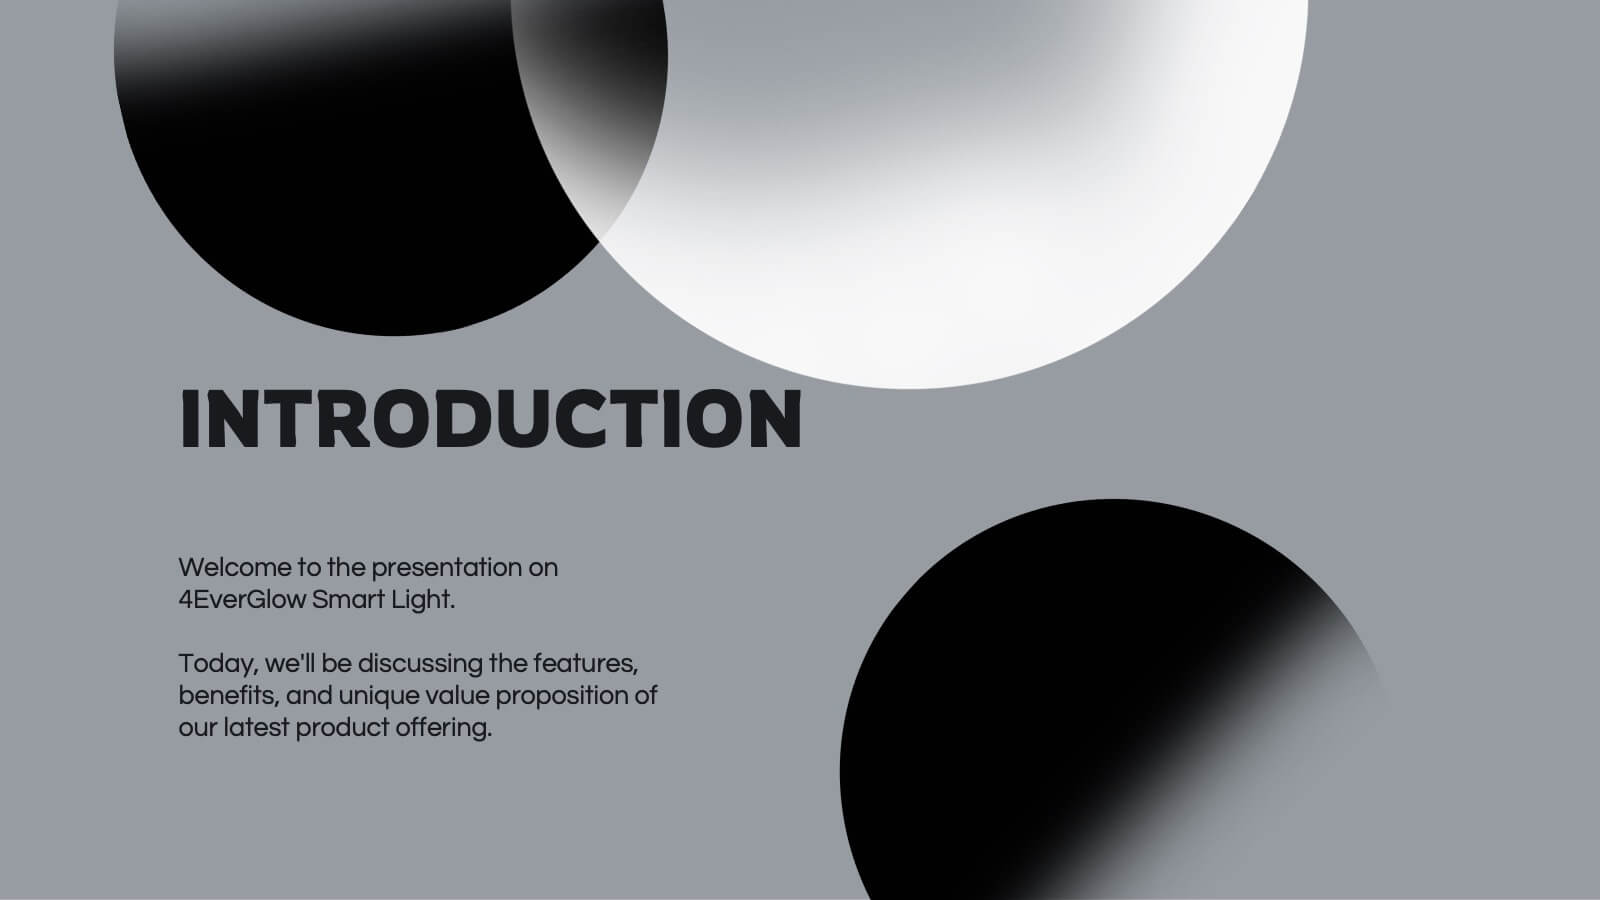
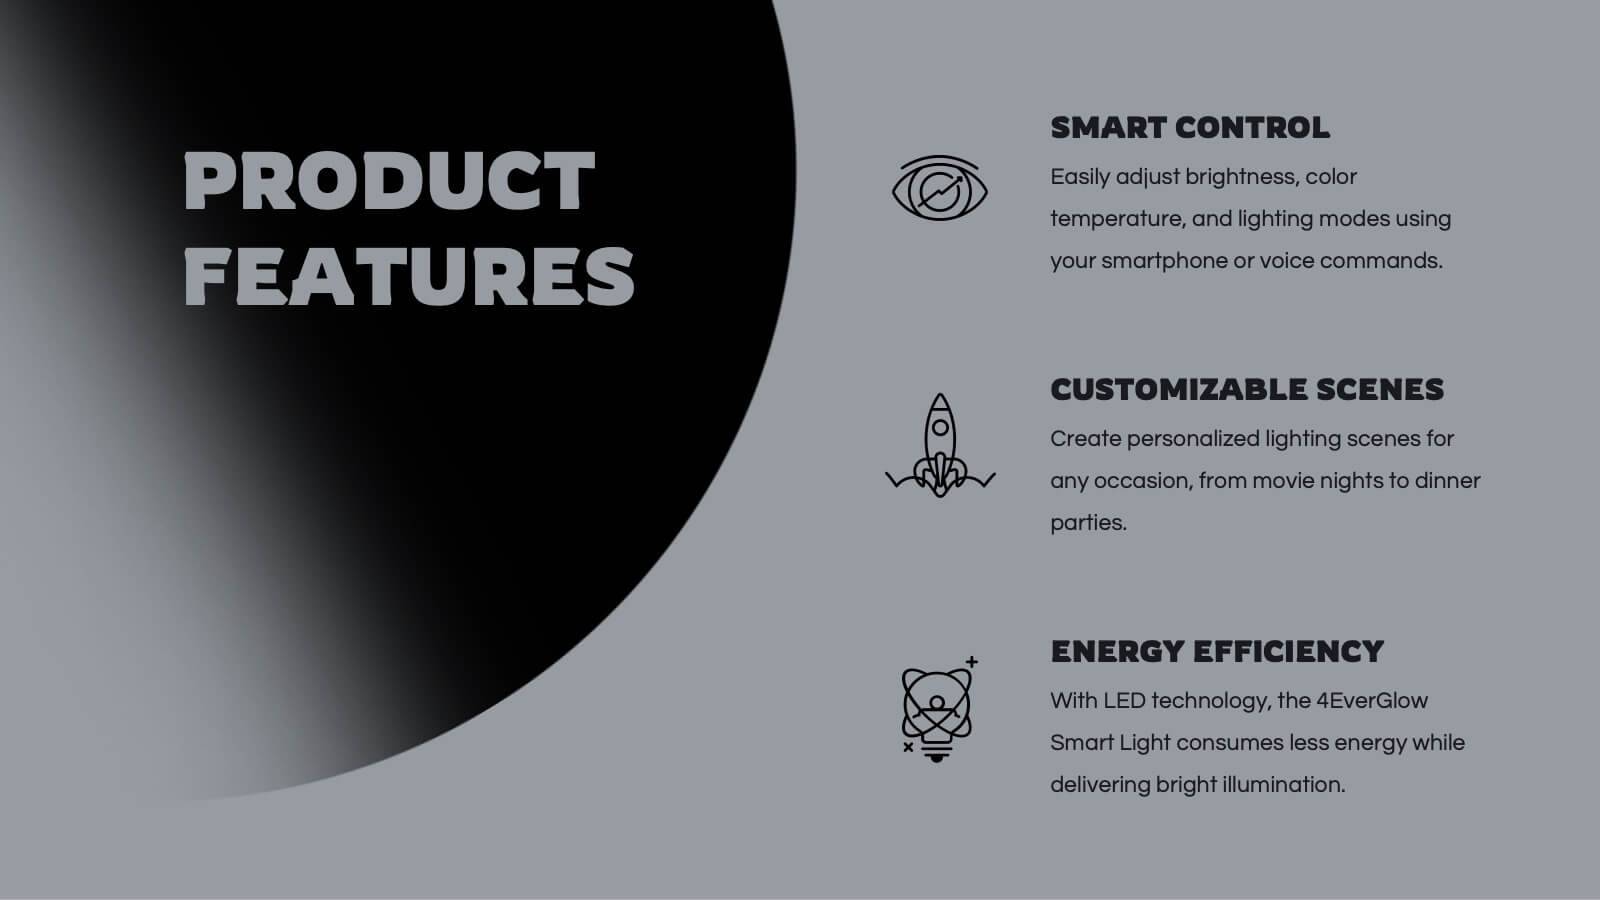
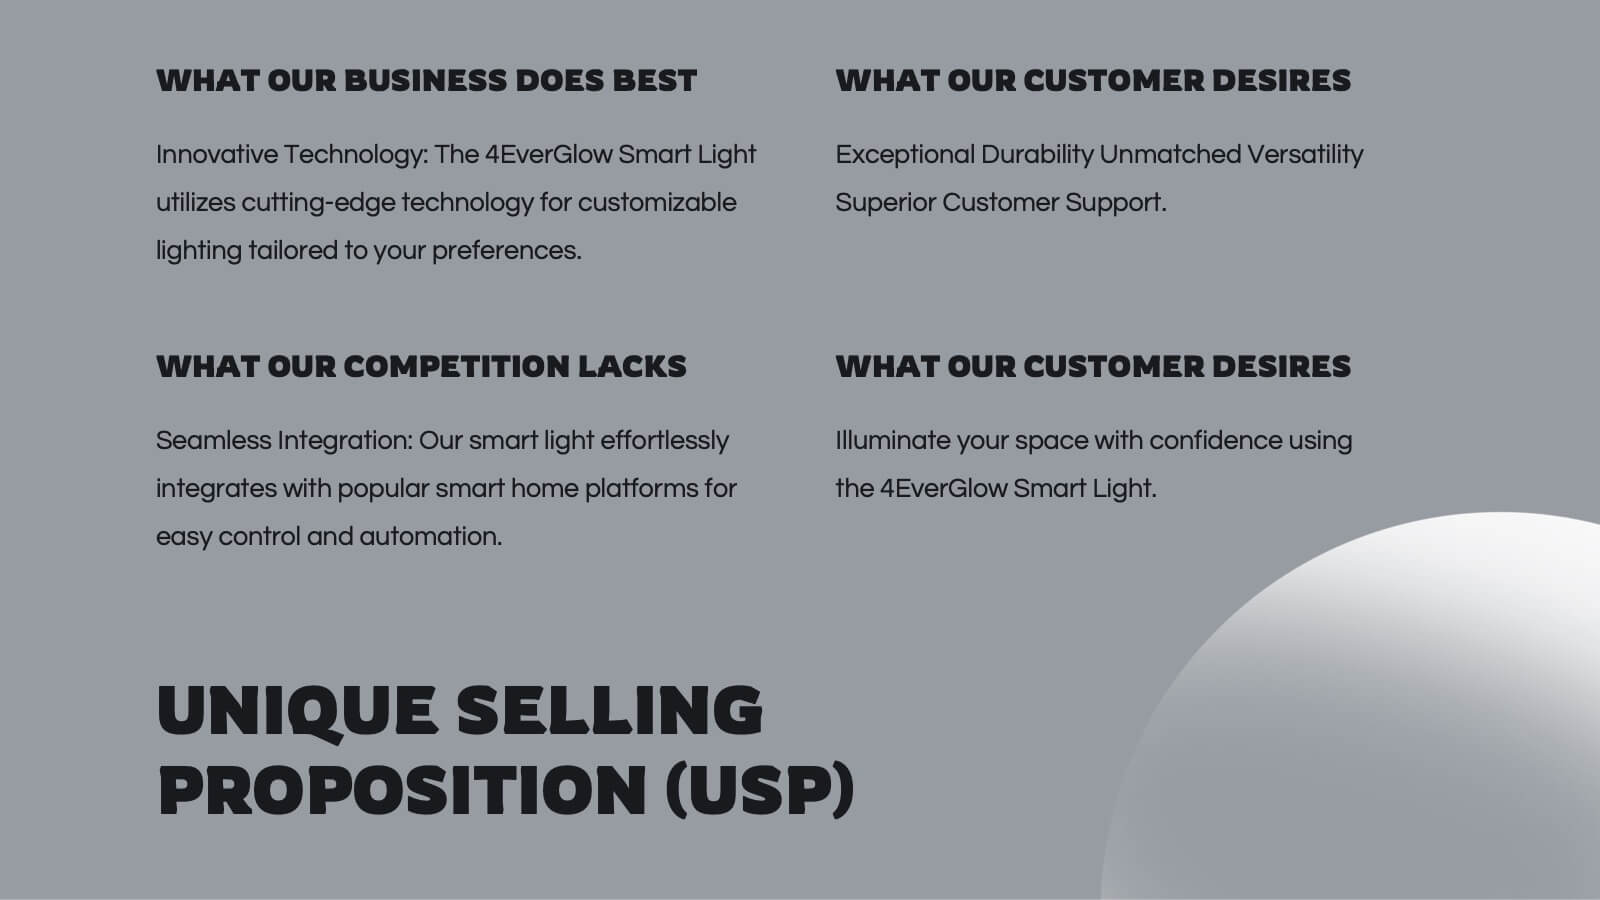
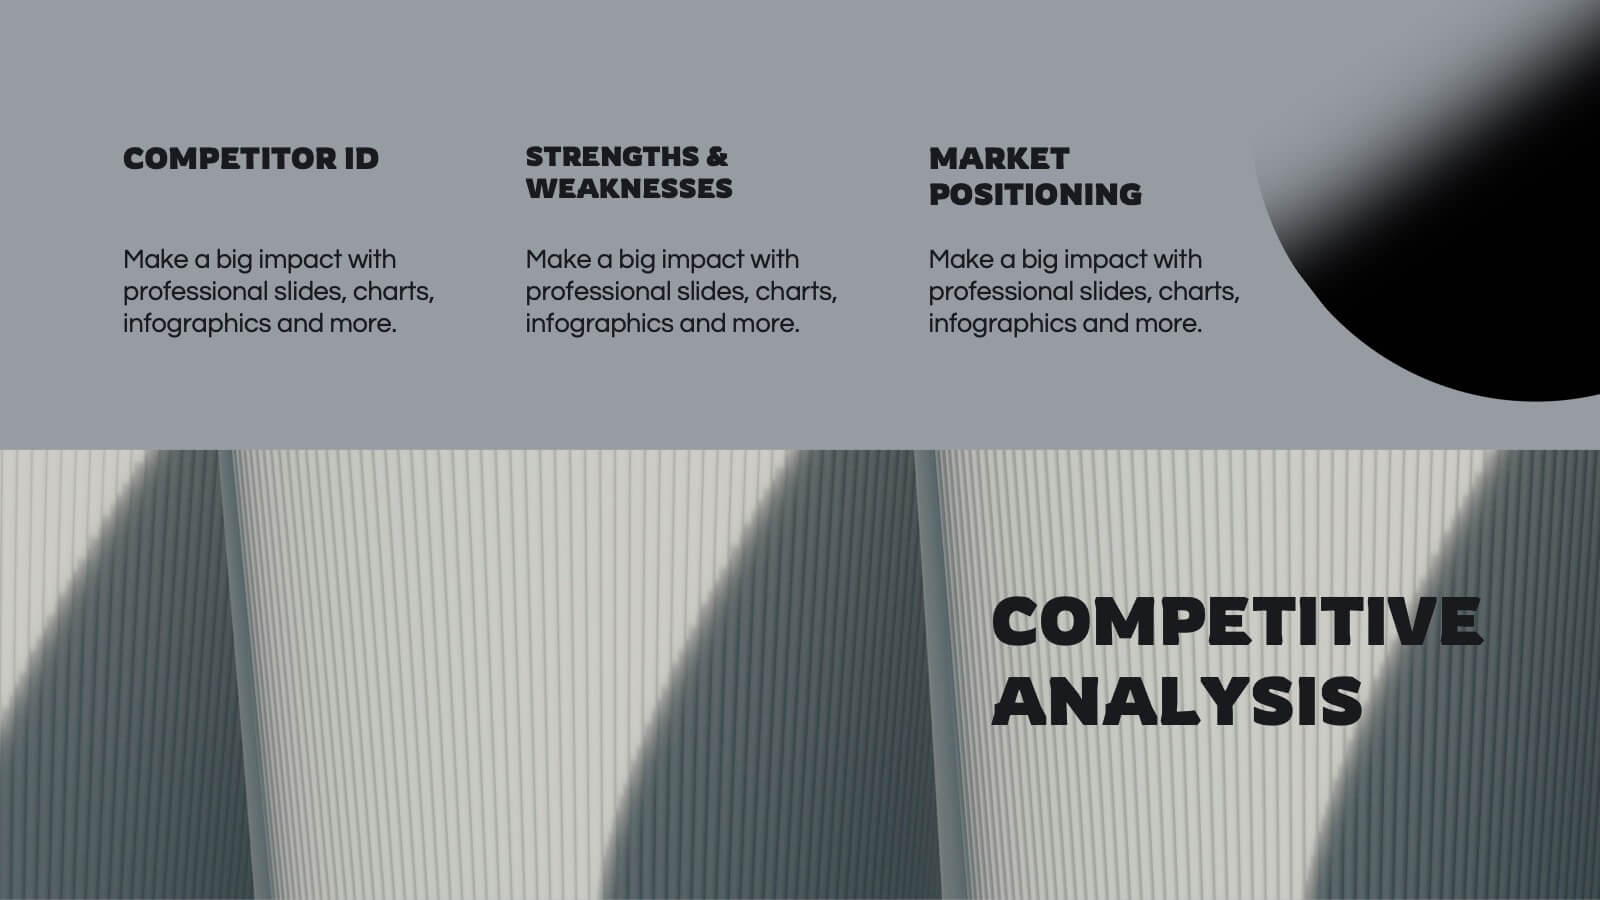
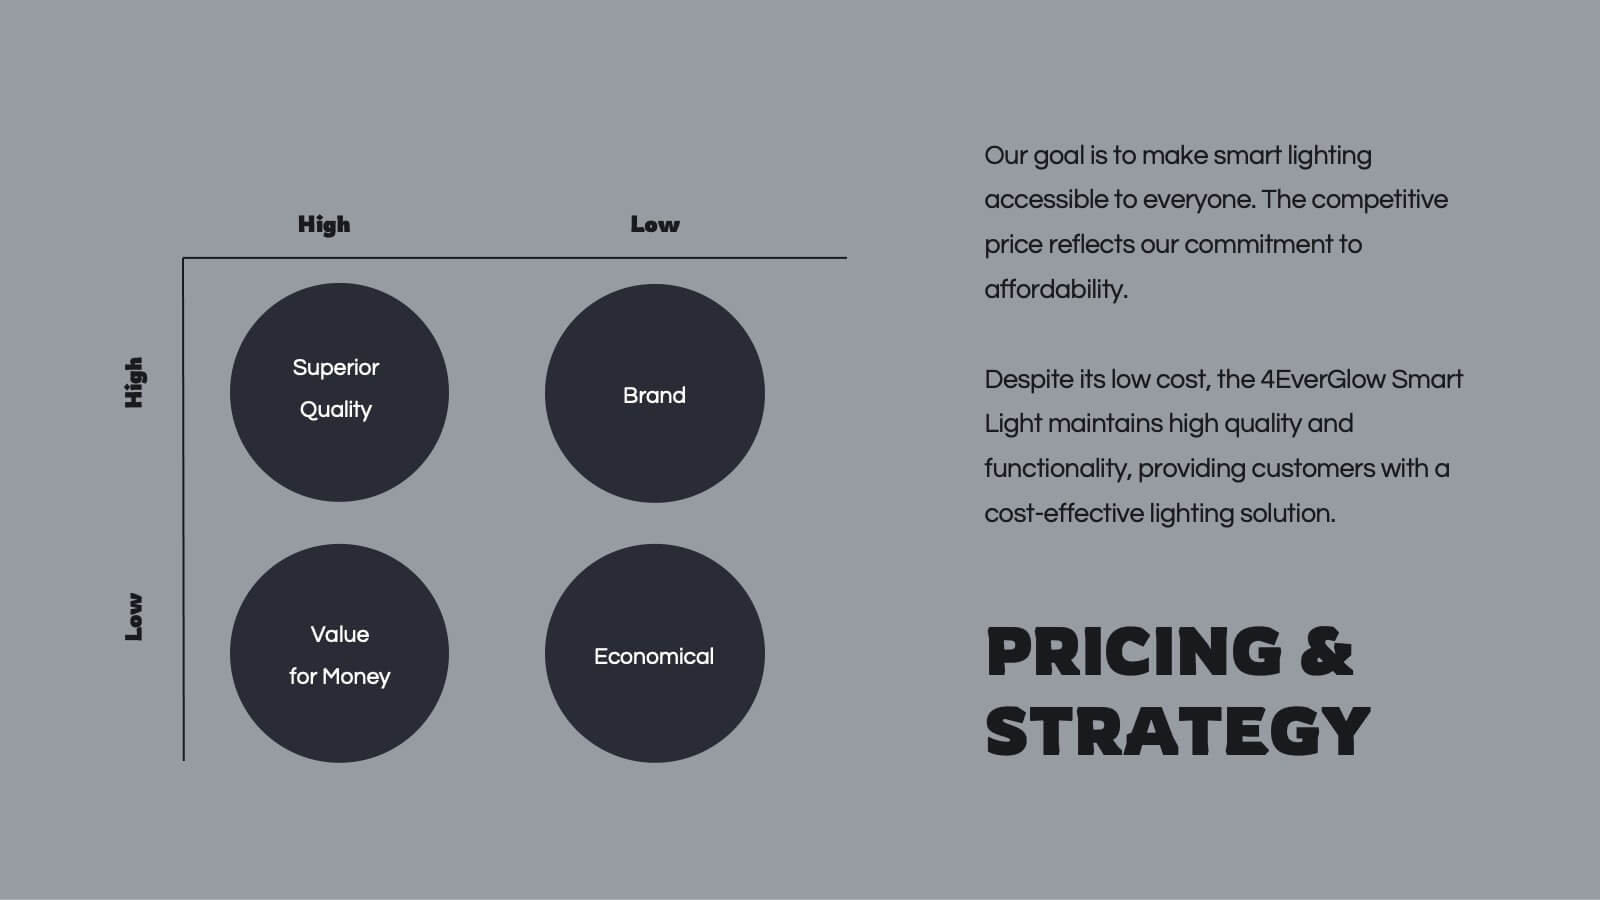
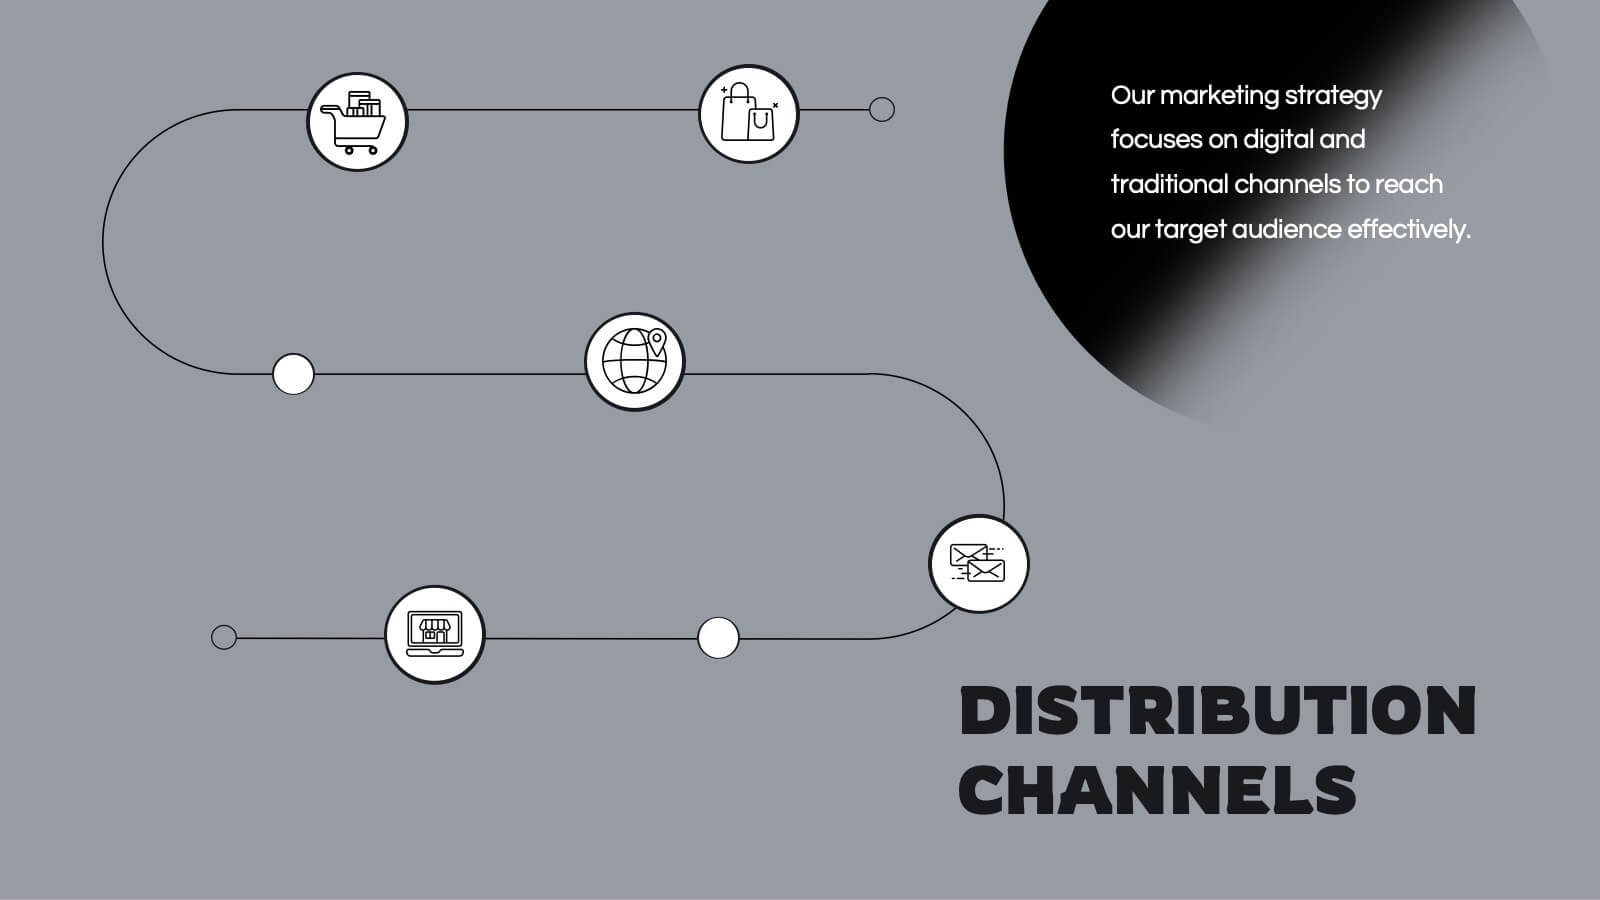
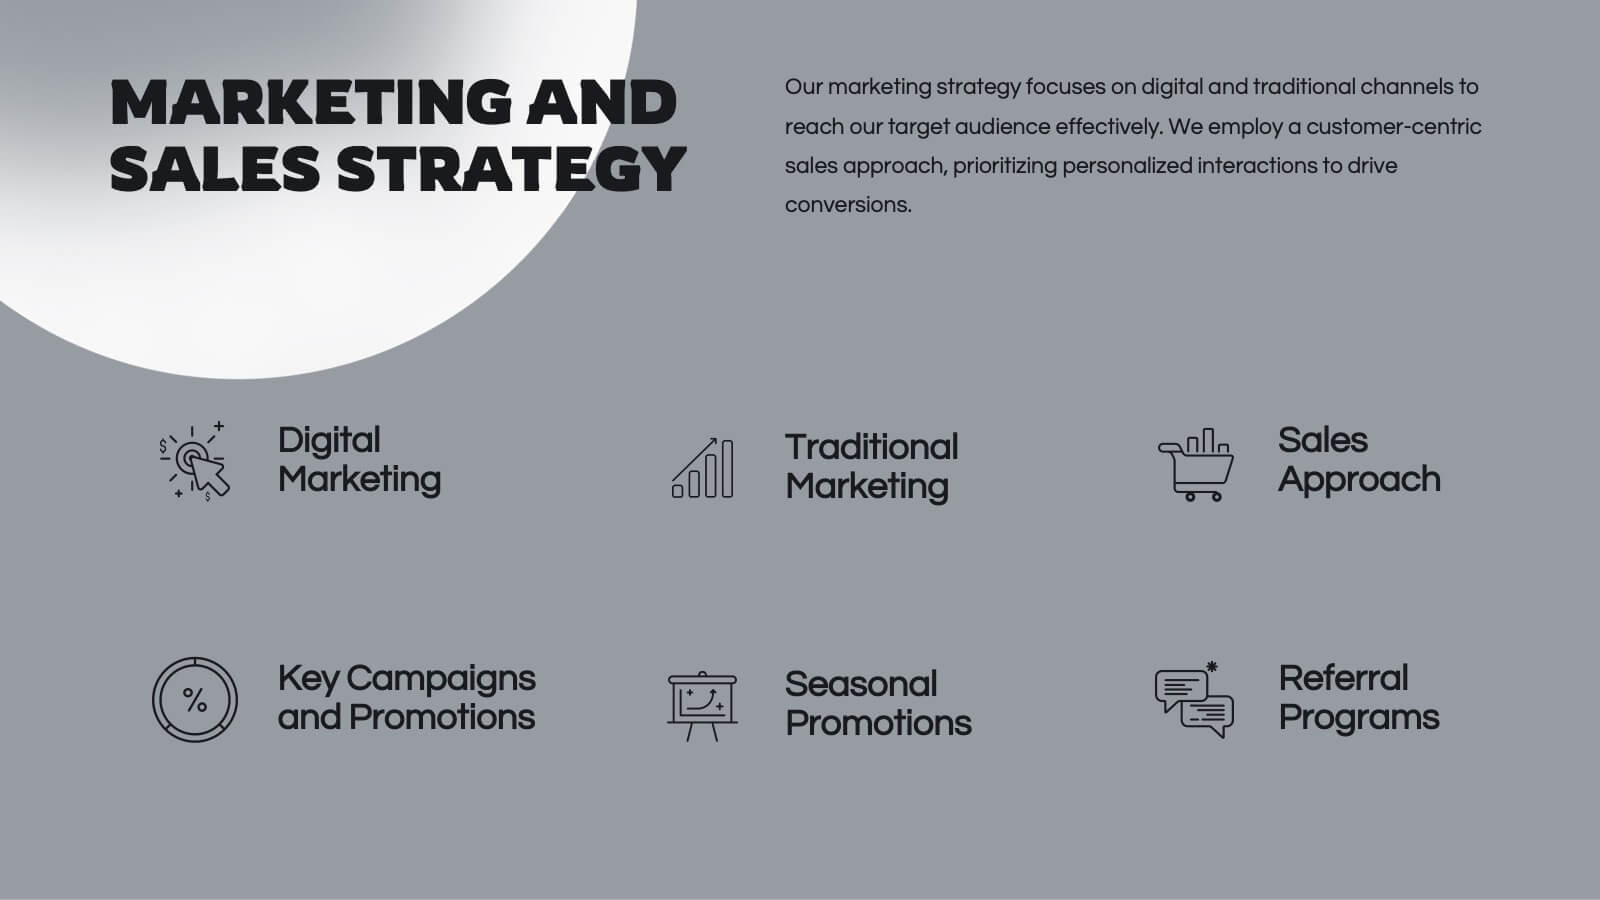
Hydra Product Launch Presentation
Unveiling your latest product has never been easier or more captivating! This comprehensive presentation template covers every aspect of your product's journey—from launch to competitive analysis. Engage your audience with detailed slides on features, target analysis, and pricing strategy. Seamlessly compatible with PowerPoint, Keynote, and Google Slides for maximum flexibility and impact.


5 diapositivas
Marketing Concepts Infographics
Marketing Concepts refer to the various strategies and philosophies that guide the marketing efforts of businesses and organizations. Our marketing concept infographics are visual representations of the different marketing concepts and strategies that businesses use to promote their products or services. These infographics can cover a wide range of marketing topics, including target audience, product positioning, branding, advertising, and video marketing. The purpose of these infographics is to provide a easy-to-understand overview of key marketing concepts that businesses can use to drive sales and increase brand awareness.


7 diapositivas
Customer Loyalty Program Infographic Presentation
Introducing our new customer loyalty program infographics template, the perfect tool for any business looking to boost customer engagement and loyalty! It's easy for you to create an engaging and effective presentation with these Infographics. With our template, you can add a touch of creativity to your presentation with a fun color scheme and infographic visuals with editable text. Whether you're presenting customer rewards or loyalty program benefits, our template will help you communicate your ideas in a clear and engaging way. So why wait? Start boosting your customer engagement and loyalty today with our amazing template!


4 diapositivas
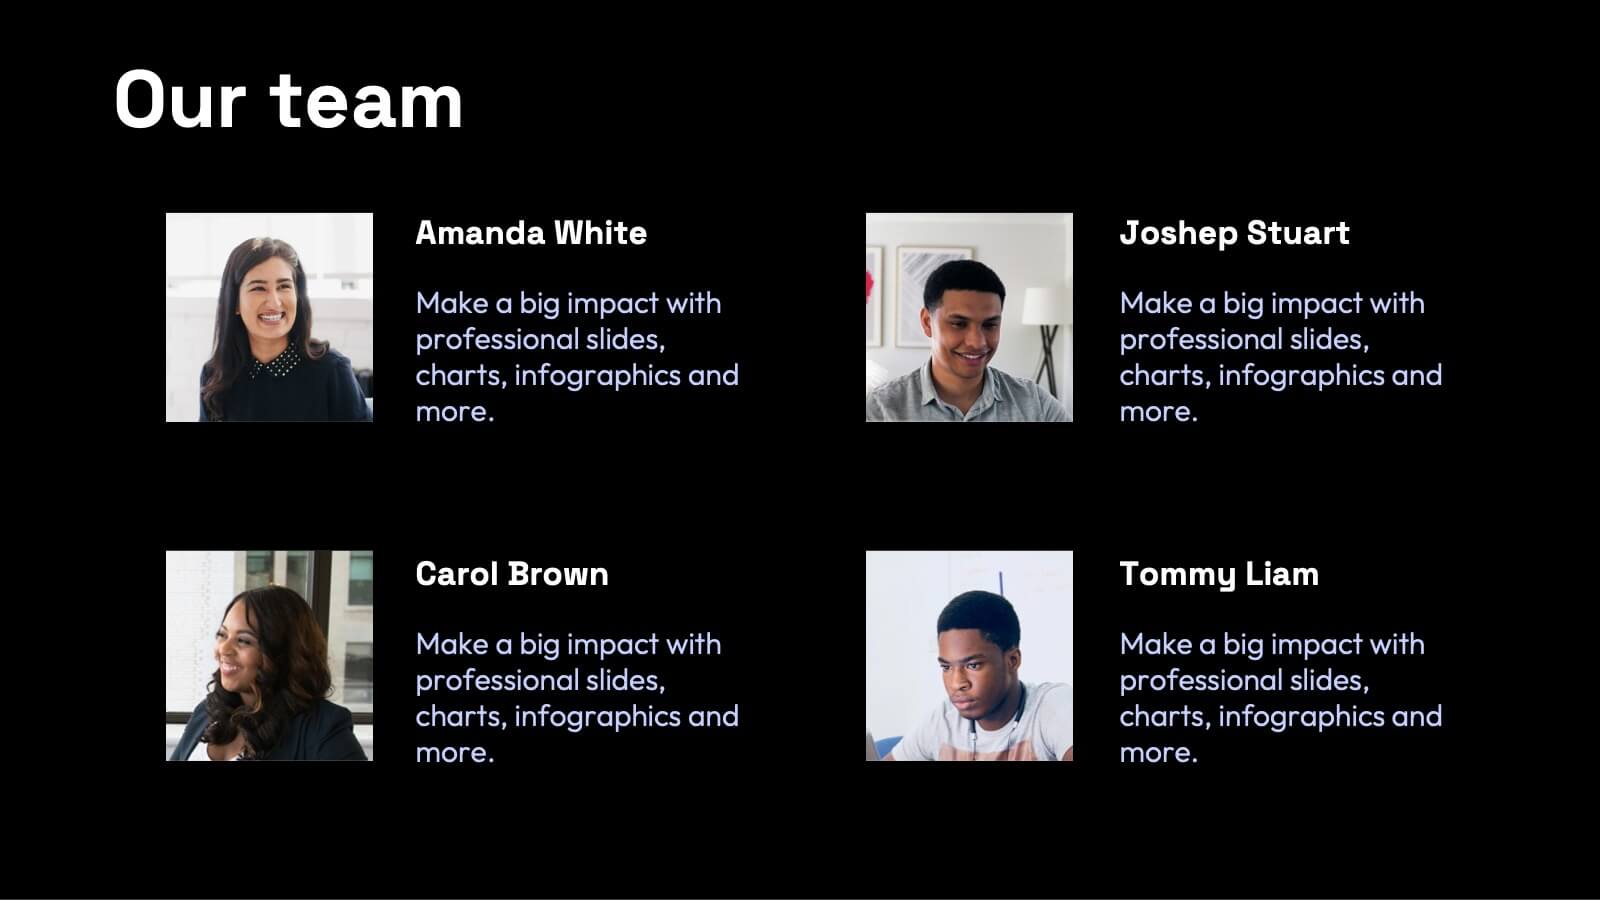
Design and Project Work Samples Presentation
Showcase your creative projects with this visually structured layout. Featuring a bold title area and three image slots for key works, it’s perfect for portfolios, proposals, or pitch decks. Fully editable in PowerPoint, Keynote, and Google Slides to suit your brand and project presentation needs.


5 diapositivas
Decision Matrix with Harvey Balls Presentation
Make complex decisions look simple and professional with this clean, data-driven presentation. Ideal for comparing options, evaluating strategies, or scoring alternatives, it visualizes information clearly using Harvey Balls for quick insights. Fully editable and compatible with PowerPoint, Keynote, and Google Slides for effortless customization and impactful presentations.


7 diapositivas
Design Mockup Infographic
Present your creative projects with precision and style using this collection of design mockup templates. Each template is expertly crafted to showcase your graphic designs, digital art, or branding projects across multiple devices and settings, emphasizing both detail and context. Featuring sleek, modern layouts, these mockups integrate vibrant color schemes and dynamic typography to make your designs pop. Ideal for graphic designers, marketers, and creative agencies, these templates provide a professional setting for presenting web designs, app interfaces, and other digital products to clients and stakeholders. Customize these templates with ease, adding your own images and text to tailor the mockups to your specific project needs. Whether you're creating a portfolio, client presentation, or marketing materials, these mockups will help you display your work in the most effective and engaging way.


21 diapositivas
Vortexia Small Business Pitch Deck Presentation
Deliver an impressive pitch with a modern and sleek presentation template tailored for small businesses. Dive into critical aspects like team updates, current projects overview, and key achievements to showcase progress and potential. Address challenges and solutions in a structured way, while outlining departmental goals and performance metrics for transparency. The template includes slides for resource allocation, collaboration opportunities, and training and development strategies, ensuring a comprehensive narrative. Use the process improvement and feedback and suggestions sections to invite engagement and innovation. With fully editable slides, this template is compatible with PowerPoint, Google Slides, and Keynote, offering a polished and professional platform to highlight your business strengths and future plans. Perfect for entrepreneurs and small businesses ready to captivate stakeholders.


8 diapositivas
Eco-Friendly Business Practices Presentation
The "Eco-Friendly Business Practices" presentation template is thoughtfully designed to showcase sustainable business practices. Each section of the template features a labeled bin, representing different aspects or initiatives within a company's eco-friendly approach. The clear, colorful representations facilitate easy understanding and effective communication of key environmental strategies. This template is perfect for businesses looking to highlight their commitment to sustainability, discuss green policies, or outline specific recycling or waste reduction methods. It's especially useful for presentations aimed at stakeholders interested in corporate responsibility and environmental stewardship.

21 diapositivas
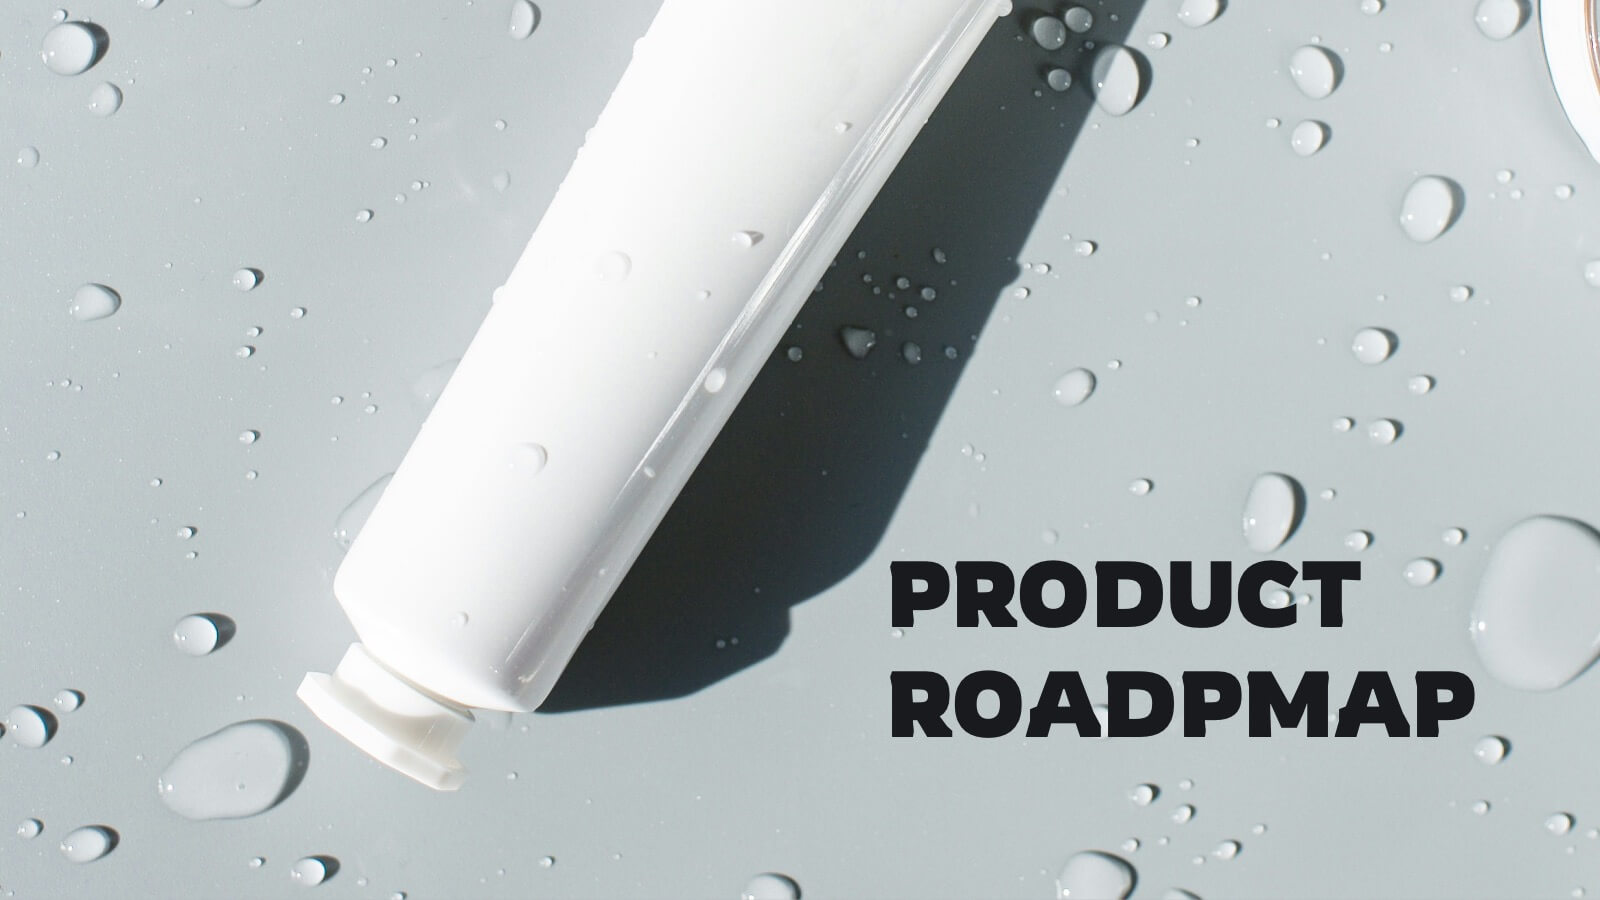
Spinel Product Strategy Report Presentation
Take your product strategy to the next level with this polished, spinel-inspired presentation! Designed to effectively communicate your product's goals, market analysis, and strategy roadmap, this template is both visually striking and easy to navigate. Its sharp design ensures a professional touch. Compatible with PowerPoint, Keynote, and Google Slides.


5 diapositivas
Brain Chemistry Infographics
Brain chemistry refers to the complex interplay of chemicals, also known as neurotransmitters, that are responsible for transmitting signals within the brain. These infographic templates are designed to illustrate the intricate workings of brain chemistry. They aim to explain complex concepts in a clear and engaging way, making it suitable for educational settings, psychology courses, neuroscience presentations, or any context where understanding brain chemistry is essential. These templates set the foundation for exploring various aspects of brain chemistry. Colorful illustrations and icons help visualize the neurotransmitters and their impact.


7 diapositivas
Simple Table of Content Slide Presentation
A clean, structured layout makes it easy to guide your audience through key sections with clarity and flow. This simple table of content slide helps you introduce topics, outline ideas, and set expectations in a polished, professional way. Fully compatible with PowerPoint, Keynote, and Google Slides.


3 diapositivas
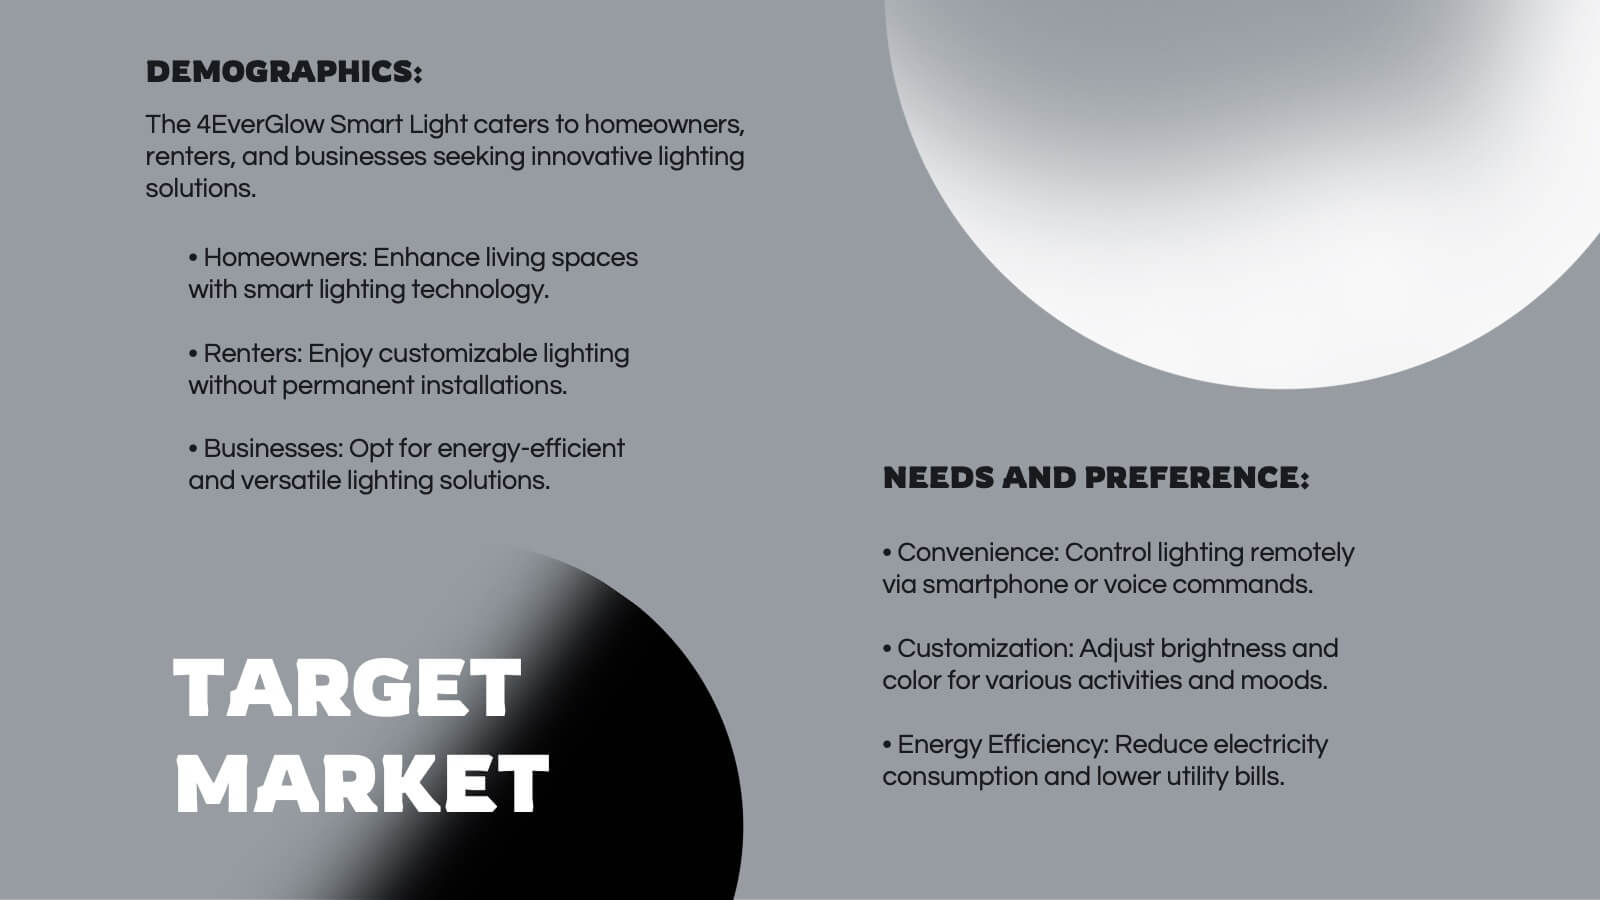
Persona Mapping for Target Audience Presentation
Get clear on who you're speaking to with this visual persona mapping slide. Ideal for marketing plans, customer research, or segmentation strategies, this layout helps you define and compare target audience types with clean icons and text space. Fully editable and works with PowerPoint, Keynote, and Google Slides.