


Características


¿Tienes alguna pregunta?
Recomendar


7 diapositivas
Human Resources Infographic Presentation Template
A human resources infographic is data related to the management of people in an organization. This template can be used to cover various HR-related topics, such as recruitment and selection, employee benefits, performance management, and career development. The purpose of our HR infographic is to communicate information in a clear and engaging way, making complex HR concepts and processes easier to understand. This well-designed infographic template can help you effectively communicate HR information, improve engagement and understanding, and support the overall success of your presentation.


6 diapositivas
Structured Table of Content Layout Presentation
Organize your presentation with clarity using this Structured Table of Content Layout. Ideal for overviews, agendas, or segmented discussions, this template features clean typography, icons, and a photo section. Fully editable in PowerPoint, Keynote, and Google Slides—perfect for professional reports, project briefs, or pitch decks that need clear navigation.


6 diapositivas
Vision Statement Development Guide
Craft a powerful company vision with this eye-catching layout—literally. Centered around a bold visual icon, this slide helps you organize six core ideas or values that shape your future direction. It’s perfect for strategy workshops, leadership meetings, or branding sessions. Fully compatible with PowerPoint, Keynote, and Google Slides.


6 diapositivas
Financial Trading and Stock Performance Presentation
Explore market dynamics with the "Financial Trading and Stock Performance" presentation template. Perfect for finance professionals, these slides offer a visual analysis of stock trends over the years. Featuring bar graphs and gauge charts for annual comparison, it's designed for impactful presentations. These templates are compatible with PowerPoint, Keynote, and Google Slides, enhancing their accessibility across different platforms.


23 diapositivas
Bracken Small Business Pitch Deck Presentation
This clean and professional presentation template is perfect for showcasing your business ideas, market opportunities, and growth strategies. It includes essential sections such as company background, SWOT analysis, financial performance, marketing plan, and revenue models. Key highlights like competitive advantages, investment opportunities, and milestones ensure a comprehensive and organized pitch to captivate investors and stakeholders. Fully customizable and compatible with PowerPoint, Keynote, and Google Slides.


5 diapositivas
Demographic and Psychographic Segments Presentation
Break down your audience with clarity using the Demographic and Psychographic Segments Presentation. This slide is ideal for showcasing four key consumer dimensions through a centered circular layout and quadrant icons. Perfect for marketing campaigns, branding strategies, and audience targeting. Fully editable in Canva, PowerPoint, Keynote, or Google Slides.


7 diapositivas
Business Model Canvas Value Infographic
The business model canvas is a strategic management tool that provides a visual framework for developing, describing, and analyzing a business model. Prepare for a dynamic voyage through business success with our business model canvas value infographic. This is not just a blueprint; it's a vivid map to unlock the value potential in your business model. Navigate through the core elements, envision your venture, and redefine success. Compatible with Powerpoint, Keynote, and Google Slides. Showcase how a strong customer relationships is key. With this infographic illustrate the strategies to keep your audience coming back for more!


5 diapositivas
Employee Onboarding Training Roadmap Presentation
Visualize your training journey with the Employee Onboarding Training Roadmap Presentation. This layout uses a road-style timeline with trucks to represent each step of the onboarding process—perfect for outlining key milestones, training modules, or departmental introductions. Fully editable in PowerPoint, Keynote, Google Slides, or Canva.


26 diapositivas
Olympus Brand Guidelines Proposal Presentation
The Olympus Brand Identity Presentation is a sleek and modern template designed to help you showcase your brand's unique identity and strategy. This template kicks off with a clean and engaging slide that sets the stage for the entire presentation. It guides you through various aspects of brand identity, including brand components, target audience, and unique selling proposition (USP). The template also dives into brand positioning, strategy, and guidelines, ensuring that your brand's message is consistent and compelling. Additionally, it covers brand experience, recognition, and recall, offering a comprehensive view of your brand's impact. With dedicated sections for performance metrics, brand success stories, and future development, this template provides a complete toolkit for effectively communicating your brand's strengths and vision. Fully compatible with PowerPoint, Keynote, and Google Slides, the Olympus template is perfect for any brand-focused presentation.


6 diapositivas
Roadmap Milestones Infographic
Chart your project's progress with our Roadmap Milestones Infographic, optimized for Powerpoint, Google Slides, and Keynote. This infographic is expertly designed to visualize the journey of your project from conception to completion. The roadmap's layout is intuitive and user-friendly, making it simple to customize with your specific project stages, timeframes, and critical tasks. Whether you're outlining a new business initiative, or planning an event, this template helps you lay out a path to success that your team can follow. With this Roadmap infographic, you can keep stakeholders informed and your team aligned on the project's goals and progress.
5 diapositivas
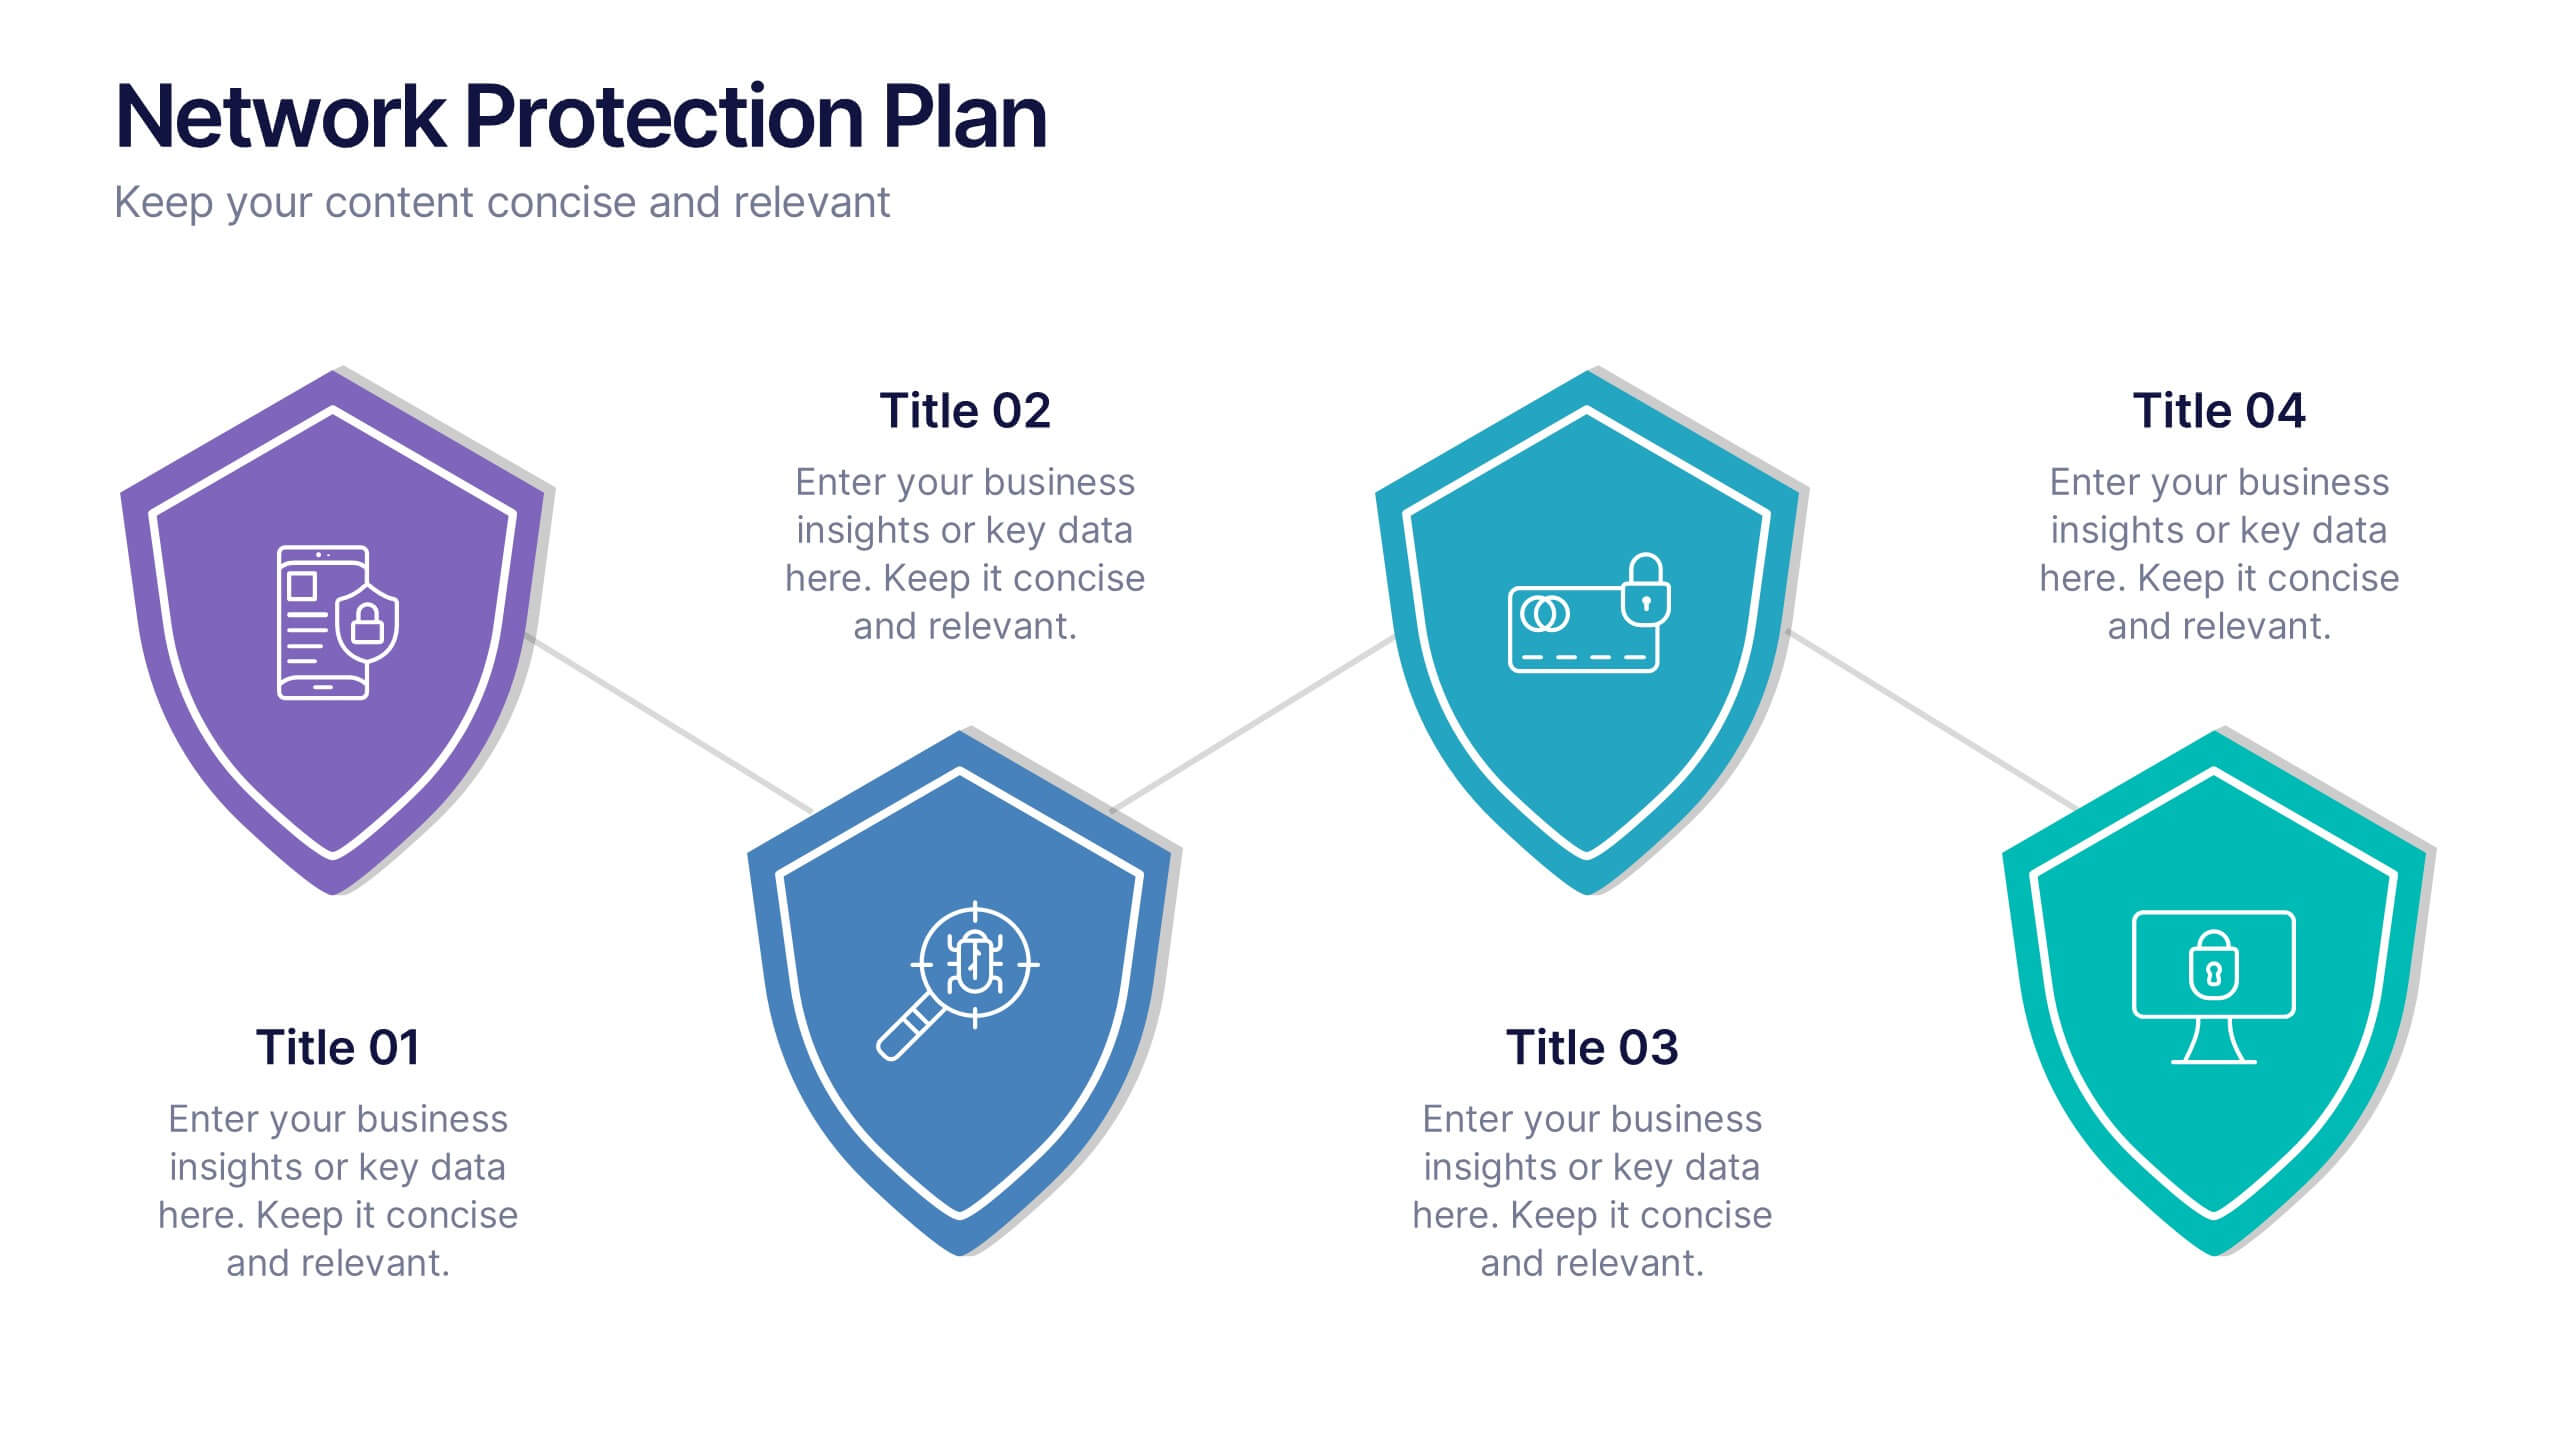
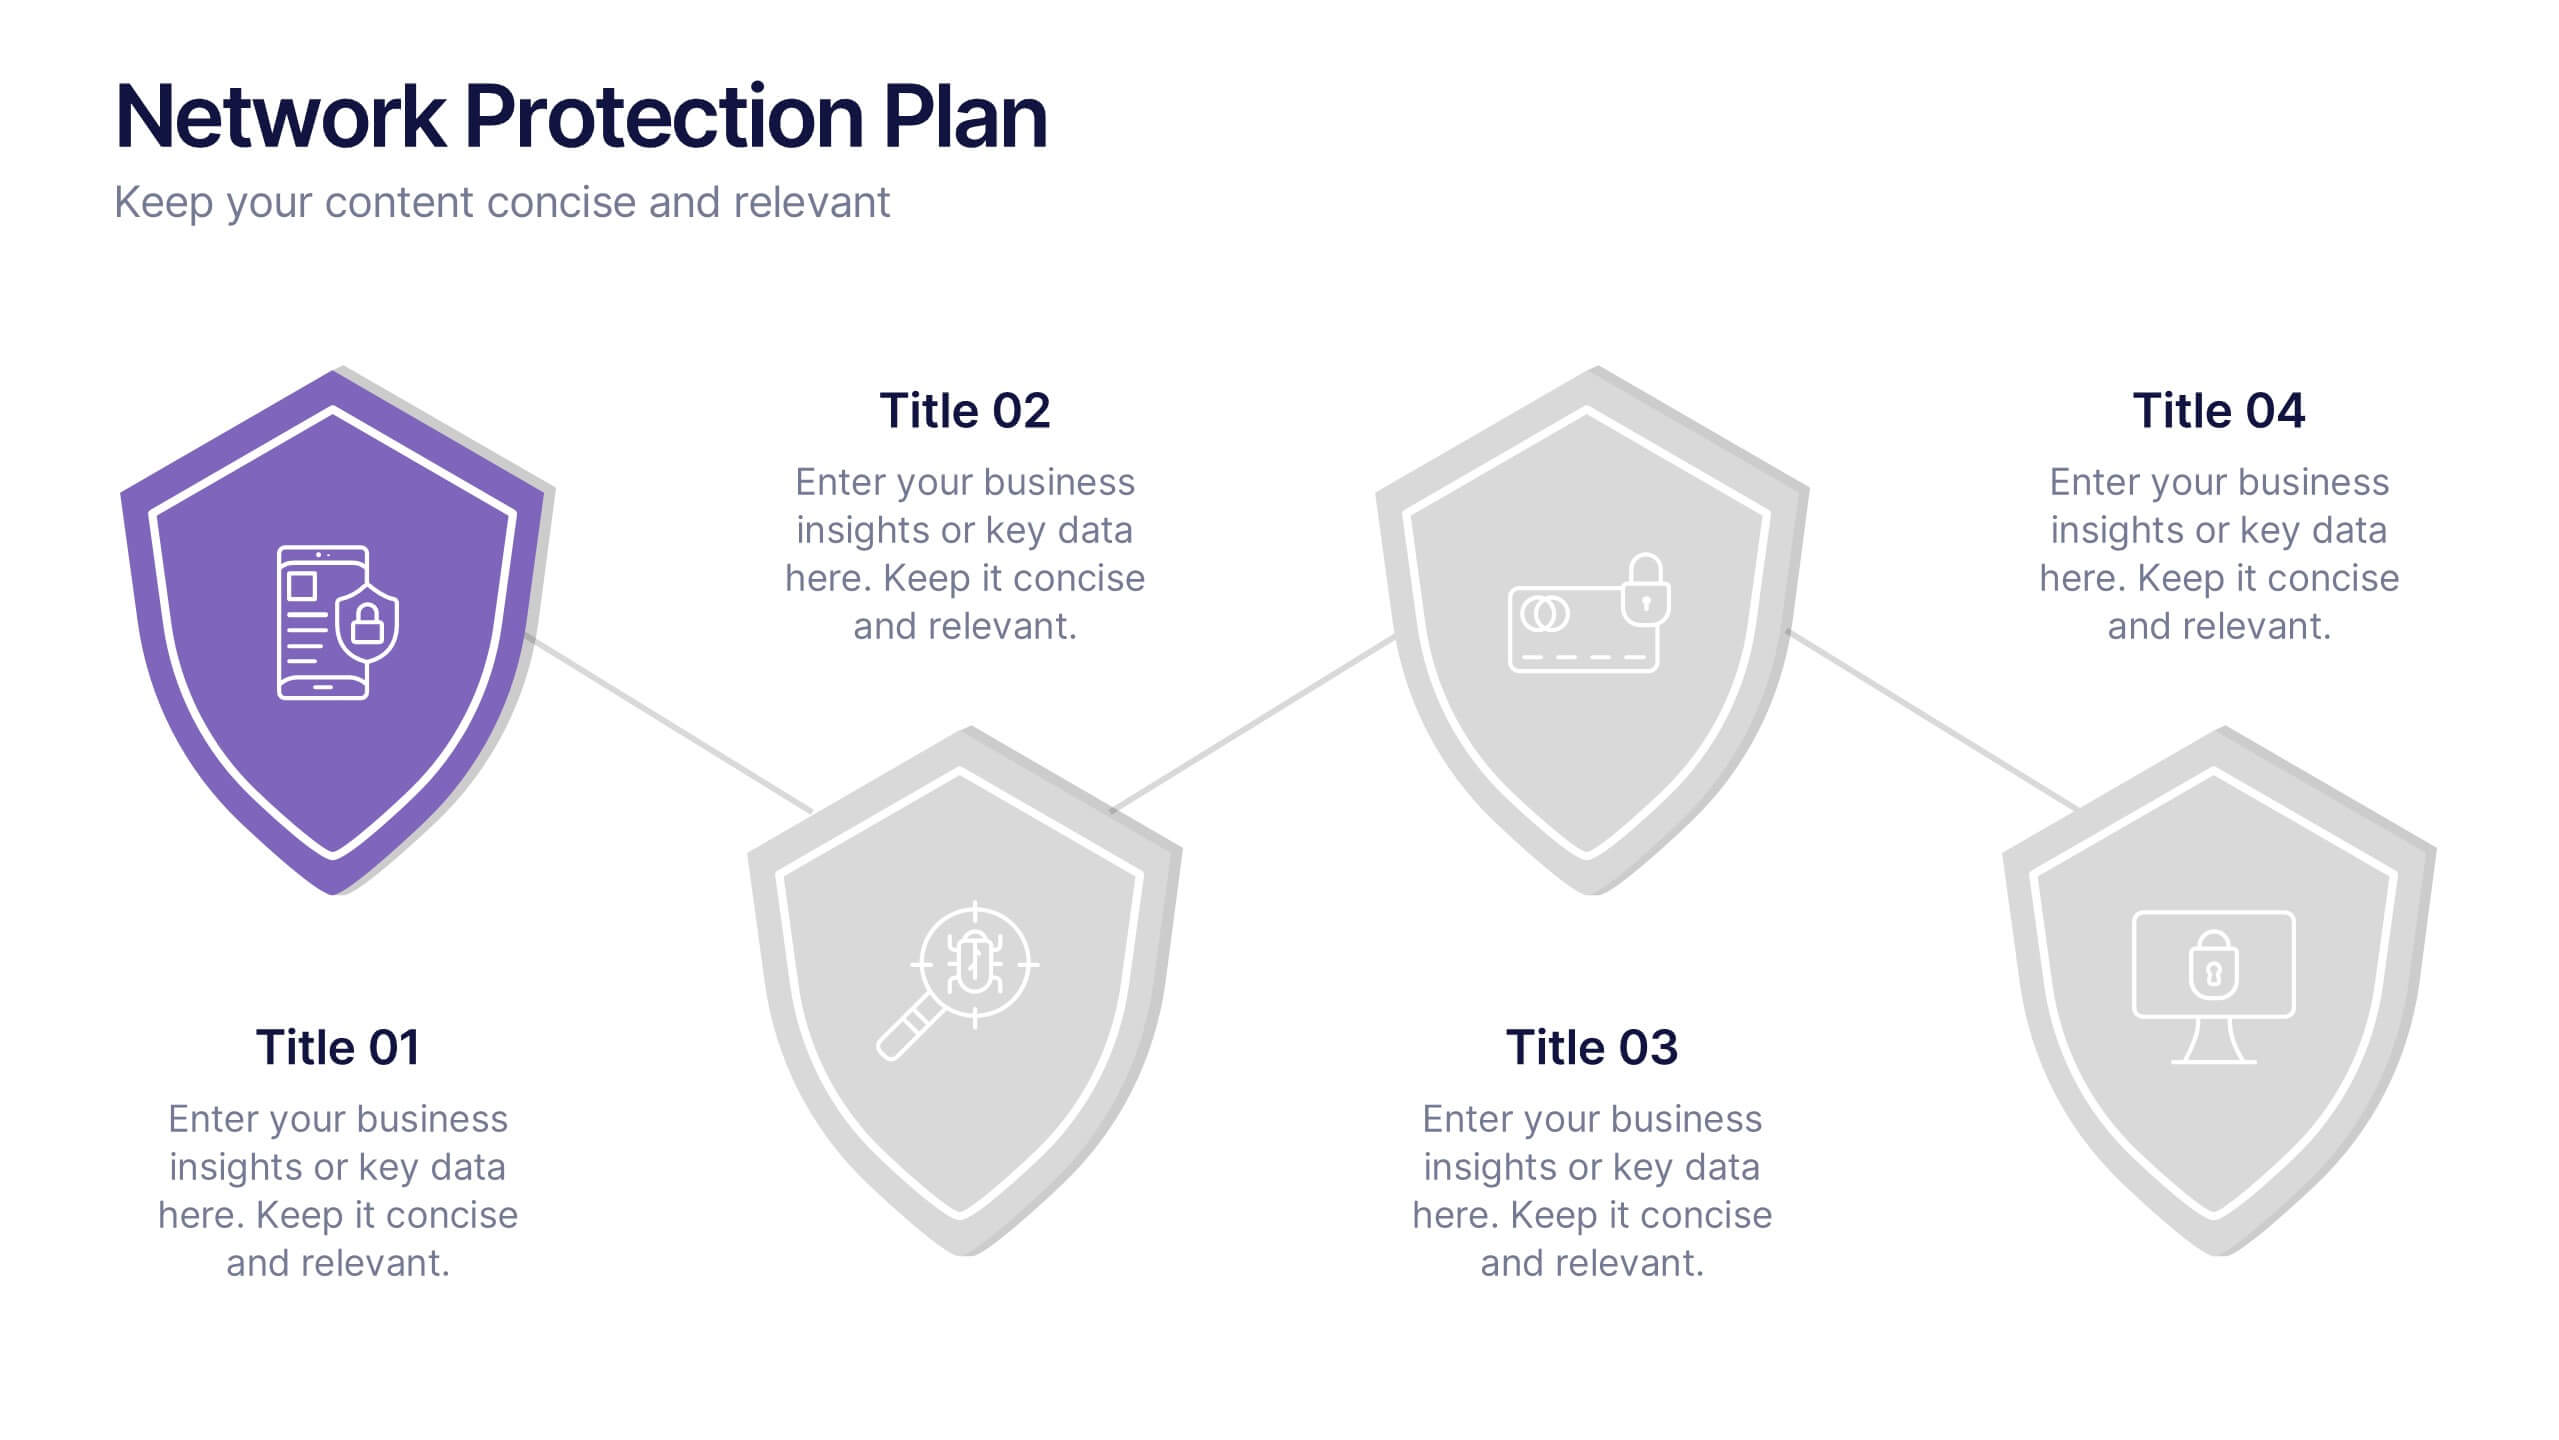
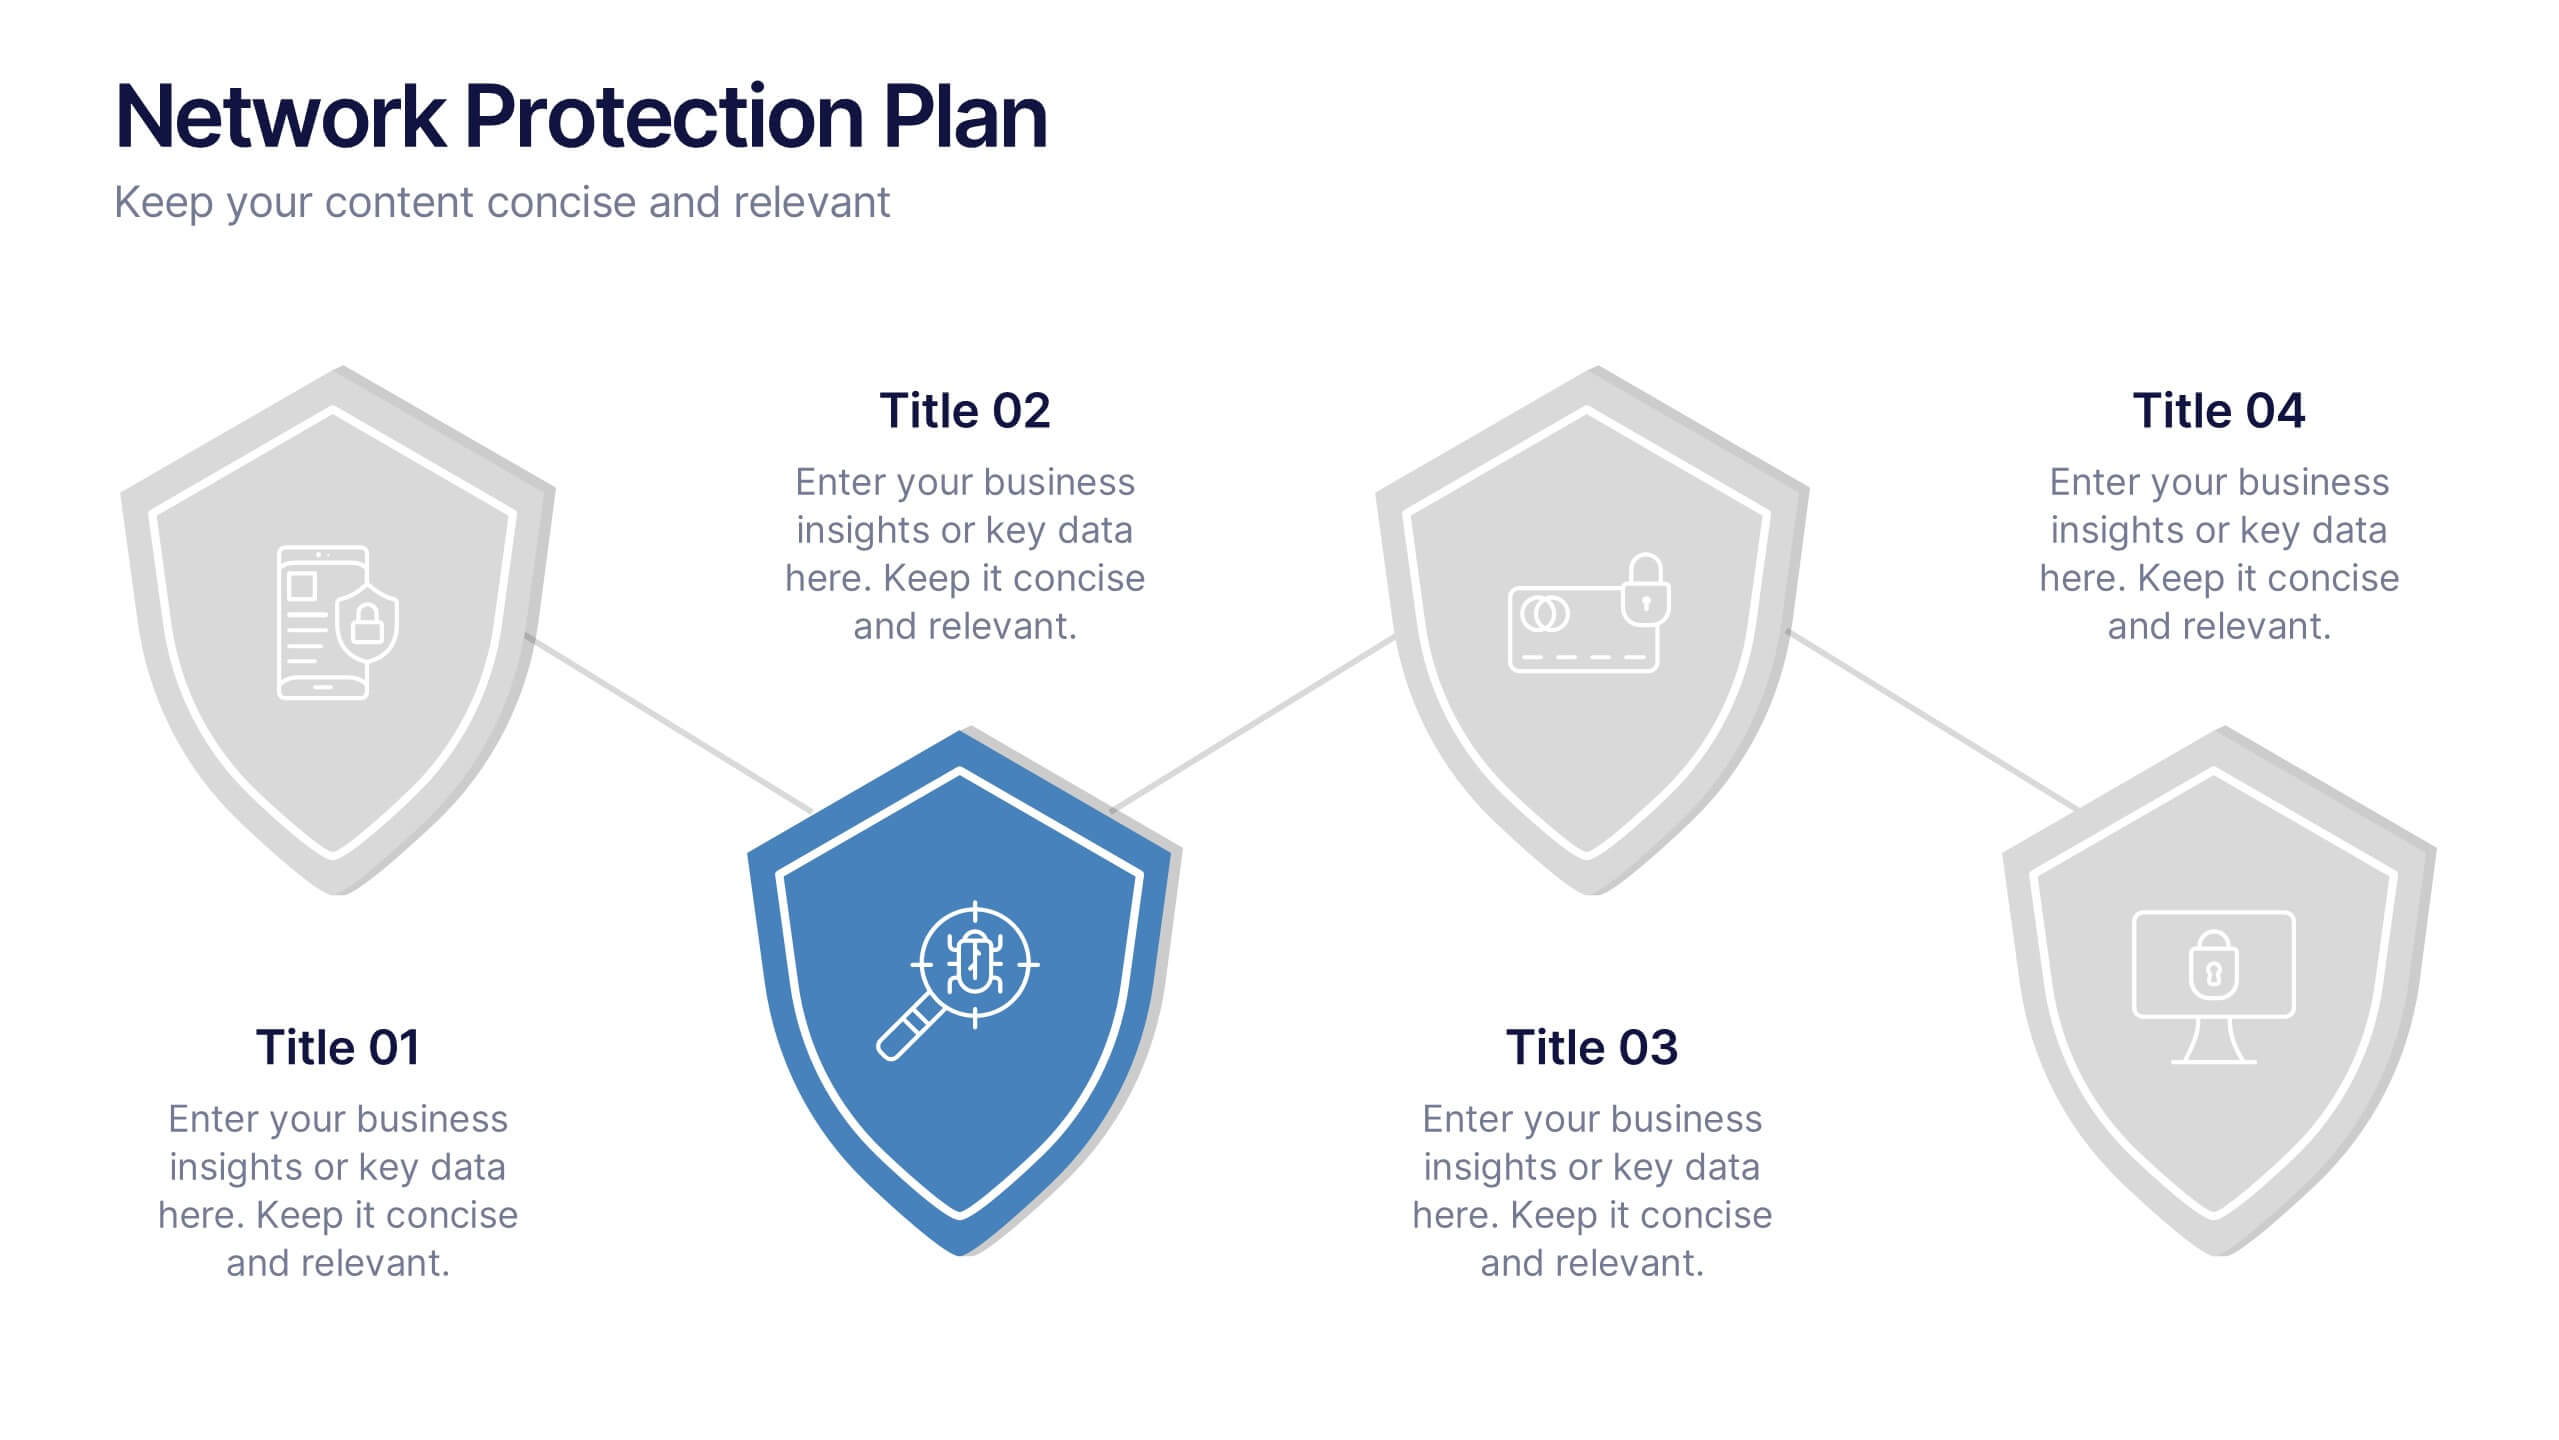
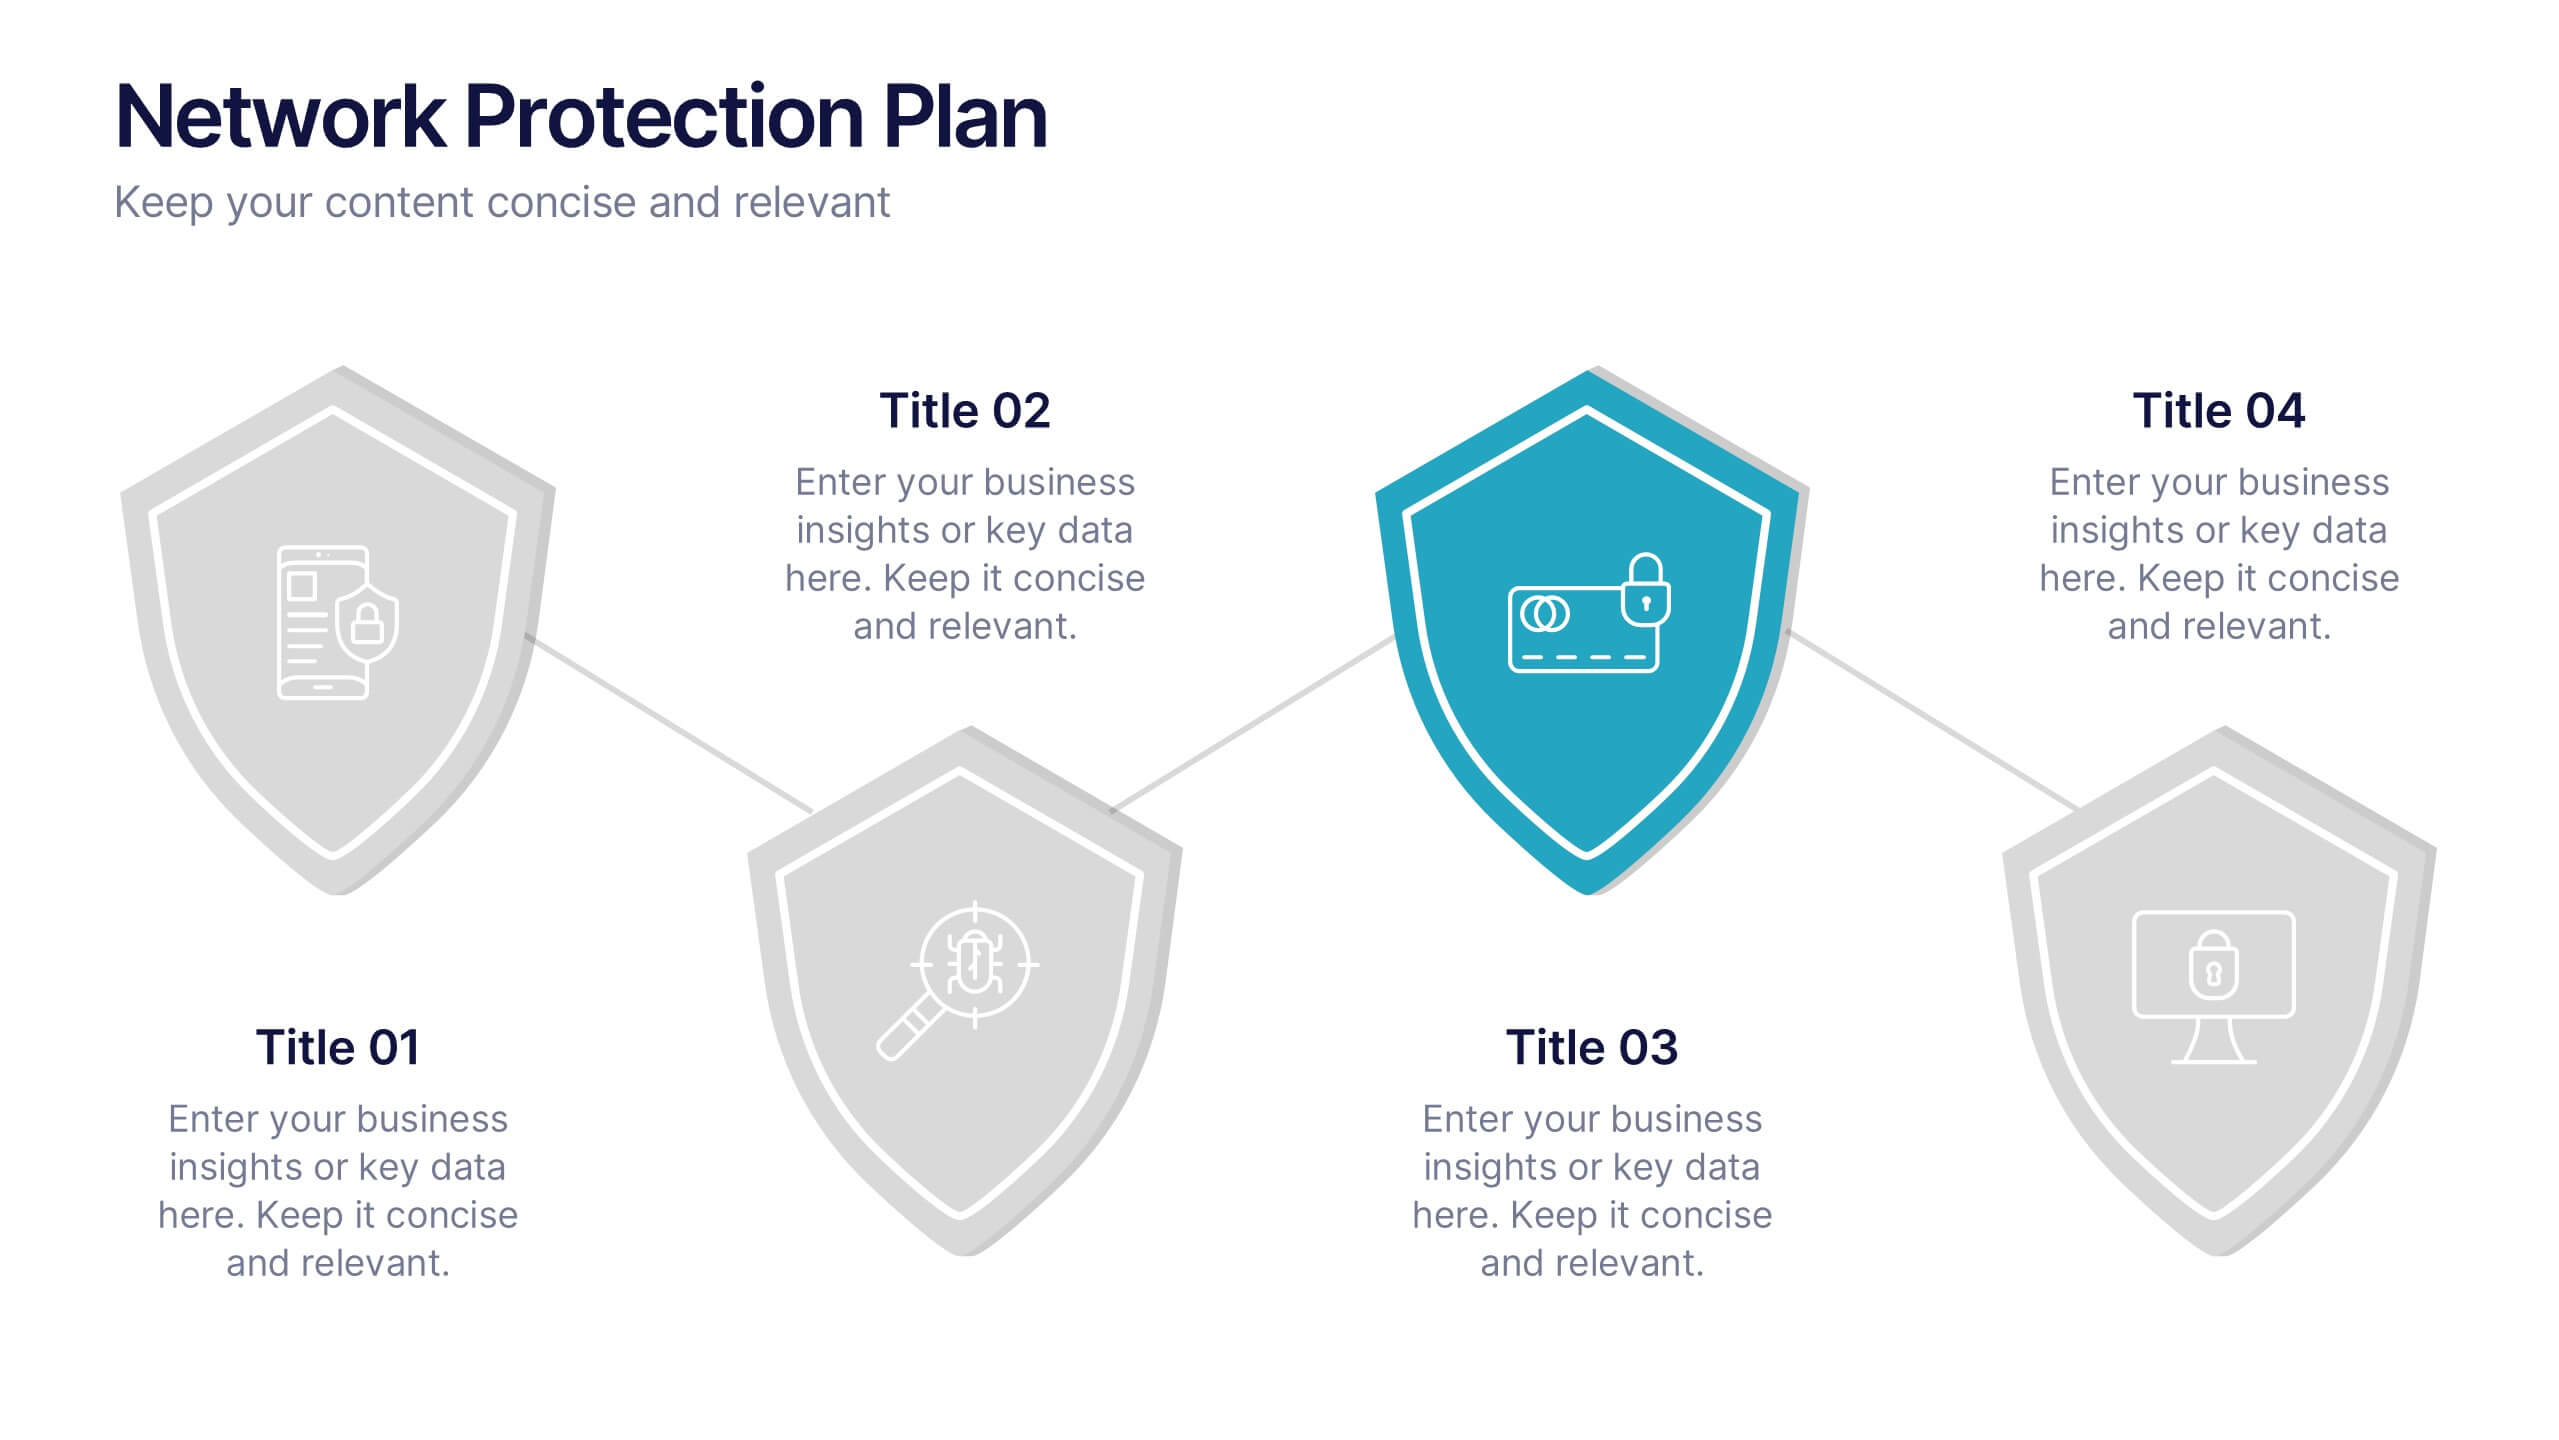
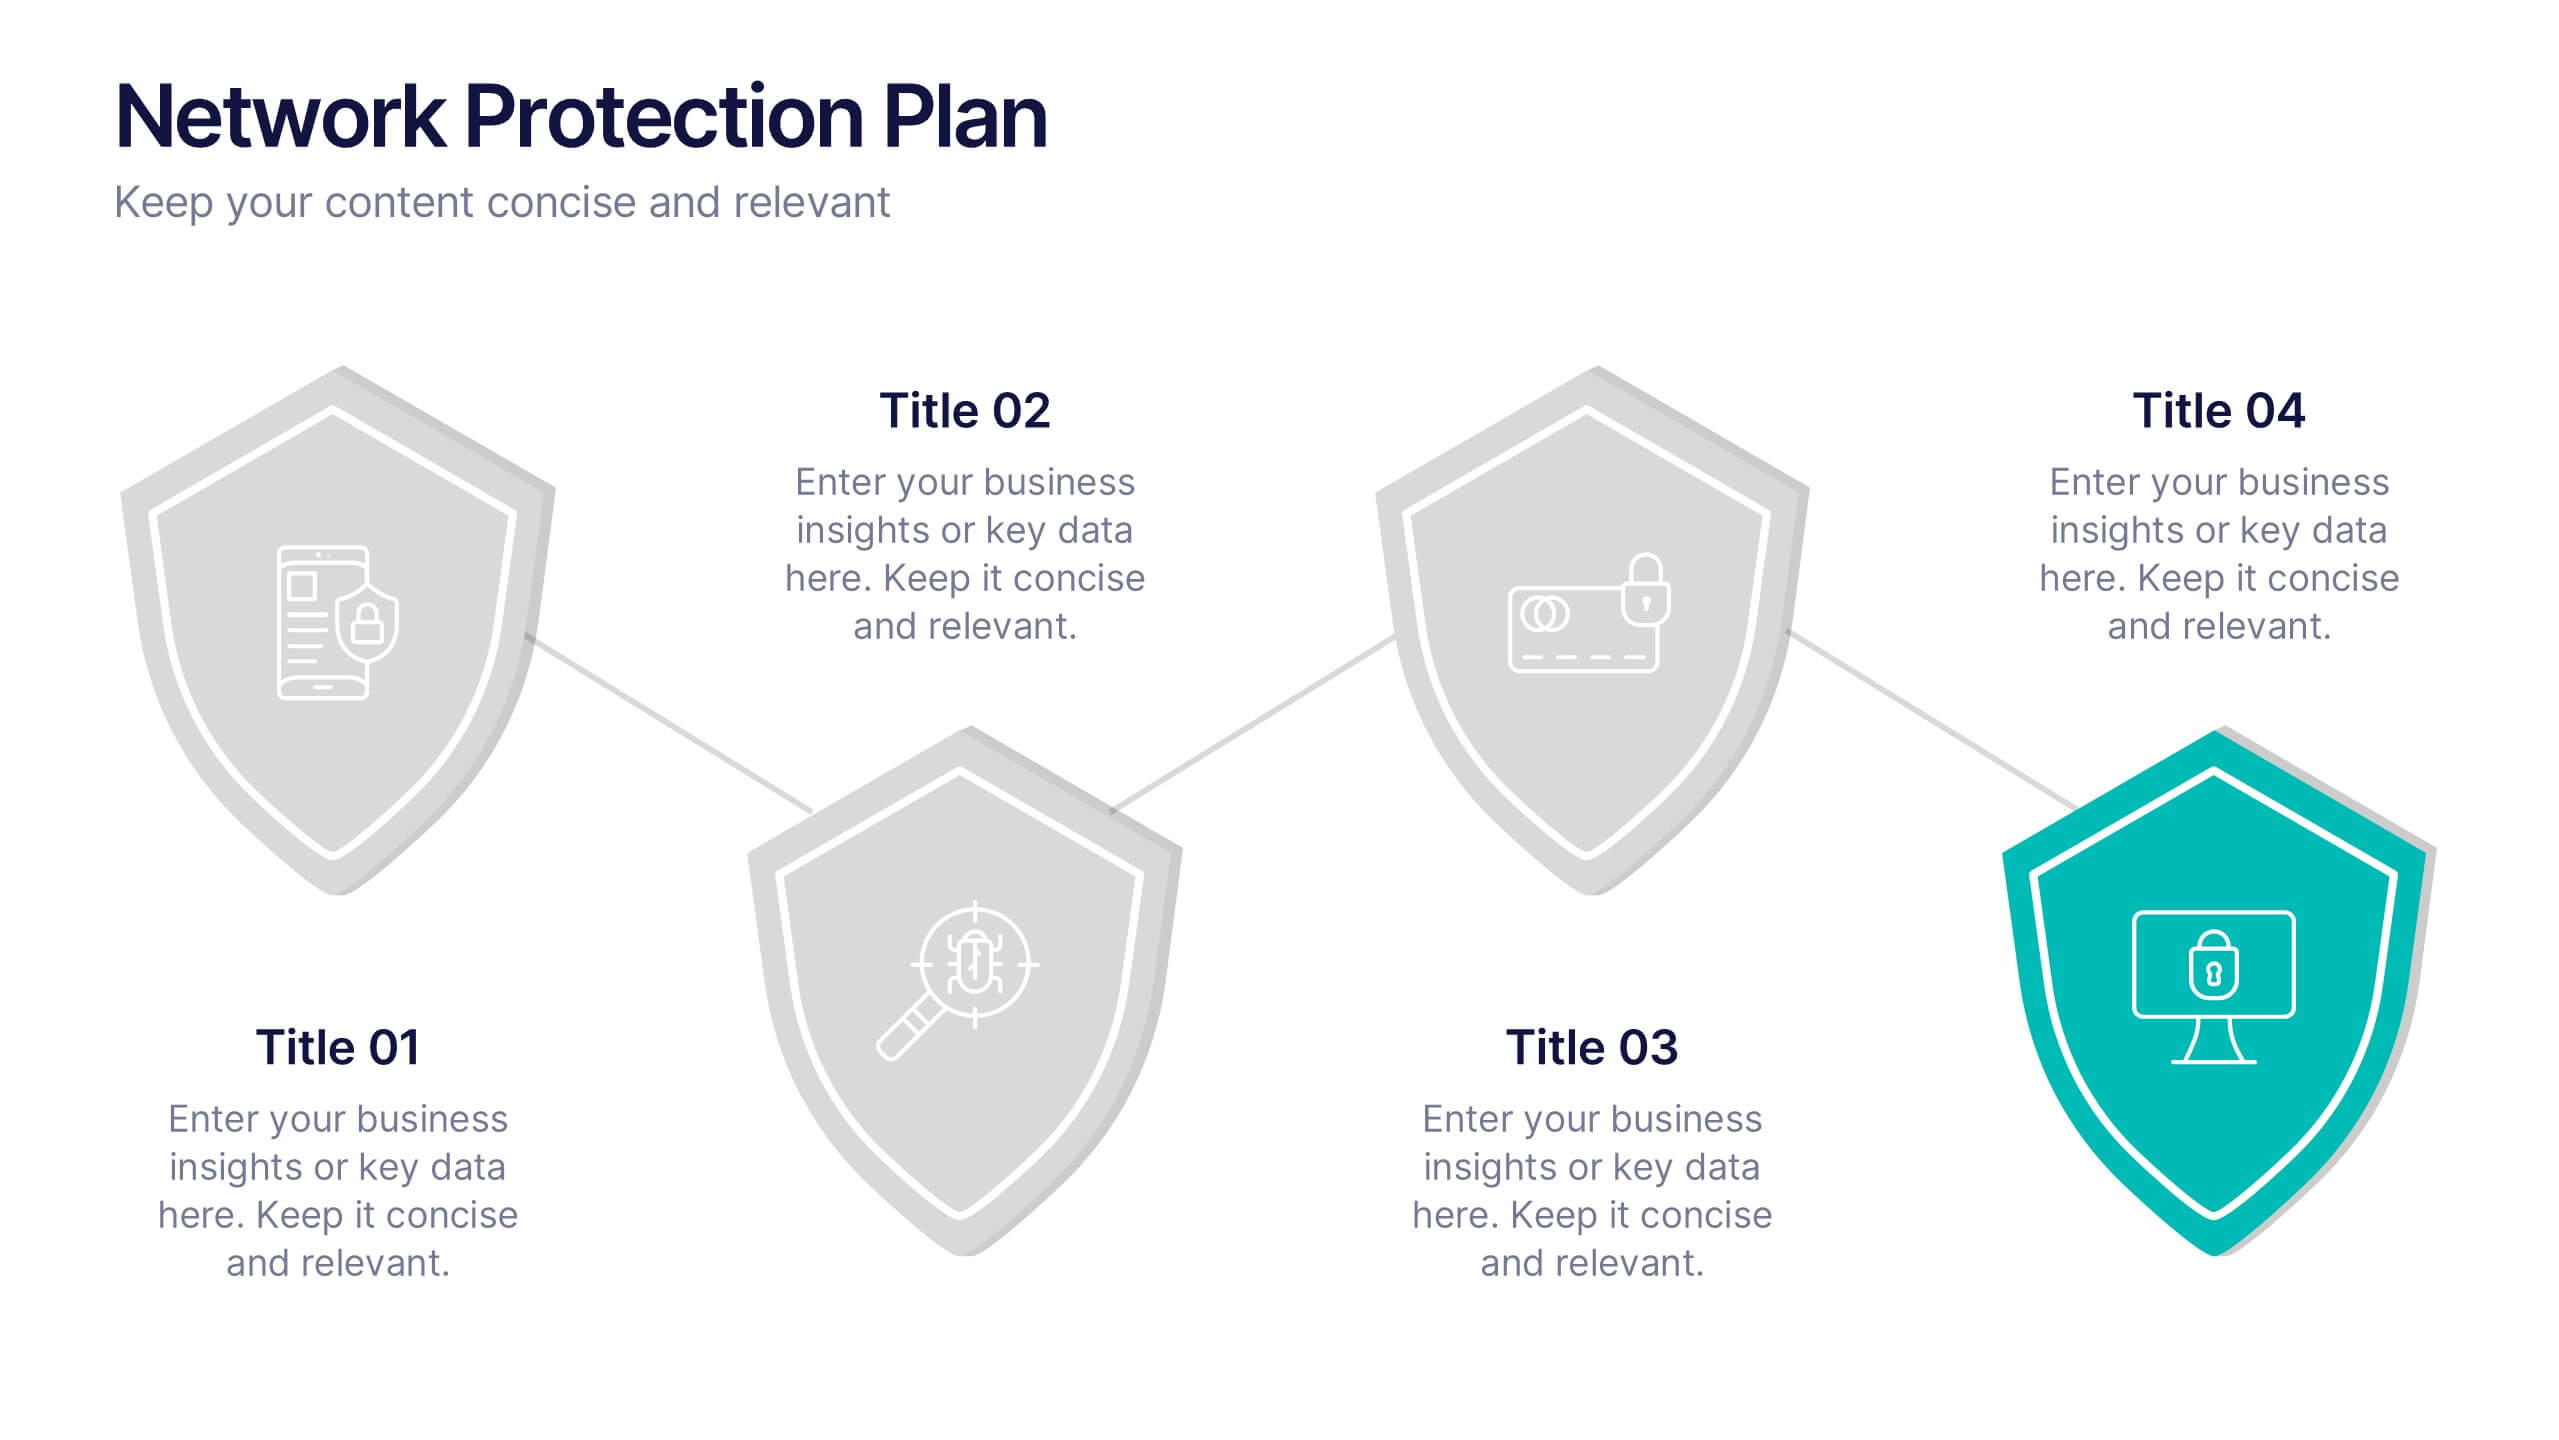
Network Protection Plan Presentation
Bold visuals and clean structure make this presentation a powerful way to communicate your protection strategy with clarity and confidence. It helps you break down key security stages, outline responsibilities, and show how each layer strengthens overall network resilience. Fully compatible with PowerPoint, Keynote, and Google Slides.


6 diapositivas
Environmental Ecology Report Presentation
Bring sustainability to life with a clear, refreshing design that makes complex environmental insights easy to share. This presentation helps you explain key ecological data, conservation efforts, and resource impact using simple visuals and structured points. Perfect for reports or awareness talks. Fully compatible with PowerPoint, Keynote, and Google Slides.


7 diapositivas
North America Population Infographic Presentation
North America is a continent located in the northern hemisphere of the Earth, bordered by the Pacific Ocean to the west. It includes countries such as the United States, Canada, Mexico, and several others in the Caribbean and Central America. This template can be a powerful tool to communicate information about the continent in an informative and engaging way. This can help people understand and appreciate the diversity and complexity of North America, and can be used for a variety of purposes, from education to marketing. This template is compatible with Powerpoint, Keynote and Google Slides.


5 diapositivas
Green Business Sustainability Strategy
Showcase your eco-conscious roadmap with this Green Business Sustainability Strategy presentation. Featuring a 5-step, curved timeline design with nature-inspired icons, it’s perfect for environmental initiatives, CSR planning, or ESG strategy. Easily adaptable in PowerPoint, Keynote, or Google Slides for a polished, professional message.


4 diapositivas
Pillar Strategy Framework Presentation
Turn complex strategies into clear, structured visuals with this elegant infographic design. Ideal for showcasing key principles, organizational foundations, or business frameworks, it helps communicate ideas with precision and balance. Fully customizable and compatible with PowerPoint, Keynote, and Google Slides for effortless editing and professional results.


22 diapositivas
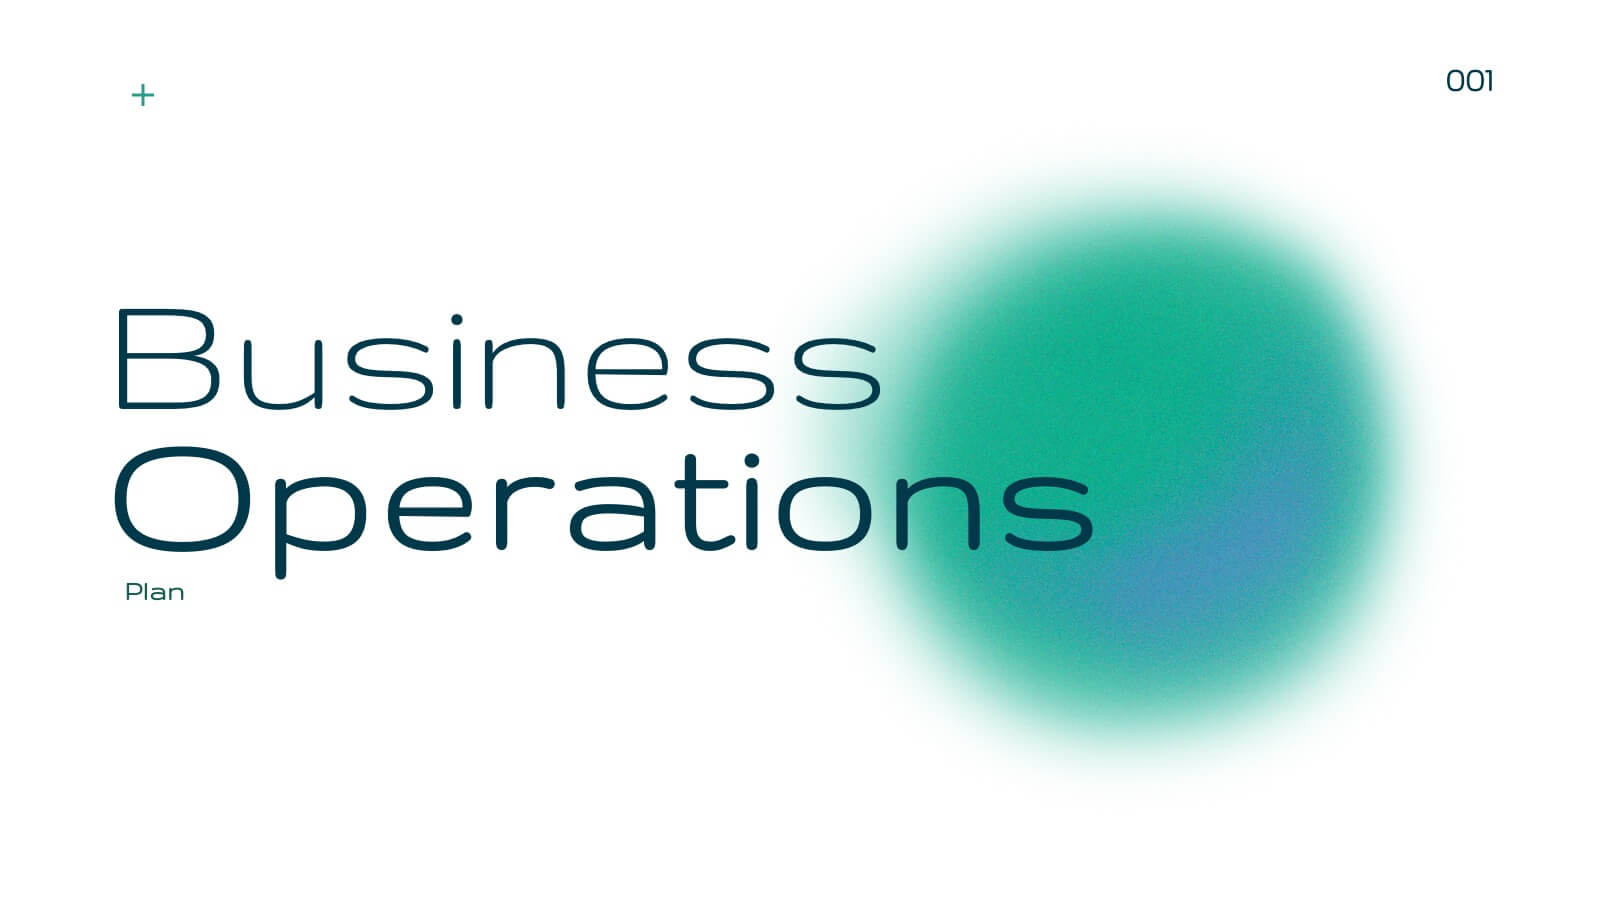
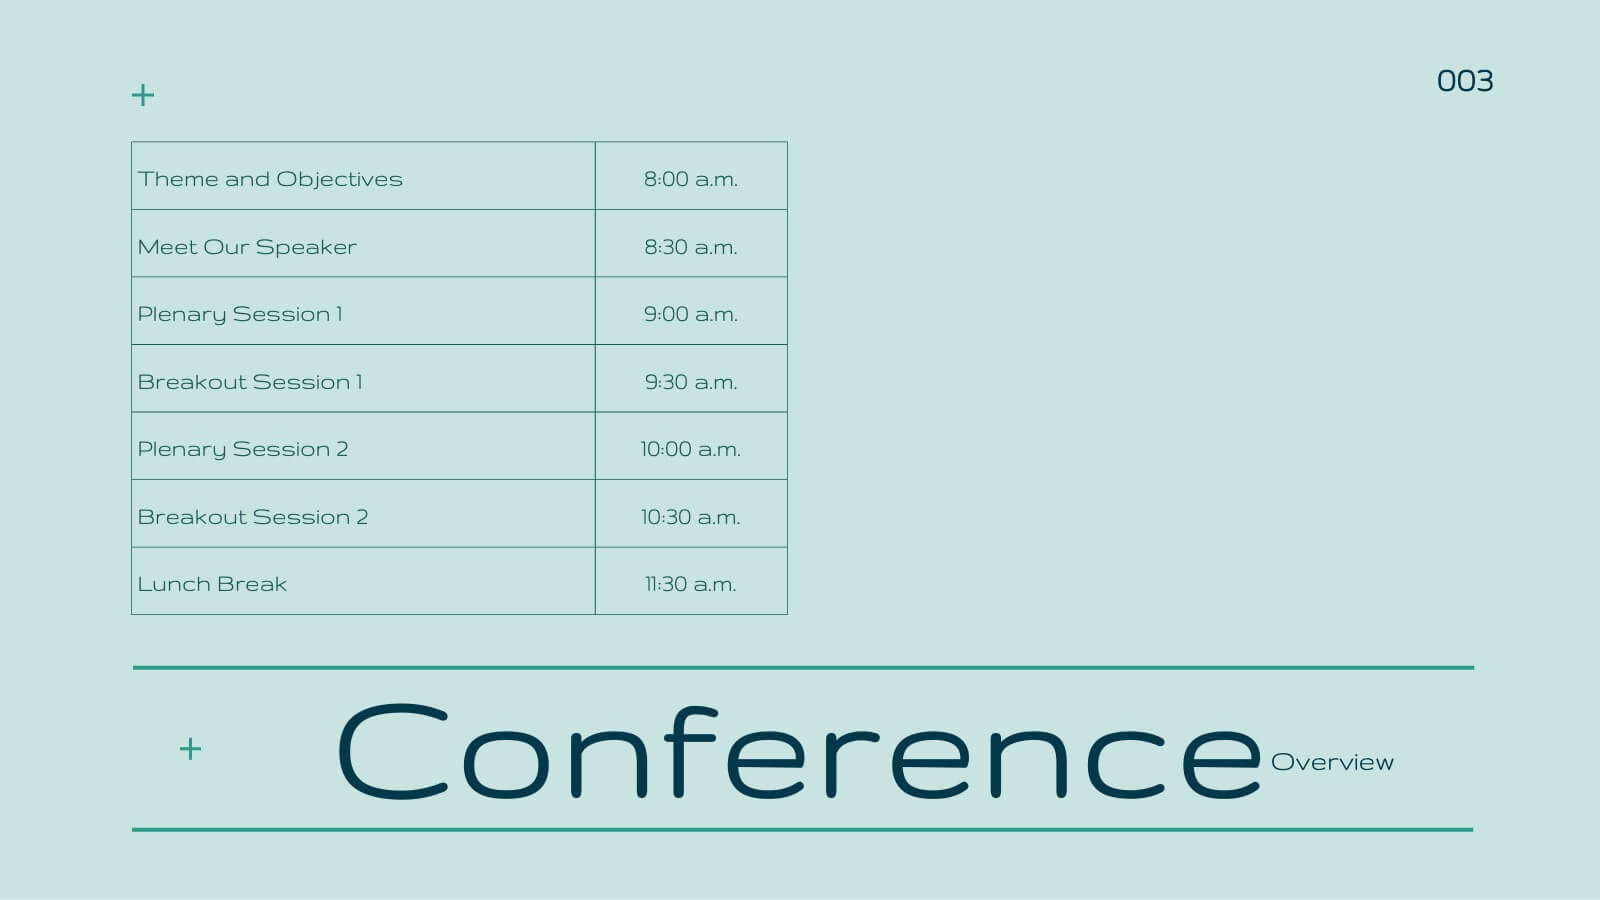
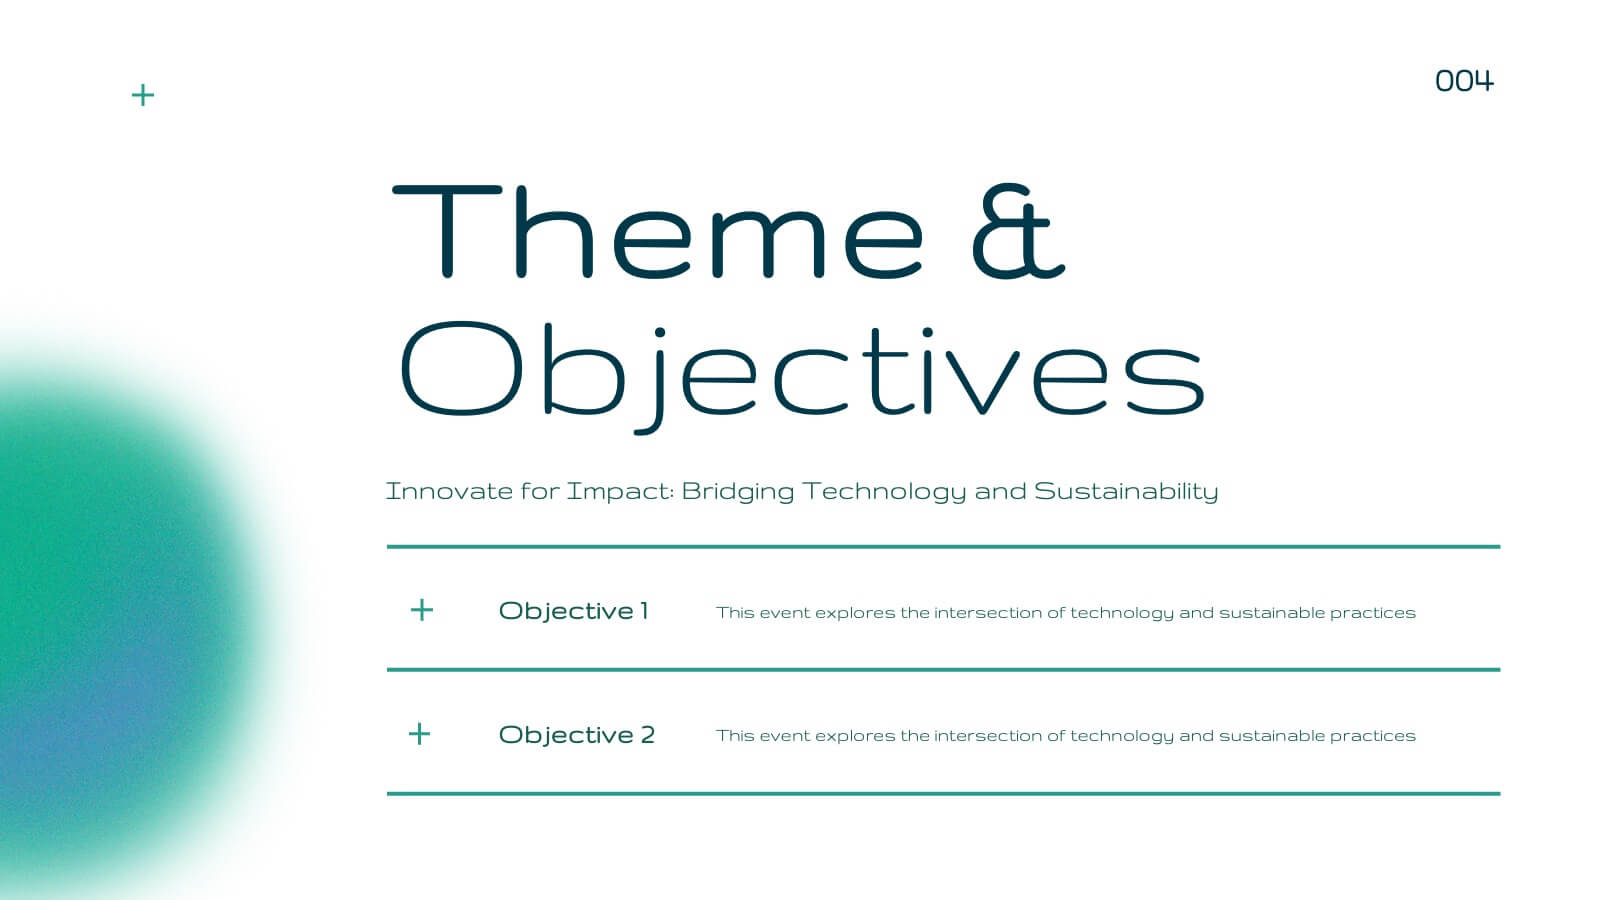
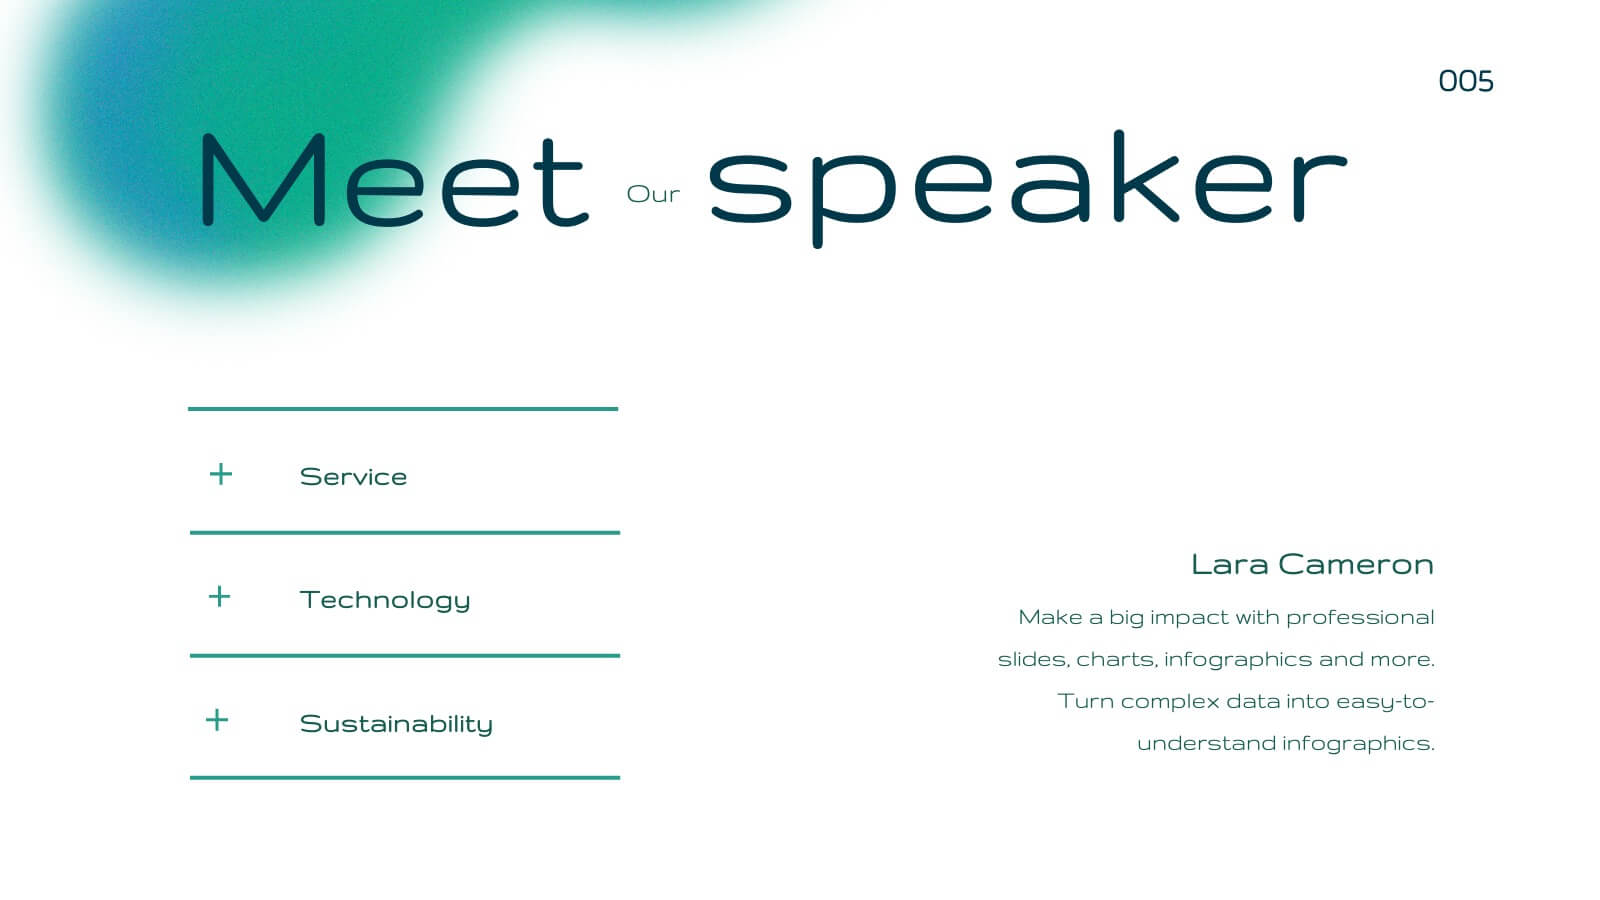
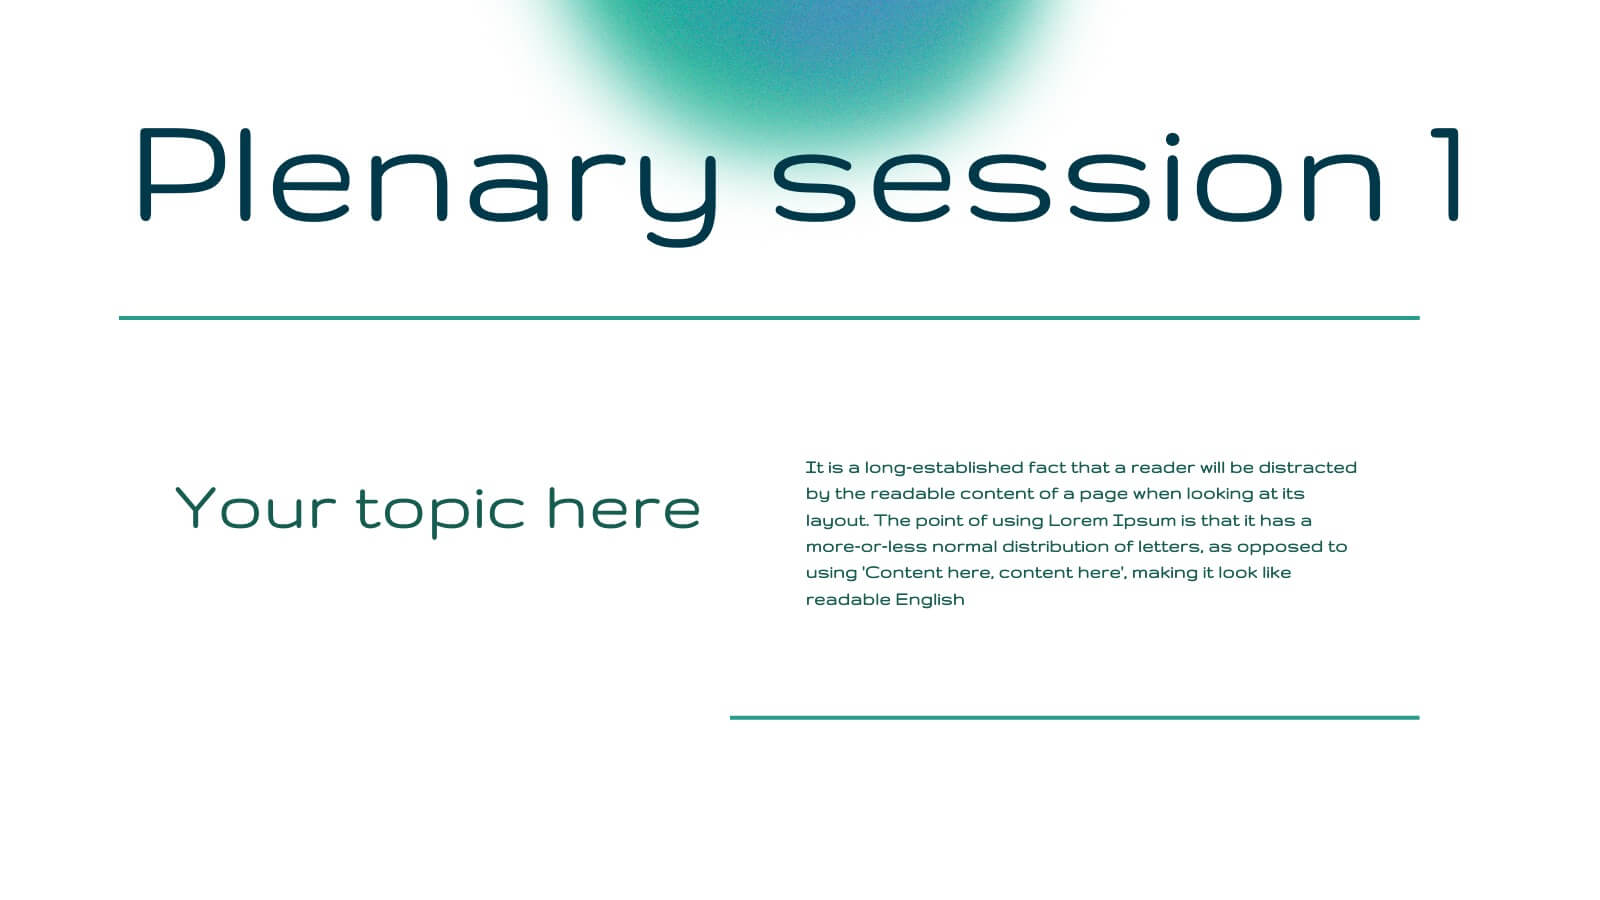
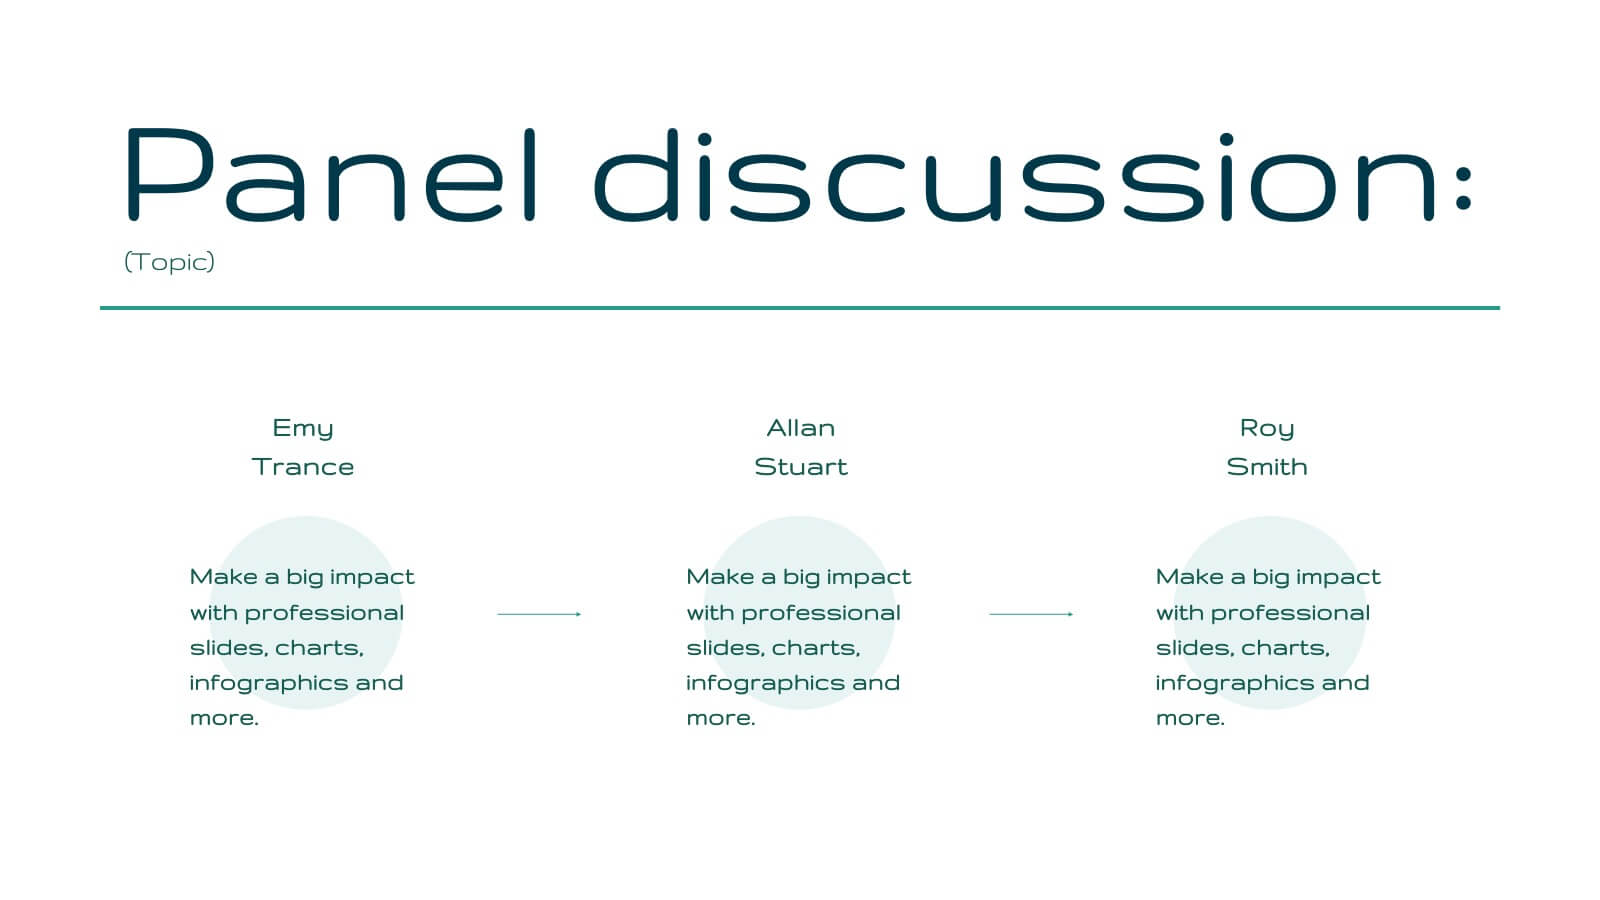
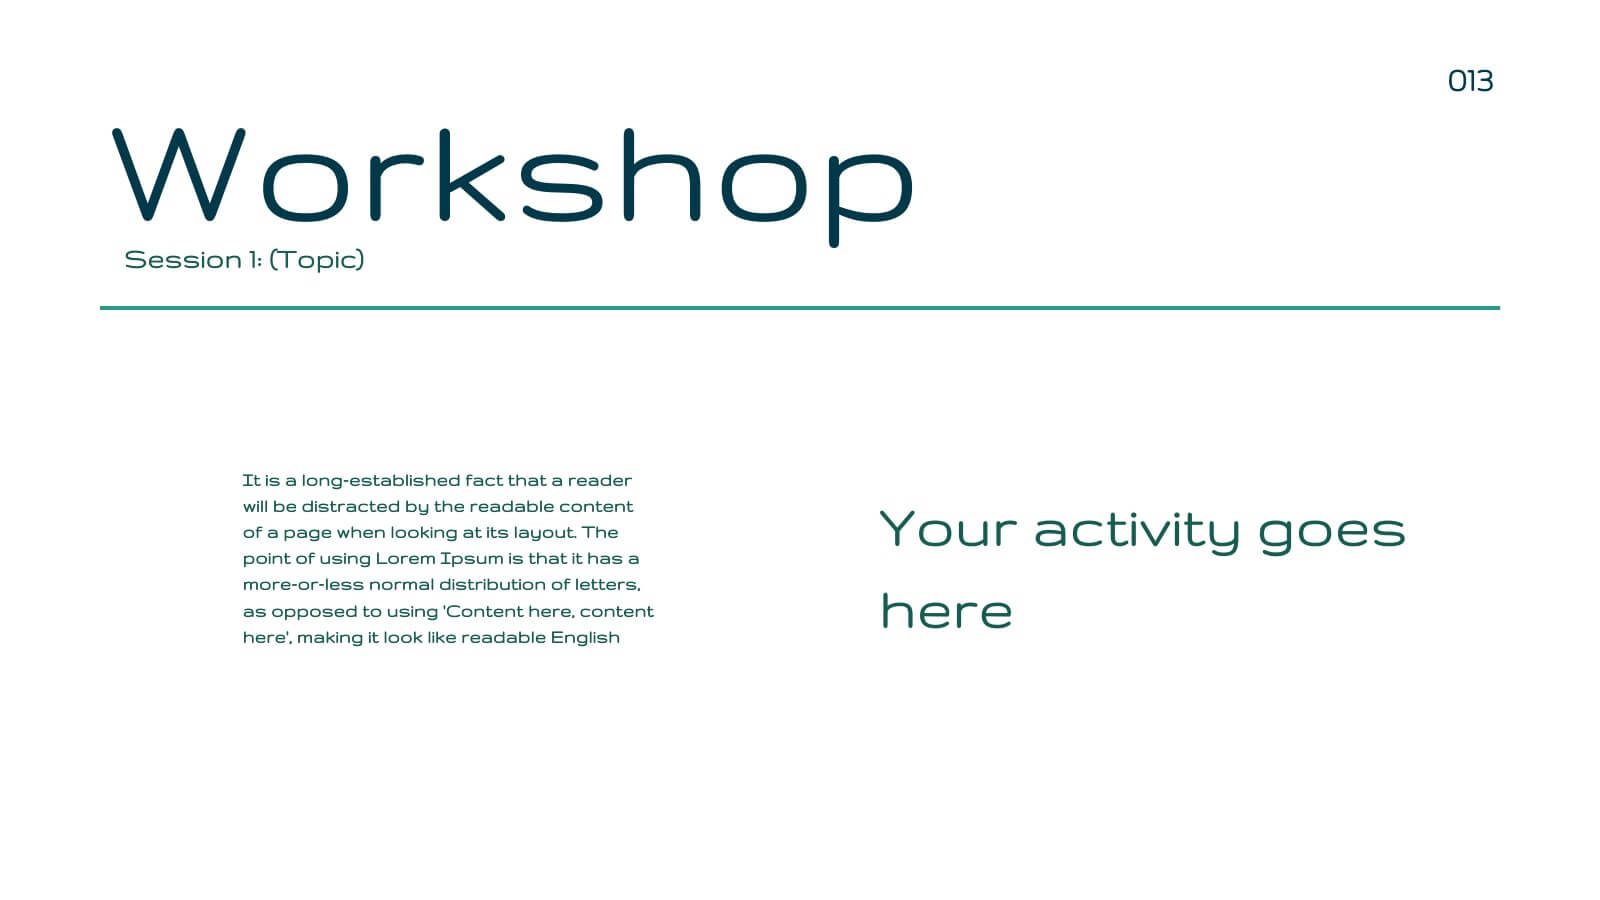
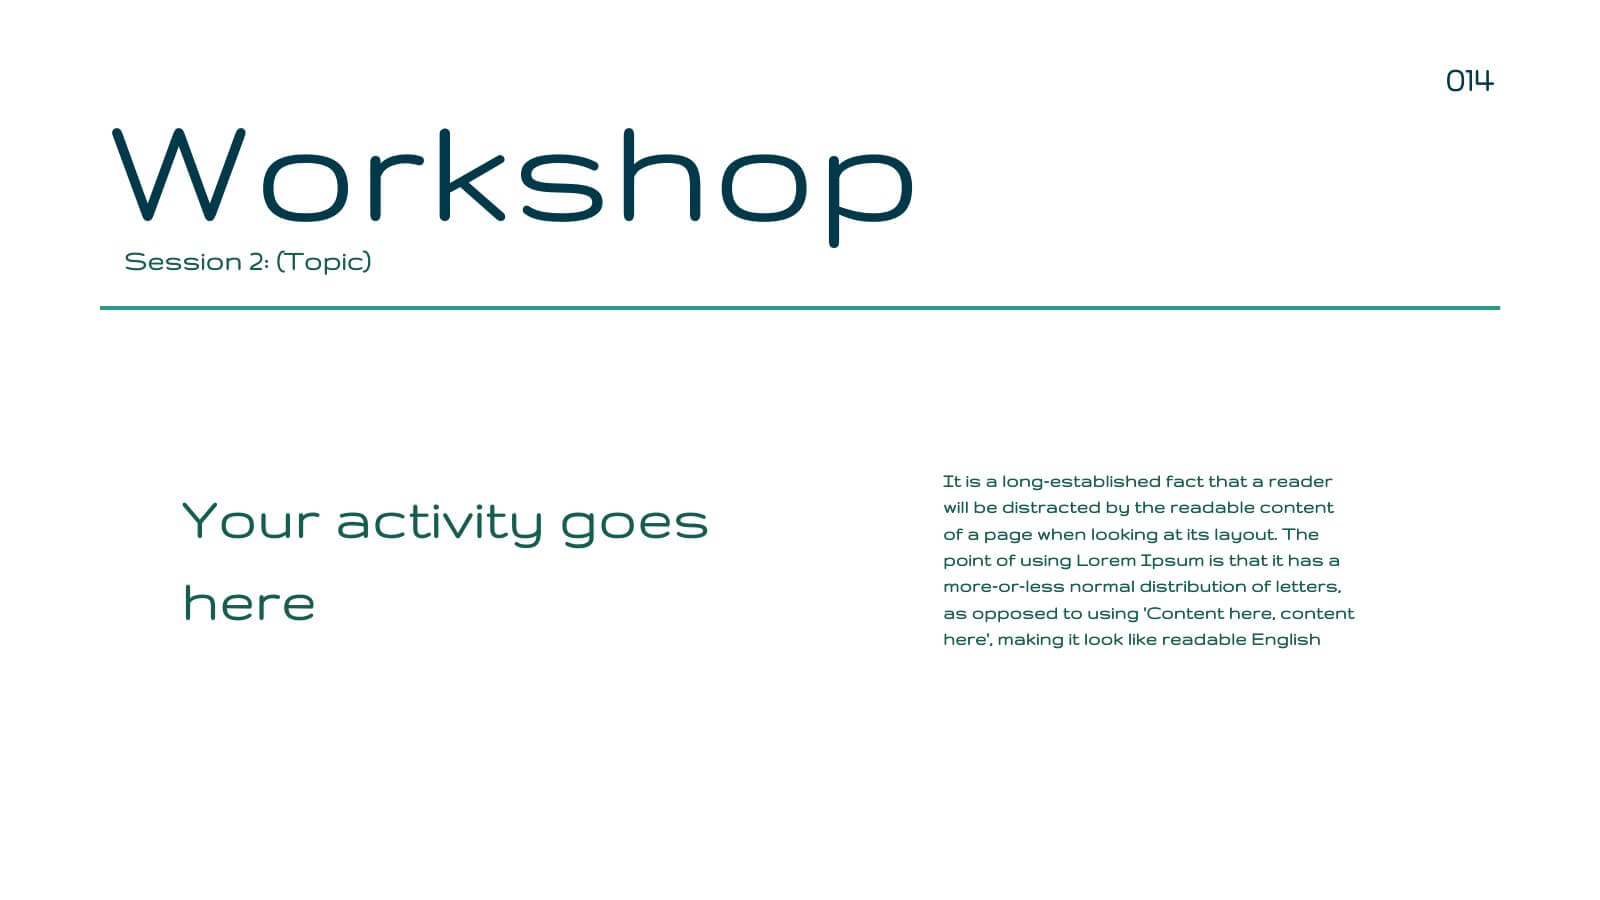
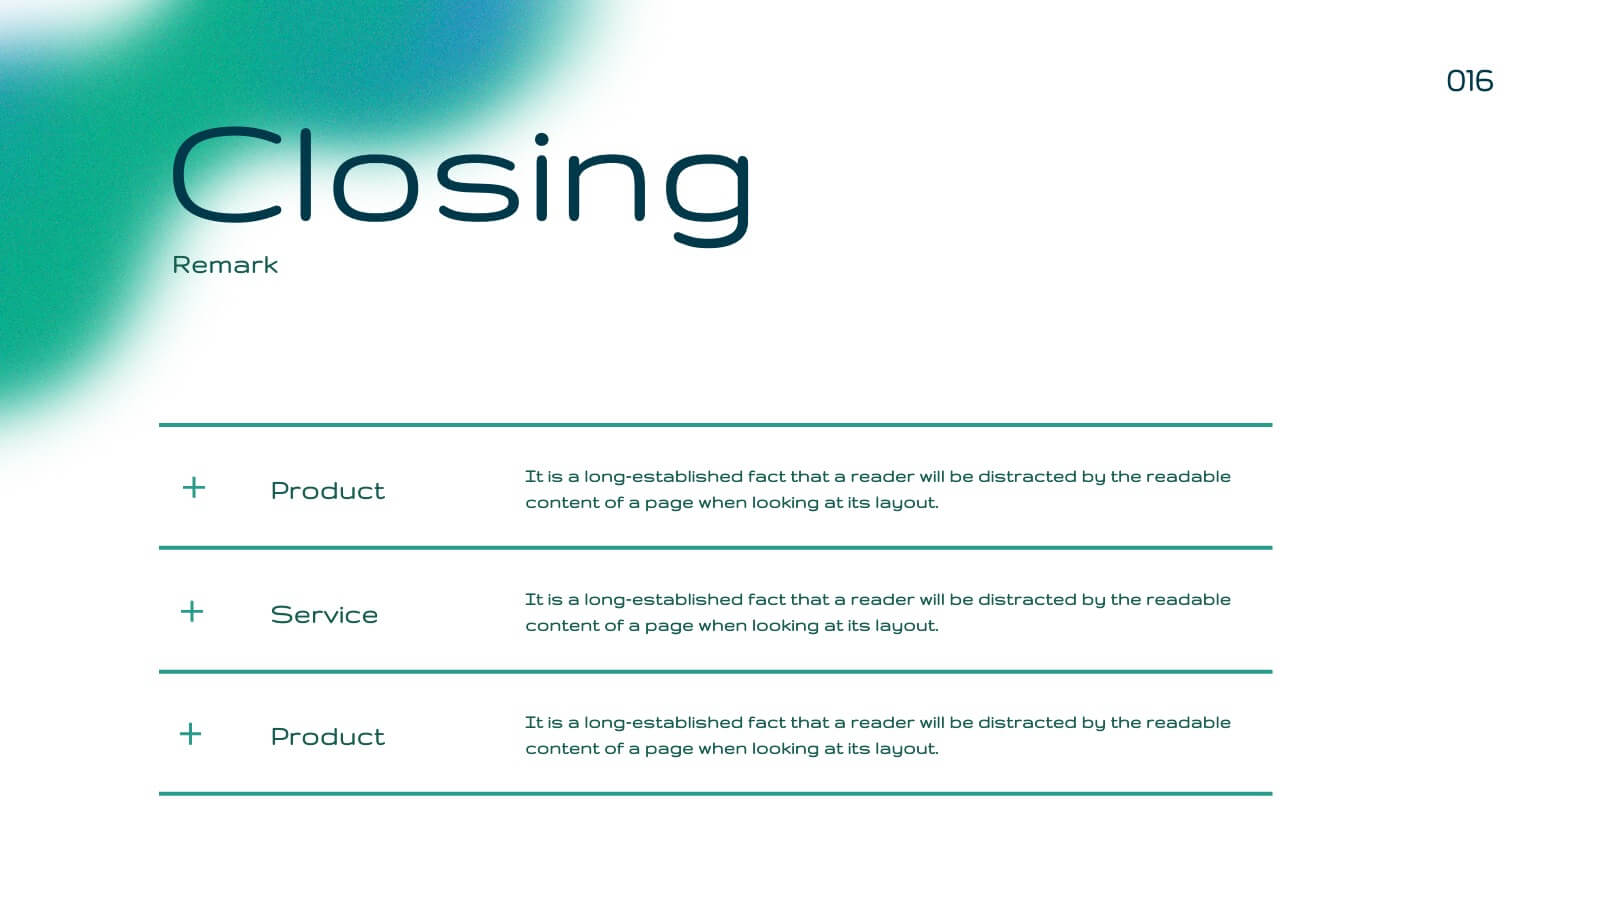
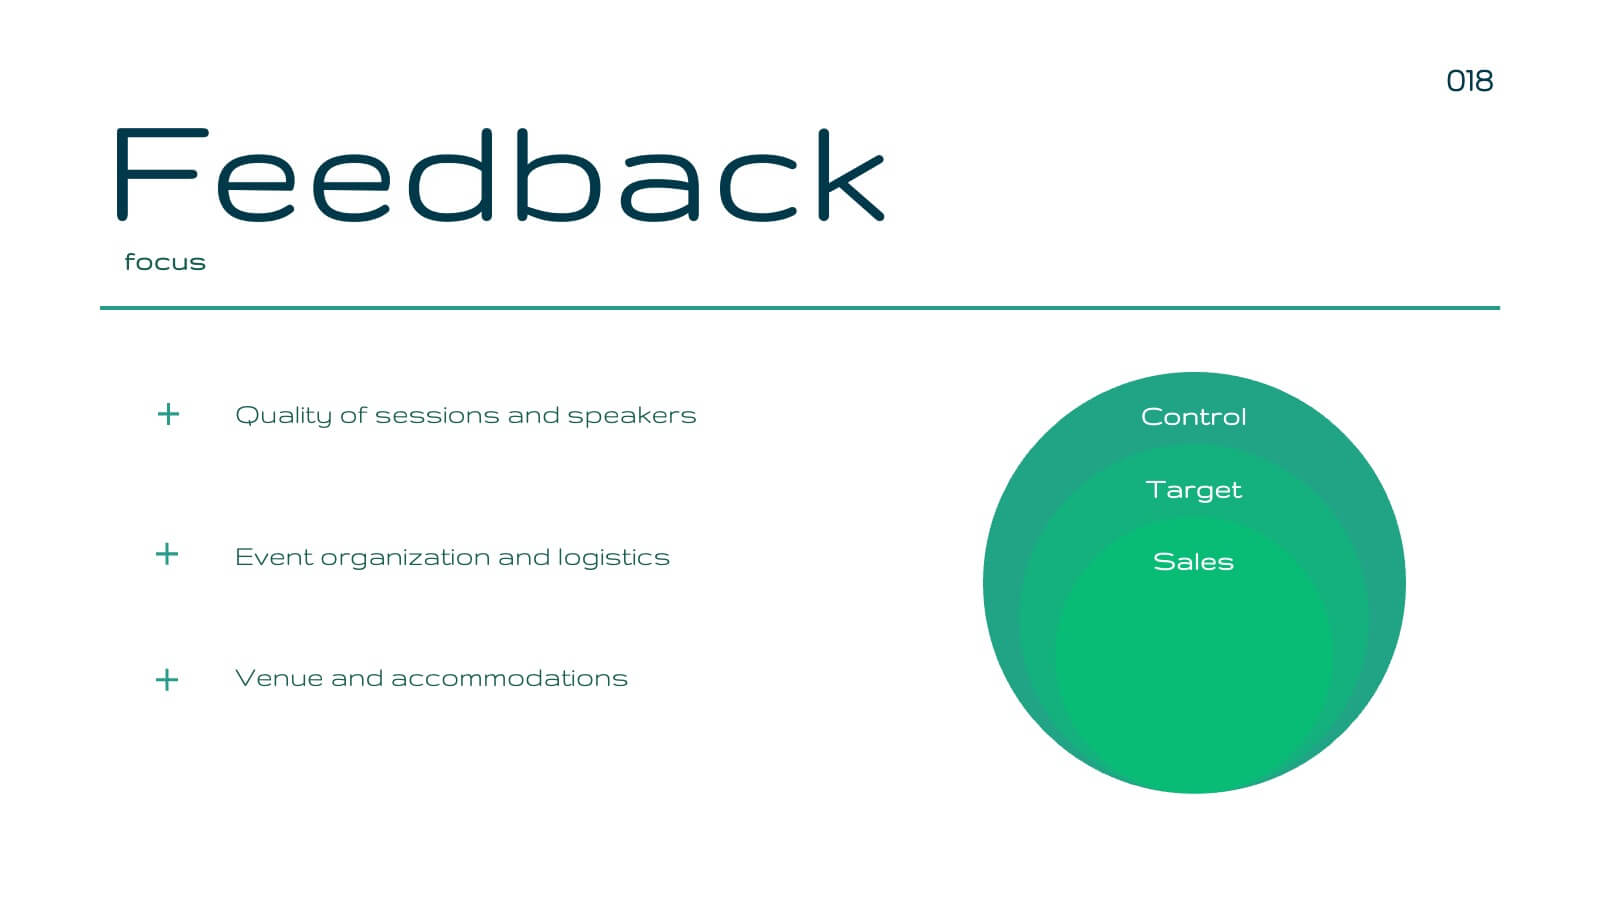
Blaze Business Operations Plan Presentation
Elevate your business presentations with this elegant, modern template designed for comprehensive business operations. Perfect for covering themes, objectives, workshops, and panel discussions, it ensures a professional and engaging delivery. The clean design and structured layout enhance clarity and impact. Compatible with PowerPoint, Keynote, and Google Slides, it’s versatile for any platform.


6 diapositivas
Real Estate Property Market Overview Presentation
Present key property market insights using this structured, easy-to-follow layout. The slide features six labeled sections flanking a central house graphic—ideal for highlighting data points, regional comparisons, or investment factors. Fully customizable in Canva, PowerPoint, and Google Slides, making it perfect for real estate reports, pitches, or client presentations.