


Características


¿Tienes alguna pregunta?
Recomendar


7 diapositivas
Venn Diagram Statistics Infographic Presentation
Venn diagrams are important because they show relationships between two or more ideas. The circles—either filled in with color or left empty—create a picture of how things relate to one another, while arrows show which things are overlapping. This template is easy to use and has a cool green color scheme that is easy on the eyes. It has a customizable layout to make your presentation unique! With this template, you can create awesome Venn Diagrams that will help you compare and contrast information in a way that is easy to understand. This is perfect for school projects or even work presentations.


10 diapositivas
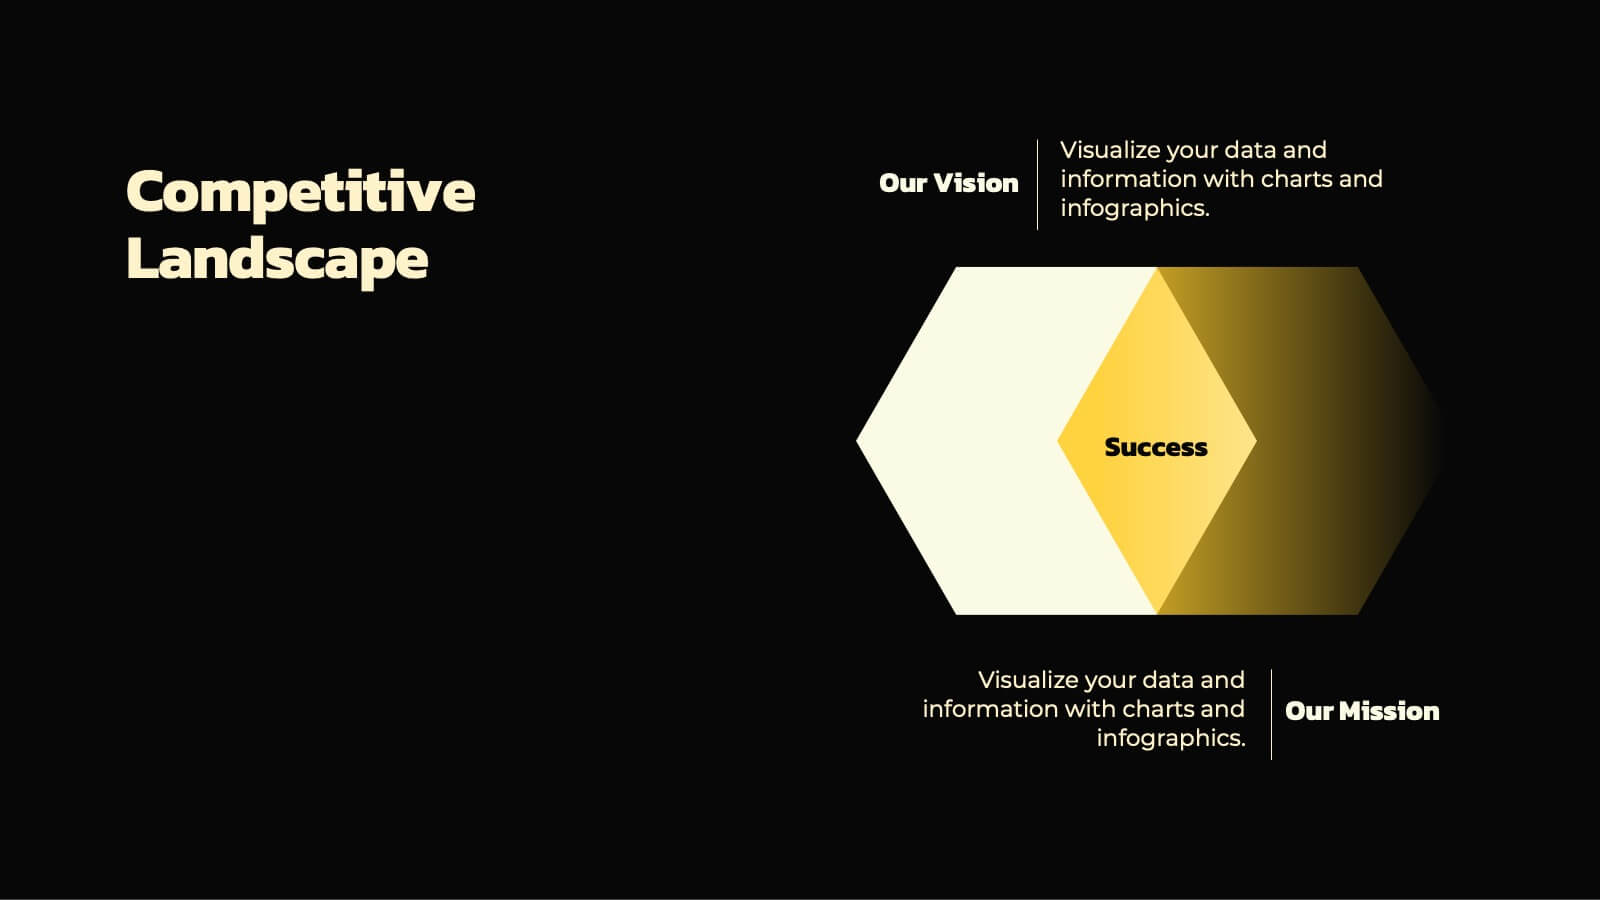
Market Positioning Competitive Analysis
Visually assess your brand’s position in the market with this quadrant-based layout designed for strategic clarity. This slide helps showcase key comparisons across marketing analysis, target audience alignment, unique value proposition, and messaging consistency. Fully editable in PowerPoint, Keynote, and Google Slides.


10 diapositivas
Financial Investment Portfolio Presentation
The "Financial Investment Portfolio" templates use a visually appealing mix of arrow and coin icons to represent different aspects of financial portfolios. Each slide varies slightly in color palette and layout but maintains a consistent theme that effectively uses symbols to emphasize key financial concepts or data points. These designs are excellent for presentations aimed at illustrating investment strategies, portfolio distributions, or financial growth, providing both clarity and aesthetic appeal to the information presented.


6 diapositivas
Training Center Infographic
A training center is a facility or institution dedicated to providing education, skills development, and training to individuals or groups in various fields. This infographic provides a visual overview of the training programs, courses, and facilities offered by a training center. This template highlights the key information that potential learners or clients need to know. This infographic is fully customizable and compatible with Powerpoint, Keynote, and Google Slides. Allowing you to ensure that the colors, fonts, and graphics used align with your training center's branding.


4 diapositivas
Operational KPI Monitoring Dashboard
Stay on top of business performance with the Operational KPI Monitoring Dashboard Presentation. This slide is designed to visually communicate key operational metrics using gradient-filled progress bars, percentage indicators, and area charts. Perfect for status updates, executive reporting, or performance reviews, it enables quick analysis of KPIs at a glance. Fully customizable in PowerPoint, Keynote, and Google Slides.


6 diapositivas
Risk Prevention and Security Measures Presentation
Enhance your safety strategy with this professional infographic slide. Designed to highlight five key risk and security areas, it features a clean, diamond layout with icon-based callouts. Ideal for business continuity plans, risk assessments, or compliance reports. Fully editable in PowerPoint, Keynote, and Google Slides.


6 diapositivas
Constructive Feedback Infographics
Improve your feedback processes with our Constructive Feedback infographic template. This template is fully compatible with popular presentation software like PowerPoint, Keynote, and Google Slides, allowing you to easily customize it to illustrate and communicate the principles of providing effective constructive feedback. The Constructive Feedback infographic template offers a visually engaging platform to outline the key elements of delivering feedback that promotes growth and improvement. Whether you're a manager, team leader, educator, or simply interested in enhancing your feedback skills, this template provides a user-friendly canvas to create informative presentations and educational materials. Optimize your feedback delivery with this SEO-optimized Constructive Feedback infographic template, thoughtfully designed for clarity and ease of use. Customize it to showcase the importance of specific, actionable, and balanced feedback, helping you enhance communication and drive positive change within your team or organization. Start crafting your personalized infographic today to become more proficient in providing constructive feedback.


4 diapositivas
Onboarding 30-60-90 Roadmap Presentation
Simplify your onboarding strategy with the Onboarding 30–60–90 Roadmap Presentation. This clean, visual layout breaks down employee integration into three distinct timeframes—30, 60, and 90 days—each with space for goals, tasks, or milestones. Perfect for HR teams, managers, and trainers. Fully editable in Canva, PowerPoint, Keynote, and Google Slides.


26 diapositivas
Doriyan Presentation Template
Doriyan is a beautiful, colorful, professional and descriptive presentation. This template has wonderful colors and graphics that are engaging and conveys the information to the audience. This template is suitable for all types of businesses especially those that are investors, realtors or other companies involved in investment advice. Charts, timelines and easy to edit text makes this template perfect for businesses seeking to introduce there business and services to make a great impression. Doriyan offers a way to boost your business. Present your information with this efficient template!


6 diapositivas
Cryptocurrency Analysis Infographics
Analyze cryptocurrency effectively with our Cryptocurrency Analysis infographic template. This template is fully compatible with popular presentation software like PowerPoint, Keynote, and Google Slides, allowing you to easily customize it to illustrate and communicate various aspects of cryptocurrency analysis. The Cryptocurrency Analysis infographic template offers a visually engaging platform to explore and explain the key elements of analyzing cryptocurrencies, including market trends, technical analysis, fundamental analysis, and investment strategies. Whether you're a cryptocurrency enthusiast, trader, or investor, this template provides a user-friendly canvas to create informative presentations and educational materials. Enhance your cryptocurrency knowledge and analysis skills with this SEO-optimized Cryptocurrency Analysis infographic template, thoughtfully designed for clarity and ease of use. Customize it to showcase cryptocurrency charts, indicators, risk management techniques, and insights into the volatile world of digital assets, ensuring that your audience gains valuable insights into this evolving field. Start crafting your personalized infographic today to become a more proficient cryptocurrency analyst.


27 diapositivas
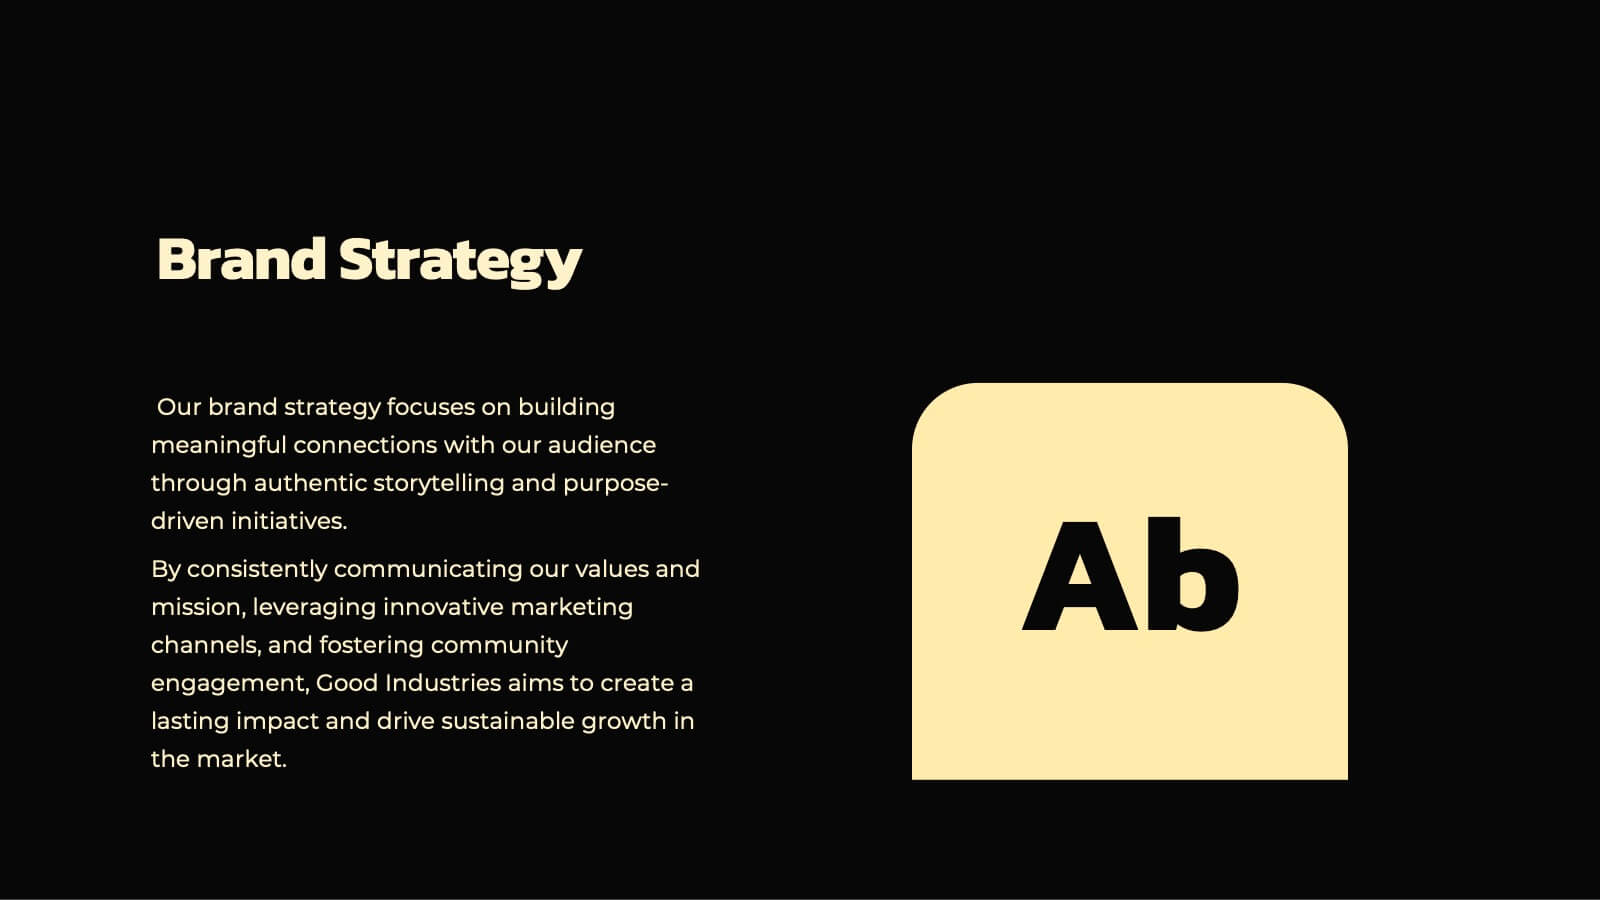
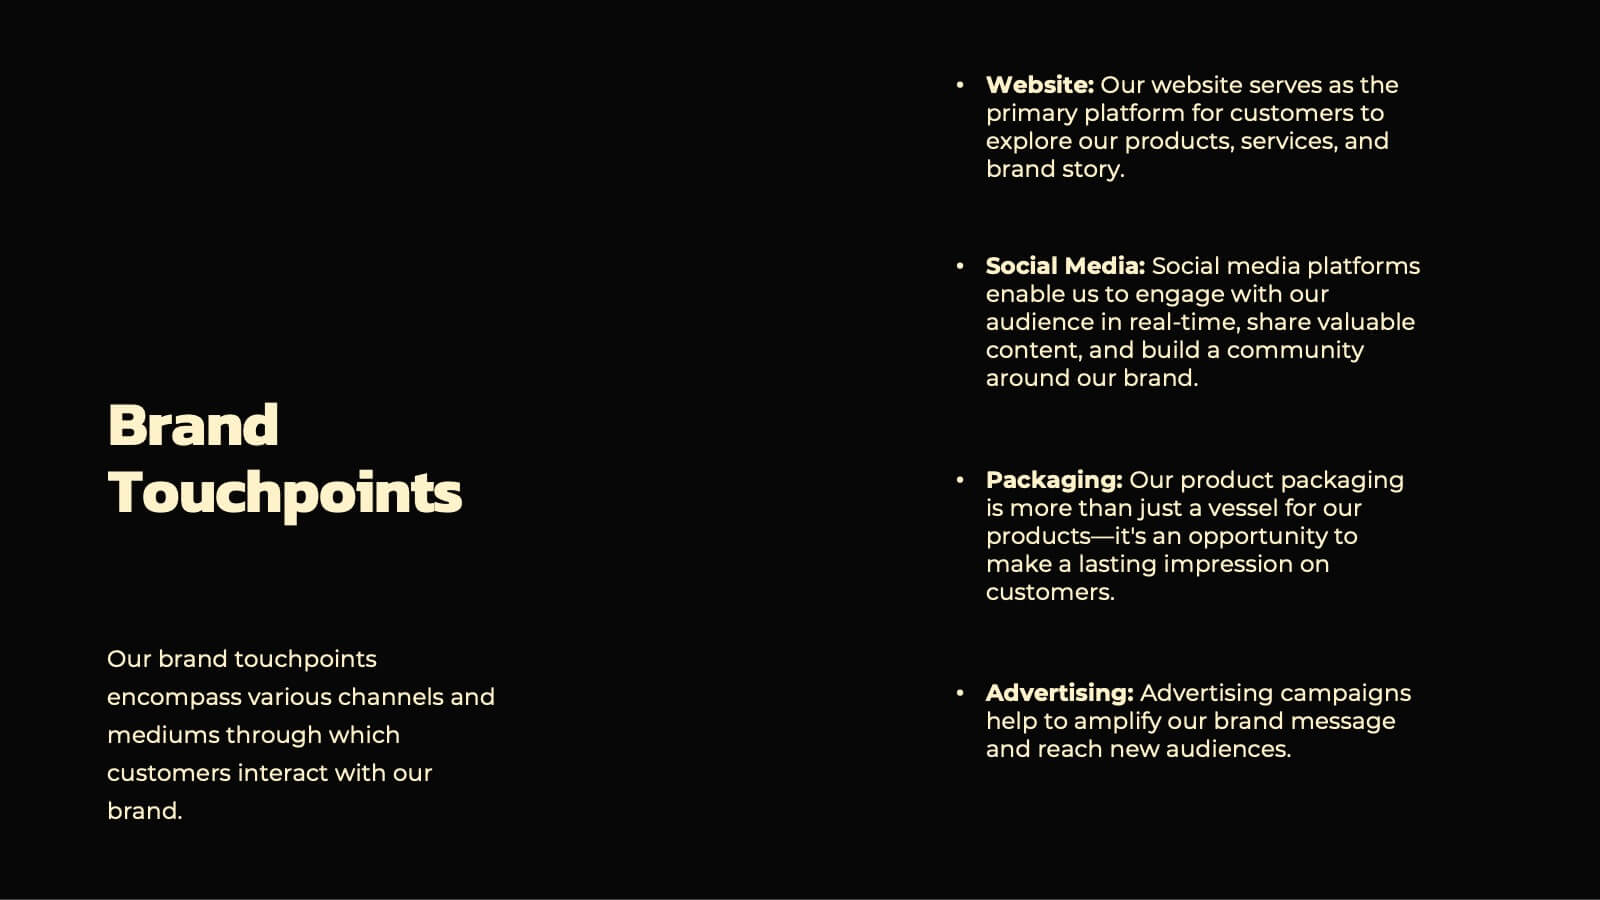
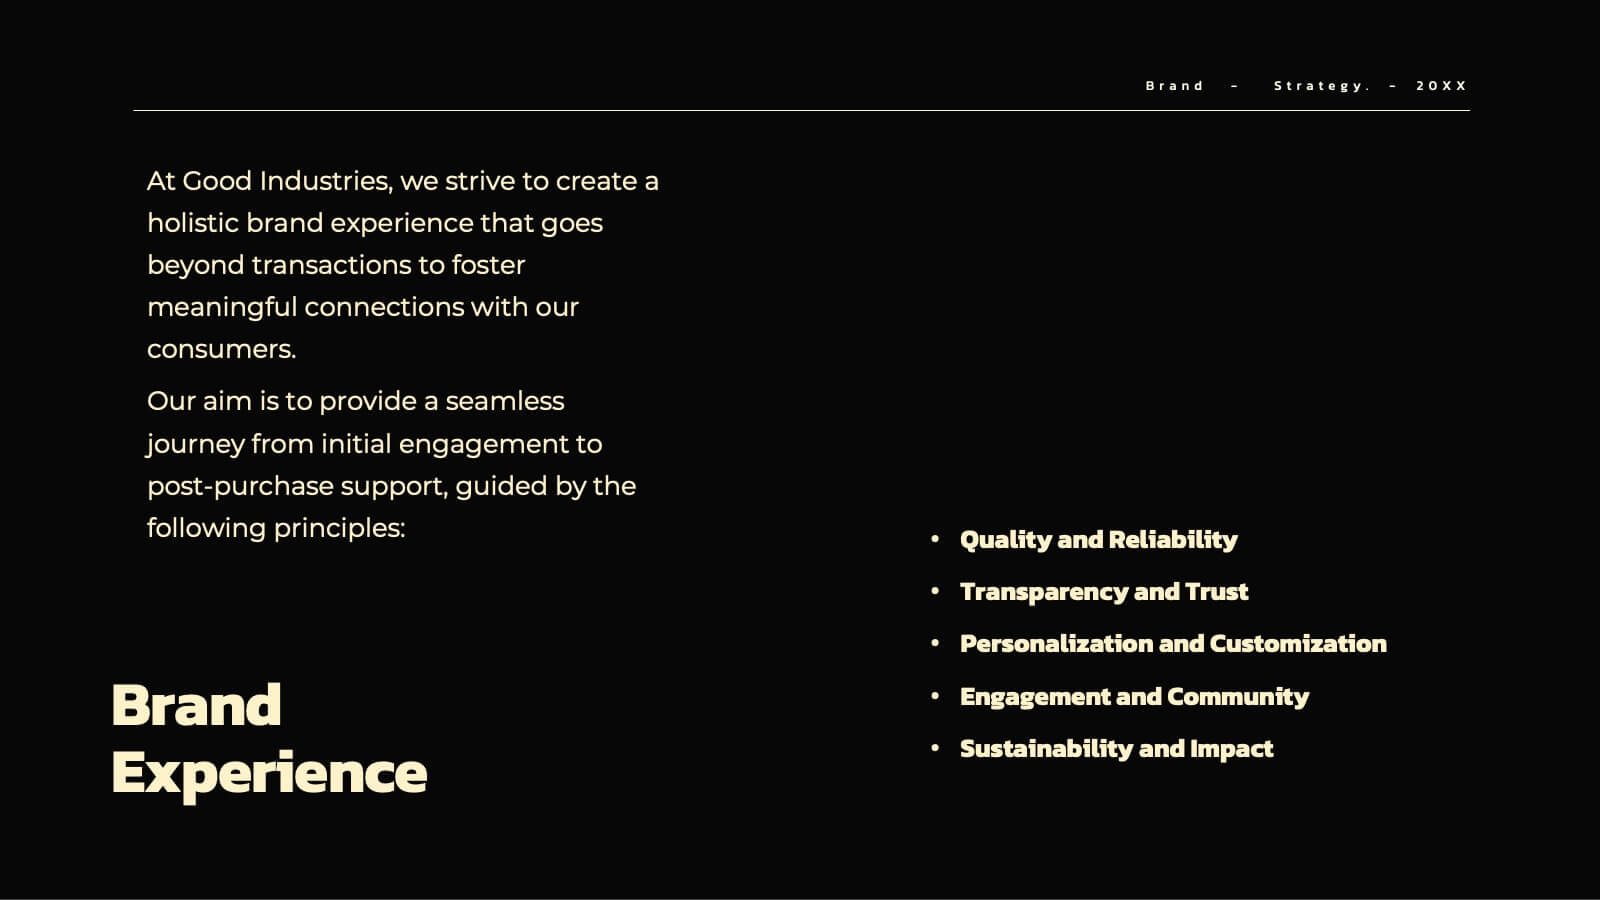
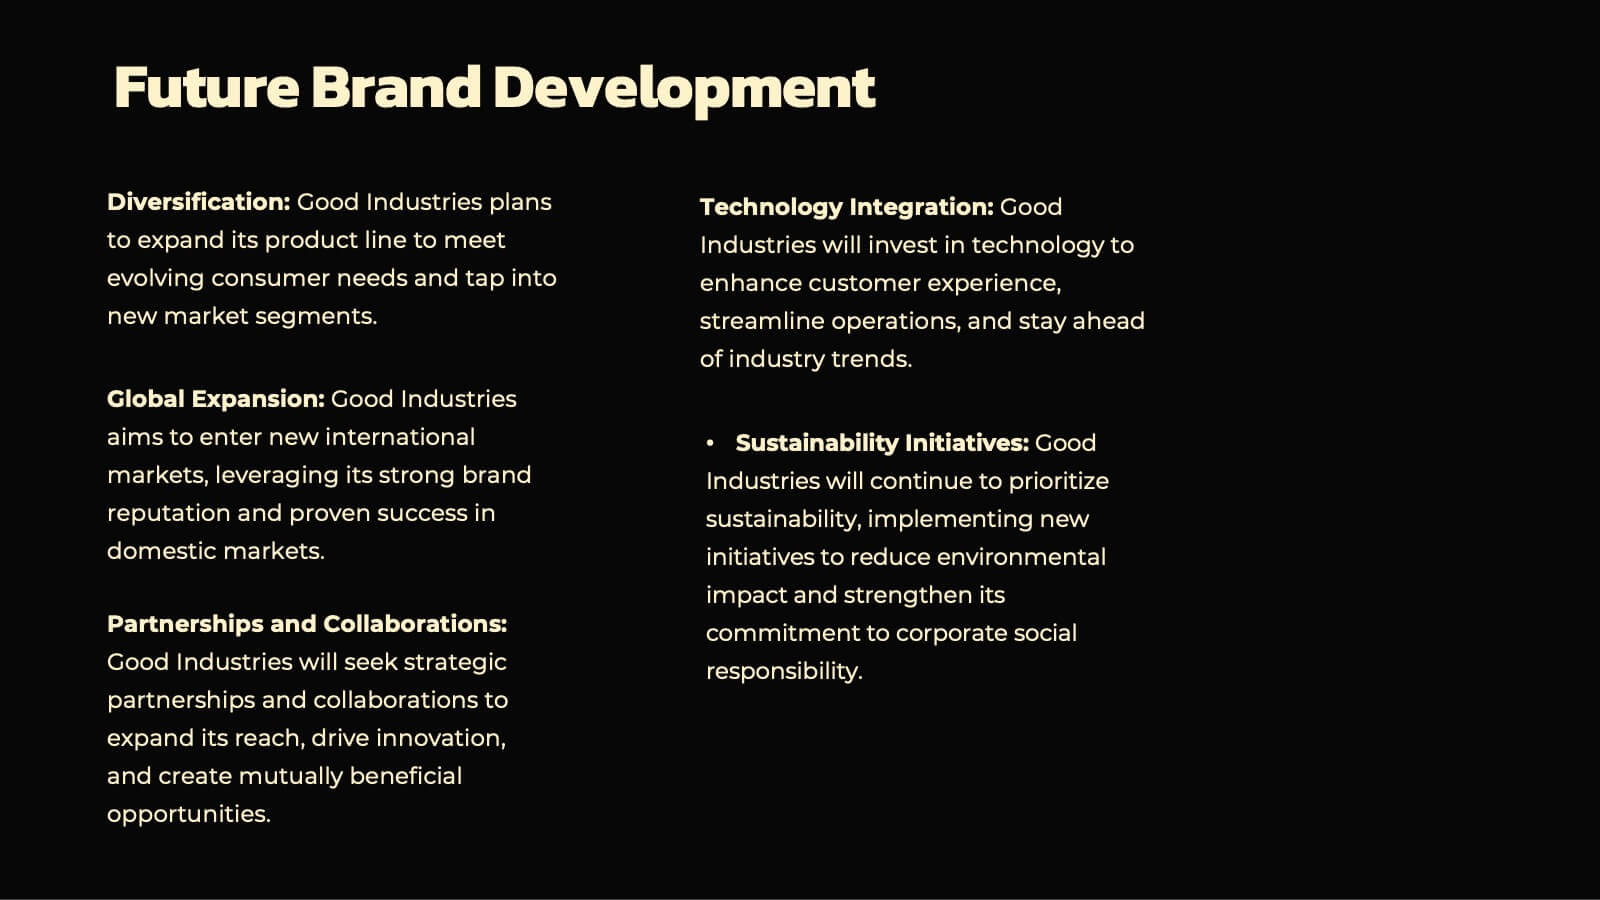
Aqua Brand Strategy Report Presentation
Make waves with this fresh, aqua-inspired presentation template, perfect for delivering a standout brand strategy report! Designed to help you showcase your brand's vision, market positioning, and strategic goals, it features a clean, modern layout that grabs attention. Compatible with PowerPoint, Keynote, and Google Slides for effortless customization.


12 diapositivas
Health and Safety Compliance Strategy Presentation
Ensure your organization meets regulatory standards with the Health and Safety Compliance Strategy presentation. This sleek, diamond-based layout breaks down key safety elements into five visually engaging segments, ideal for outlining compliance measures, emergency protocols, training requirements, risk assessments, and inspection plans. Each icon-based section includes editable titles and text boxes for quick customization. Designed to keep information clear and actionable, this template is perfect for corporate safety briefings, internal audits, or HR presentations. Fully compatible with PowerPoint, Keynote, and Google Slides.


5 diapositivas
Residential Market Trends Overview Presentation
Track market insights with clarity using the Residential Market Trends Overview Presentation. Featuring a clean, linear layout with four content points and a central house icon, this slide is ideal for showcasing housing data, price trends, investment insights, or neighborhood developments. Fully editable in Canva, PowerPoint, Keynote, and Google Slides—perfect for real estate pros, analysts, or urban planners.


6 diapositivas
Money Conversion Infographics
Convert currencies effectively with our Money Conversion infographic template. This template is fully compatible with popular presentation software like PowerPoint, Keynote, and Google Slides, allowing you to easily customize it to illustrate and communicate currency conversion rates and methods. The Money Conversion infographic template offers a visually engaging platform to explain the process of converting one currency to another, including exchange rates, conversion tools, and tips for international travelers or businesses. Whether you're a traveler, finance professional, or anyone dealing with currency exchange, this template provides a user-friendly canvas to create informative presentations and educational materials. Optimize your currency conversion knowledge with this SEO-optimized Money Conversion infographic template, thoughtfully designed for clarity and ease of use. Customize it to showcase currency conversion tools, real-time exchange rate sources, and practical examples, ensuring that your audience gains valuable insights into this important aspect of finance. Start crafting your personalized infographic today to become more proficient in money conversion.


5 diapositivas
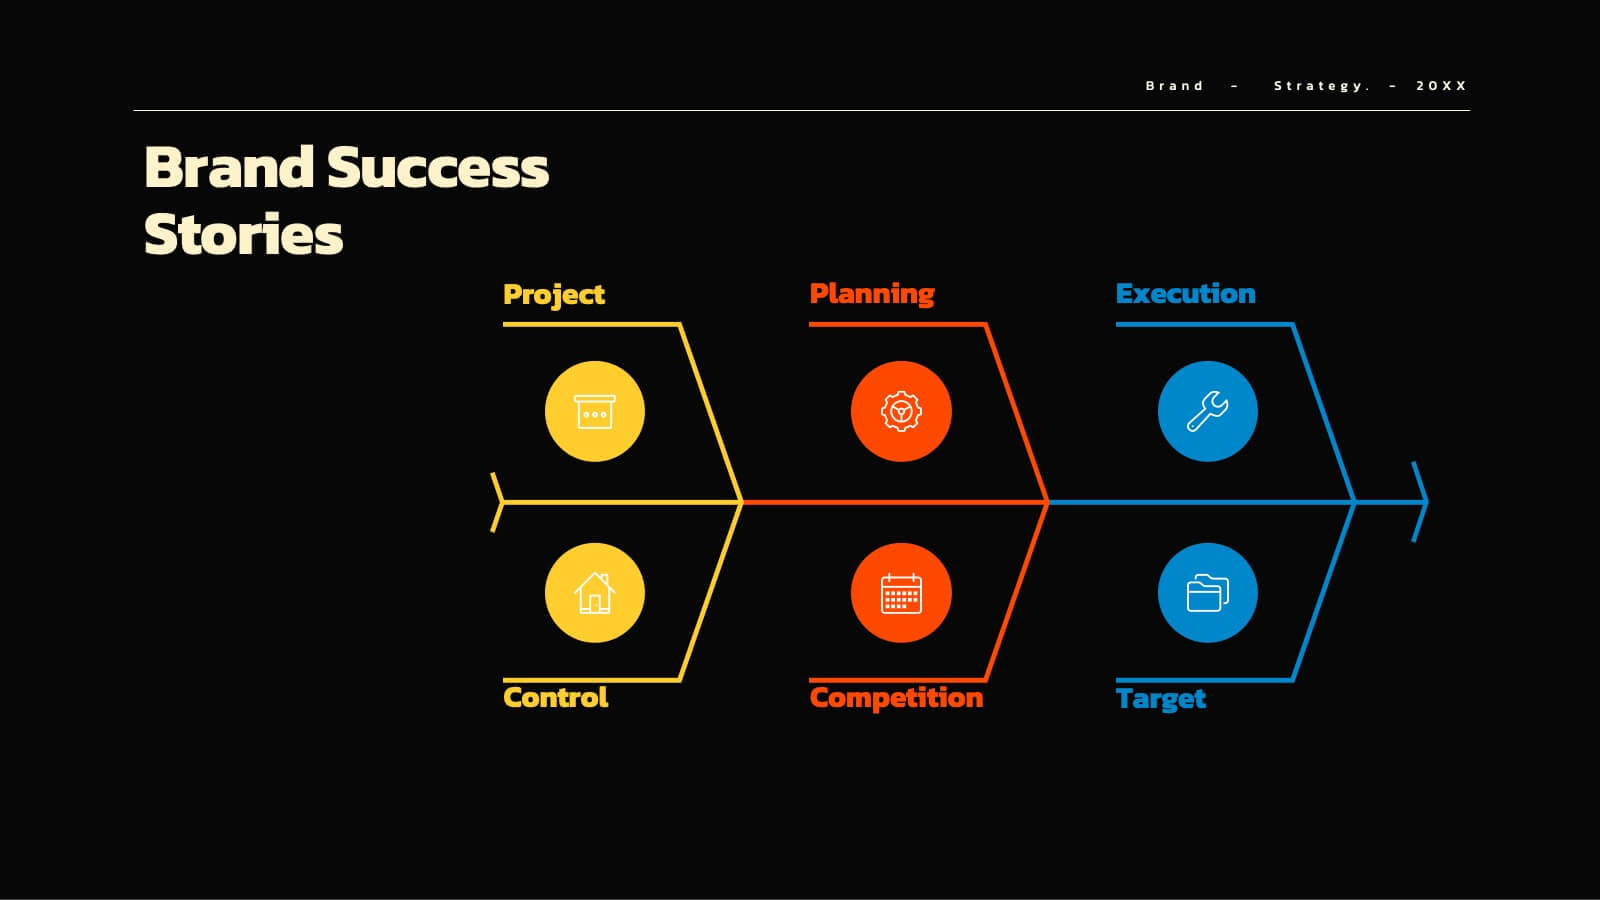
Risk Analysis Bowtie Diagram Presentation
Visualize threats, controls, and consequences effectively with the Risk Analysis Bowtie Diagram Presentation. This dynamic template illustrates cause-and-effect relationships using a bowtie structure, making it ideal for safety audits, project risk planning, or corporate strategy. Fully customizable in PowerPoint, Keynote, and Google Slides for any industry.


4 diapositivas
Service Plan Pricing Matrix Presentation
Present your pricing options clearly with this Service Plan Pricing Matrix Presentation. Designed for easy comparison, this layout highlights four tiers—Basic, Standard, Professional, and Expert—with bold pricing, checklists, and CTA buttons. Ideal for service providers, SaaS, and agencies. Fully editable in Canva, PowerPoint, Keynote, and Google Slides.


6 diapositivas
Investment Strategy Planning Presentation
The "Investment Strategy Planning Presentation" templates employ a clean and straightforward design with pentagon-shaped elements to visually represent various stages or components of investment strategies. Each template highlights key points with icons that effectively communicate the concept, making them especially useful for financial presentations where clarity and emphasis on specific financial strategies are crucial. This format supports a structured approach to presenting complex investment plans, helping to guide the audience through each phase of the strategy clearly and efficiently.