


Características


¿Tienes alguna pregunta?
Recomendar


6 diapositivas
SCRUM Methodology Infographic
Scrum is a widely used agile project management framework that helps teams work collaboratively to develop complex products. This infographic template is designed to provide a quick overview of SCRUM for teams, stakeholders, or anyone interested in understanding its fundamental concepts. This template is well-suited for projects where requirements are constantly changing or not fully known at the start. This is characterized by its iterative and incremental approach, enabling teams to deliver high-quality products in a flexible and adaptive manner. This is a popular agile methodology used in software development and project management.


4 diapositivas
School Administration and Curriculum Planning Presentation
Streamline academic operations with the School Administration and Curriculum Planning Diagram. This structured template helps educators, administrators, and school leaders effectively visualize curriculum structures, plan schedules, and organize school management tasks. Designed for clarity and efficiency, it ensures a seamless planning experience for any educational institution. Fully customizable and compatible with PowerPoint, Keynote, and Google Slides.


7 diapositivas
Loyalty Program Benefits Infographic
Unravel the perks of loyalty programs with our engaging infographic, elegantly crafted with hues of white, green, and purple. Designed to captivate and inform, this infographic shines a light on the myriad benefits loyalty programs can offer to businesses and consumers alike. Tailored for business owners, marketers, retail managers, and customer relationship professionals, our infographic becomes an invaluable tool to communicate the value of fostering customer loyalty. Seamlessly compatible with PowerPoint, Keynote, and Google Slides, presenting and sharing these insights has never been this easy and stylish.


7 diapositivas
Schedule Infographics Presentation Template
Featuring our Schedule Infographic template, this is a great tool for business owners, students and others who need to create an impactful presentation. Using this template will ensure that your main point is emphasized and can be easily understood by all of your viewers. This template includes different colors and fonts that can be easily edited and changed. This will help you visualize your existing data and create a presentation that includes all of your points. Use this template to make a professional and smart looking schedule, and present your plan to others in an easy to understand way.


4 diapositivas
Event Planning and Calendar Timeline Presentation
Plan smarter, not harder! This sleek timeline infographic is perfect for keeping your event plans organized and on track. Whether you're managing a multi-day conference or a team schedule, this visual template makes deadlines and tasks crystal clear. Fully compatible with PowerPoint, Keynote, and Google Slides for seamless editing and presentation.


6 diapositivas
Tree Diagrams Stats Infographics
Our Tree Diagram Stats infographic is a highly effective tool for Powerpoint, Keynote, and Google Slides presentations, designed to aid educators, data analysts, and project managers. This infographic is structured to visually represent hierarchical information, statistical data, and decision trees in a clear and logical format. The Tree Diagram Stats infographic is ideal for illustrating the breakdown of components in a system, the steps in a process, or the choices available in a decision-making scenario. Its organized design helps viewers trace the paths from a single starting point down through multiple branches, displaying the relationship between different levels of information. Using this infographic in your slides will greatly enhance the audience's understanding of complex data sets and decision-making processes. Whether you're detailing organizational structures, process flows, or probability outcomes, this infographic provides a professional and easy-to-understand approach to presenting detailed information. It's an essential addition to any presentation requiring a clear visual mapping of data or processes.


4 diapositivas
Business Decision-Making Framework Presentation
Visualize your path to smarter choices with this key-themed decision-making template. Ideal for strategy sessions, executive planning, or consulting presentations, it breaks down three core steps leading to actionable results. The layout emphasizes clarity and progression, with editable text zones and sleek icons. Works with PowerPoint, Keynote, and Google Slides.


8 diapositivas
Travel Planning and Itinerary Overview Presentation
Pack your bags—this stylish template makes mapping adventures a breeze! Designed for trip overviews and itinerary planning, it includes world maps, must-see lists, weather forecasts, and schedules all in one layout. Perfect for travel agencies, bloggers, or wanderlust planners. Fully compatible with PowerPoint, Keynote, and Google Slides for easy customization.


10 diapositivas
Leadership and Team Management Presentation
Enhance team leadership with the Leadership and Team Management presentation template. Featuring a structured layout with a clear hierarchy, this template helps illustrate management strategies, team roles, and leadership principles. Perfect for business leaders, HR professionals, and trainers. Fully customizable and compatible with PowerPoint, Keynote, and Google Slides.


21 diapositivas
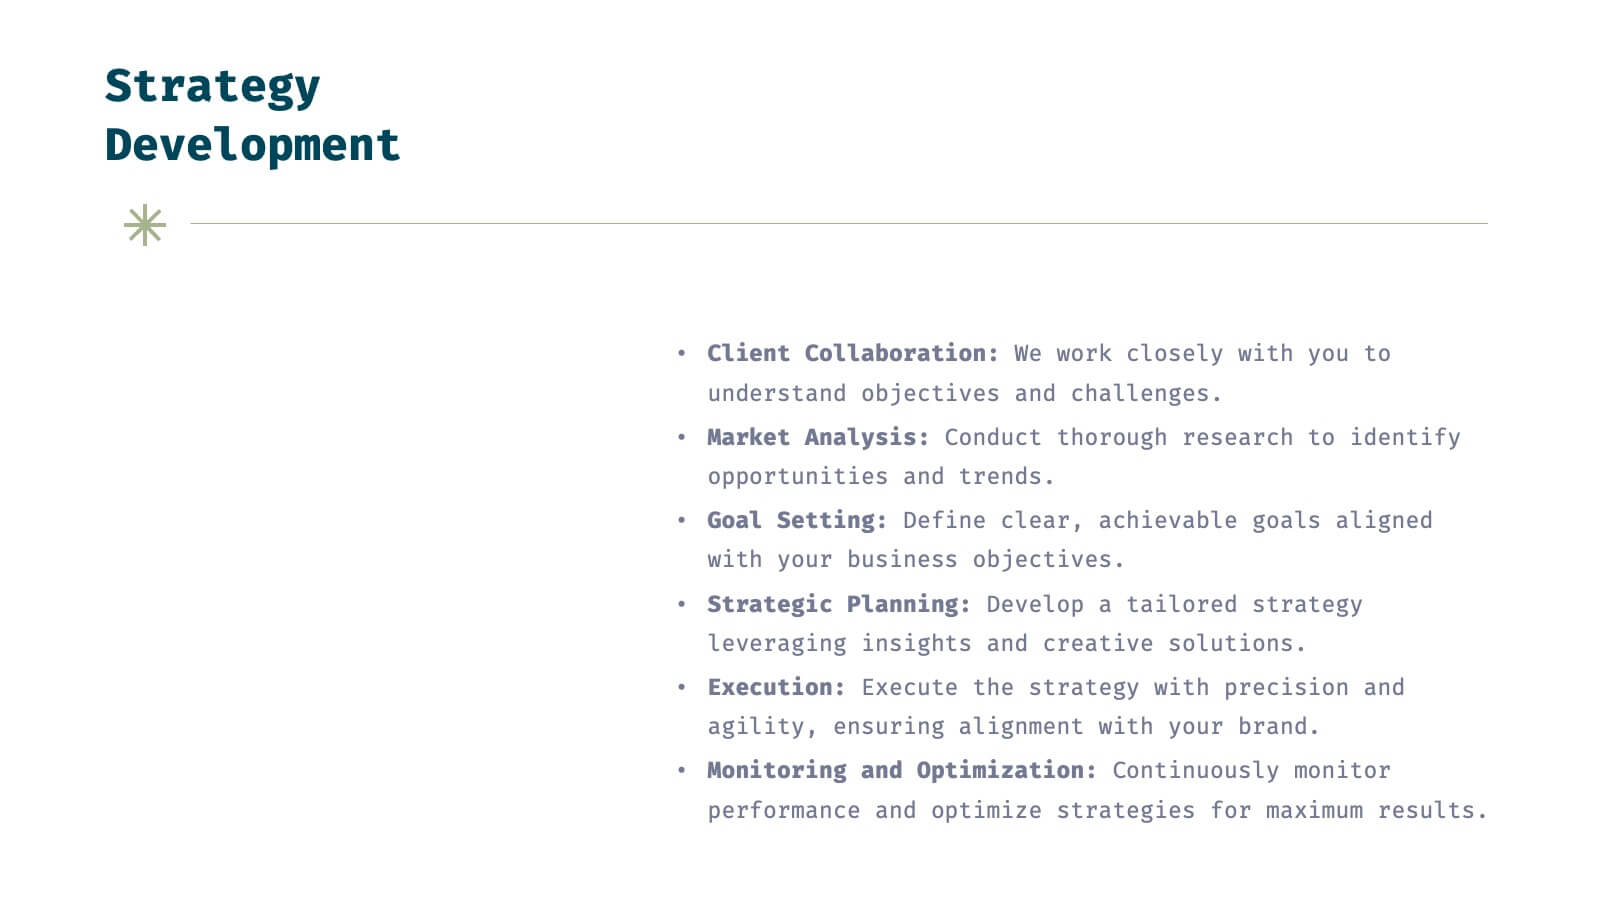
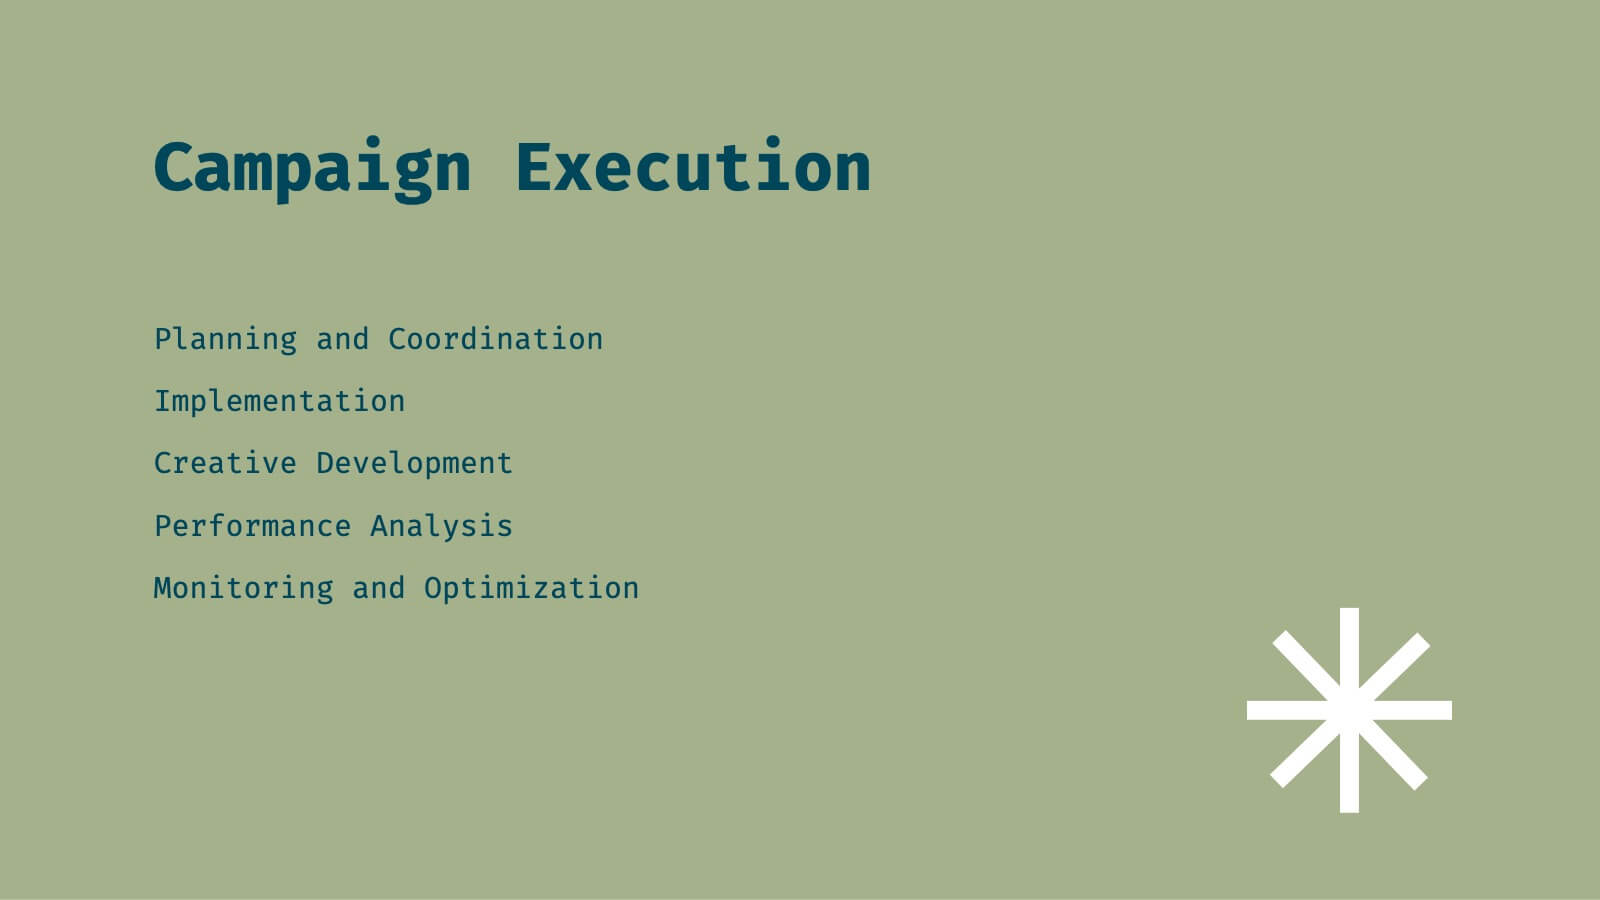
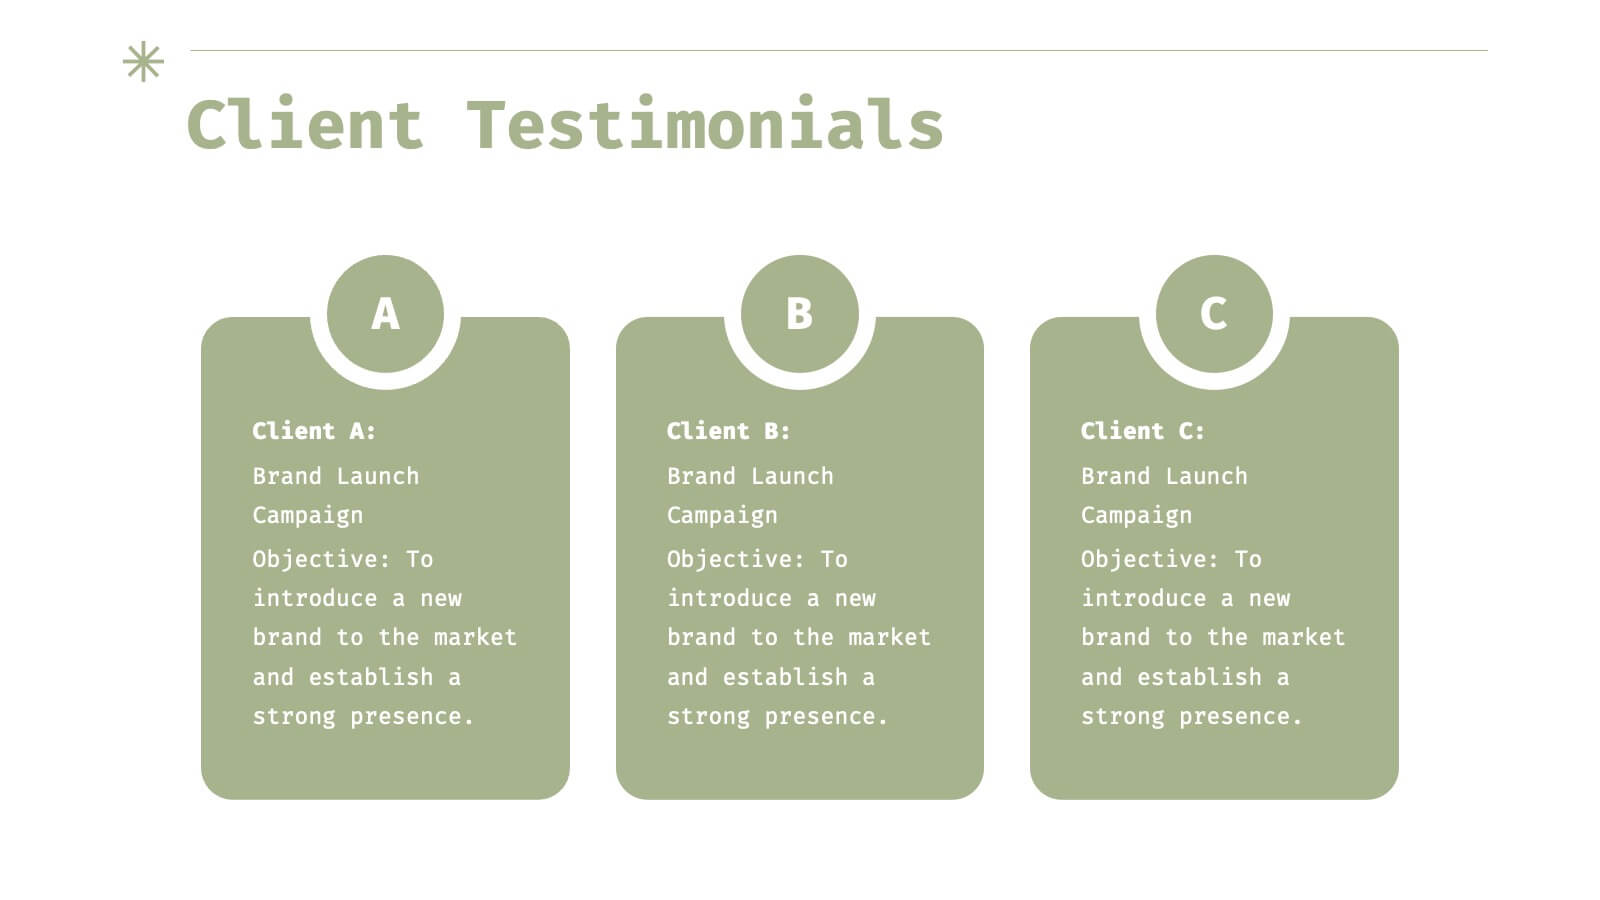
Helix Full-Service Agency Project Plan Presentation
Showcase your agency's expertise with this sophisticated, minimalistic presentation template. Designed to present comprehensive market analysis, strategy development, and client success stories, this template ensures your agency's capabilities are clearly communicated. Its clean design and professional layout make it perfect for building trust and credibility. Compatible with PowerPoint, Keynote, and Google Slides, it's versatile for any platform.


7 diapositivas
Target Market Advertising Infographic
Target market advertising, also known as target advertising or target marketing, is a strategy in marketing and advertising where promotional efforts are directed towards a specific and well-defined group of consumers who are most likely to be interested in a product or service. The goal of this infographic template is to tailor marketing messages and campaigns to resonate with the characteristics and preferences of your specific audience, thus increasing the effectiveness and efficiency of the marketing efforts. Fully customize the content, to educate about targeting the right audience for advertising presentations.


22 diapositivas
Cascade Brand Identity Presentation
Define and refine your brand with this brand identity presentation template, designed in deep blue tones. It covers all brand development aspects, from introduction to market analysis, brand values, and competitive landscape. Compatible with PowerPoint, Google Slides, and Keynote, it's ideal for creating a compelling brand narrative.


6 diapositivas
Future Trends in 5G Connectivity Presentation
Showcase the evolving landscape of mobile innovation with this modern 5G trends infographic. Featuring a central smartphone graphic and five vertically aligned icons, this slide is perfect for highlighting connectivity advancements, industry shifts, and upcoming opportunities. Color-coded markers enhance clarity for presentations on telecom, IoT, smart cities, and emerging tech. Fully editable in PowerPoint, Keynote, and Google Slides.


12 diapositivas
Corporate Hierarchy Structure Presentation
Showcase your Corporate Hierarchy Structure with a sleek and professional design. This template helps visualize organizational roles, reporting relationships, and team structures for clear communication. Perfect for HR teams, business leaders, and project managers, it’s fully customizable and compatible with PowerPoint, Keynote, and Google Slides for easy editing.


5 diapositivas
IT Infrastructure and Support Presentation
Optimize your IT presentations with the IT Infrastructure and Support Presentation template. Featuring a structured, step-by-step layout, this slide design visually conveys IT infrastructure processes, system support workflows, and key technology elements. Ideal for IT teams, tech consultants, and business professionals looking to illustrate complex IT strategies effectively. Fully editable in PowerPoint, Keynote, and Google Slides for seamless customization.


5 diapositivas
Market Growth Strategies in North America Map Presentation
Unveil regional growth opportunities with the Market Growth Strategies in North America Map template, which provides a strategic layout for presenting business growth metrics across various regions.This template includes data-driven graphs to visualize performance and strategy deployment effectively. It's designed to aid professionals in making informed decisions and is compatible with PowerPoint, Keynote, and Google Slides.


22 diapositivas
Athena Creative Design Report Presentation
Showcase your creative projects with this vibrant design report template! Highlight objectives, concept development, prototypes, and design iterations with sleek visuals. Perfect for designers and creative teams. Compatible with PowerPoint, Keynote, and Google Slides.