


Características


¿Tienes alguna pregunta?
Recomendar


6 diapositivas
Orientation Plan for New Employees Presentation
Welcome your new team members with confidence using a visually clear, step-based layout that streamlines the introduction process. This presentation helps HR leaders outline company values, roles, and expectations with ease and professionalism. Fully compatible with PowerPoint, Keynote, and Google Slides for effortless editing and presentation across any platform.


26 diapositivas
Roaster Presentation Template
Are you interested in knowing about the best coffee in town? Roaster is a fresh and bold template perfect for marketing. This template will be sure to make your services and products stand out. The background stays in theme with coffee tone colors and many pictures. Overall Roaster can help you make any kind of presentation you need and help you create a professional online presence. This template is a great starting point for creating an impressive sales page. You'll be able to quickly add in your information and customize this template to display a captivating presentation.


6 diapositivas
Informational Data Table Overview Presentation
Present your tasks with clarity using this Informational Data Table Overview presentation. Perfect for team planning, status updates, or project management, this slide helps you organize tasks by name, due date, priority, and assignment. Visual indicators make it easy to track progress at a glance. Fully editable in PowerPoint, Canva, and Google Slides.


6 diapositivas
Customer Journey Mapping with Buyer Persona Presentation
Clearly visualize the customer experience across all touchpoints with this structured journey mapping slide. Featuring a central buyer persona graphic and six customizable steps with icons, this layout helps you break down each stage of the customer path. Perfect for UX strategy, customer service insights, and product development. Fully editable and compatible with PowerPoint, Keynote, and Google Slides.


19 diapositivas
Fableia Marketing Research Report Presentation
Deliver data-driven insights with a professional and visually engaging marketing research report presentation. This template is tailored for marketing professionals, agencies, and businesses looking to showcase research findings with precision and clarity. Highlight key sections such as market trends, consumer behavior analysis, and campaign performance using dynamic visuals and well-structured layouts. Share your insights on emerging technologies, social media strategies, and customer targeting with easy-to-edit graphs, charts, and infographics. Use dedicated slides for SEO analytics, value propositions, and recommendations to present actionable strategies that resonate with your audience. This template is fully customizable and works seamlessly with PowerPoint, Google Slides, and Keynote, ensuring you can adapt it to your unique needs. Present your research with confidence and leave a lasting impact on stakeholders and decision-makers.


8 diapositivas
Marketing Plan and Audience Targeting Presentation
Visualize your audience segmentation strategy with the Marketing Plan and Audience Targeting Presentation. This bullseye diagram template highlights three key focus areas, making it ideal for showcasing market research, targeting tactics, or funnel stages. Fully editable in Canva, PowerPoint, Keynote, and Google Slides to match your branding and goals.


8 diapositivas
Success Strategy Triangle Presentation
Craft a winning strategy with the Success Strategy Triangle template. This structured design helps visualize key business components in a step-by-step format, making it ideal for growth planning, decision-making, and performance analysis. Fully customizable and easy to use, it’s compatible with PowerPoint, Keynote, and Google Slides for seamless integration.


4 diapositivas
Customer Buyer Persona Profile Presentation
Bring your audience into the mind of your ideal customer with a clean, story-driven layout that highlights demographics, motivations, and everyday habits. This presentation helps you communicate who you’re targeting and why it matters, creating clarity for marketing and product teams. Fully compatible with PowerPoint, Keynote, and Google Slides.


5 diapositivas
Revenue Streams & Expense Management Layout Presentation
Visualize your income and costs with the Revenue Streams & Expense Management Layout Presentation. This slide layout uses a vertical arrow chart to display four data categories, ideal for comparing sources of income and related expenditures. Great for financial reports, budgeting reviews, and strategy discussions. Compatible with Canva, PowerPoint, Google Slides, and Keynote.


24 diapositivas
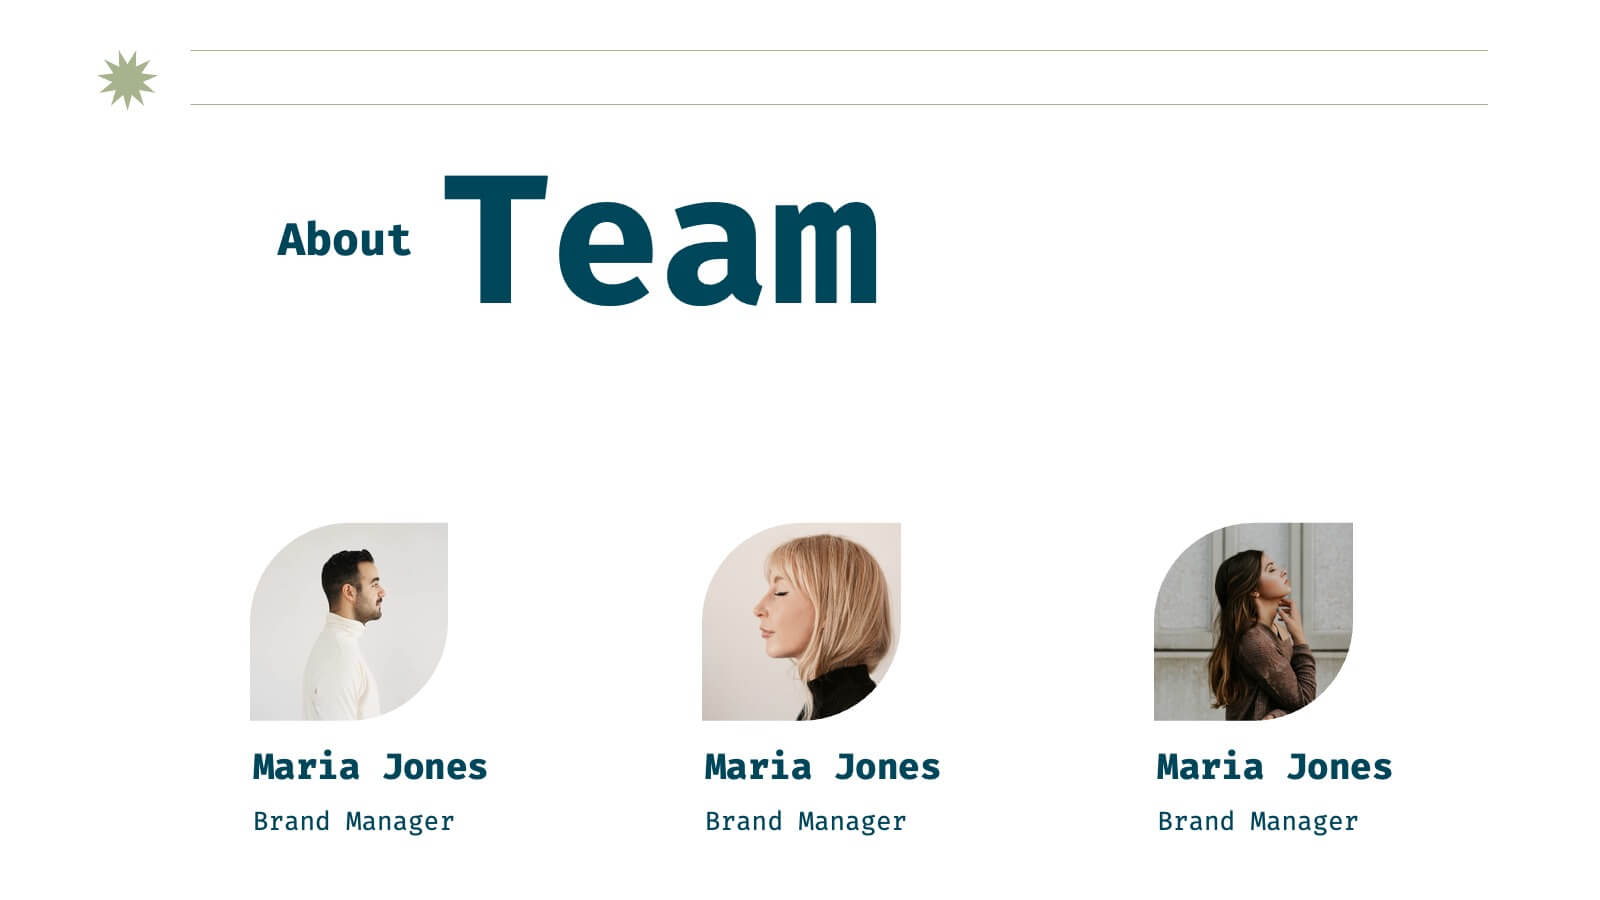
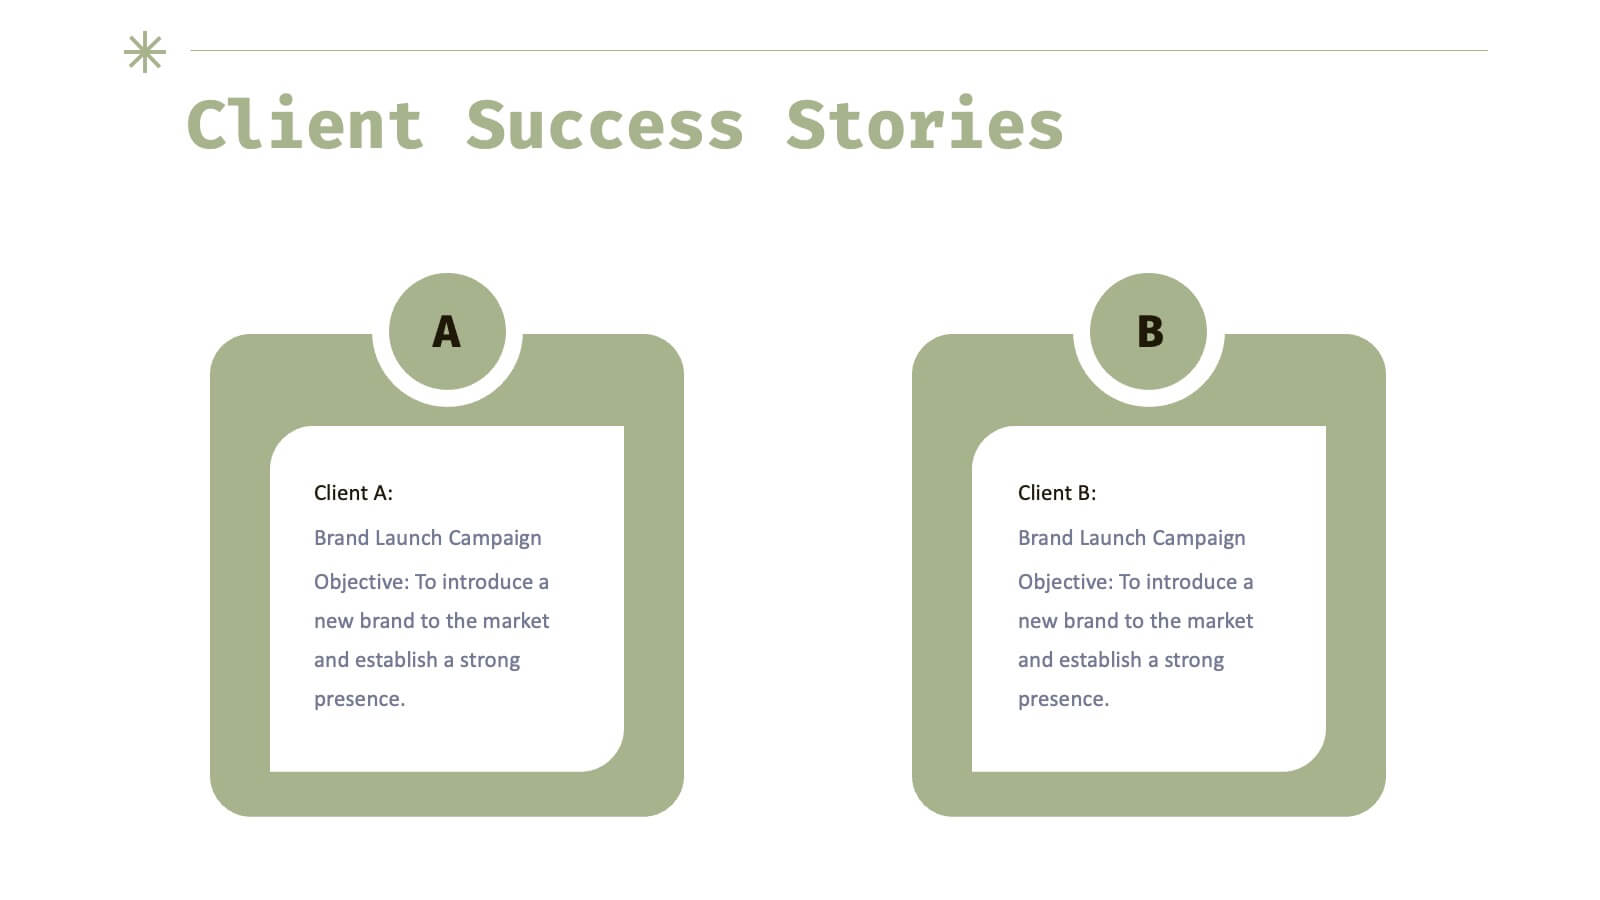
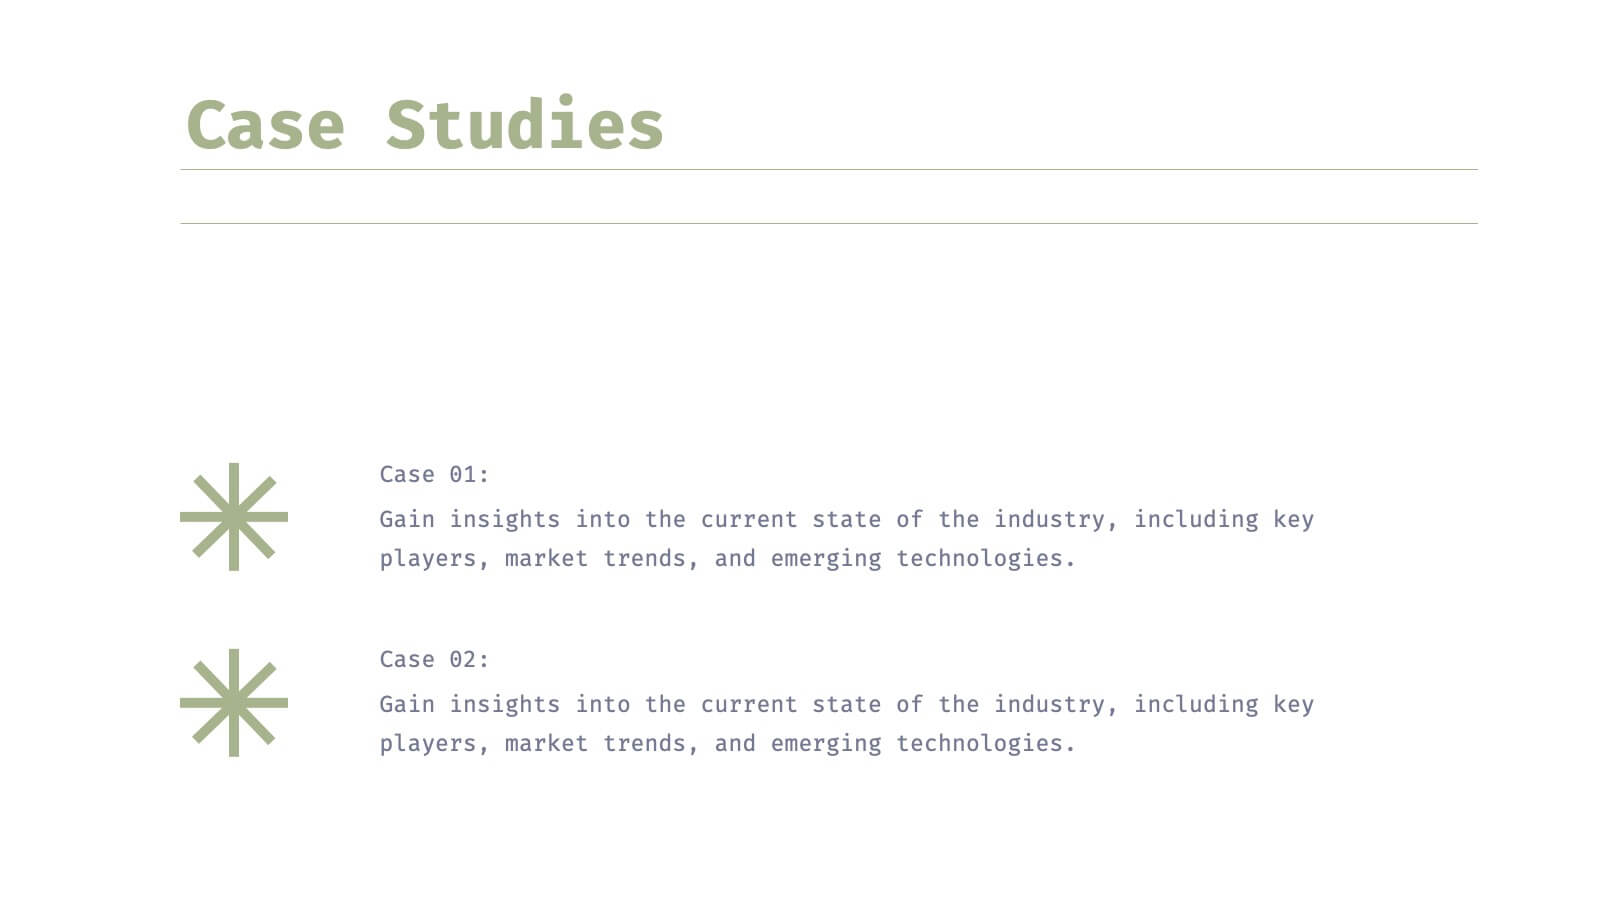
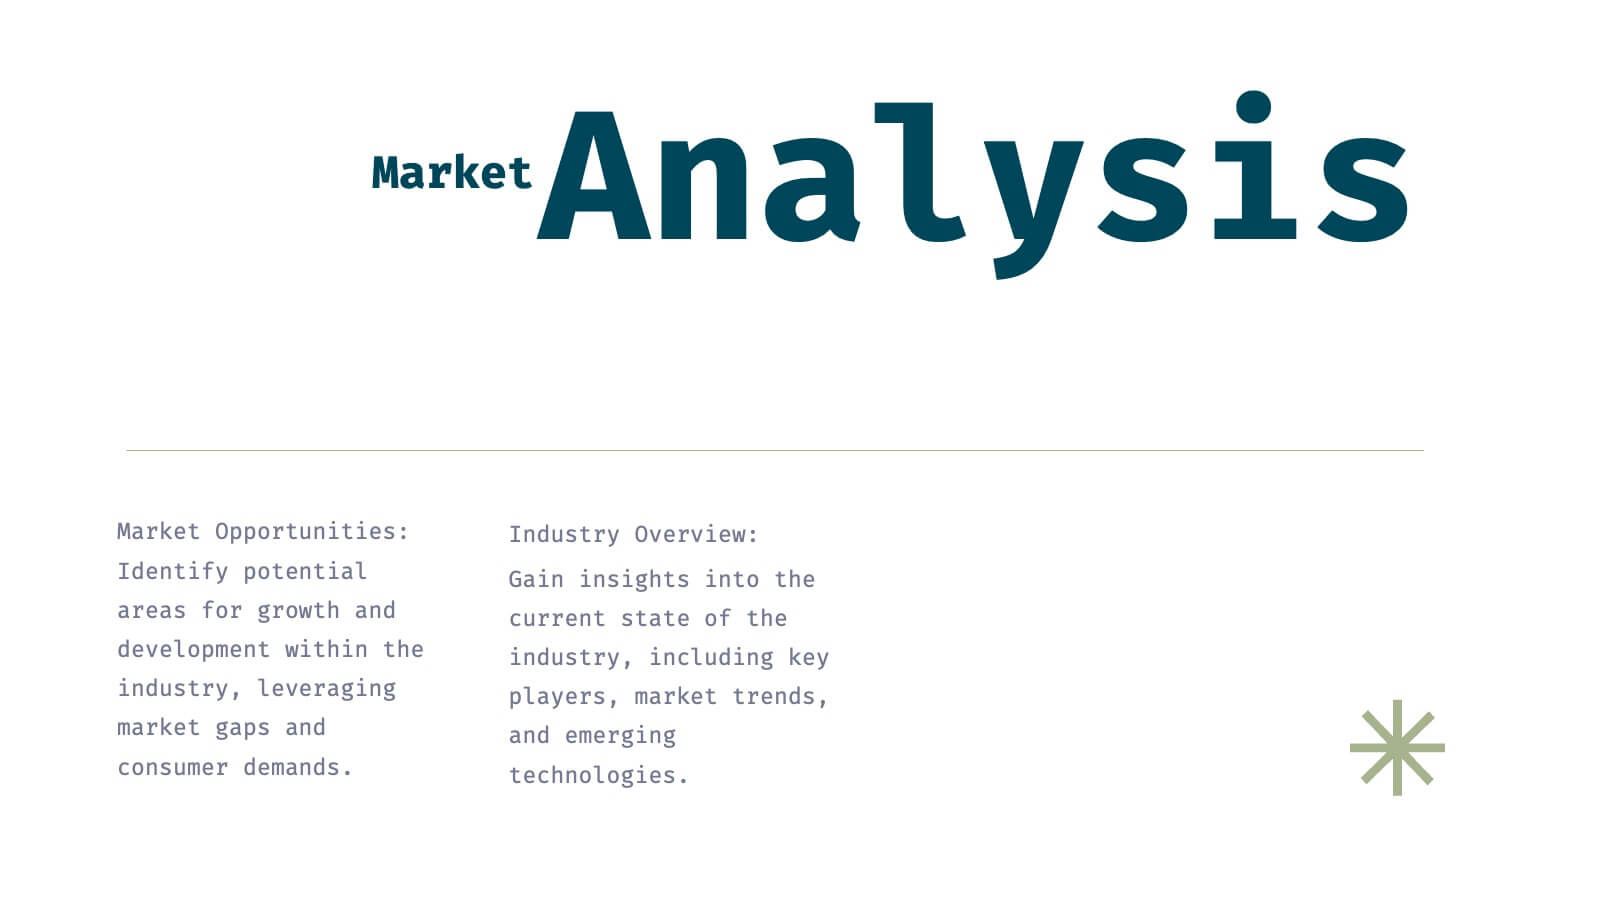
Djinn Brand Identity Presentation
Unleash the power of your brand with this sleek and modern presentation template! From brand identity components to target audience personas, this template covers everything you need to craft a cohesive and compelling brand strategy. Whether showcasing brand guidelines or success stories, it’s designed for maximum clarity and impact. Compatible with PowerPoint, Keynote, and Google Slides for effortless presentations.


20 diapositivas
Odyssey Marketing Proposal Presentation
Pitch your ideas confidently with this modern and visually striking marketing proposal presentation template. Featuring sections for project summary, goals, timeline, budget breakdown, and team expertise, it’s designed to engage and inform stakeholders. Fully compatible with PowerPoint, Keynote, and Google Slides for a seamless presentation experience.


22 diapositivas
Simple Pitch Deck Presentation
Streamline your pitch process with this no-frills Pitch Deck template, designed for clear communication and powerful impact. From the get-go, the cover slide clearly announces your purpose, inviting audiences into your business narrative. The template smoothly transitions from one slide to the next, each one a stepping stone in building your case — from problem to solution. It includes a neatly organized table of contents, thought-provoking mission and vision statements, and data-rich slides for a deep dive into your business metrics. Each section, marked with bold, numbered headers, keeps your presentation on track and your audience engaged. A final 'Thank You' slide adds a touch of professionalism, and the credits section ensures that your sources are transparently acknowledged. This pitch deck is ideal for startups and businesses looking to capture attention and convey their story succinctly.


4 diapositivas
Customers Journey Map Presentation
Take your audience on a smooth, visual adventure that clearly outlines each stage of the customer experience. This presentation helps you map behaviors, highlight key interactions, and explain decision points with clarity and style. Designed for easy customization and fully compatible with PowerPoint, Keynote, and Google Slides.


4 diapositivas
Preventive Health Services Layout Presentation
Make health data more human with this modern infographic layout for service-based reporting. This preventive health slide design clearly maps wellness categories to body parts, making it easy to communicate medical insights and early intervention strategies. Fully editable and compatible with PowerPoint, Keynote, and Google Slides for smooth integration into any deck.


23 diapositivas
Blade Corporate Strategy Proposal Presentation
Prepare to captivate your audience with the Blade Corporate Strategy Proposal template! This sleek and modern design is perfect for professionals looking to present their strategic objectives with clarity and impact. The template features a balanced color palette of blue and white, exuding professionalism while ensuring your content stands out. From analyzing the current landscape to outlining key challenges and growth opportunities, each slide is meticulously crafted to convey your strategic vision effectively. The clean layout ensures that complex data, such as SWOT analysis, performance metrics, and competitive analysis, is easily digestible. With dedicated sections for team roles, resource allocation, and timelines, this template helps you guide your audience through every step of your strategic plan. Fully compatible with PowerPoint, Keynote, and Google Slides, the Blade template is your go-to choice for delivering presentations that resonate with decision-makers and stakeholders alike.


6 diapositivas
Customer Value Proposition Framework Presentation
Clarify your business offering with the Customer Value Proposition Framework Presentation. This template is designed to help you align your products or services with customer needs through a side-by-side visual of the Value Proposition Canvas. Highlight pain points, customer gains, and how your solution uniquely addresses them. Fully customizable in PowerPoint, Keynote, and Google Slides. Perfect for marketers, product managers, and strategic planning teams.


5 diapositivas
Identifying Problems in Projects Presentation
Kickstart your analysis with a bold, colorful layout that makes uncovering project issues feel clear and structured. This presentation helps you outline challenges, compare causes, and guide teams toward practical solutions using a simple, organized flow. Fully compatible with PowerPoint, Keynote, and Google Slides.