


Características


¿Tienes alguna pregunta?
Recomendar


7 diapositivas
Europe Countries Map Infographic
This Europe Countries Map infographic template is a versatile presentation tool for showcasing various data across European nations. The template is fully compatible with PowerPoint, Google Slides, and Keynote and features different infographic styles, such as color-coded maps, bar charts, and statistical representations. It is perfect for displaying country-specific information like population size, economic statistics, or any other relevant data. The clear and concise design ensures that viewers can easily interpret the information, making it suitable for educators, students, business professionals, and anyone needing to present European data in an engaging and informative manner.


6 diapositivas
Concentric Circles Strategy Infographics
Visualize your strategic approach with our Concentric Circles Strategy infographic template. This template is fully compatible with popular presentation software like PowerPoint, Keynote, and Google Slides, allowing you to easily customize it to illustrate and communicate your concentric circles strategy. The Concentric Circles Strategy infographic template offers a visually engaging platform to depict your strategy's core, intermediate, and peripheral elements. Whether you're a business leader, strategist, or planner, this template provides a user-friendly canvas to create informative presentations and effectively communicate your strategic vision. Enhance your strategic planning with this SEO-optimized Concentric Circles Strategy infographic template, thoughtfully designed for clarity and ease of use. Customize it to highlight the key components of your concentric circles strategy, ensuring that your team and stakeholders grasp the strategic direction clearly. Start crafting your personalized infographic today to drive alignment and execution of your strategic goals.


4 diapositivas
Corporate Growth and Strategy Map Presentation
Visualize your business development path with this layered strategy map. Ideal for showcasing organizational goals, strategic initiatives, and cascading growth stages. Each level is clearly structured for easy customization, making it perfect for leadership planning, corporate roadmaps, or strategic reviews in PowerPoint, Keynote, or Google Slides.


4 diapositivas
Employee Training Needs Skills Gap
Train to close the gap. This Employee Training Needs Skills Gap slide makes it easy to visualize where employees are now, where they need to be, and the learning journey in between. TFully customizable for PowerPoint, Keynote, and Google Slides.


5 diapositivas
Sports Legends Infographics
Sport Legends play a significant role in inspiring and motivating aspiring athletes to achieve their goals. These Infographics can provide an educational and visually appealing way to showcase the accomplishments and achievements of some of the greatest athletes in history. These infographics can highlight specific individuals, teams, or eras, and can include statistics, records, awards, and other notable accomplishments. All the design elements are customizable and can include illustrations of the athletes, logos or team colors, and text boxes to highlight statistics and provide additional information.


6 diapositivas
SCRUM Methodology Infographic
Scrum is a widely used agile project management framework that helps teams work collaboratively to develop complex products. This infographic template is designed to provide a quick overview of SCRUM for teams, stakeholders, or anyone interested in understanding its fundamental concepts. This template is well-suited for projects where requirements are constantly changing or not fully known at the start. This is characterized by its iterative and incremental approach, enabling teams to deliver high-quality products in a flexible and adaptive manner. This is a popular agile methodology used in software development and project management.


4 diapositivas
Colorful Workflow Process Chart Presentation
Bring your workflow to life with a vibrant, easy-to-follow layout that makes every stage feel connected and purposeful. This presentation helps you map processes, explain team roles, and simplify complex steps using a clean, visual flow. Fully compatible with PowerPoint, Keynote, and Google Slides.


7 diapositivas
Asia Regions Map Infographic
Embark on a visual journey across the vast and diverse continent of Asia with our meticulously crafted map infographic. Painted in the cultural richness of red, the depth of blue, and the clarity of white, our template captures the essence of Asia in all its glory. Adorned with pinpoint infographics, symbolic icons, and region-specific image placeholders, it serves as a comprehensive guide to Asia's multifaceted landscape. Impeccably designed for Powerpoint, Keynote, or Google Slides. An indispensable resource for educators, travelers, researchers, or businesses venturing into the Asian market. Explore with purpose; let every slide be a step into Asia's vibrant tapestry.


6 diapositivas
Academic Science Infographic Presentation
Bring your scientific insights to life with a clean, engaging slide that turns complex concepts into an easy-to-follow visual story. This presentation highlights key academic data through connected icons and structured text, helping you explain research findings clearly and confidently. Fully compatible with PowerPoint, Keynote, and Google Slides.


6 diapositivas
Project Management Responsibility Assignment Matrix Infographics
Effectively assign responsibilities in your projects with our Project Management Responsibility Assignment Matrix (RAM) infographic template. This template is fully compatible with popular presentation software like PowerPoint, Keynote, and Google Slides, allowing you to easily customize it to illustrate and communicate the roles and responsibilities of team members in your project. The Project Management RAM infographic template offers a visually engaging platform to outline the key tasks, deliverables, and responsibilities of project team members. Whether you're a project manager, team leader, or involved in project planning, this template provides a user-friendly canvas to create informative presentations and project management materials. Optimize your project management processes with this SEO-optimized Project Management RAM infographic template, thoughtfully designed for clarity and ease of use. Customize it to showcase the matrix structure, define roles (RACI), and ensure that everyone on the team understands their responsibilities, ensuring efficient project execution. Start crafting your personalized infographic today to excel in project management responsibility assignment.


6 diapositivas
RAPID Responsibility Matrix Infographics
Efficiently manage responsibilities and tasks with our RAPID Responsibility Matrix infographic template. This template is fully compatible with popular presentation software such as PowerPoint, Keynote, and Google Slides, allowing you to easily customize it to meet your specific project needs. The RAPID Responsibility Matrix infographic template offers a structured framework for defining roles and responsibilities within your team or organization. Whether you're a project manager, team leader, or simply looking to streamline workflows, this template provides a user-friendly platform to create clear and concise matrices for your projects. Optimize your project management processes with this SEO-optimized RAPID Responsibility Matrix infographic template, thoughtfully designed for clarity and ease of use. Customize it to assign and communicate responsibilities effectively, ensuring smooth collaboration and project success. Start crafting your personalized infographic today!


6 diapositivas
Cloud Computing Basics Presentation
Bring clarity to the digital world with this sleek and modern template designed to explain online data systems and cloud structures. Perfect for showcasing storage models, connectivity, and IT workflows with simplicity and style. Fully editable and compatible with PowerPoint, Keynote, and Google Slides for seamless customization.


5 diapositivas
Fitness Trainings Infographics
Fitness Training refers to structured physical activities or exercises designed to improve and maintain physical fitness, overall health, and athletic performance. Using these infographic templates, you can effectively educate your audience about different fitness training techniques, inspire them to adopt a healthy and active lifestyle, and provide them with practical tips and guidance for their fitness journey. These are designed to showcase various fitness training concepts, techniques, and tips. Whether you're a fitness instructor, personal trainer, or fitness enthusiast, this template is a valuable resource to educate and motivate your audience about fitness training.


7 diapositivas
Target Market Advertising Infographic
Target market advertising, also known as target advertising or target marketing, is a strategy in marketing and advertising where promotional efforts are directed towards a specific and well-defined group of consumers who are most likely to be interested in a product or service. The goal of this infographic template is to tailor marketing messages and campaigns to resonate with the characteristics and preferences of your specific audience, thus increasing the effectiveness and efficiency of the marketing efforts. Fully customize the content, to educate about targeting the right audience for advertising presentations.


7 diapositivas
Gap Analysis Skills Infographic
Gap analysis in a skills context is a process of evaluating the difference or "gap" between the current skills and competencies of an individual or a team and the desired or required skills for a particular role, project, or goal. This infographic template is a crucial tool for personal and professional development, talent management, and strategic planning within organizations. This captivating visual is designed to help individuals and organizations bridge the skills gap effectively. This infographic serves as a compass, guiding you through the essential steps needed to identify, analyze, and close the skills gaps within your organization.


22 diapositivas
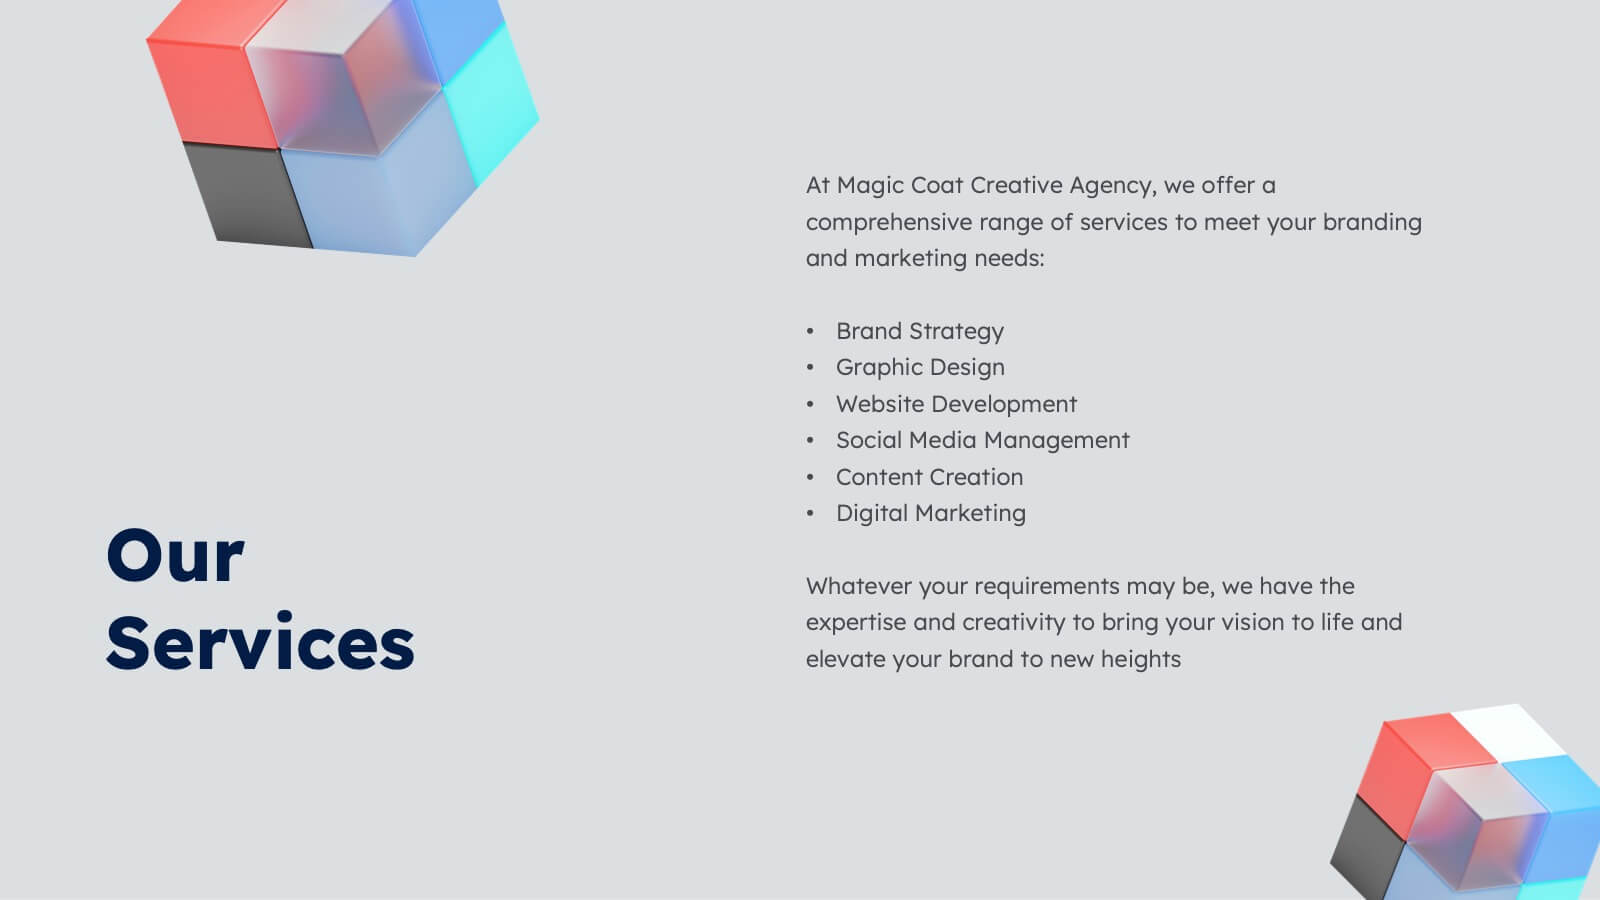
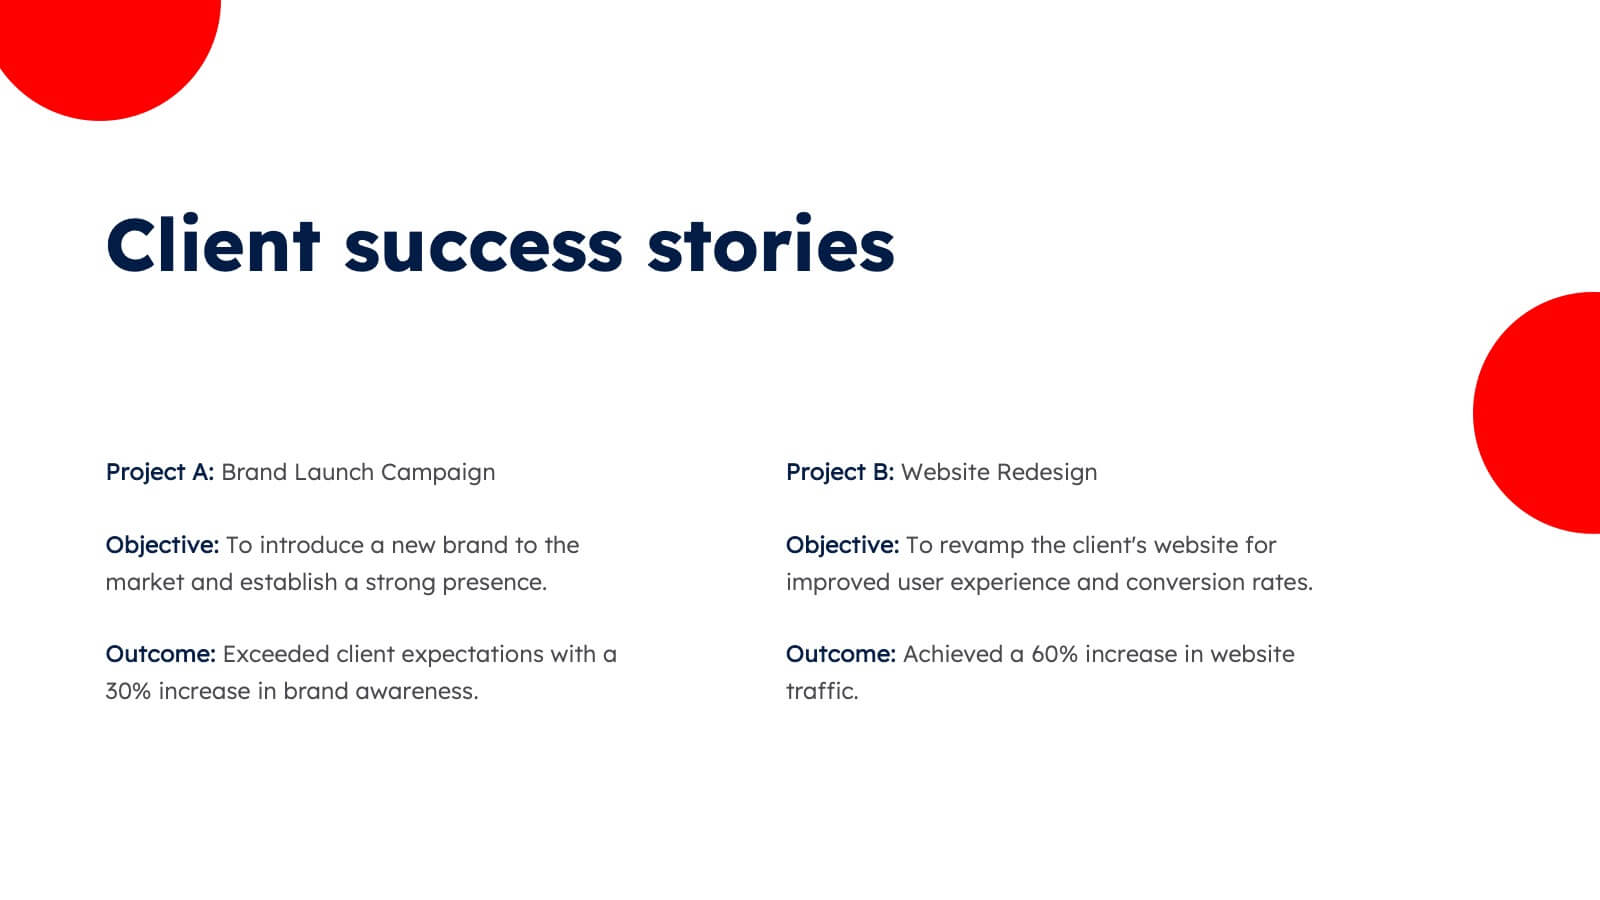
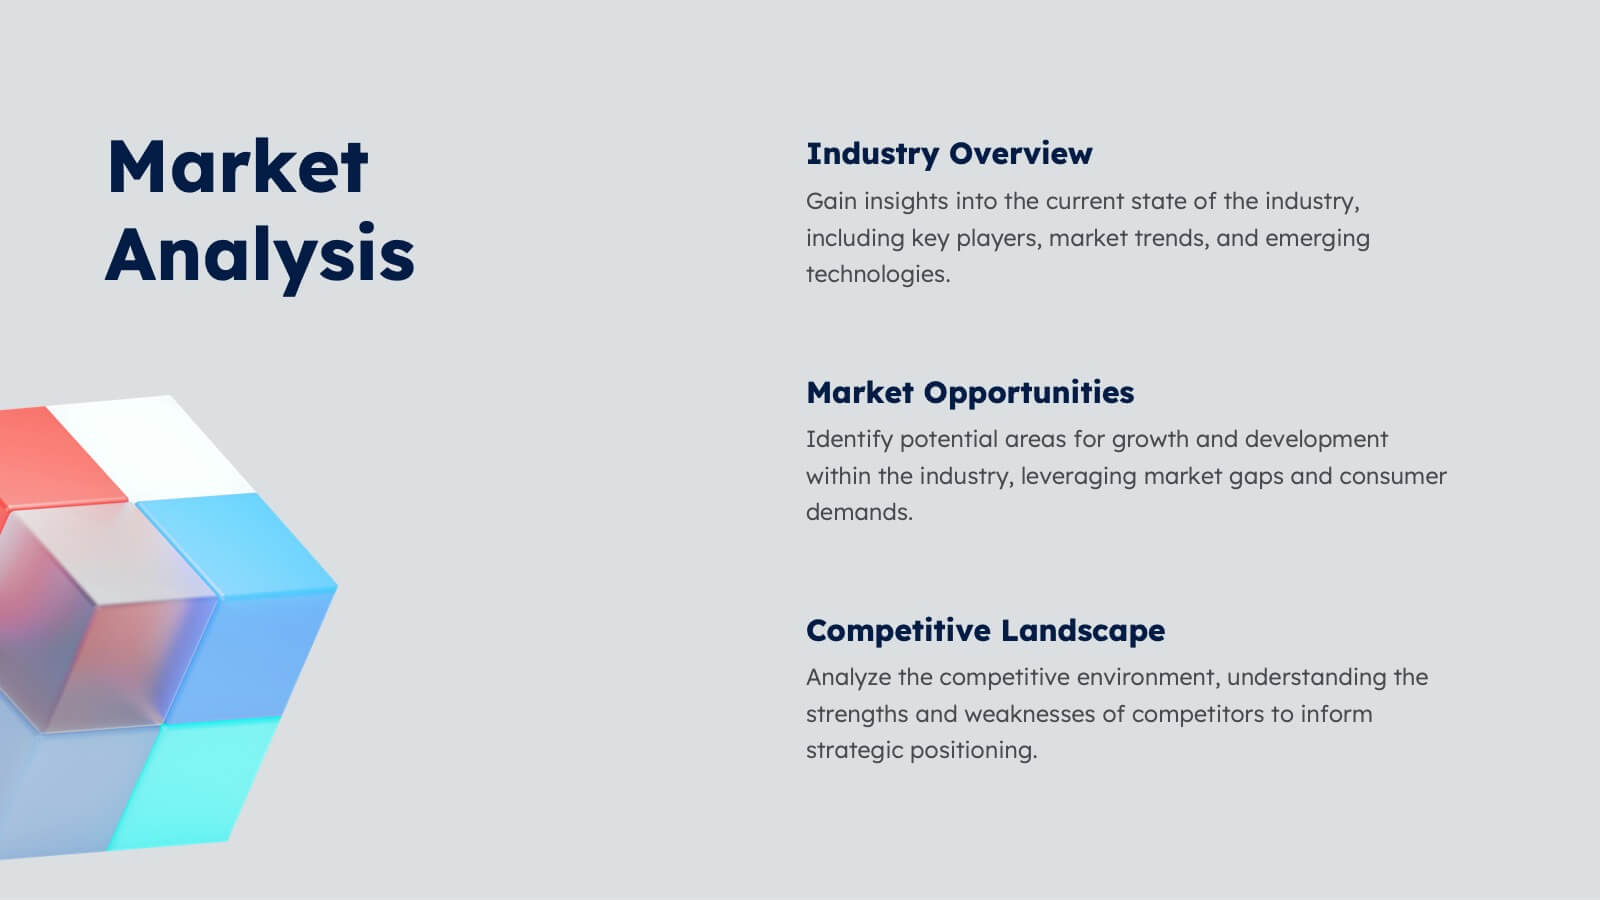
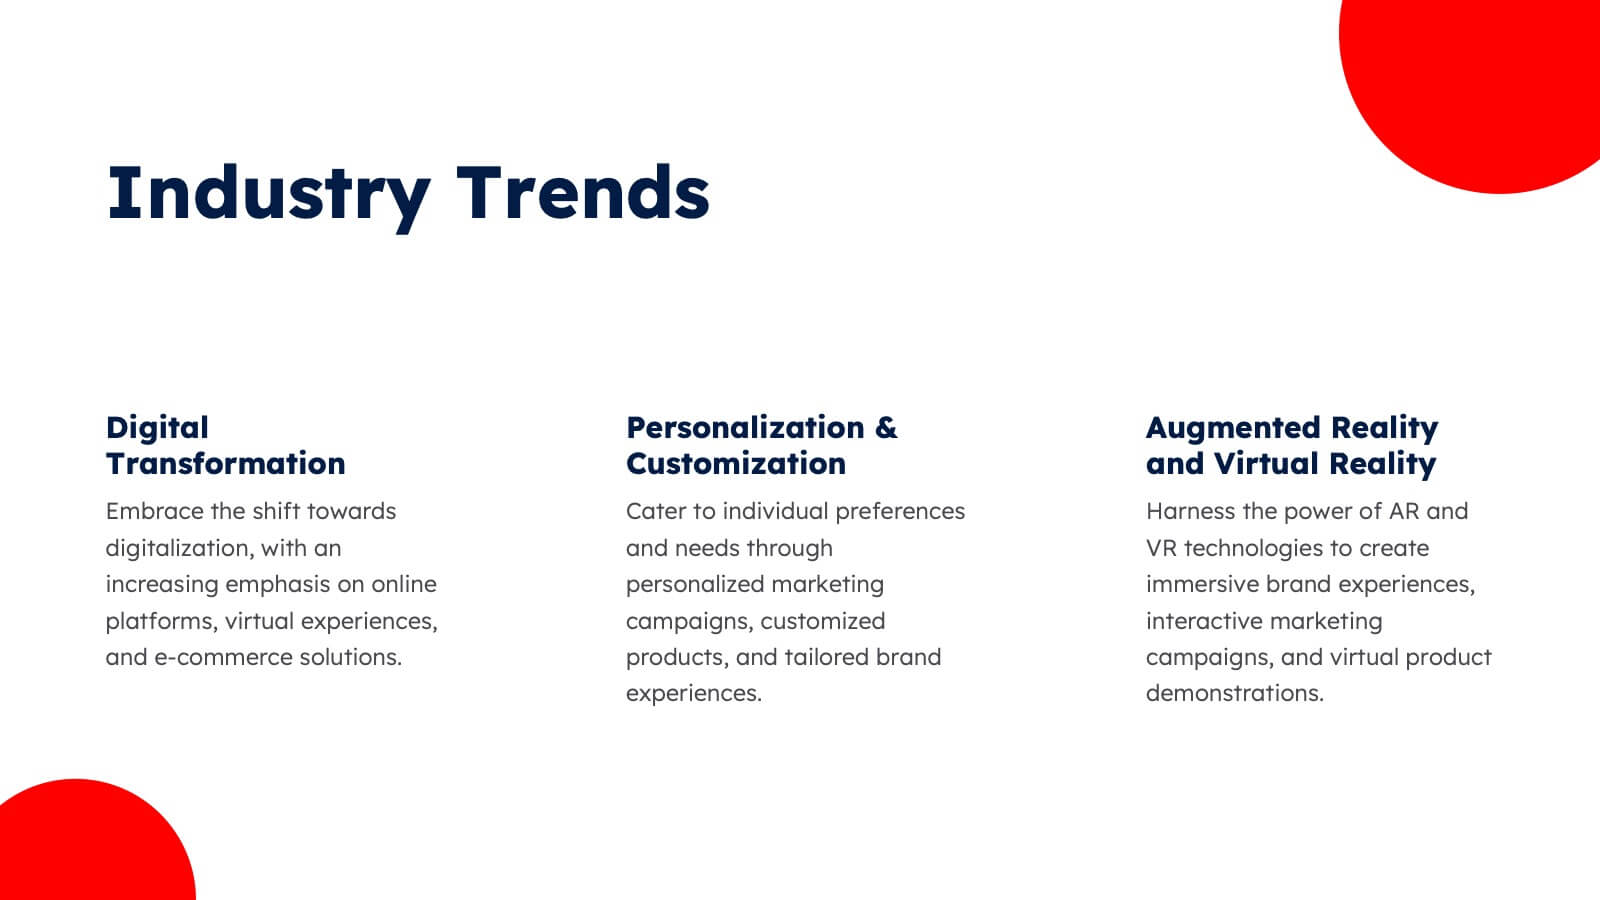
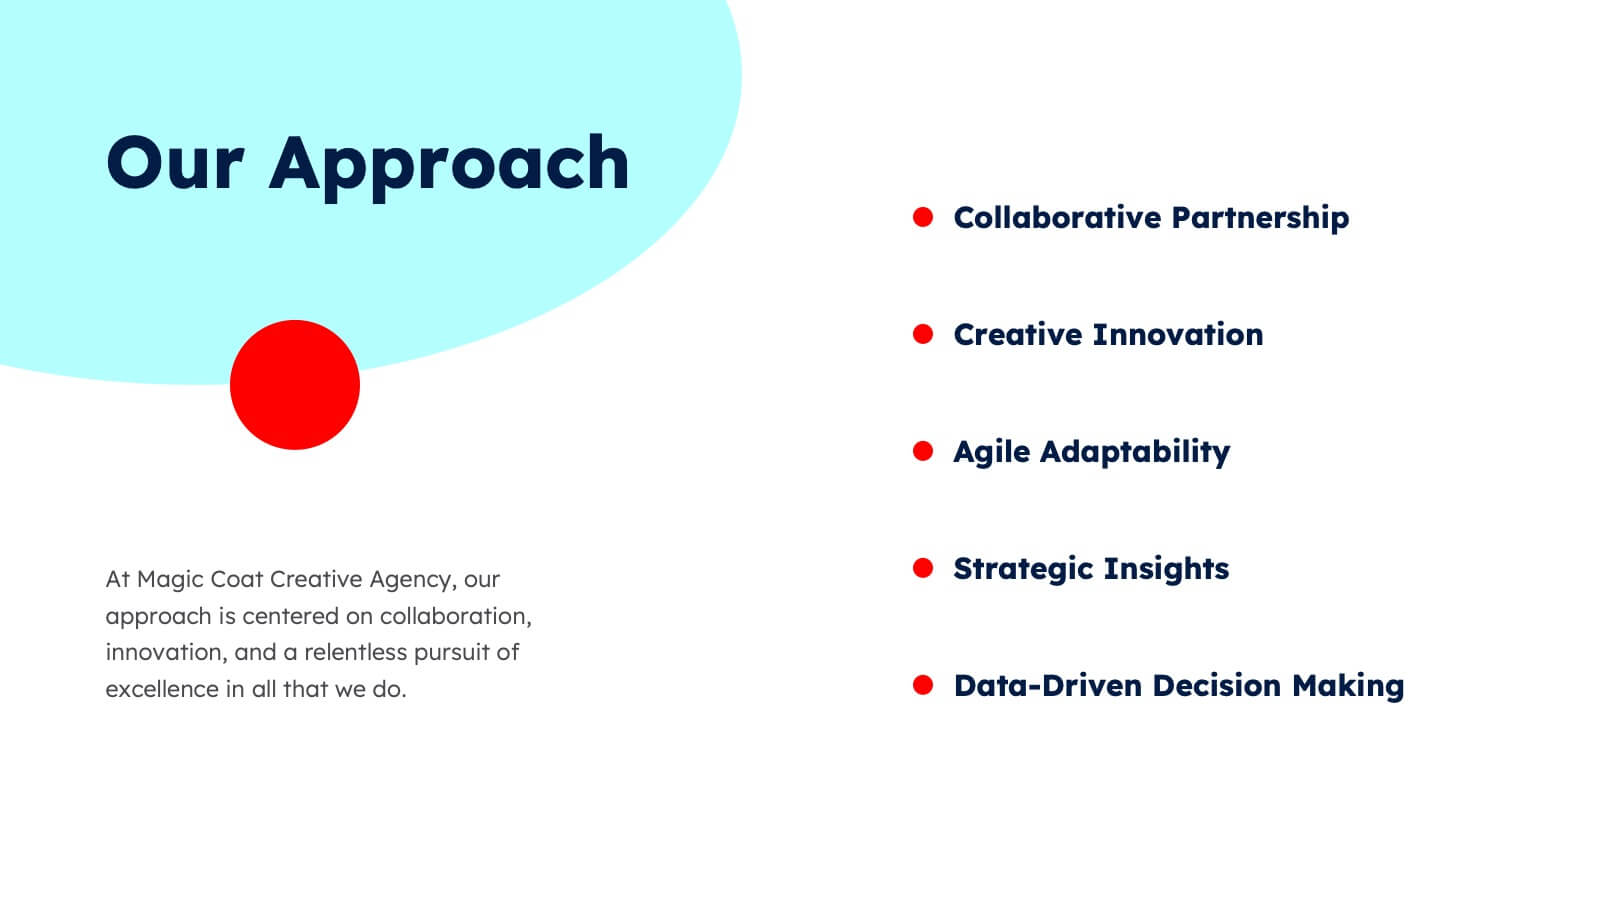
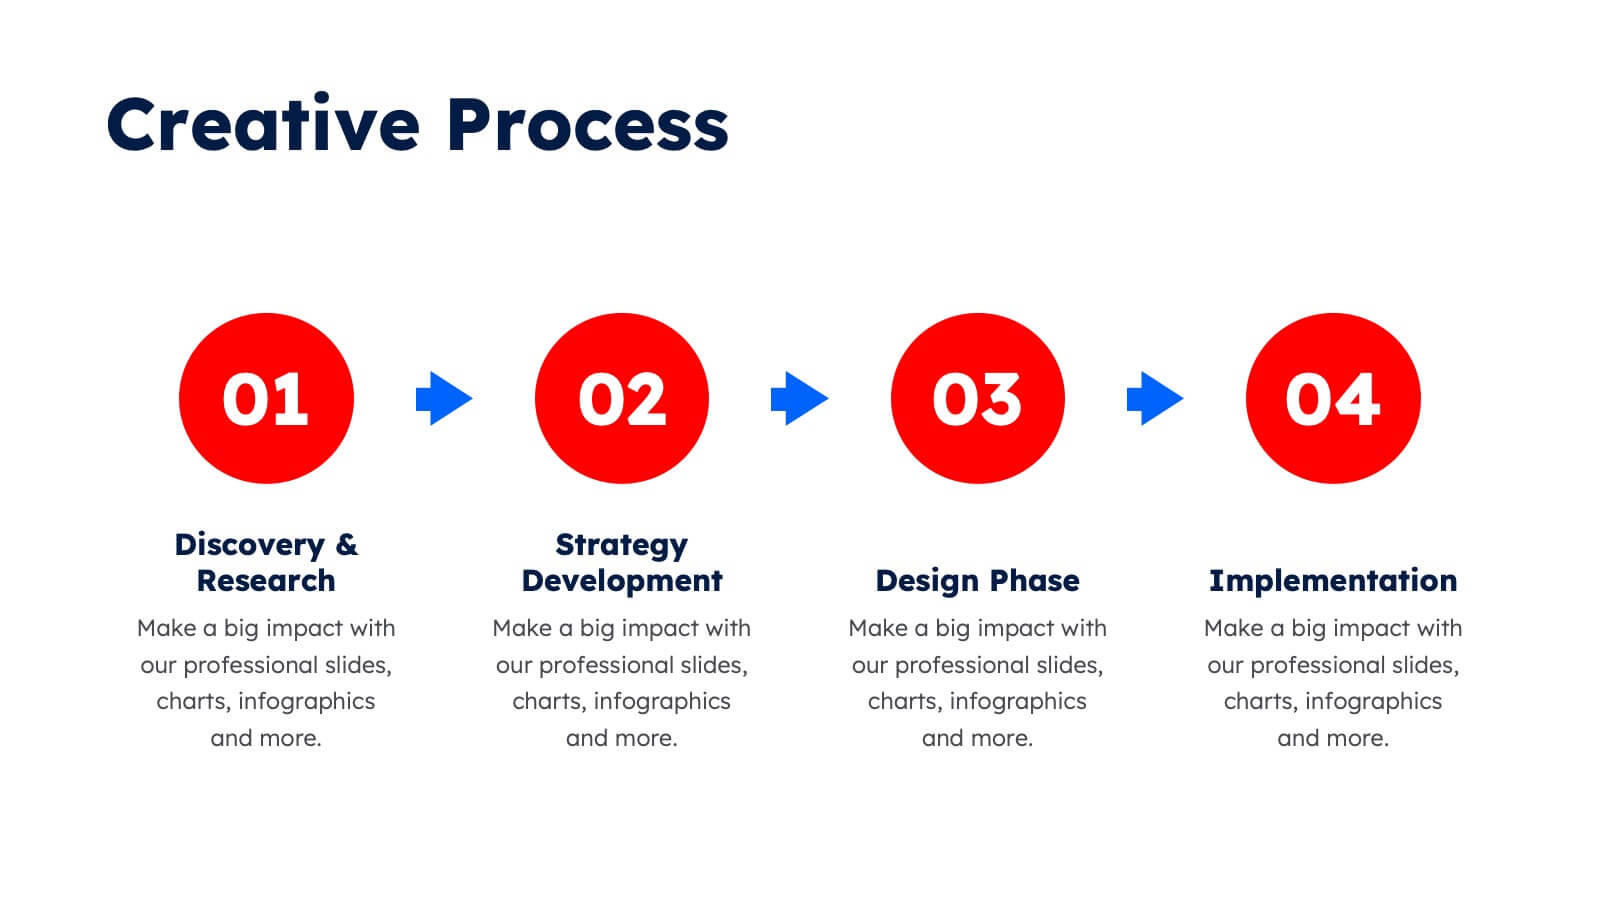
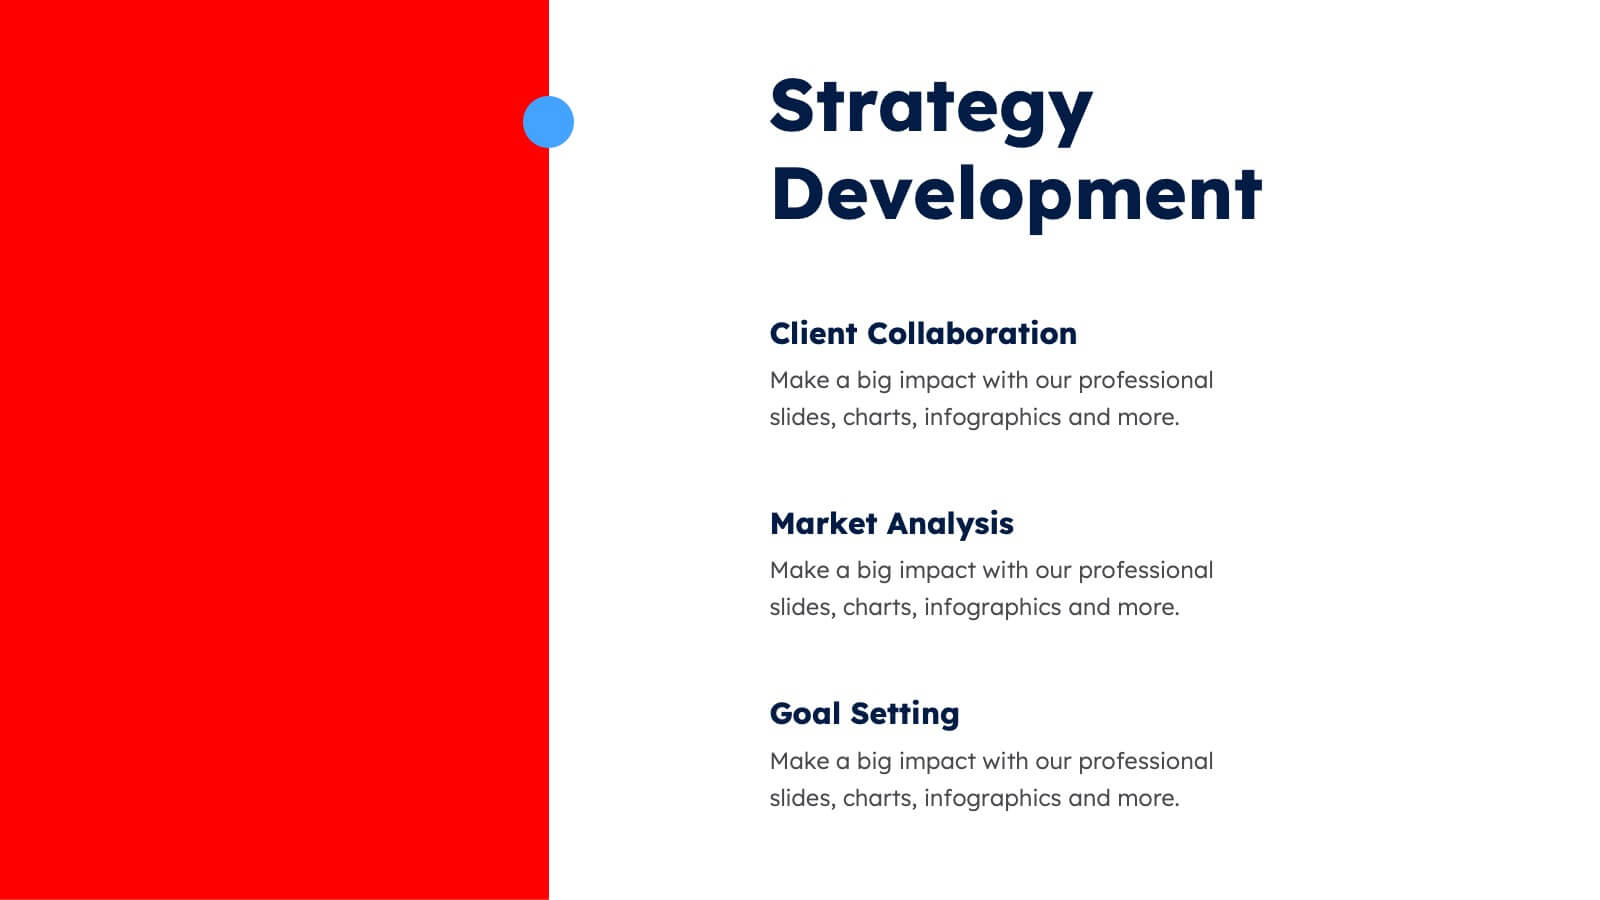
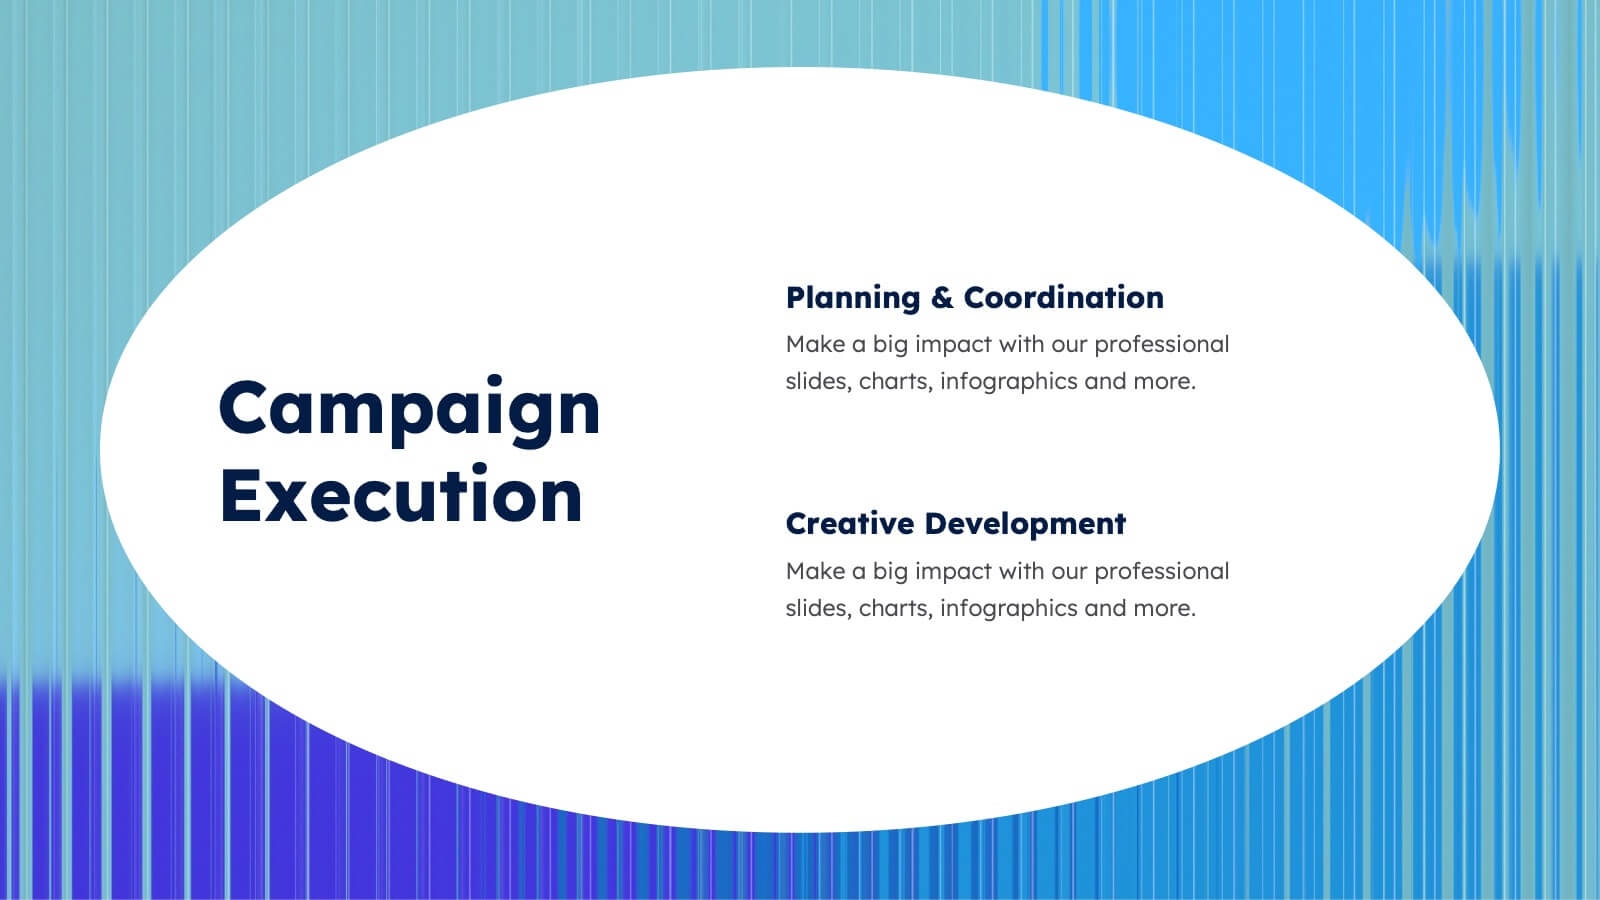
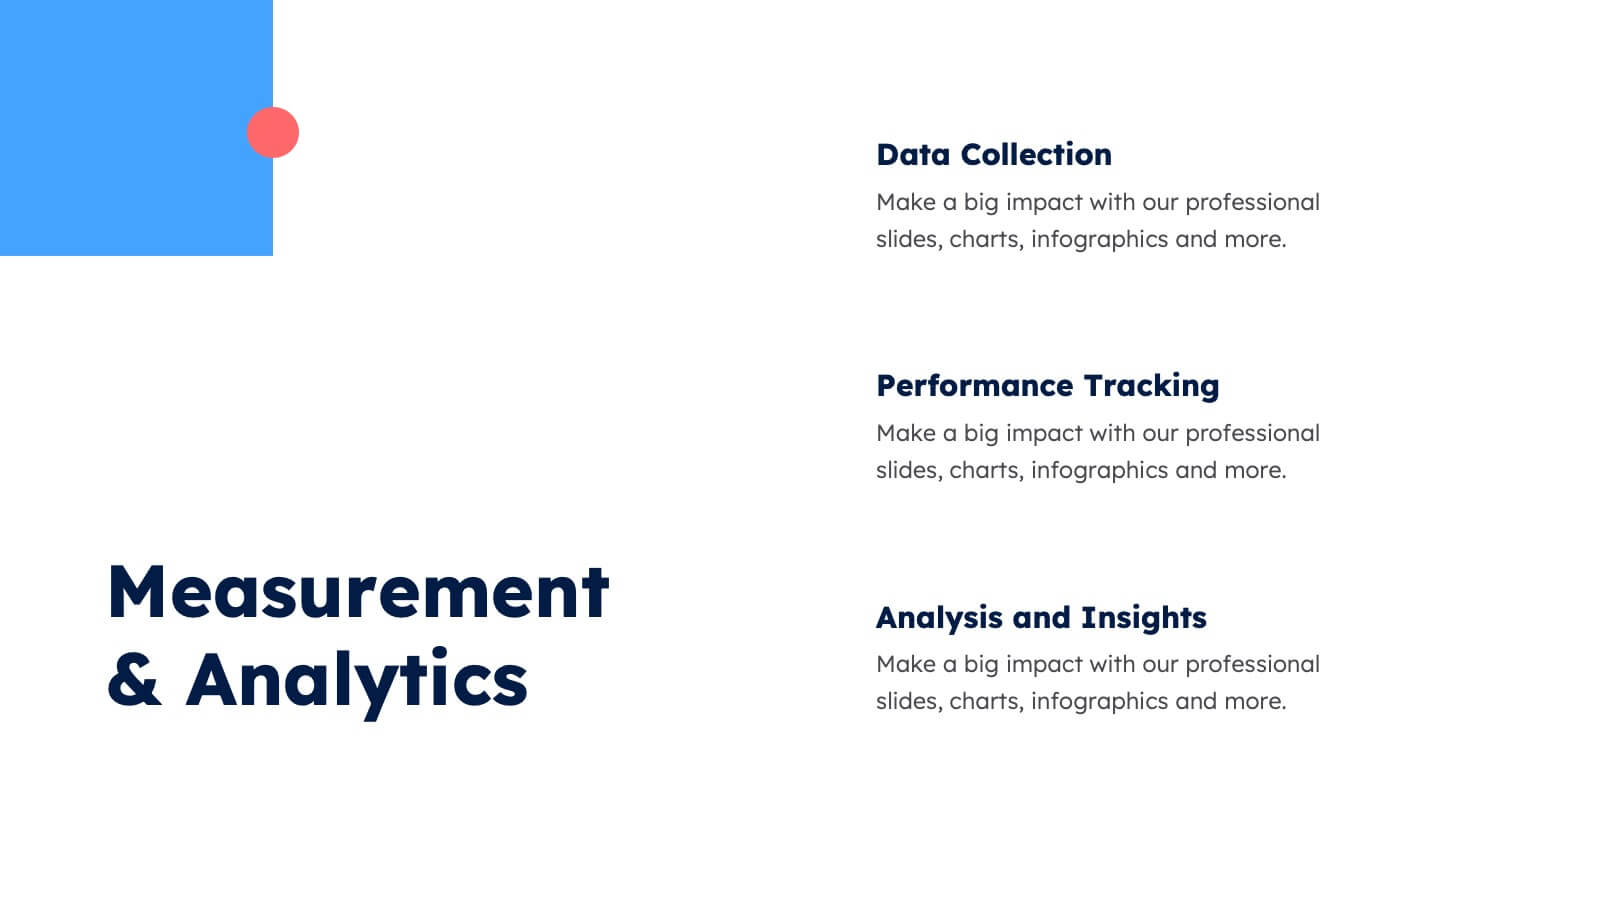
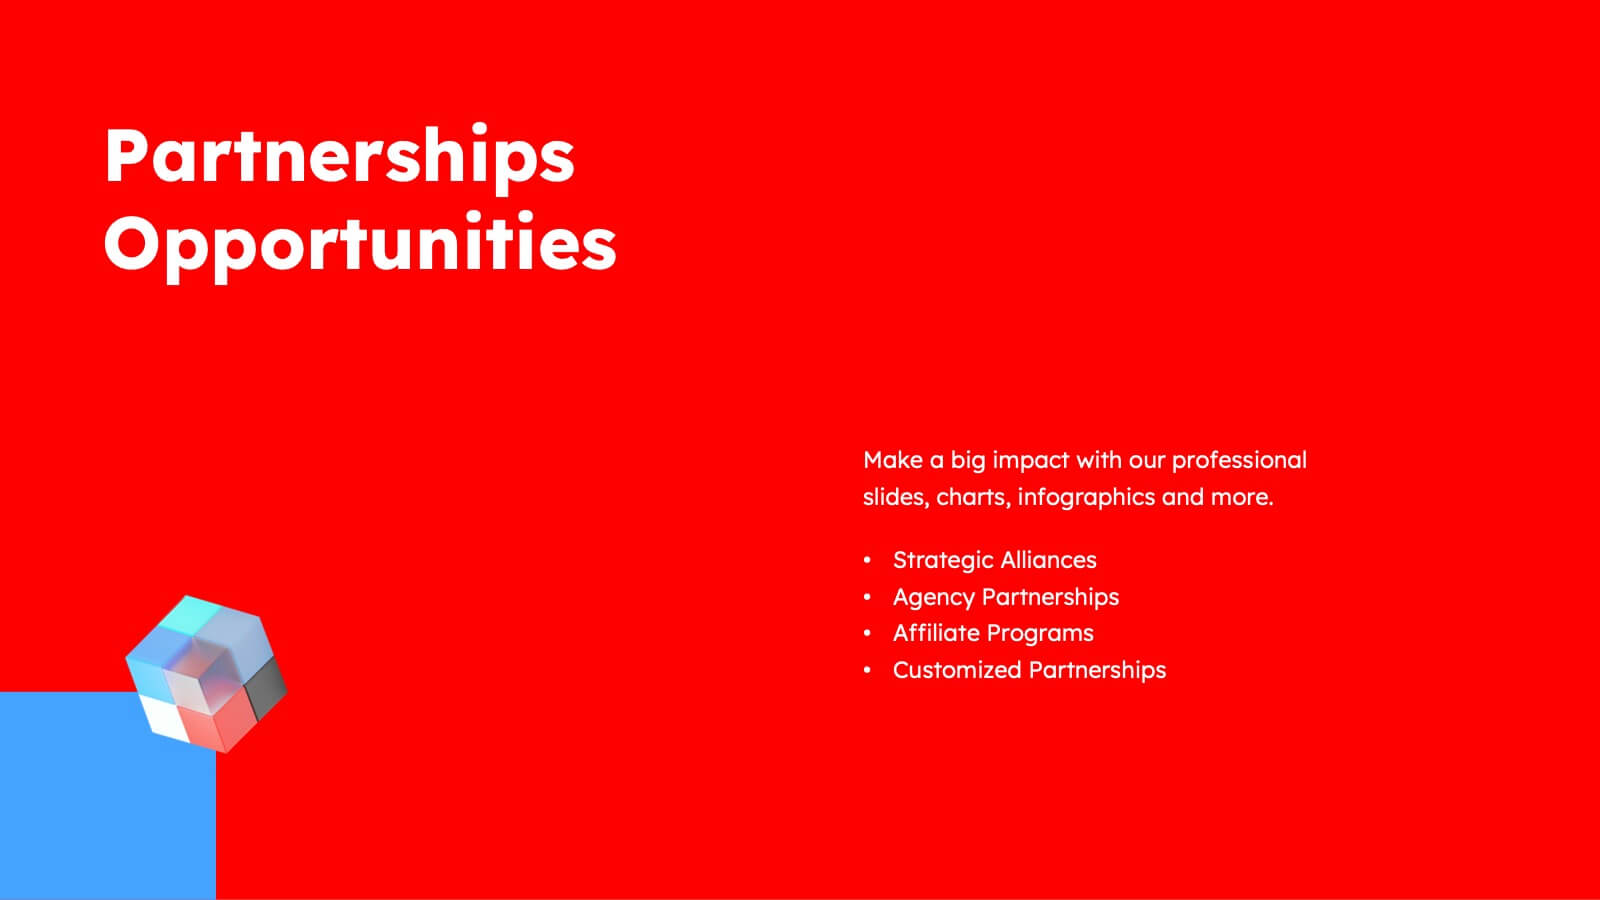
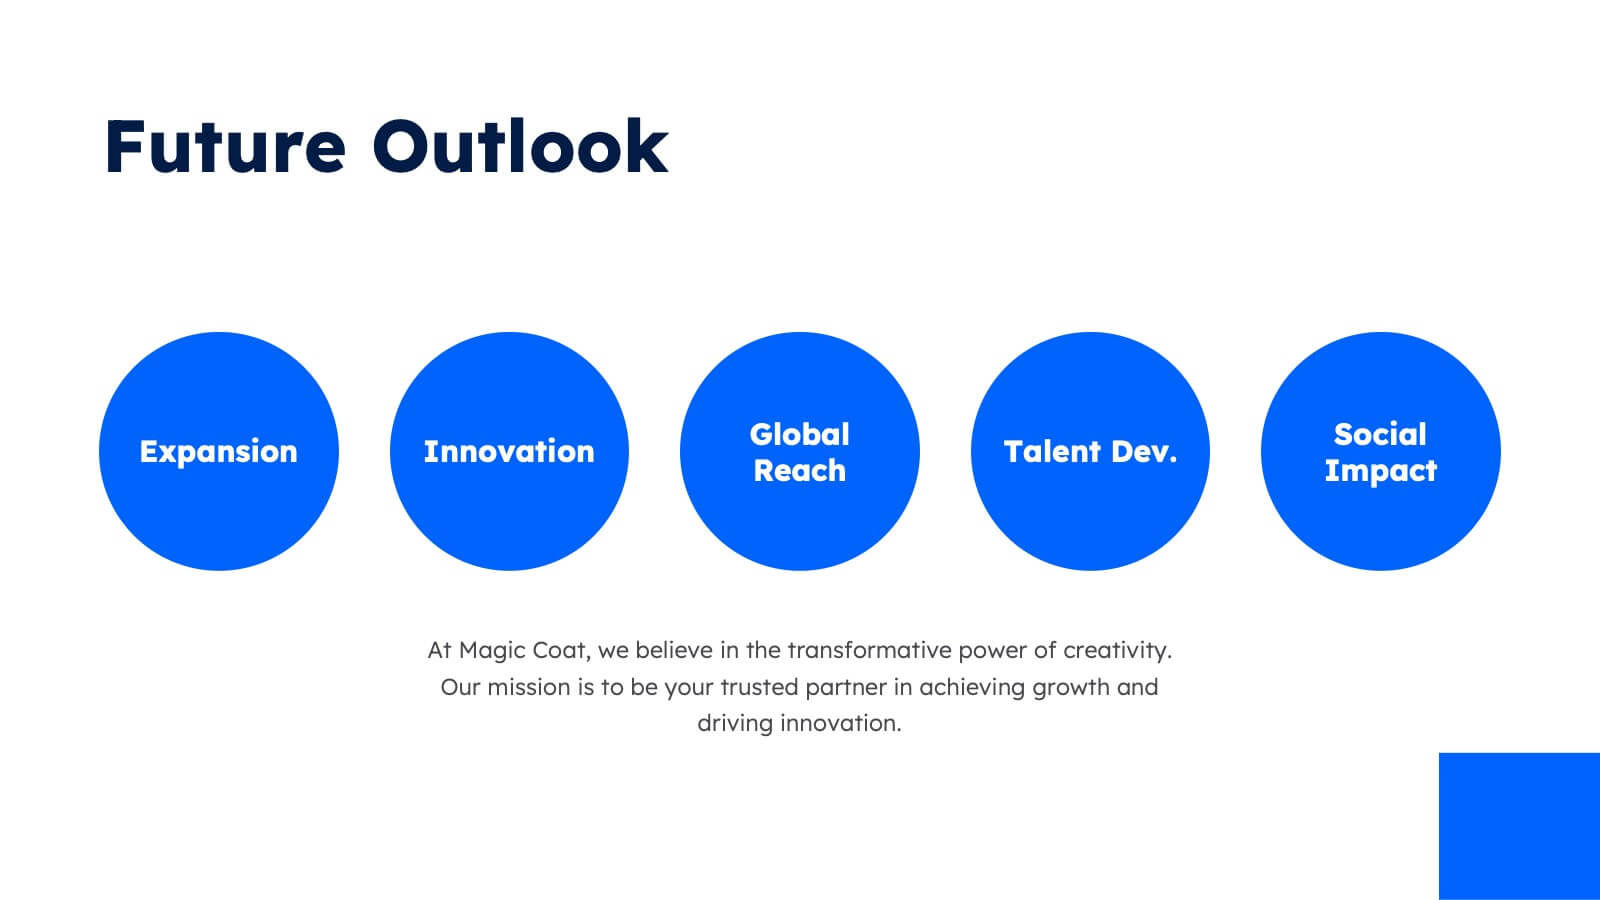
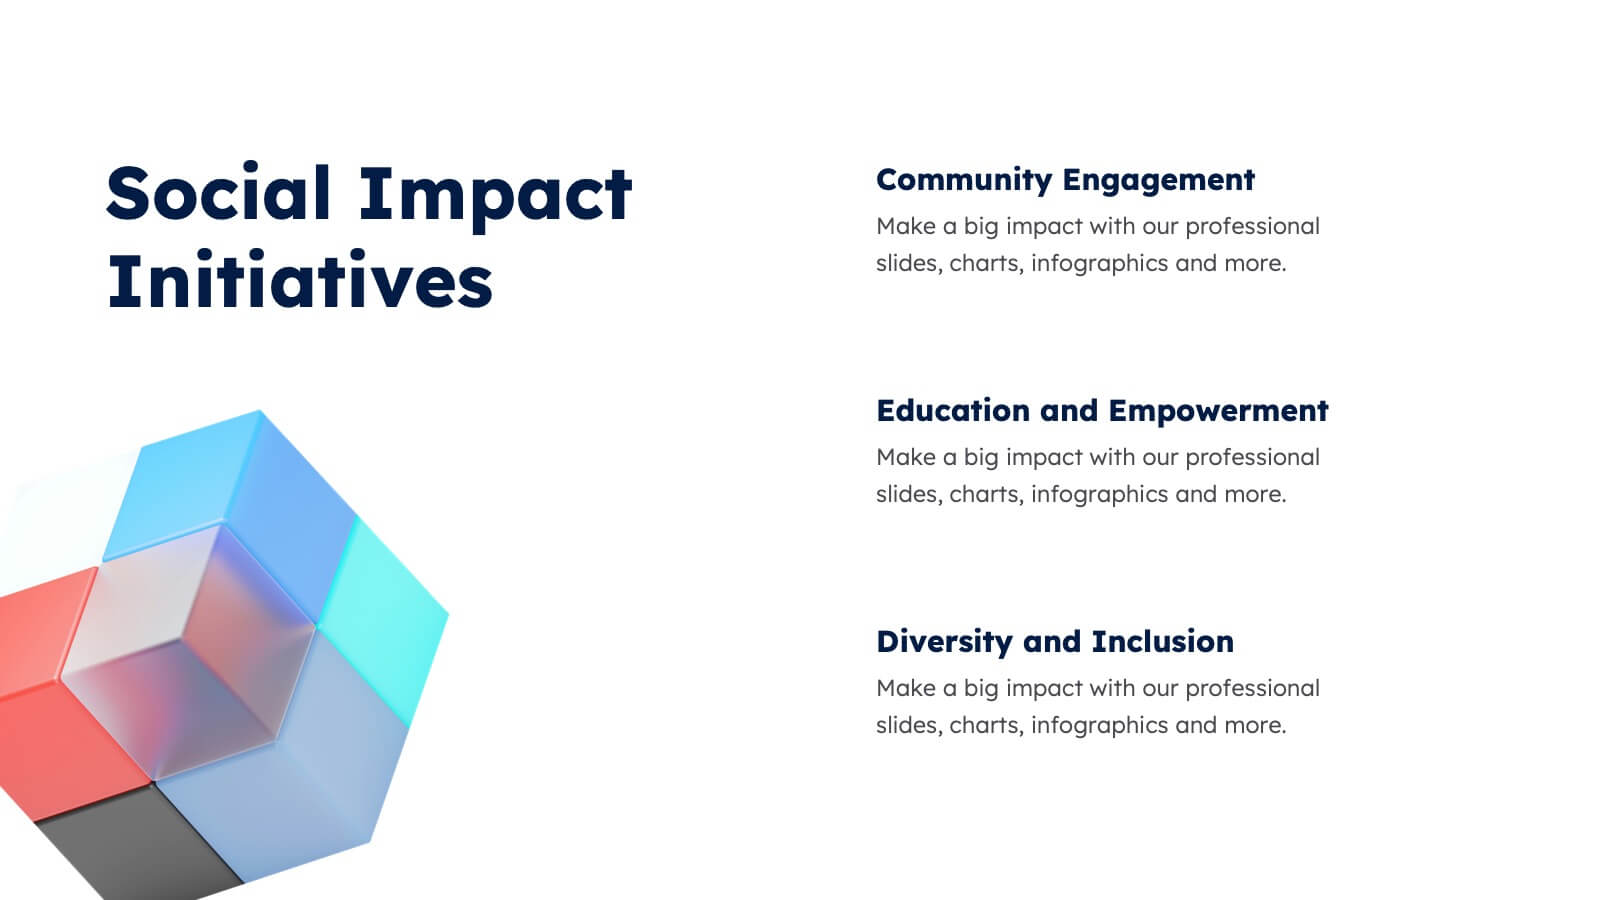
Aura Agency Portfolio Presentation
Showcase your agency's brilliance with this vibrant portfolio presentation template! Ideal for highlighting your mission, vision, case studies, and market analysis, it brings your achievements to life with colorful, engaging slides. Impress clients and partners with a well-structured, visually appealing narrative. Compatible with PowerPoint, Keynote, and Google Slides for easy use on any platform.


4 diapositivas
Execution-Based Strategic Action Plan Presentation
Highlight your execution strategy with this visually striking pinwheel diagram. Each blade represents a focused action step, ideal for showcasing implementation plans or performance initiatives. Fully customizable in PowerPoint, Keynote, and Google Slides—perfect for strategic reviews, team briefings, or progress tracking across four critical areas.