


Características


¿Tienes alguna pregunta?
Recomendar


4 diapositivas
Project Responsibility Assignment Matrix Presentation
Visualize team roles and task accountability at a glance with this Project Responsibility Assignment Matrix. This structured layout categorizes assignments using the RACI model—Responsible, Accountable, Consulted, and Informed—organized by team and position. Ideal for project managers, team leads, and operations planners, it helps ensure clarity, reduce overlap, and promote accountability across departments. Easily editable in PowerPoint, Keynote, and Google Slides for seamless customization and cross-platform use.


6 diapositivas
RACI Responsibilities Assignment Matrix Presentation
Bring clarity and structure to your workflow with a clean layout that instantly shows who’s doing what and when. This presentation helps you assign ownership, improve communication, and eliminate confusion across projects using a simple visual matrix. Fully editable and compatible with PowerPoint, Keynote, and Google Slides.


21 diapositivas
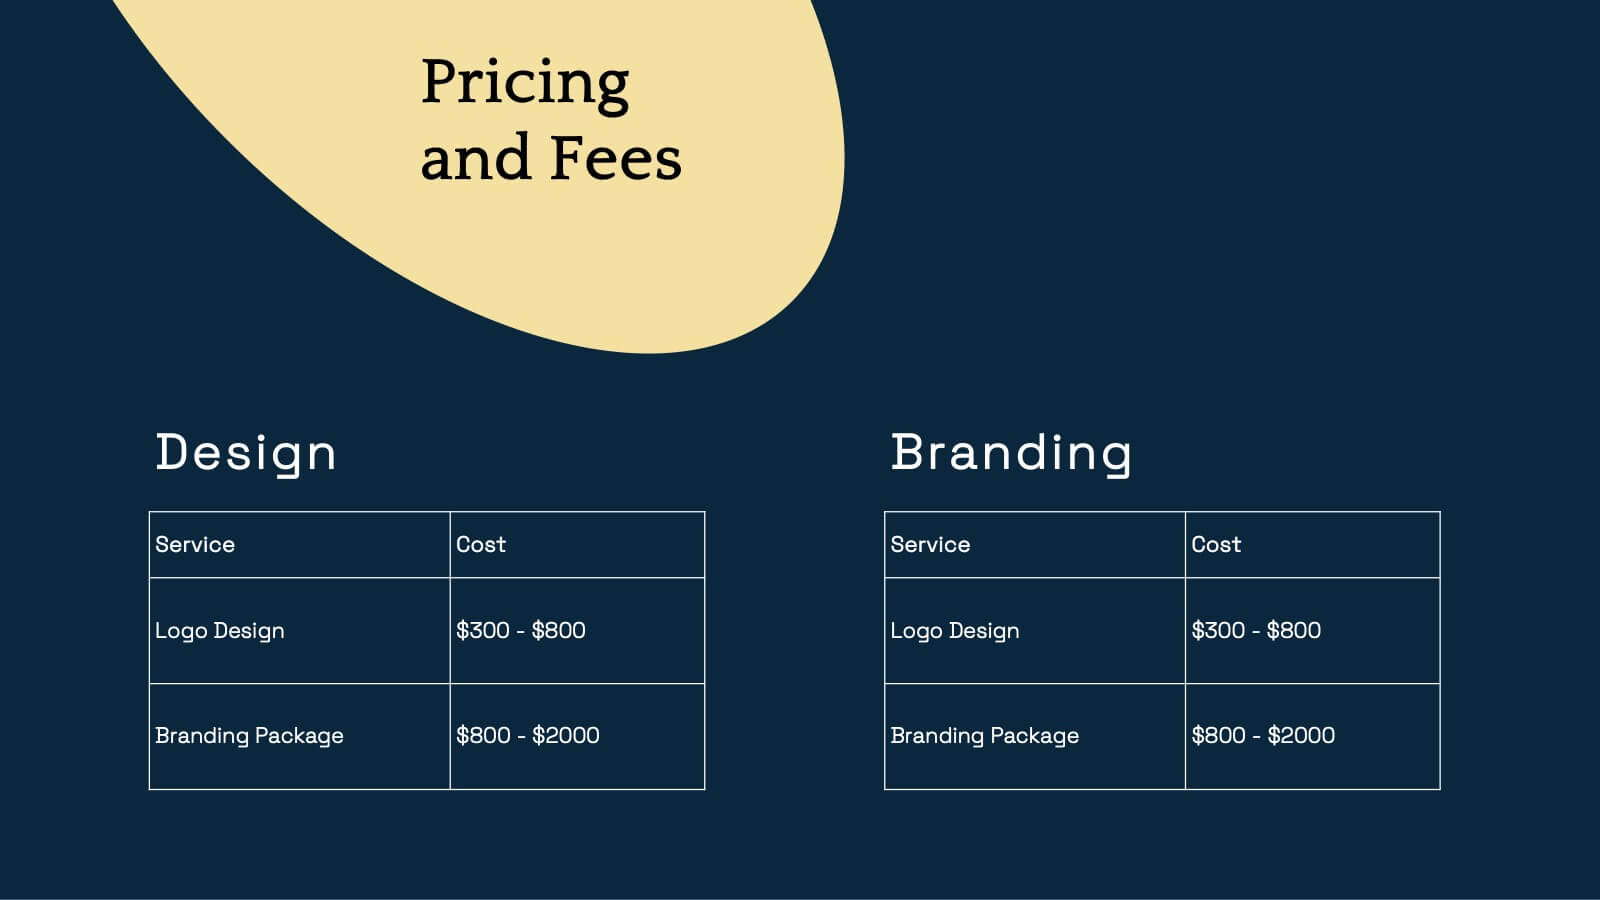
Cineris Product Roadmap Presentation
Present your product vision and strategy with this professional and modern product roadmap presentation template. Covering key aspects such as product overview, features, competitive analysis, pricing strategy, and production process, this template helps you communicate your plan effectively. Designed for easy customization, it’s perfect for internal team alignment, stakeholder presentations, and strategic planning. Compatible with PowerPoint, Keynote, and Google Slides.


12 diapositivas
Creative Alphabet Infographic
Add a bold twist to your data with this Creative Alphabet Infographic slide, featuring a stylized letter “B” puzzle layout. Ideal for branding breakdowns, step-by-step processes, or topic segmentation, each puzzle piece aligns with a customizable title and description. Fully editable in PowerPoint, Keynote, and Google Slides.


5 diapositivas
Company History and Growth Timeline Presentation
Present your milestones with clarity using the Company History and Growth Timeline presentation. Ideal for startups, enterprises, and project retrospectives, this timeline layout helps you highlight key achievements, growth phases, and expansion years in a visually structured format. With modern design elements, editable text fields, and dynamic year markers, it's perfect for telling your brand story or progress journey. Fully compatible with PowerPoint, Keynote, and Google Slides.


22 diapositivas
Reverium Startup Funding Proposal Presentation
Secure investor interest with this thoughtfully designed startup funding proposal template. Tailored for early-stage ventures, this presentation walks your audience through your business journey, product offerings, market potential, and financial projections in a clear and captivating format. Highlight your unique value proposition, growth strategies, and competitive edge with modern, easy-to-edit slides. Present your founding story, team expertise, and detailed market analysis to build credibility and foster trust. Conclude with a compelling call to action and funding requirements to solidify your pitch. Compatible with PowerPoint, Google Slides, and Keynote, this template ensures seamless customization for any startup looking to present a polished and professional funding proposal. Perfect for pitch meetings, investor decks, and capital raising initiatives.


5 diapositivas
Sustainable Growth and Green Policy Presentation
Showcase your eco-initiatives with the Sustainable Growth and Green Policy Presentation. This unique leaf-shaped diagram highlights four key environmental pillars—ideal for presenting climate strategies, energy policies, or green development goals. With a sleek and modern design, it’s perfect for NGOs, government briefings, or corporate sustainability reports. Editable in Canva, PowerPoint, Keynote, and Google Slides.


5 diapositivas
Marketing Sales Funnel Presentation
Watch your customer journey come to life with a clean, visual flow that makes each stage easy to understand at a glance. This presentation breaks down your funnel into clear steps, helping you explain conversions, behaviors, and strategy with confidence. Fully compatible with PowerPoint, Keynote, and Google Slides.


5 diapositivas
Search Engine Marketing Analysis Presentation
Showcase your SEM insights with a presentation slide that’s as sharp as your strategy. This layout helps you break down ad performance, keyword data, and campaign elements clearly and visually. Perfect for marketers presenting to clients or teams, and fully compatible with PowerPoint, Keynote, and Google Slides.


23 diapositivas
Orbit Corporate Strategy Report Presentation
Elevate your strategic planning and reporting with a sleek and dynamic template that exudes professionalism and clarity! This Strategy Report template is designed to empower your organization’s vision, highlighting the core elements that drive success. From a powerful agenda slide that sets the tone to a detailed team update, this template ensures every aspect of your business is showcased with precision. The design is streamlined yet impactful, perfect for conveying key achievements, current projects, and future goals. Performance metrics, departmental goals, and training & development sections are laid out to emphasize your organization’s strengths and areas of focus. The template also includes slides dedicated to employee recognition, process improvement, and cross-functional collaboration, ensuring all facets of your business are covered. With a clean, modern aesthetic, this template is perfect for executives and team leaders alike, and is compatible with PowerPoint, Keynote, and Google Slides. Get ready to make your strategy presentations unforgettable!


21 diapositivas
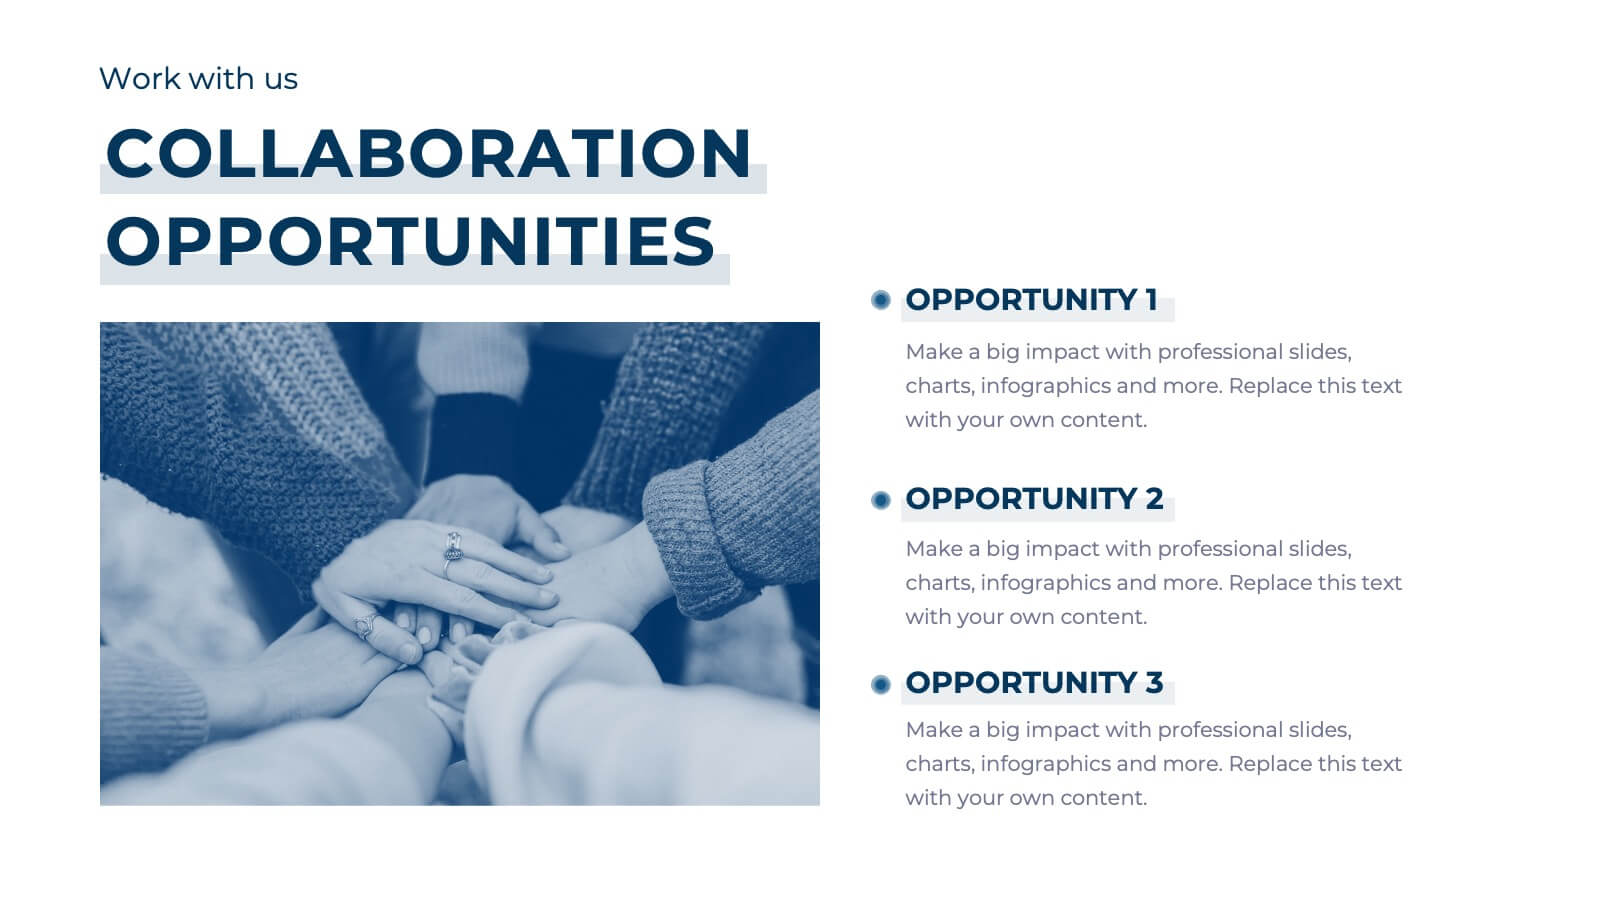
Vortexia Small Business Pitch Deck Presentation
Deliver an impressive pitch with a modern and sleek presentation template tailored for small businesses. Dive into critical aspects like team updates, current projects overview, and key achievements to showcase progress and potential. Address challenges and solutions in a structured way, while outlining departmental goals and performance metrics for transparency. The template includes slides for resource allocation, collaboration opportunities, and training and development strategies, ensuring a comprehensive narrative. Use the process improvement and feedback and suggestions sections to invite engagement and innovation. With fully editable slides, this template is compatible with PowerPoint, Google Slides, and Keynote, offering a polished and professional platform to highlight your business strengths and future plans. Perfect for entrepreneurs and small businesses ready to captivate stakeholders.


6 diapositivas
Demographic Information Infographic
Demographic information refers to data that describes the characteristics of a population or specific groups within a population. This infographic template is essential for understanding the composition and dynamics of a population, as well as for making informed decisions in various fields, such as market research, healthcare, and education. This infographic is designed to provide an overview of key demographic indicators and trends, offering insights into the characteristics of the target audience. This infographic includes key insights about the demographic data presented, providing context and interpretation for the audience.


6 diapositivas
Business Risk Mitigation Framework Presentation
Visualize and communicate your risk management strategies with this two-part puzzle-style framework. Ideal for showcasing problems and solutions, action plans, or risk-response workflows. Clean and modern layout enhances clarity. Fully editable in PowerPoint, Keynote, and Google Slides—perfect for business continuity planning, operational strategy, and stakeholder presentations.
21 diapositivas
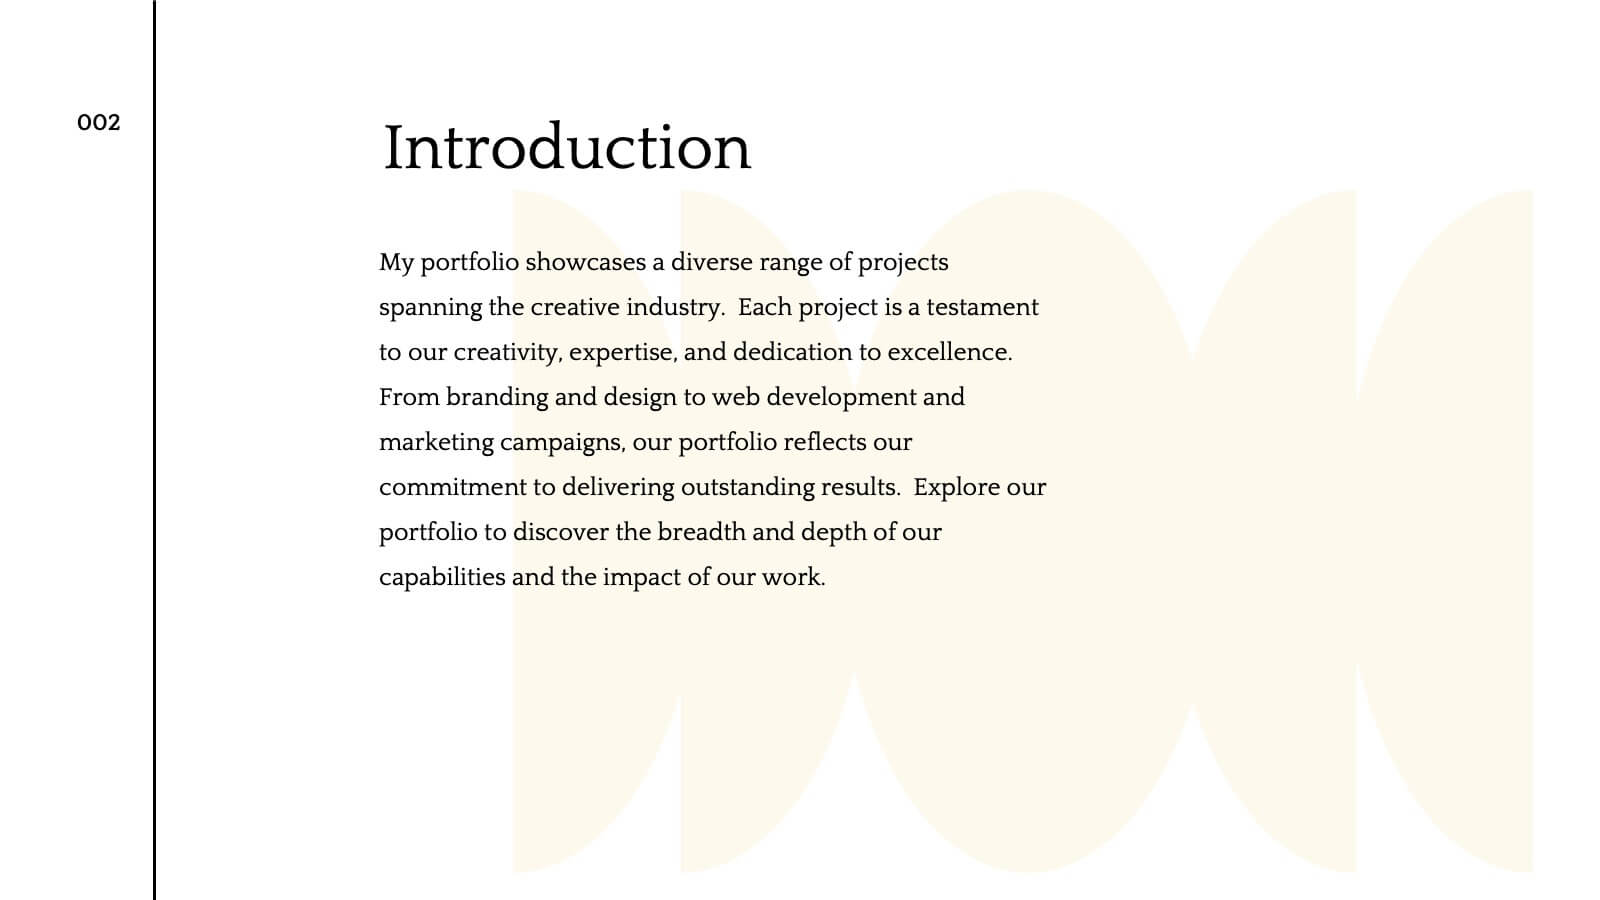
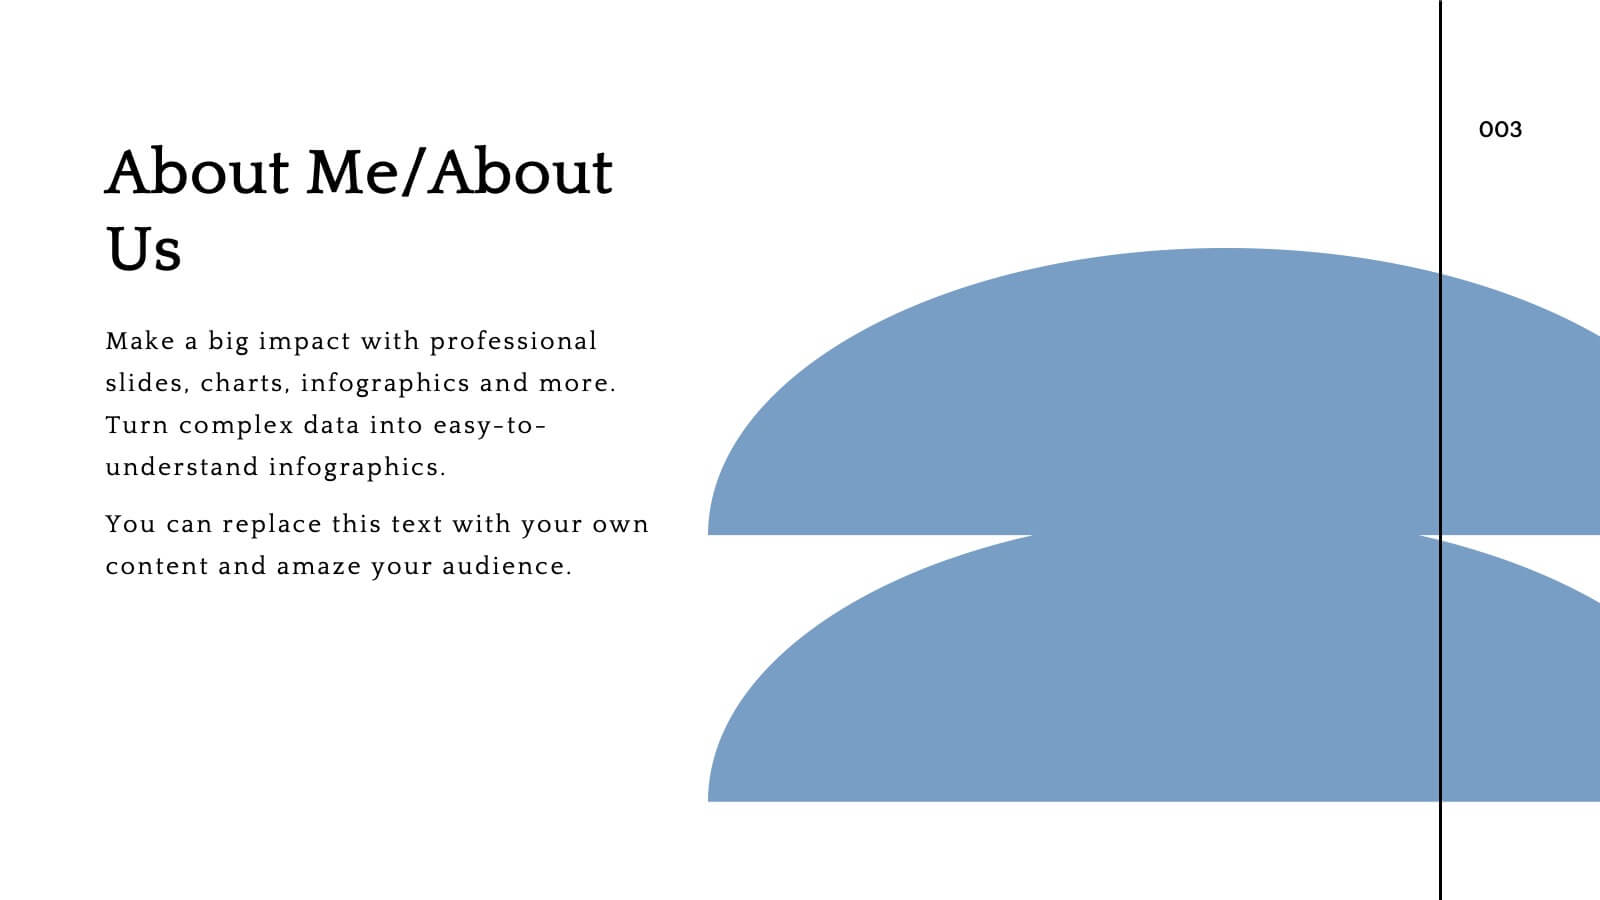
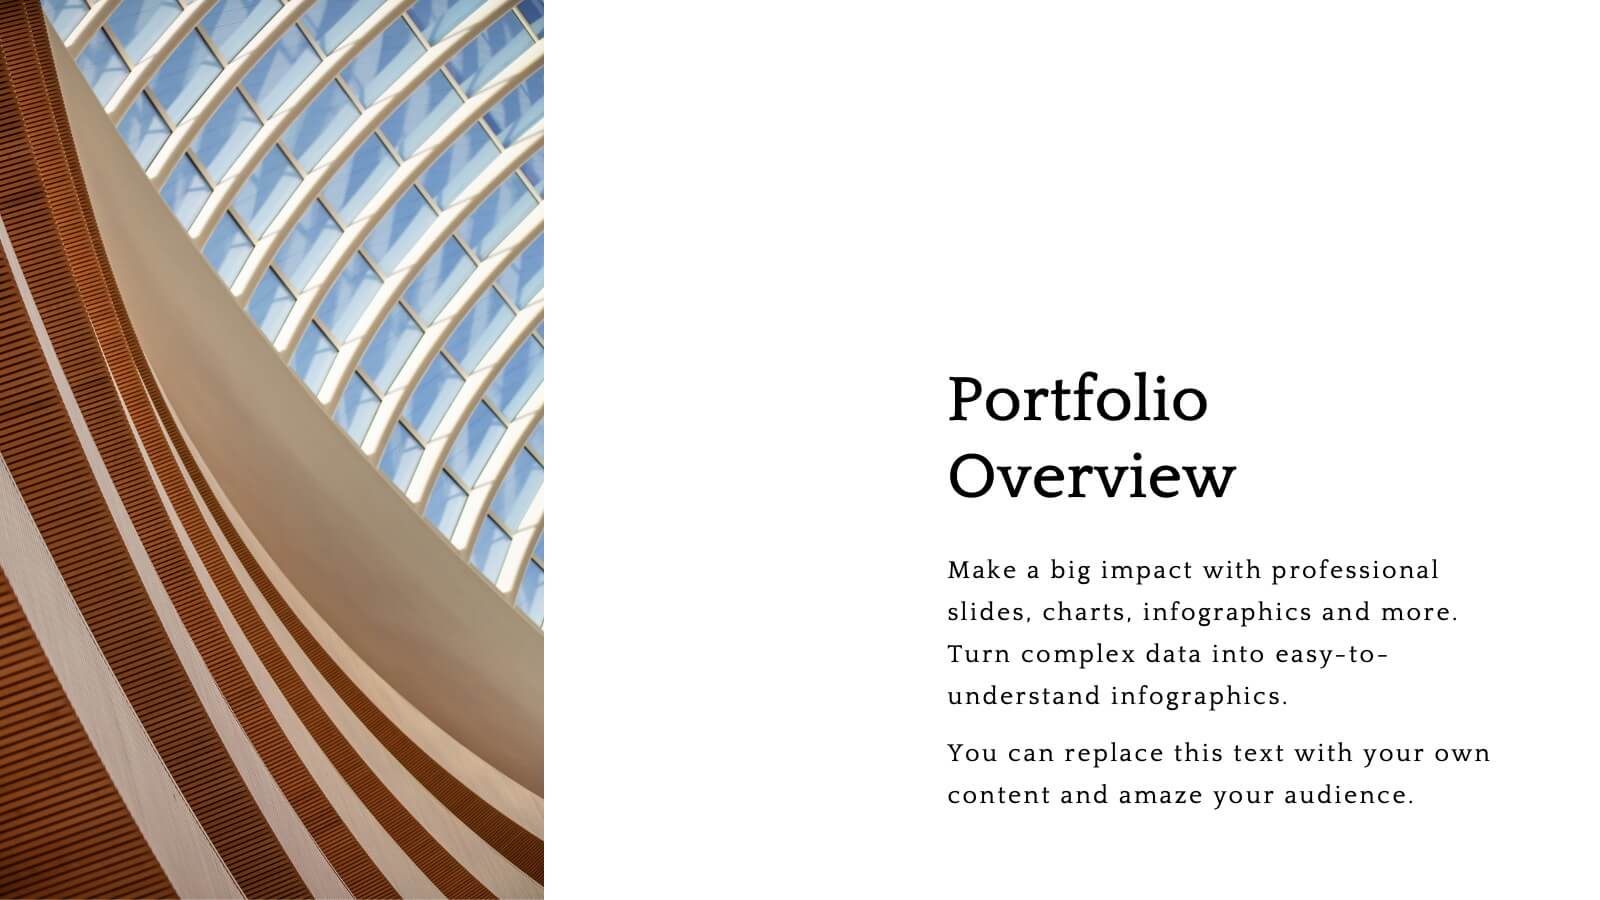
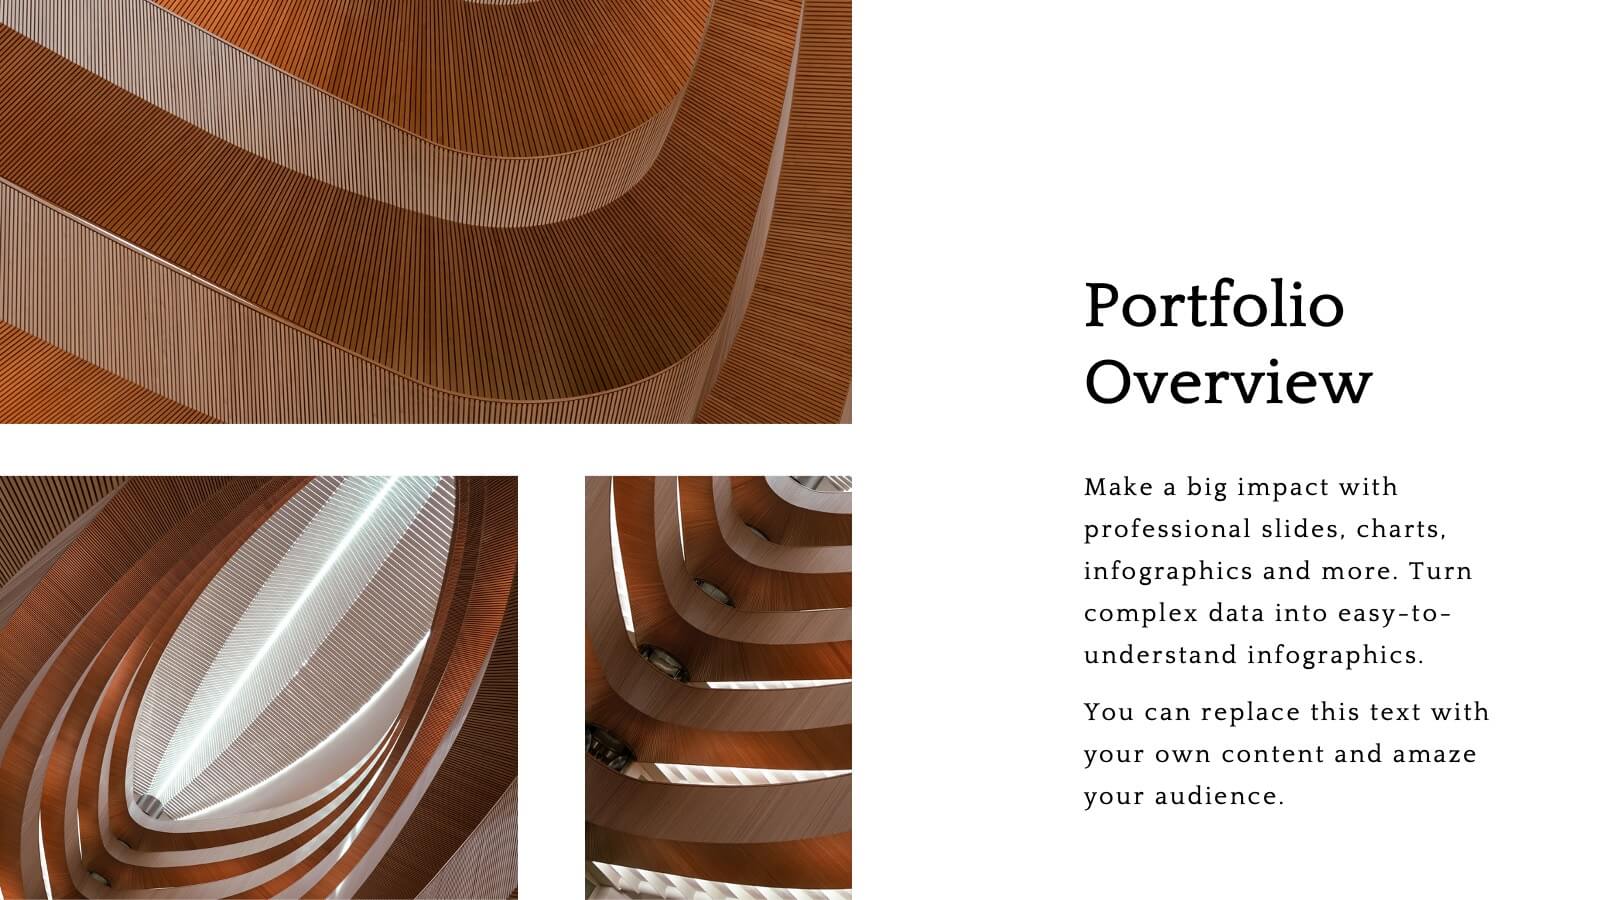
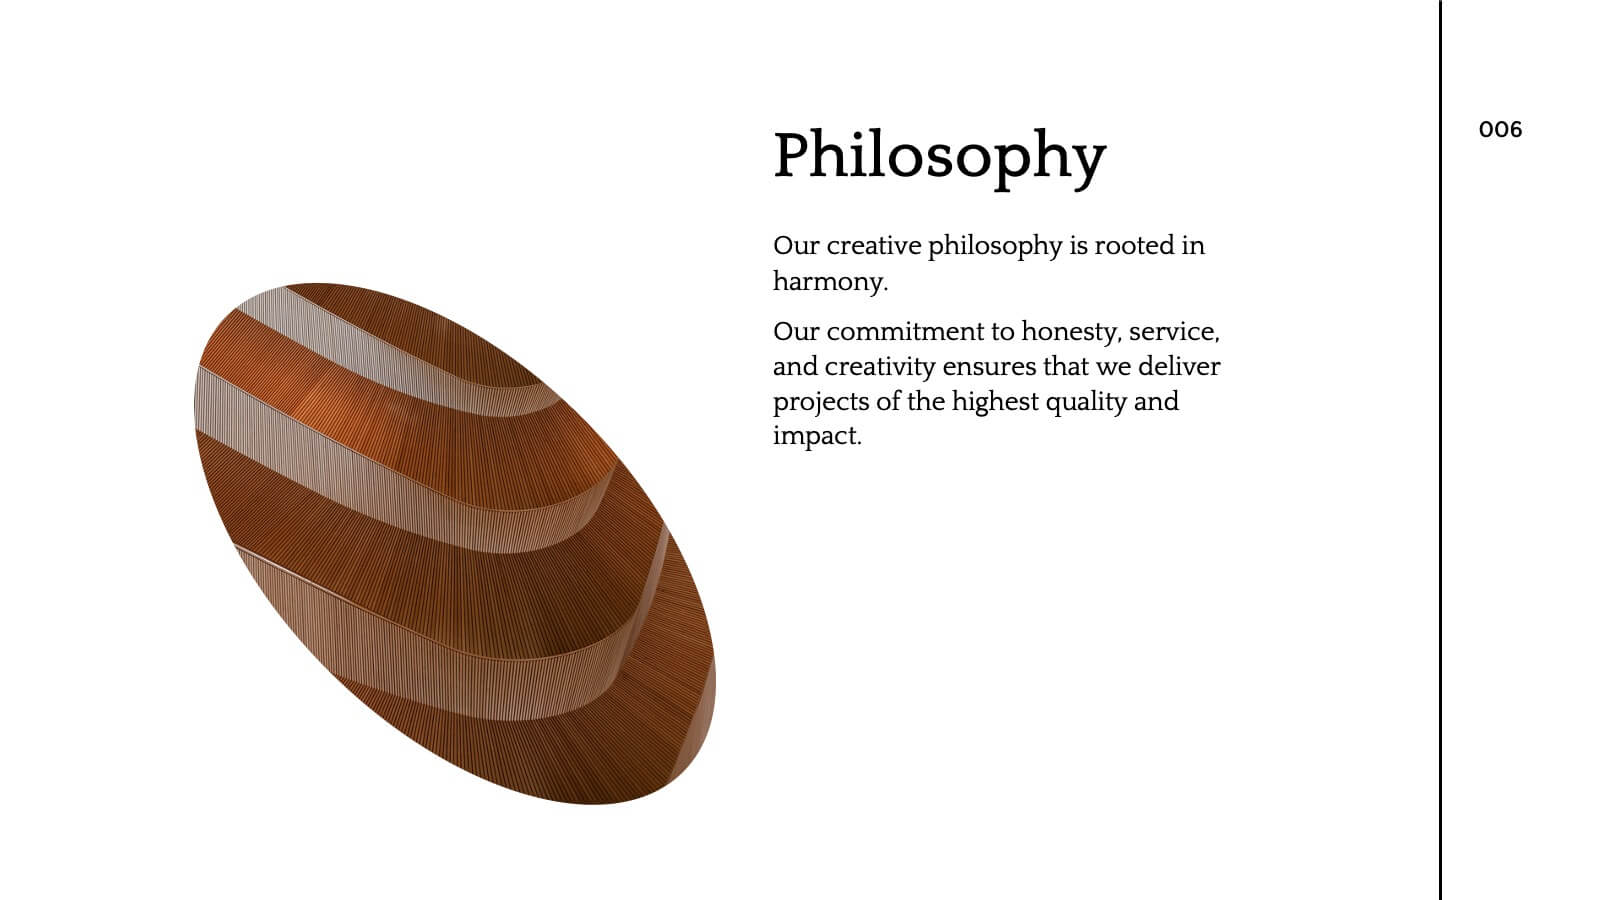
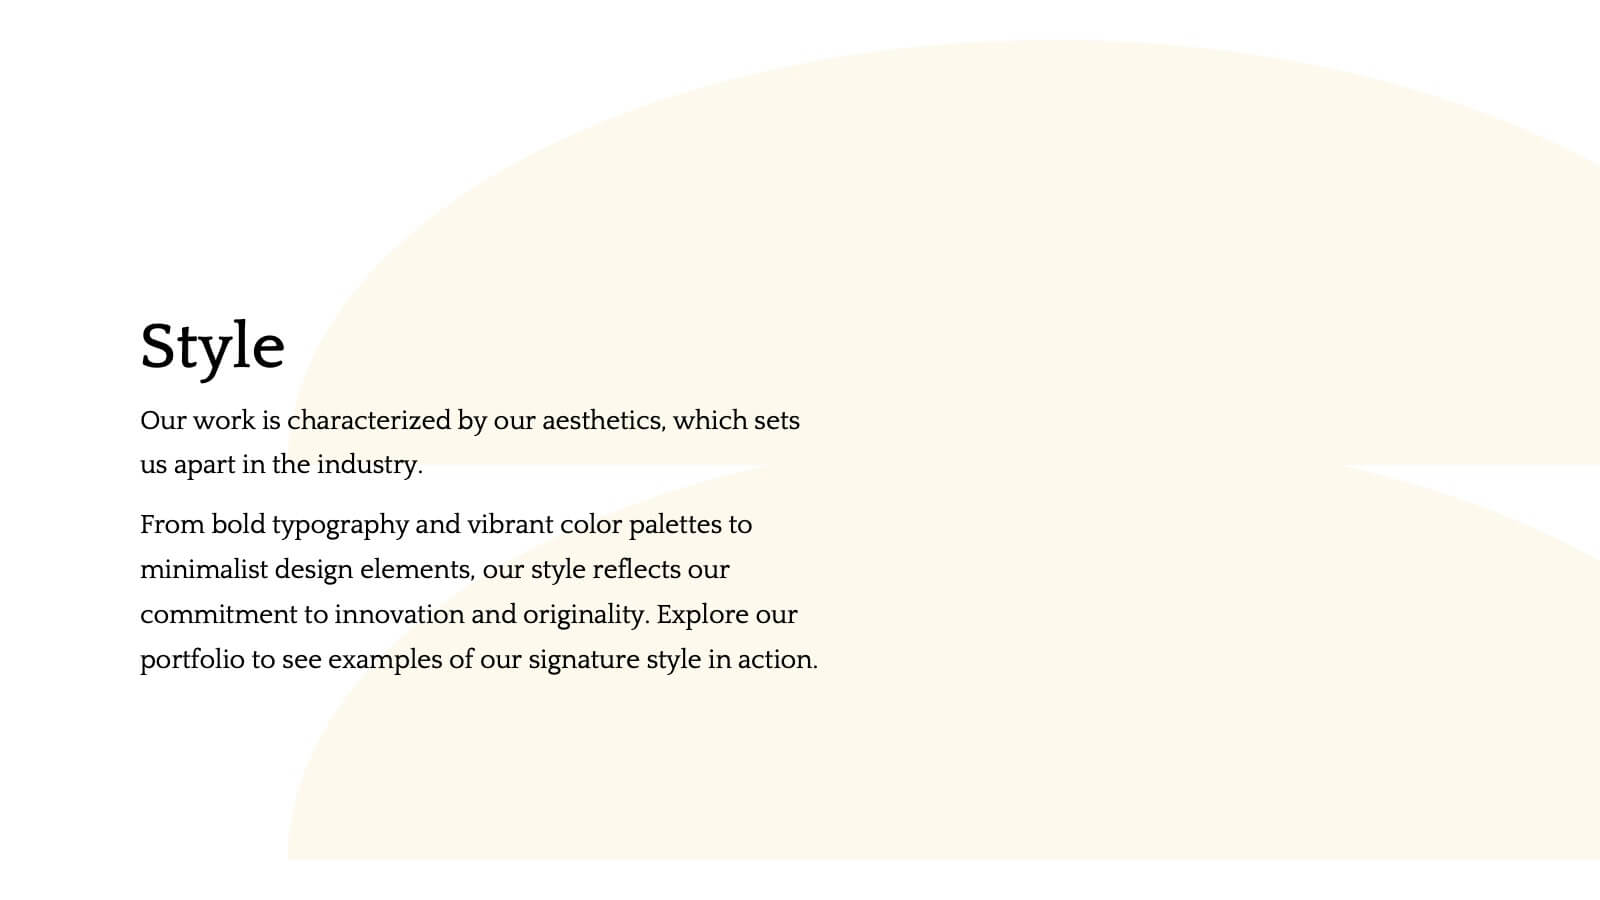
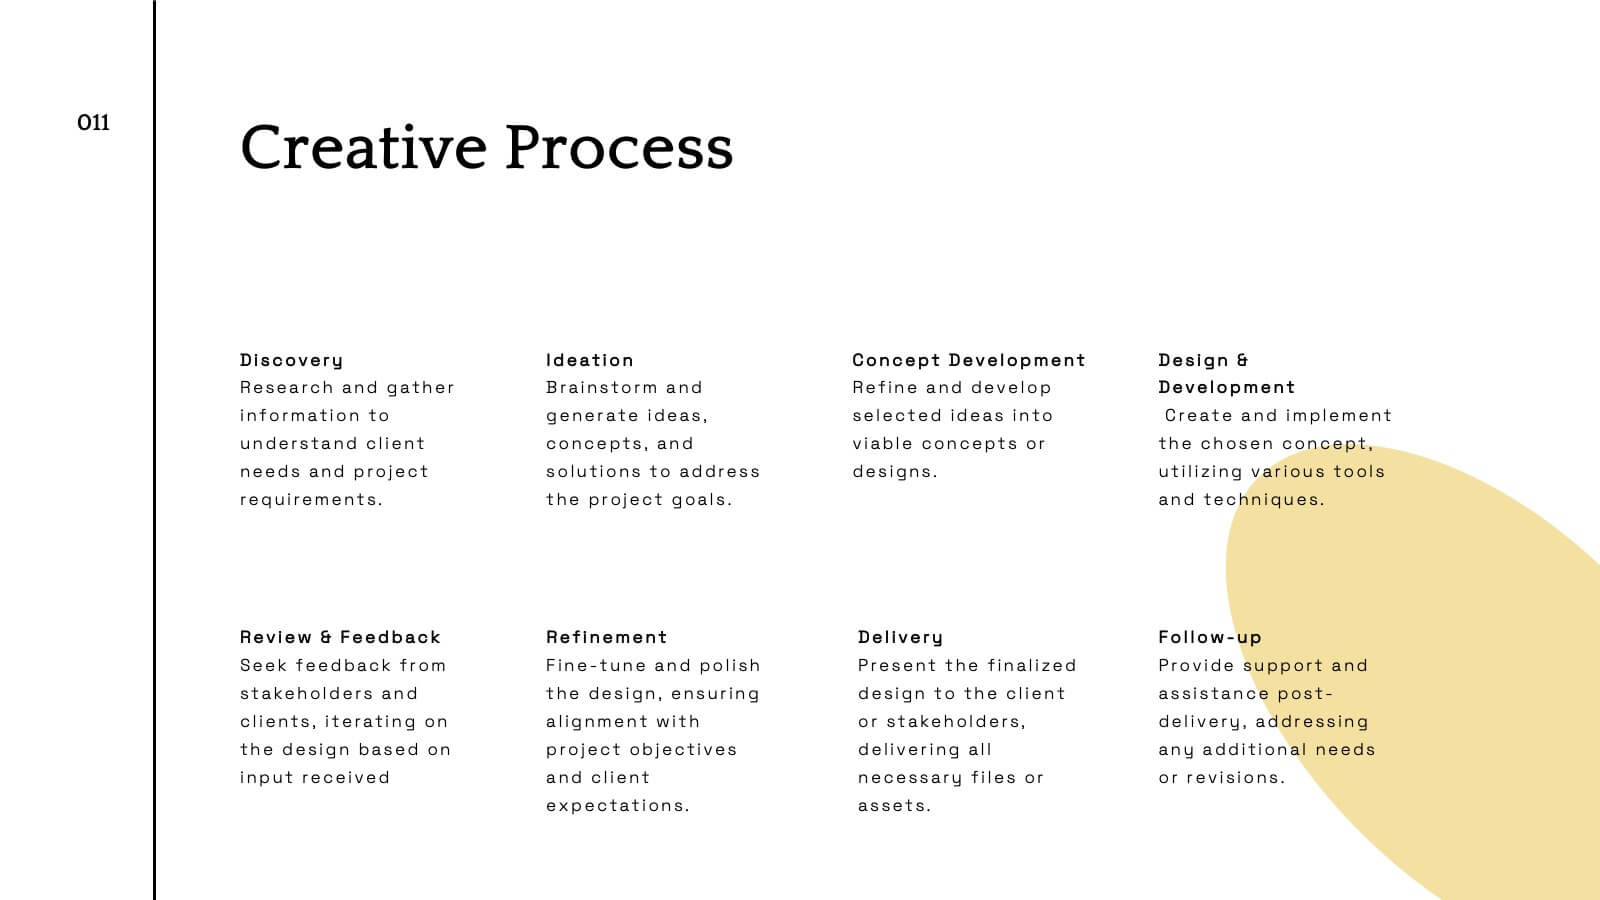
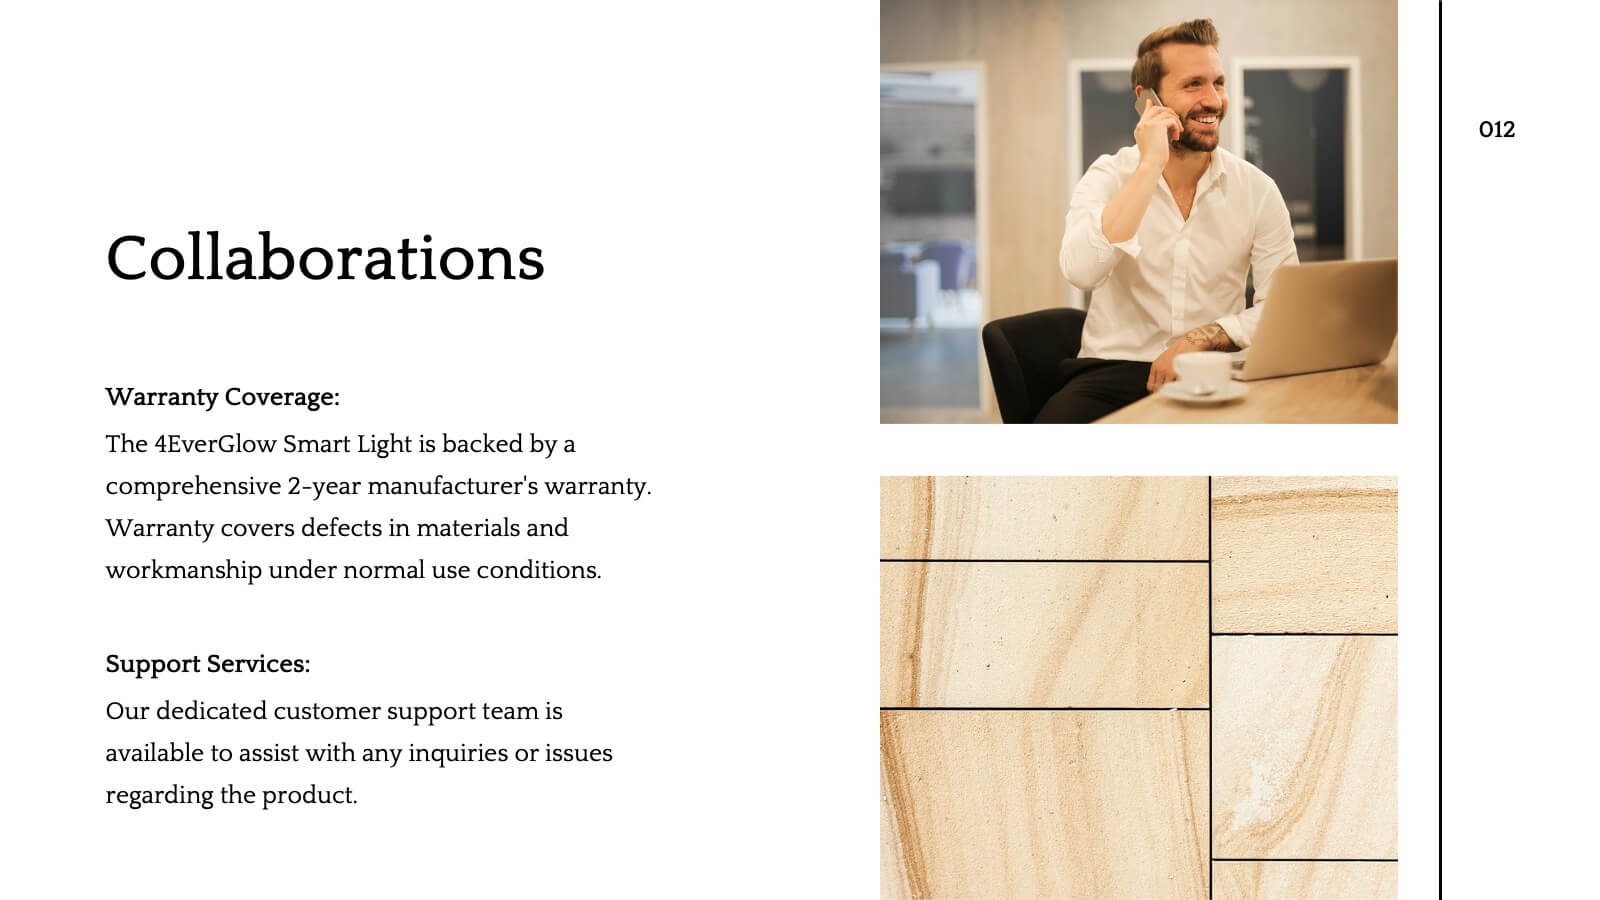
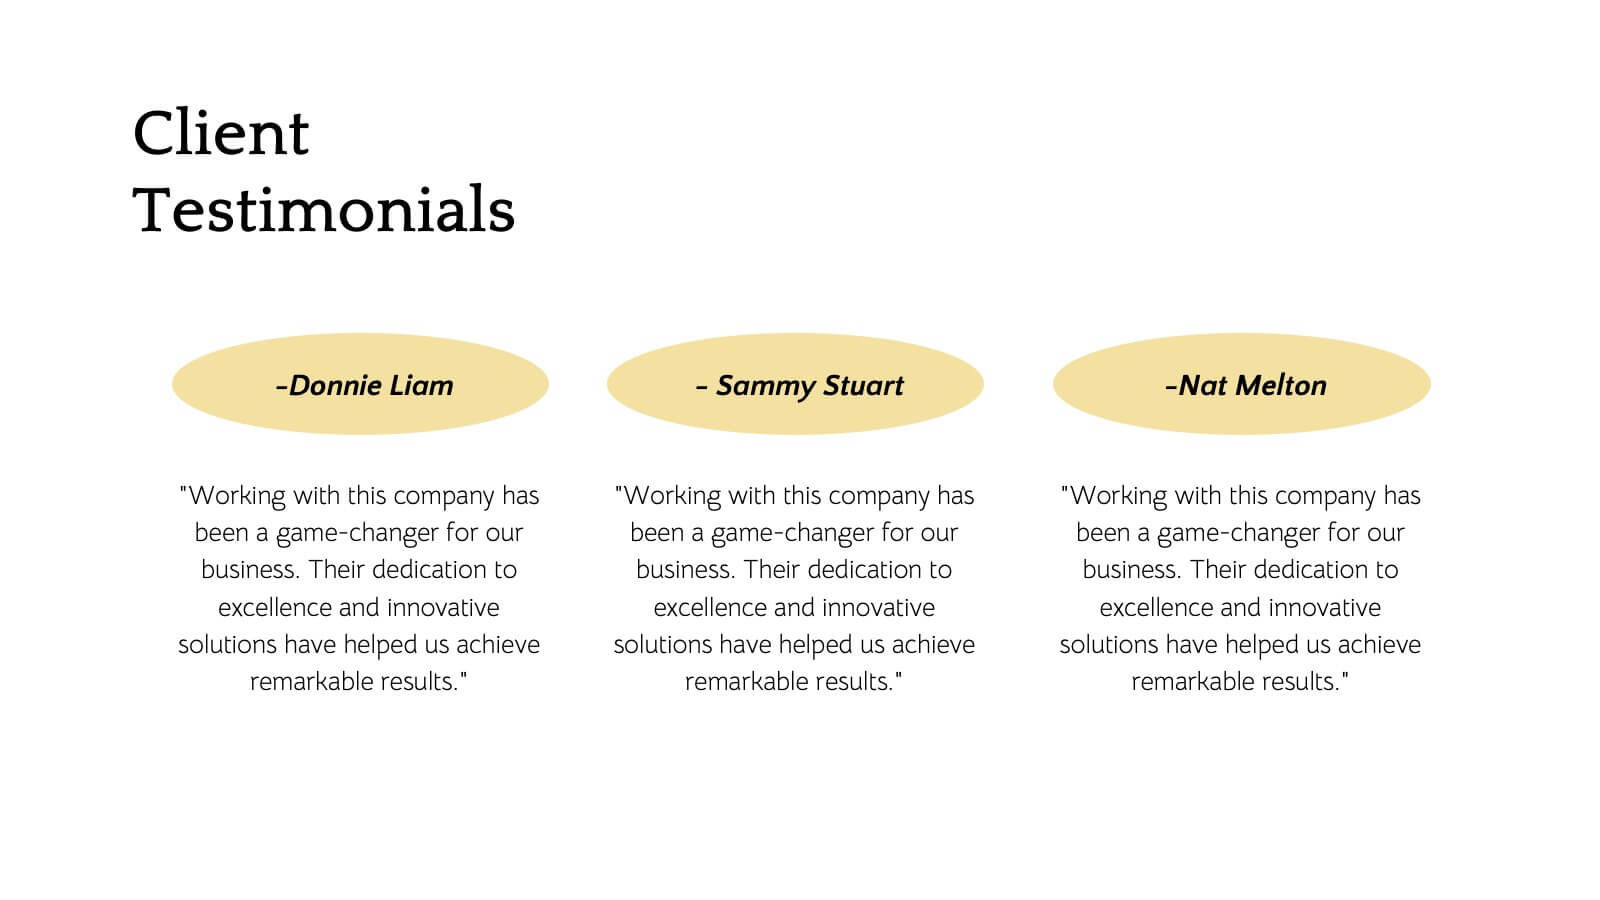
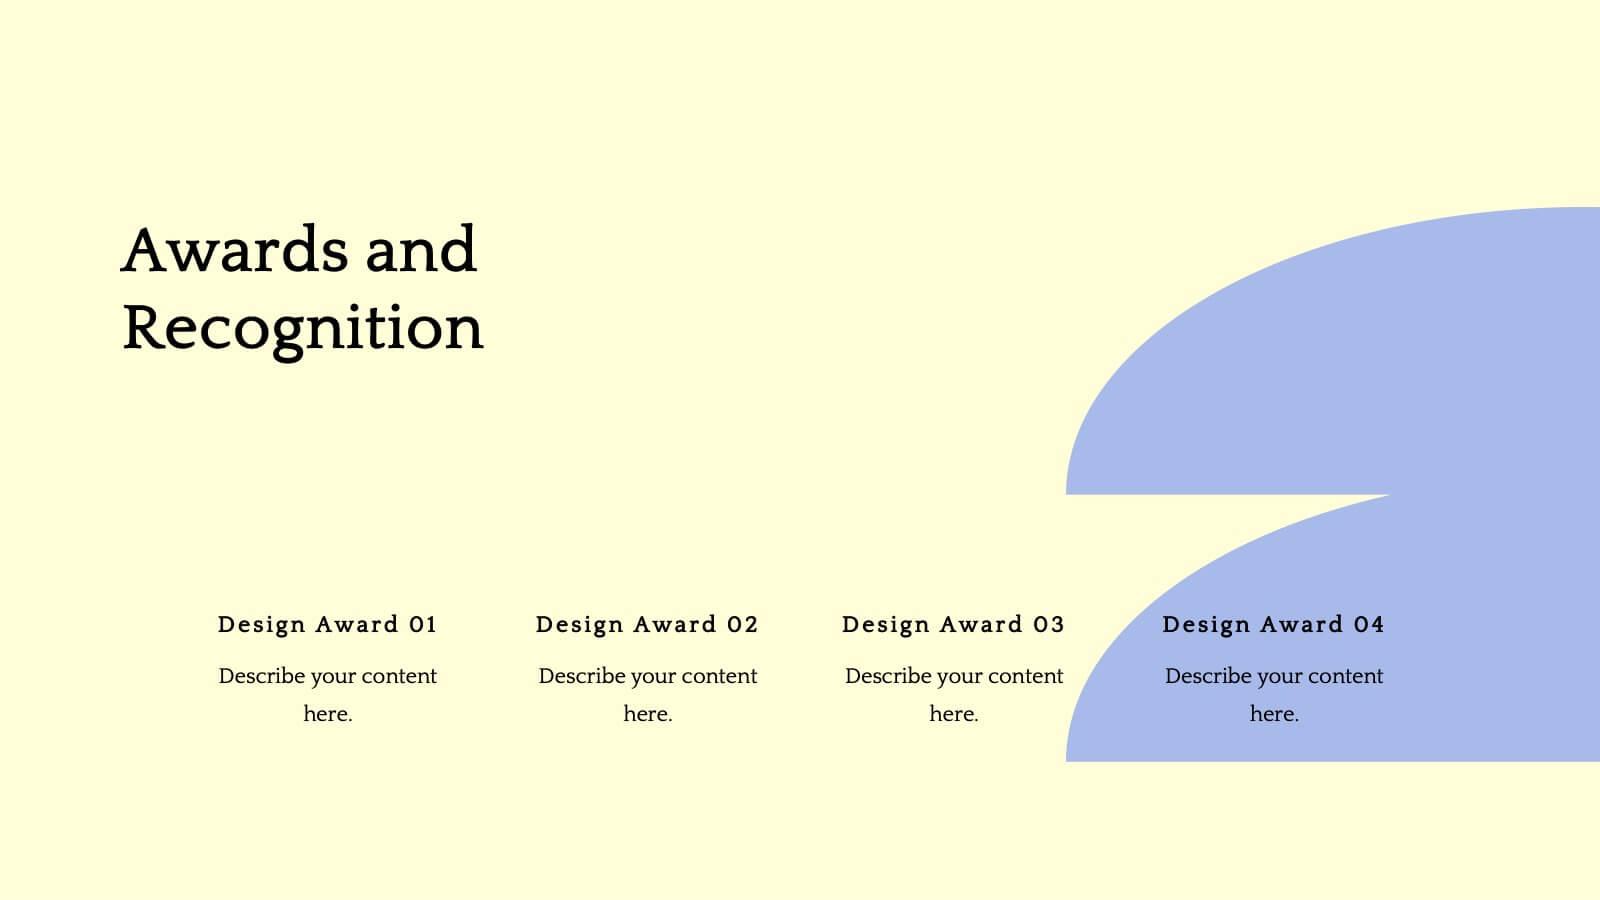
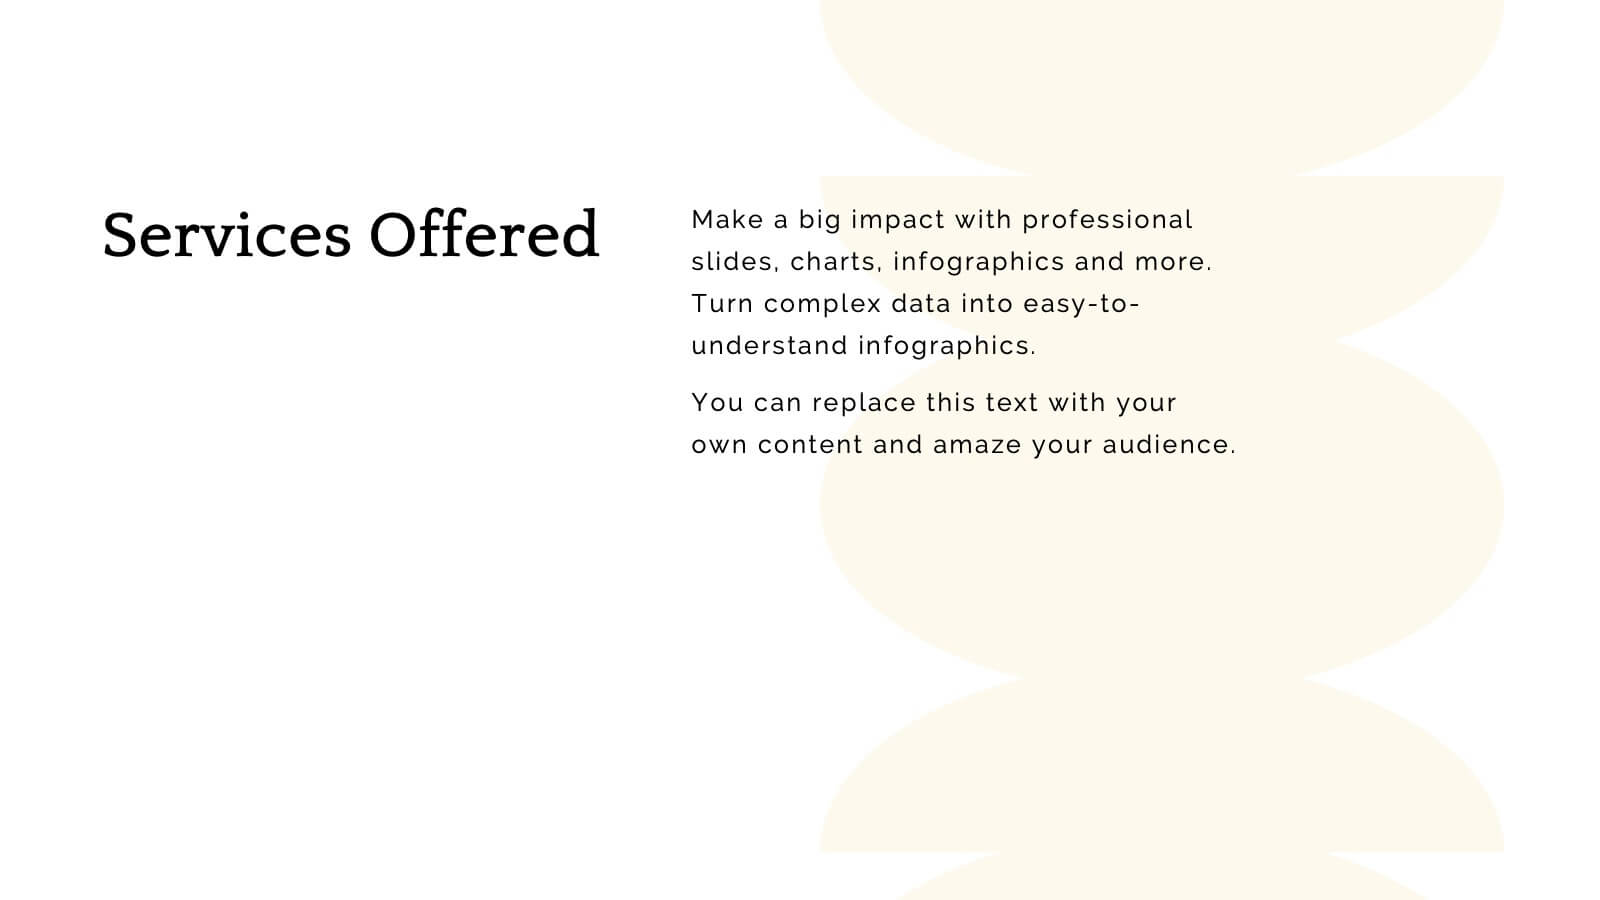
Flare Creative Portfolio Presentation
Showcase your creative work with this elegant portfolio template! Perfect for highlighting projects, client testimonials, and services offered. Ideal for artists, designers, and creatives aiming to impress clients and collaborators. Compatible with PowerPoint, Keynote, and Google Slides, this template ensures your portfolio is clear, professional, and visually stunning. Make your work shine!


8 diapositivas
Business Revenue and Profit Analysis Presentation
Analyze and visualize Business Revenue and Profit trends effectively with this modern and data-driven slide template. Featuring a dual-chart layout with reseller performance trends and purchase breakdowns, this slide is ideal for financial reports, sales presentations, and strategic business meetings. Fully customizable, you can edit the text, colors, and data to fit your specific needs. Compatible with PowerPoint, Keynote, and Google Slides for easy editing and seamless integration.


10 diapositivas
Business Risk Management Framework Presentation
Elevate your risk analysis with the "Business Risk Management Framework" template, offering a dynamic and customizable approach to effectively present and evaluate risk data. It features various risk gauges and icons for visual representation, ensuring key insights are easily understandable. This template facilitates comprehensive risk analysis presentations and is compatible with PowerPoint, Keynote, and Google Slides.


6 diapositivas
Tech Infrastructure Strategy Presentation
Build a smarter foundation for your tech-driven goals with a clear, layered design that showcases every stage of your technology roadmap. Perfect for presenting IT systems, cloud migration, or infrastructure planning, this presentation ensures clarity and impact. Fully compatible with PowerPoint, Keynote, and Google Slides for smooth customization.