


Características


¿Tienes alguna pregunta?
Recomendar


7 diapositivas
Digital Marketing Strategies Infographic
The Digital Marketing Strategies Infographic provides a colorful and organized presentation of key performance indicators and metrics essential for evaluating the success of digital marketing campaigns. It covers various platforms and strategies, illustrating comparative engagement rates, follower counts, and other relevant data points. This infographic is an excellent resource for marketers looking to convey their campaign results in a clear, concise manner. It is suitable for use in PowerPoint, Google Slides, and Keynote presentations, ideal for illustrating progress, setting benchmarks, and sharing insights with team members, stakeholders, or clients.


21 diapositivas
Vibrant Startup Pitch Deck Presentation
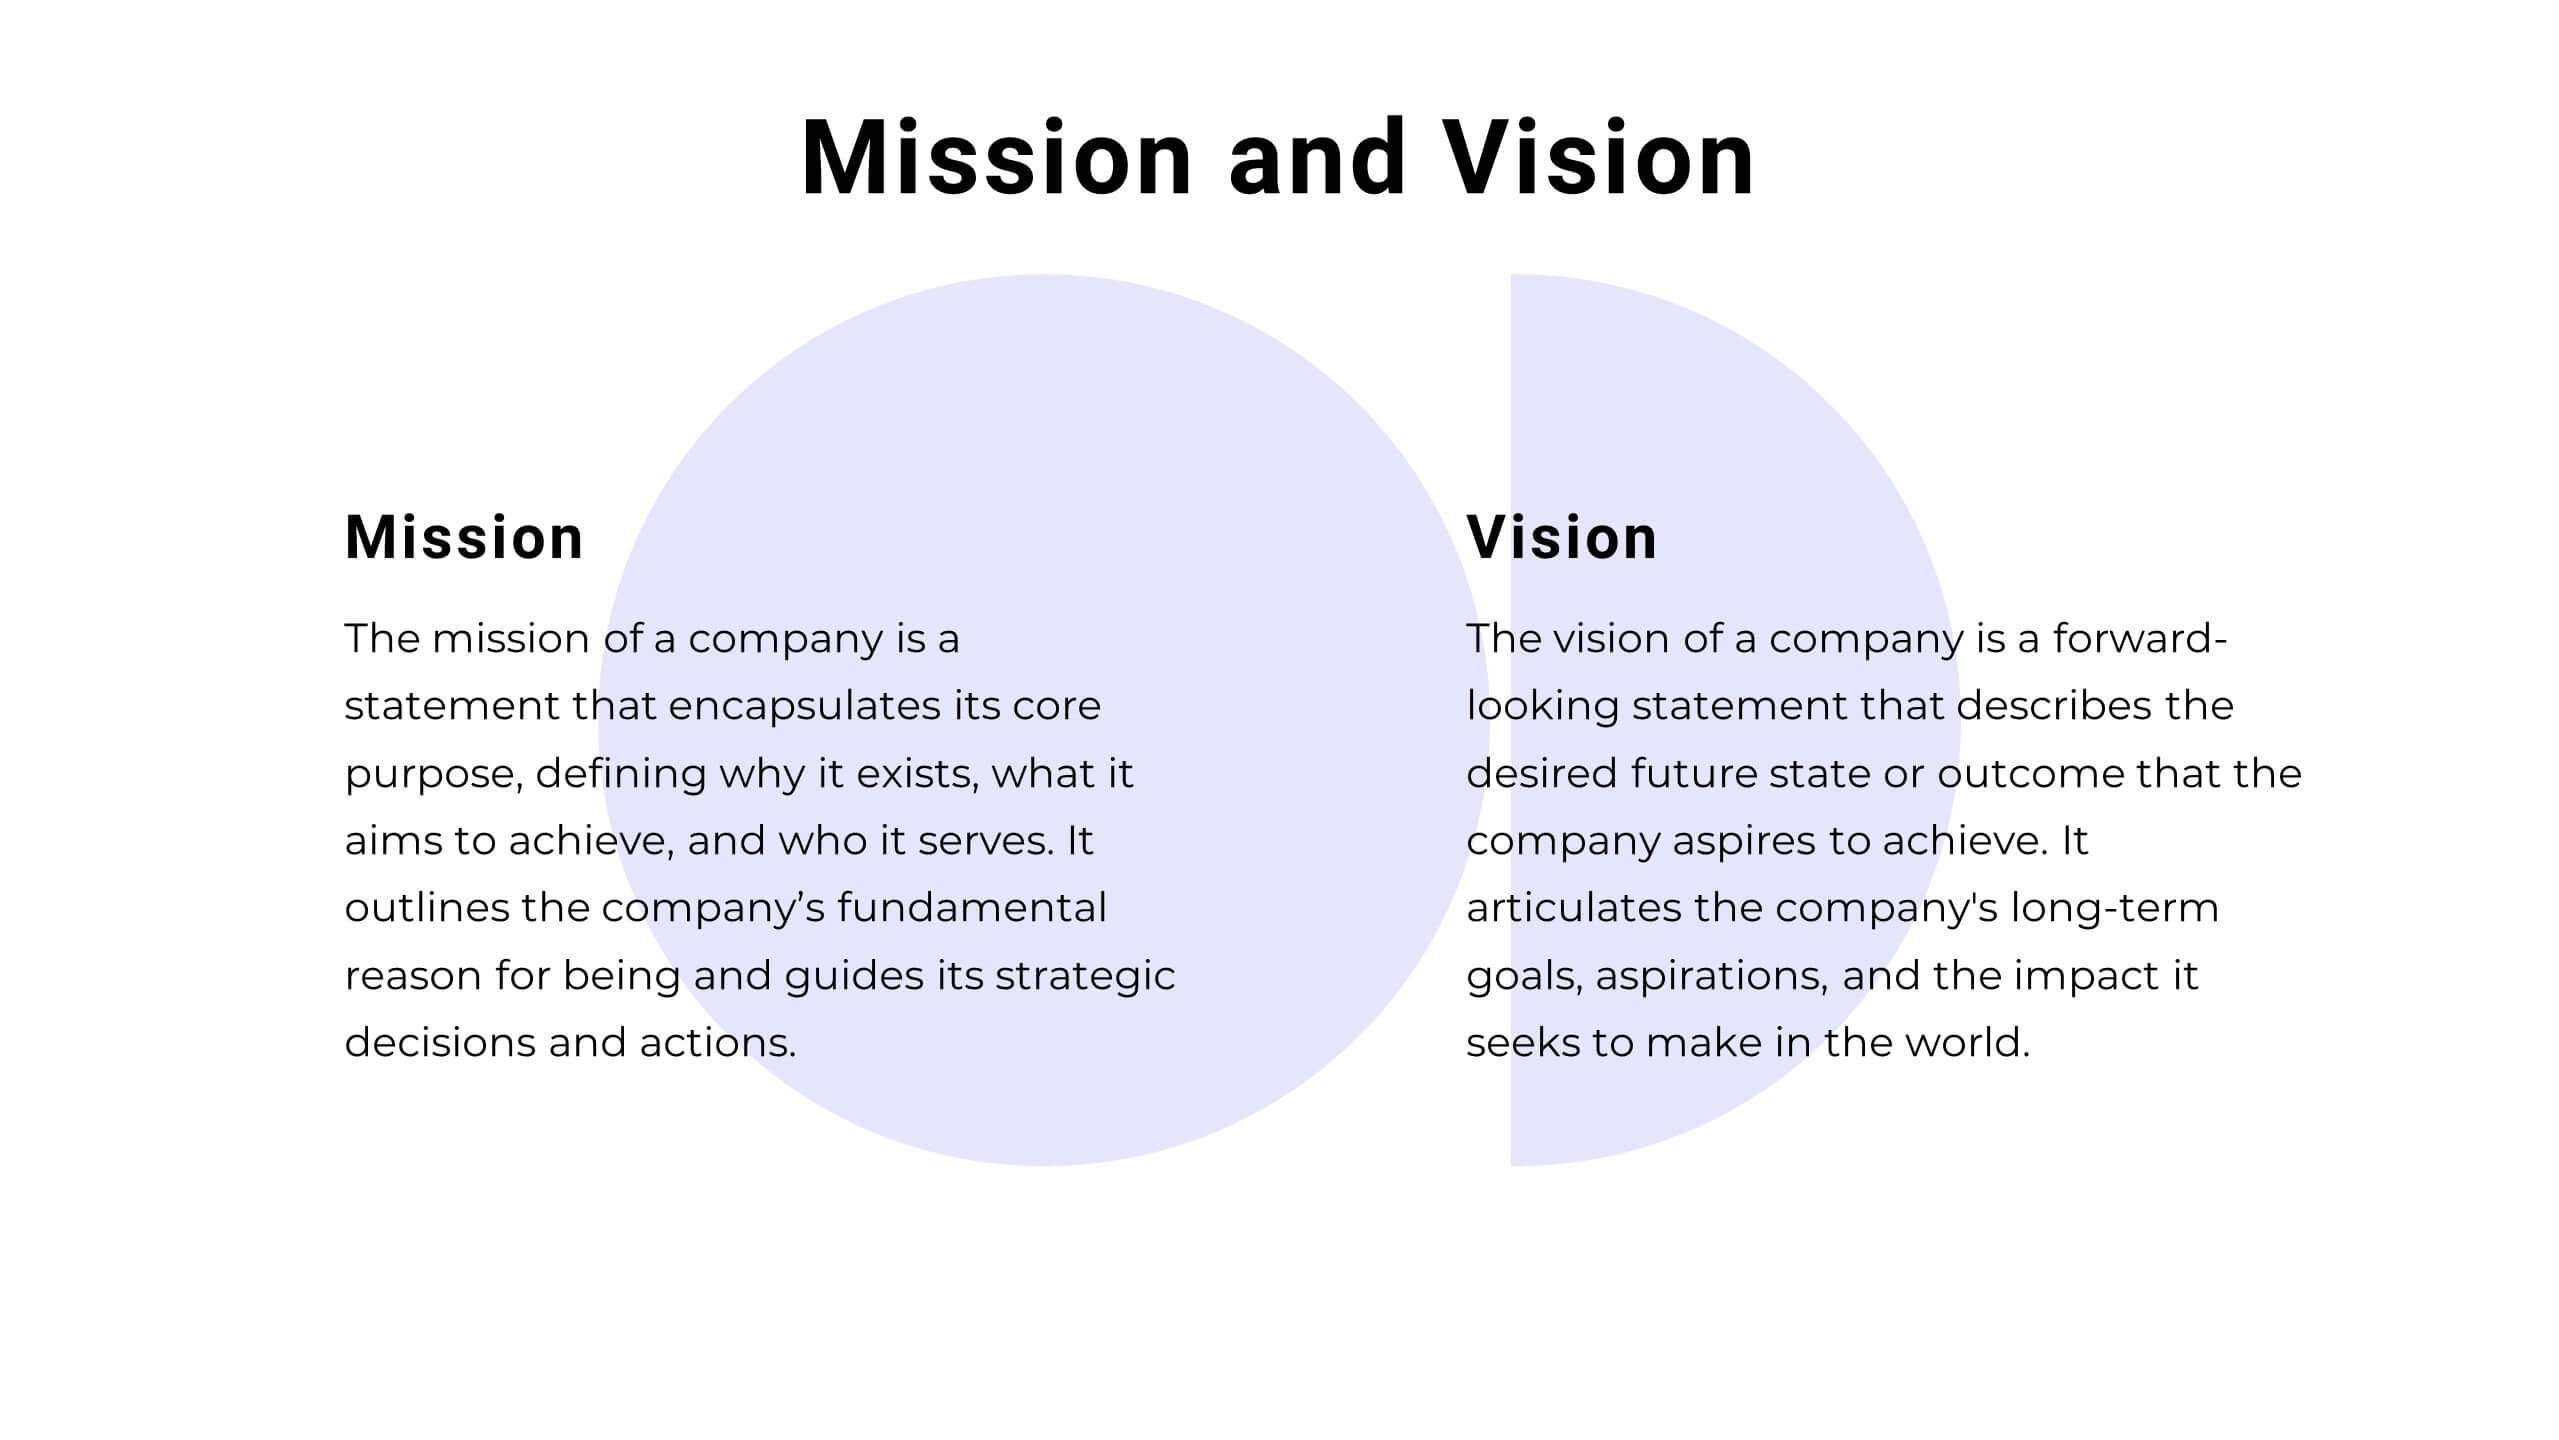
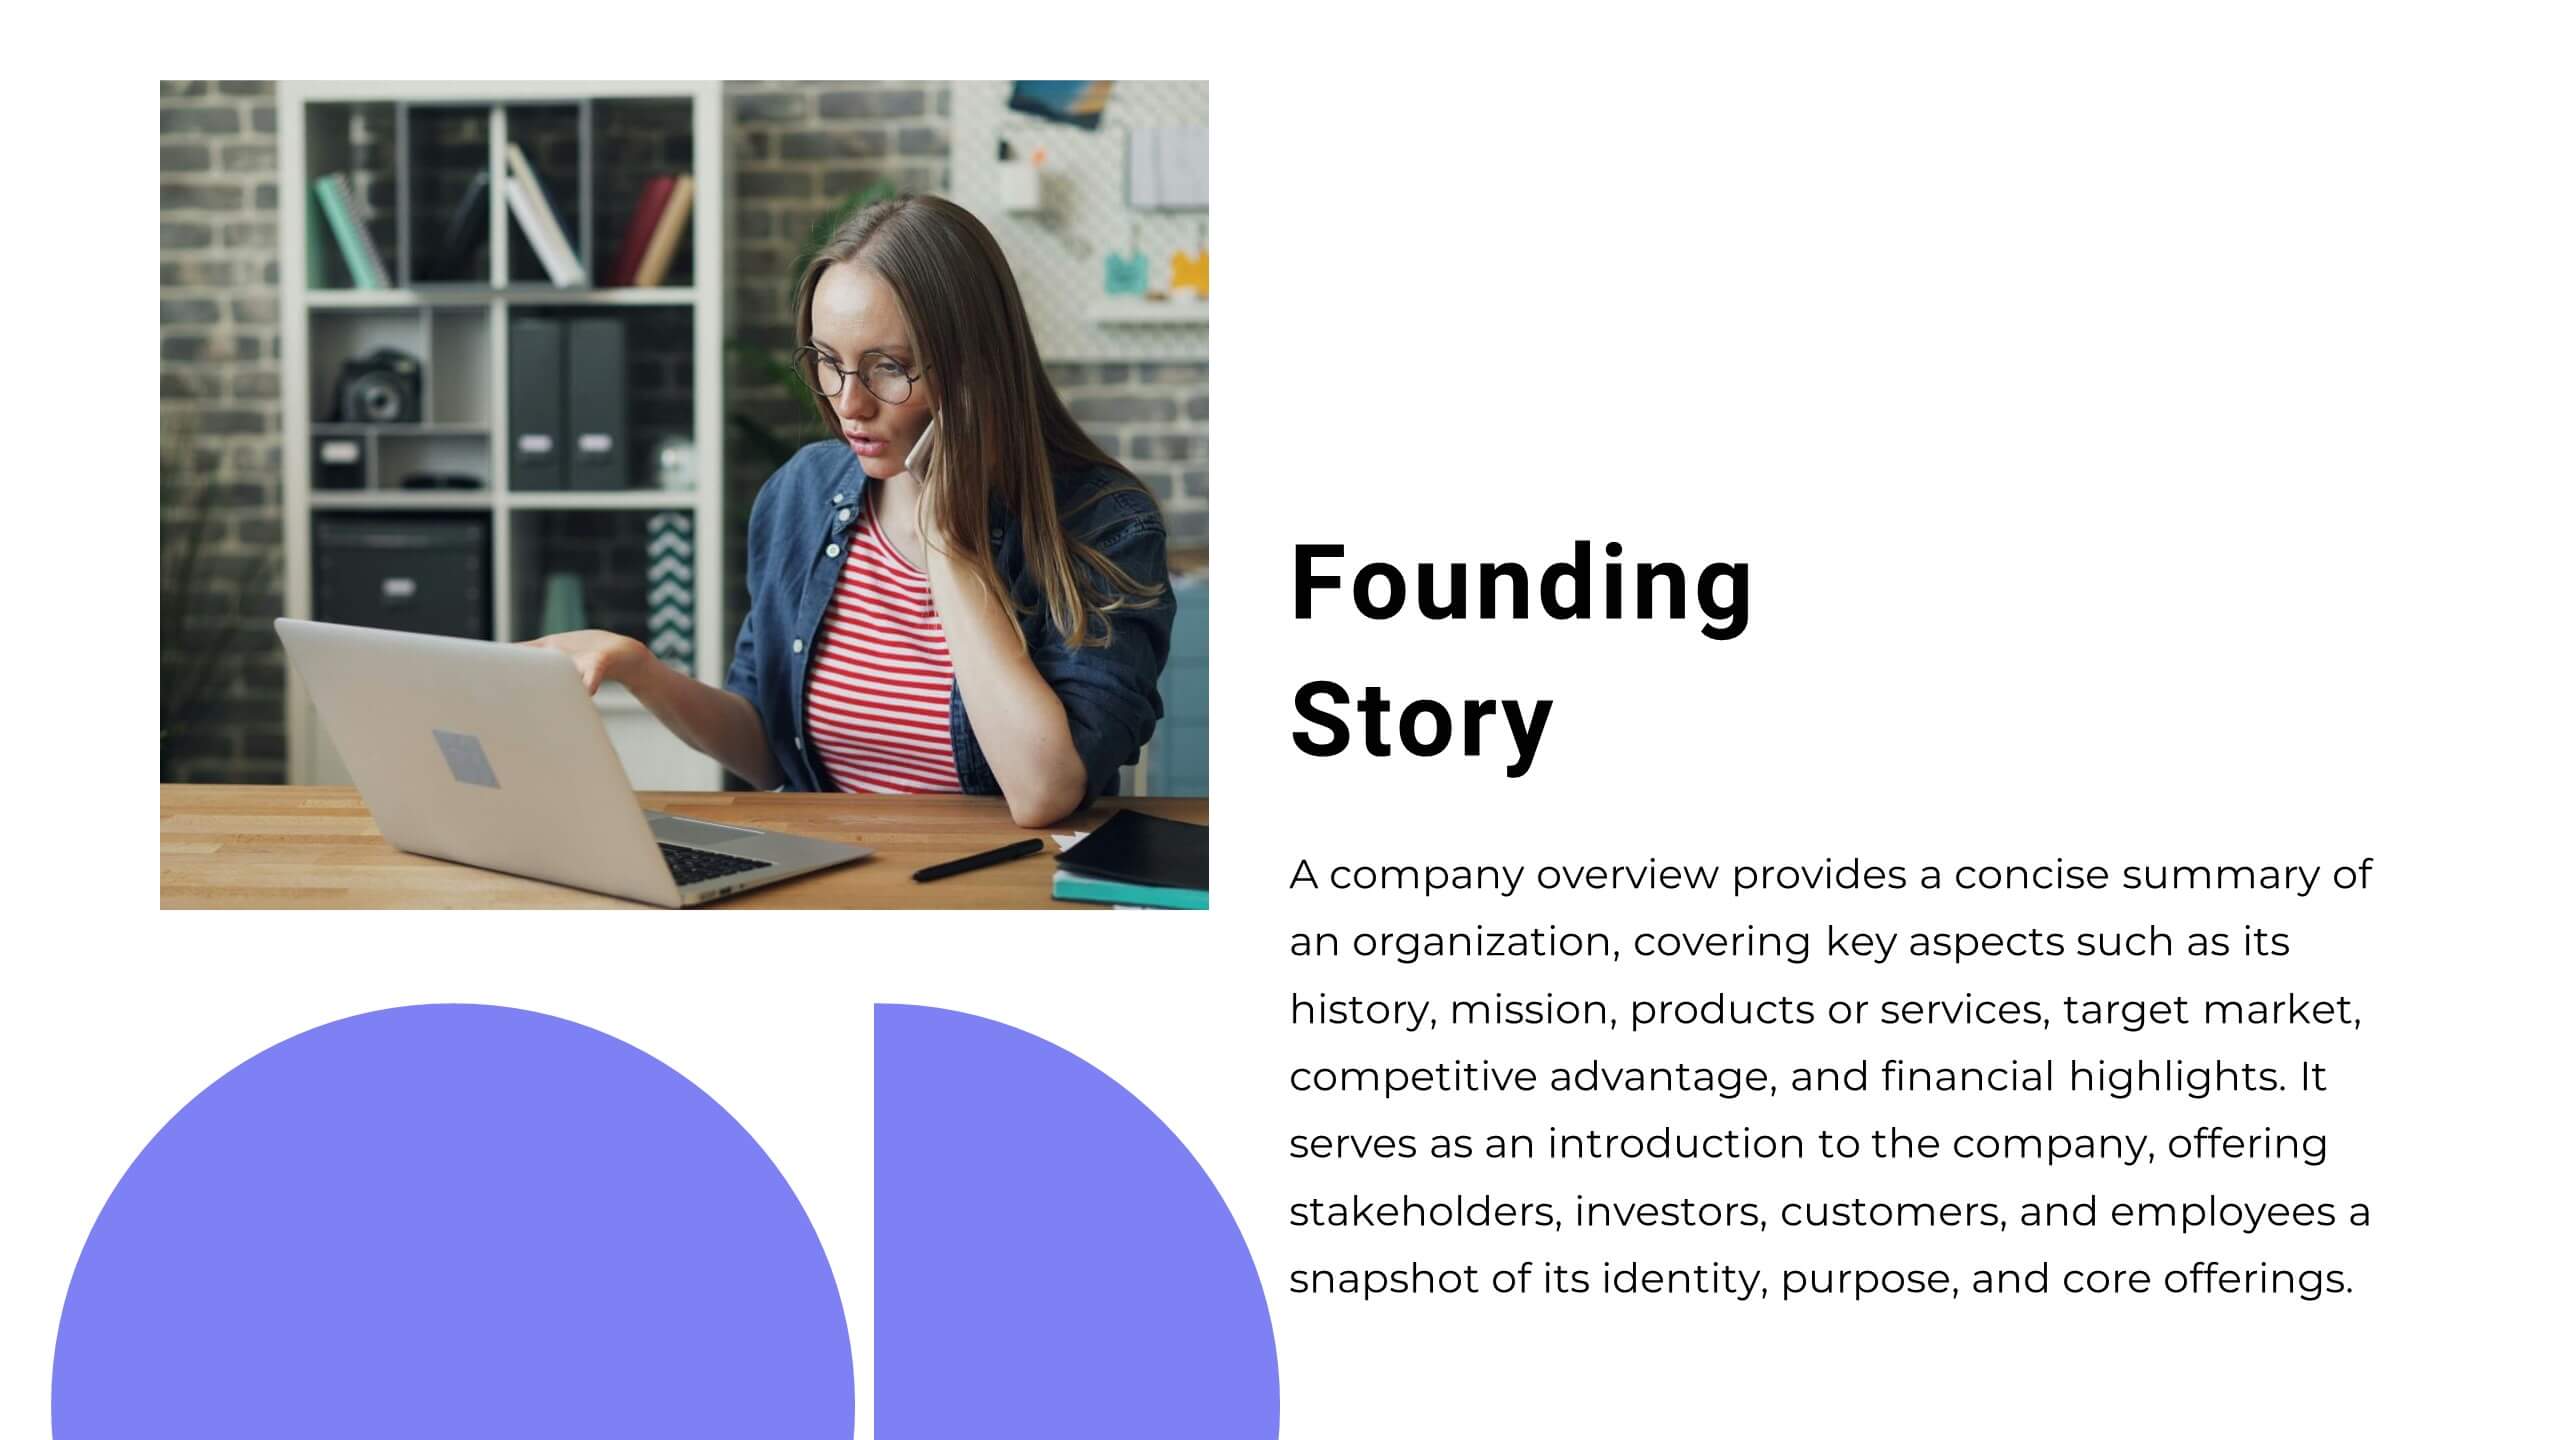
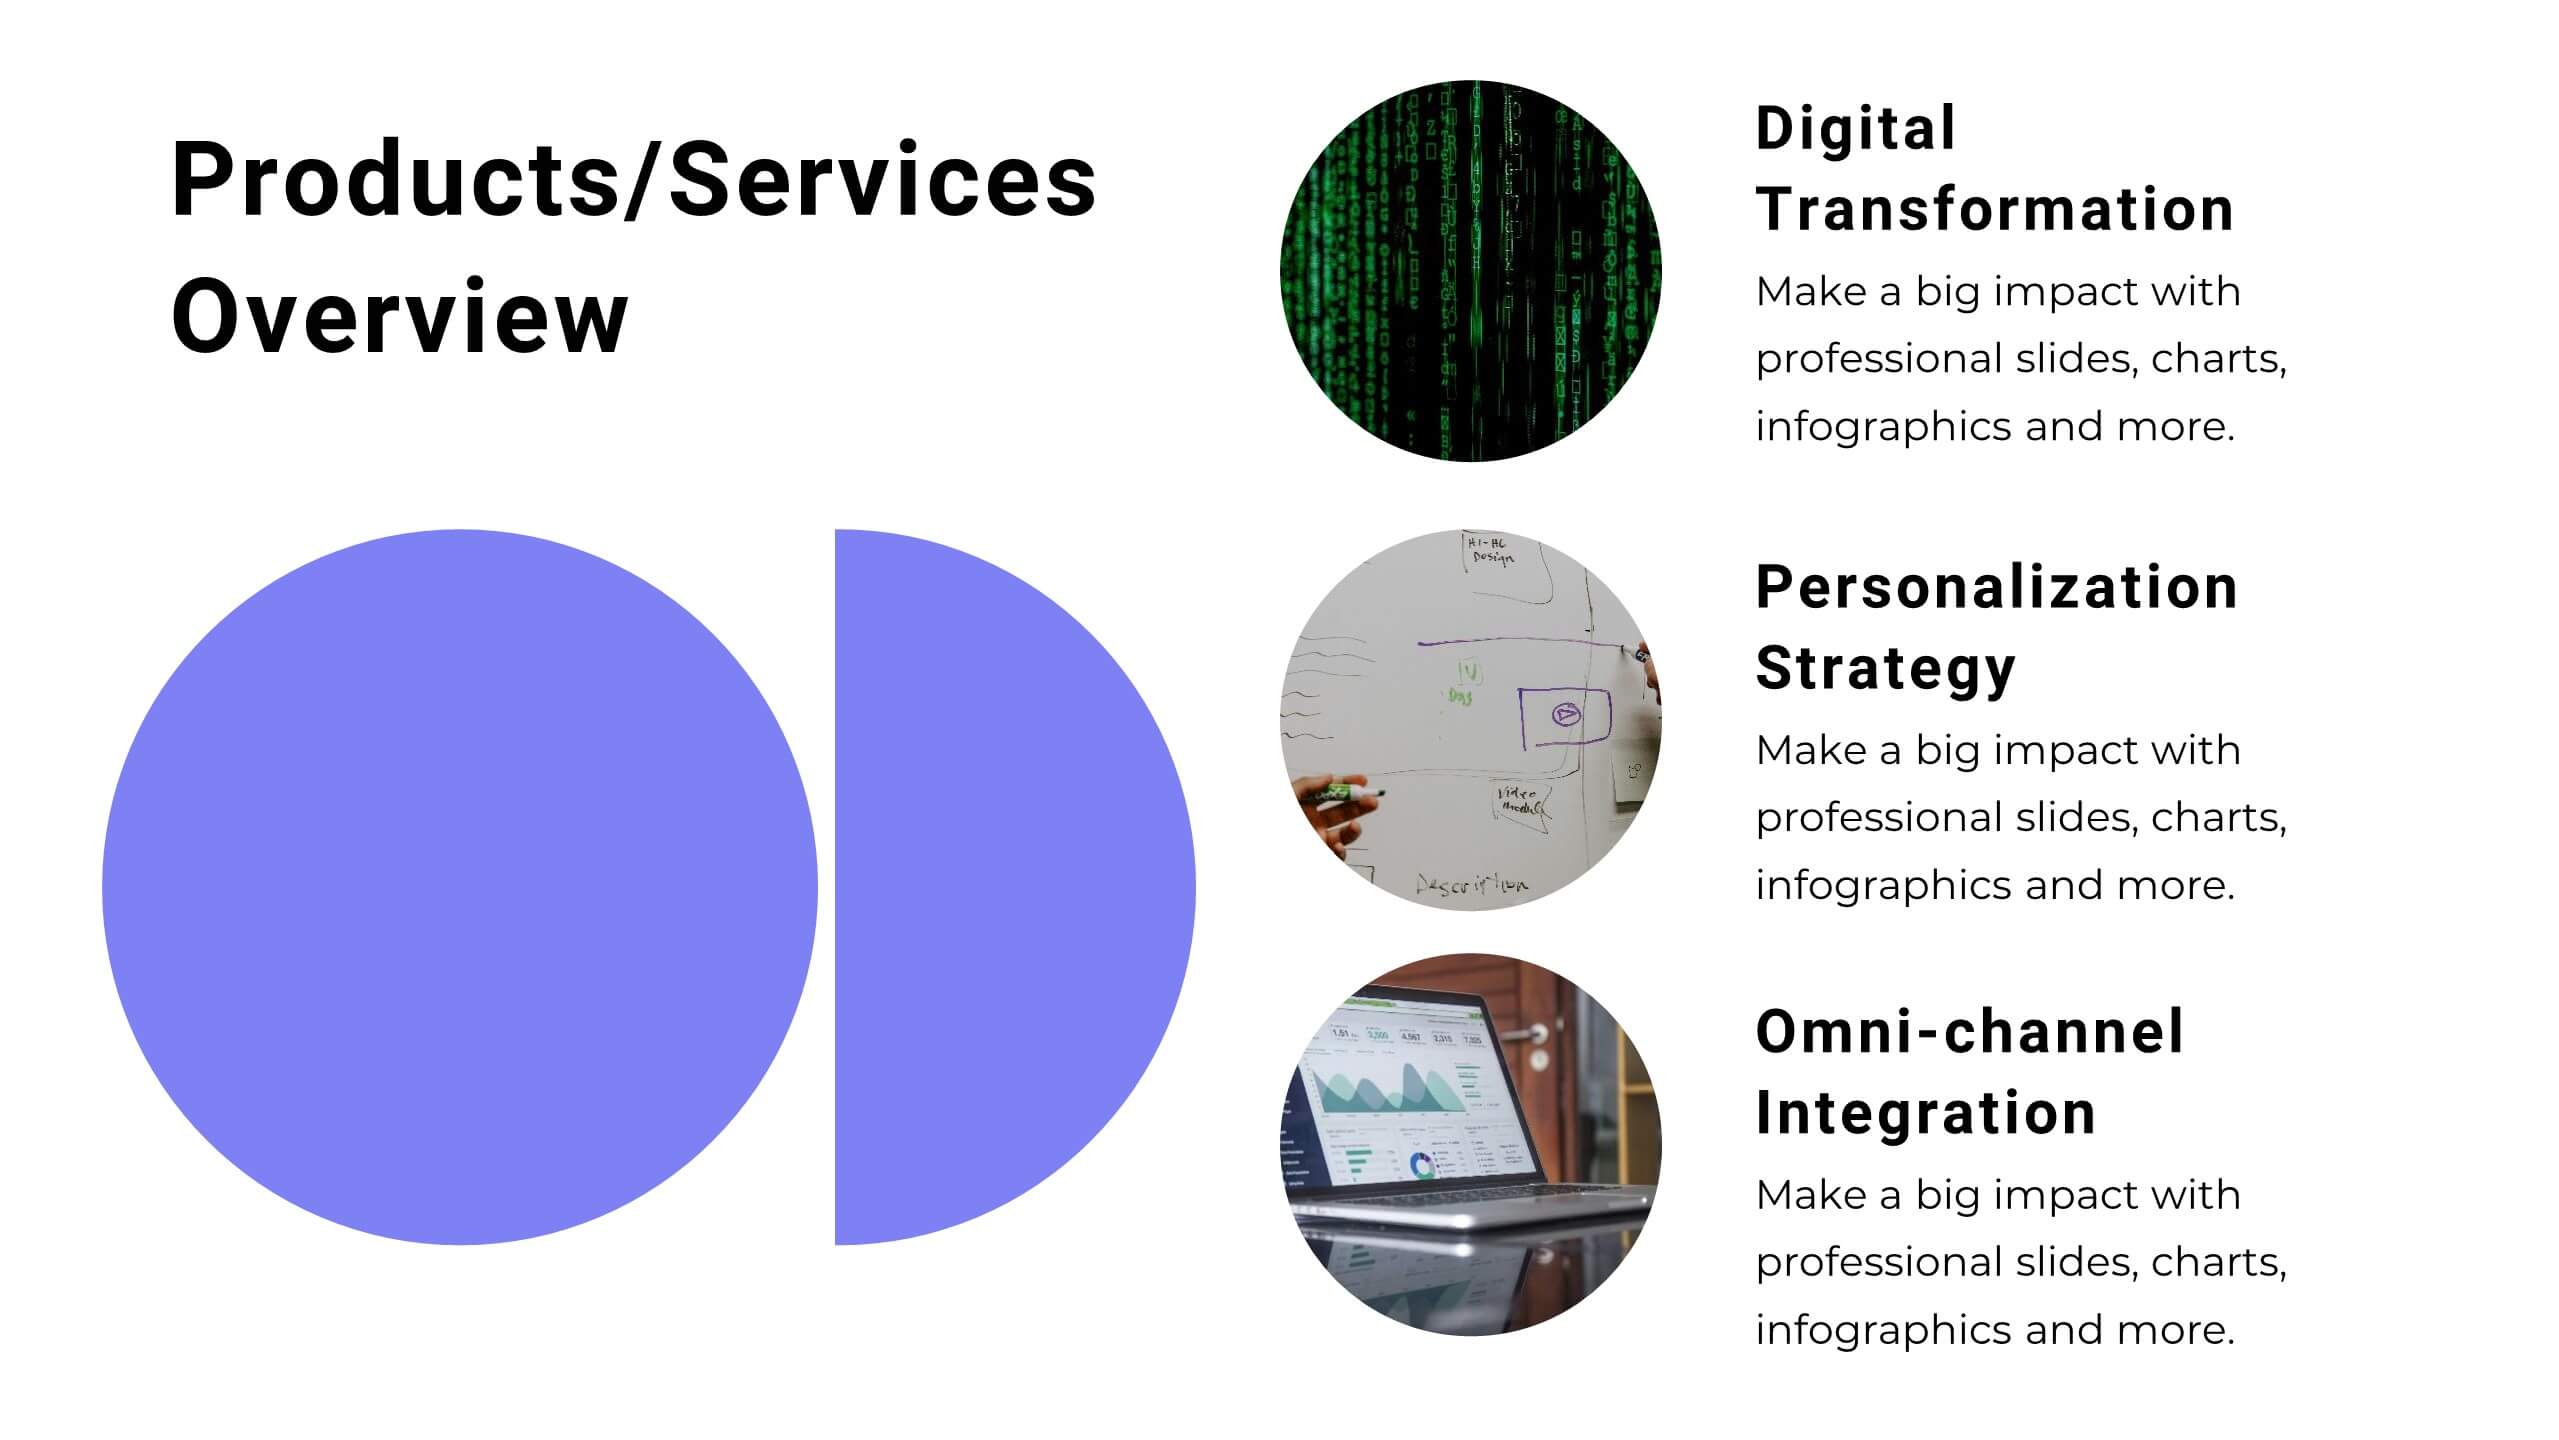
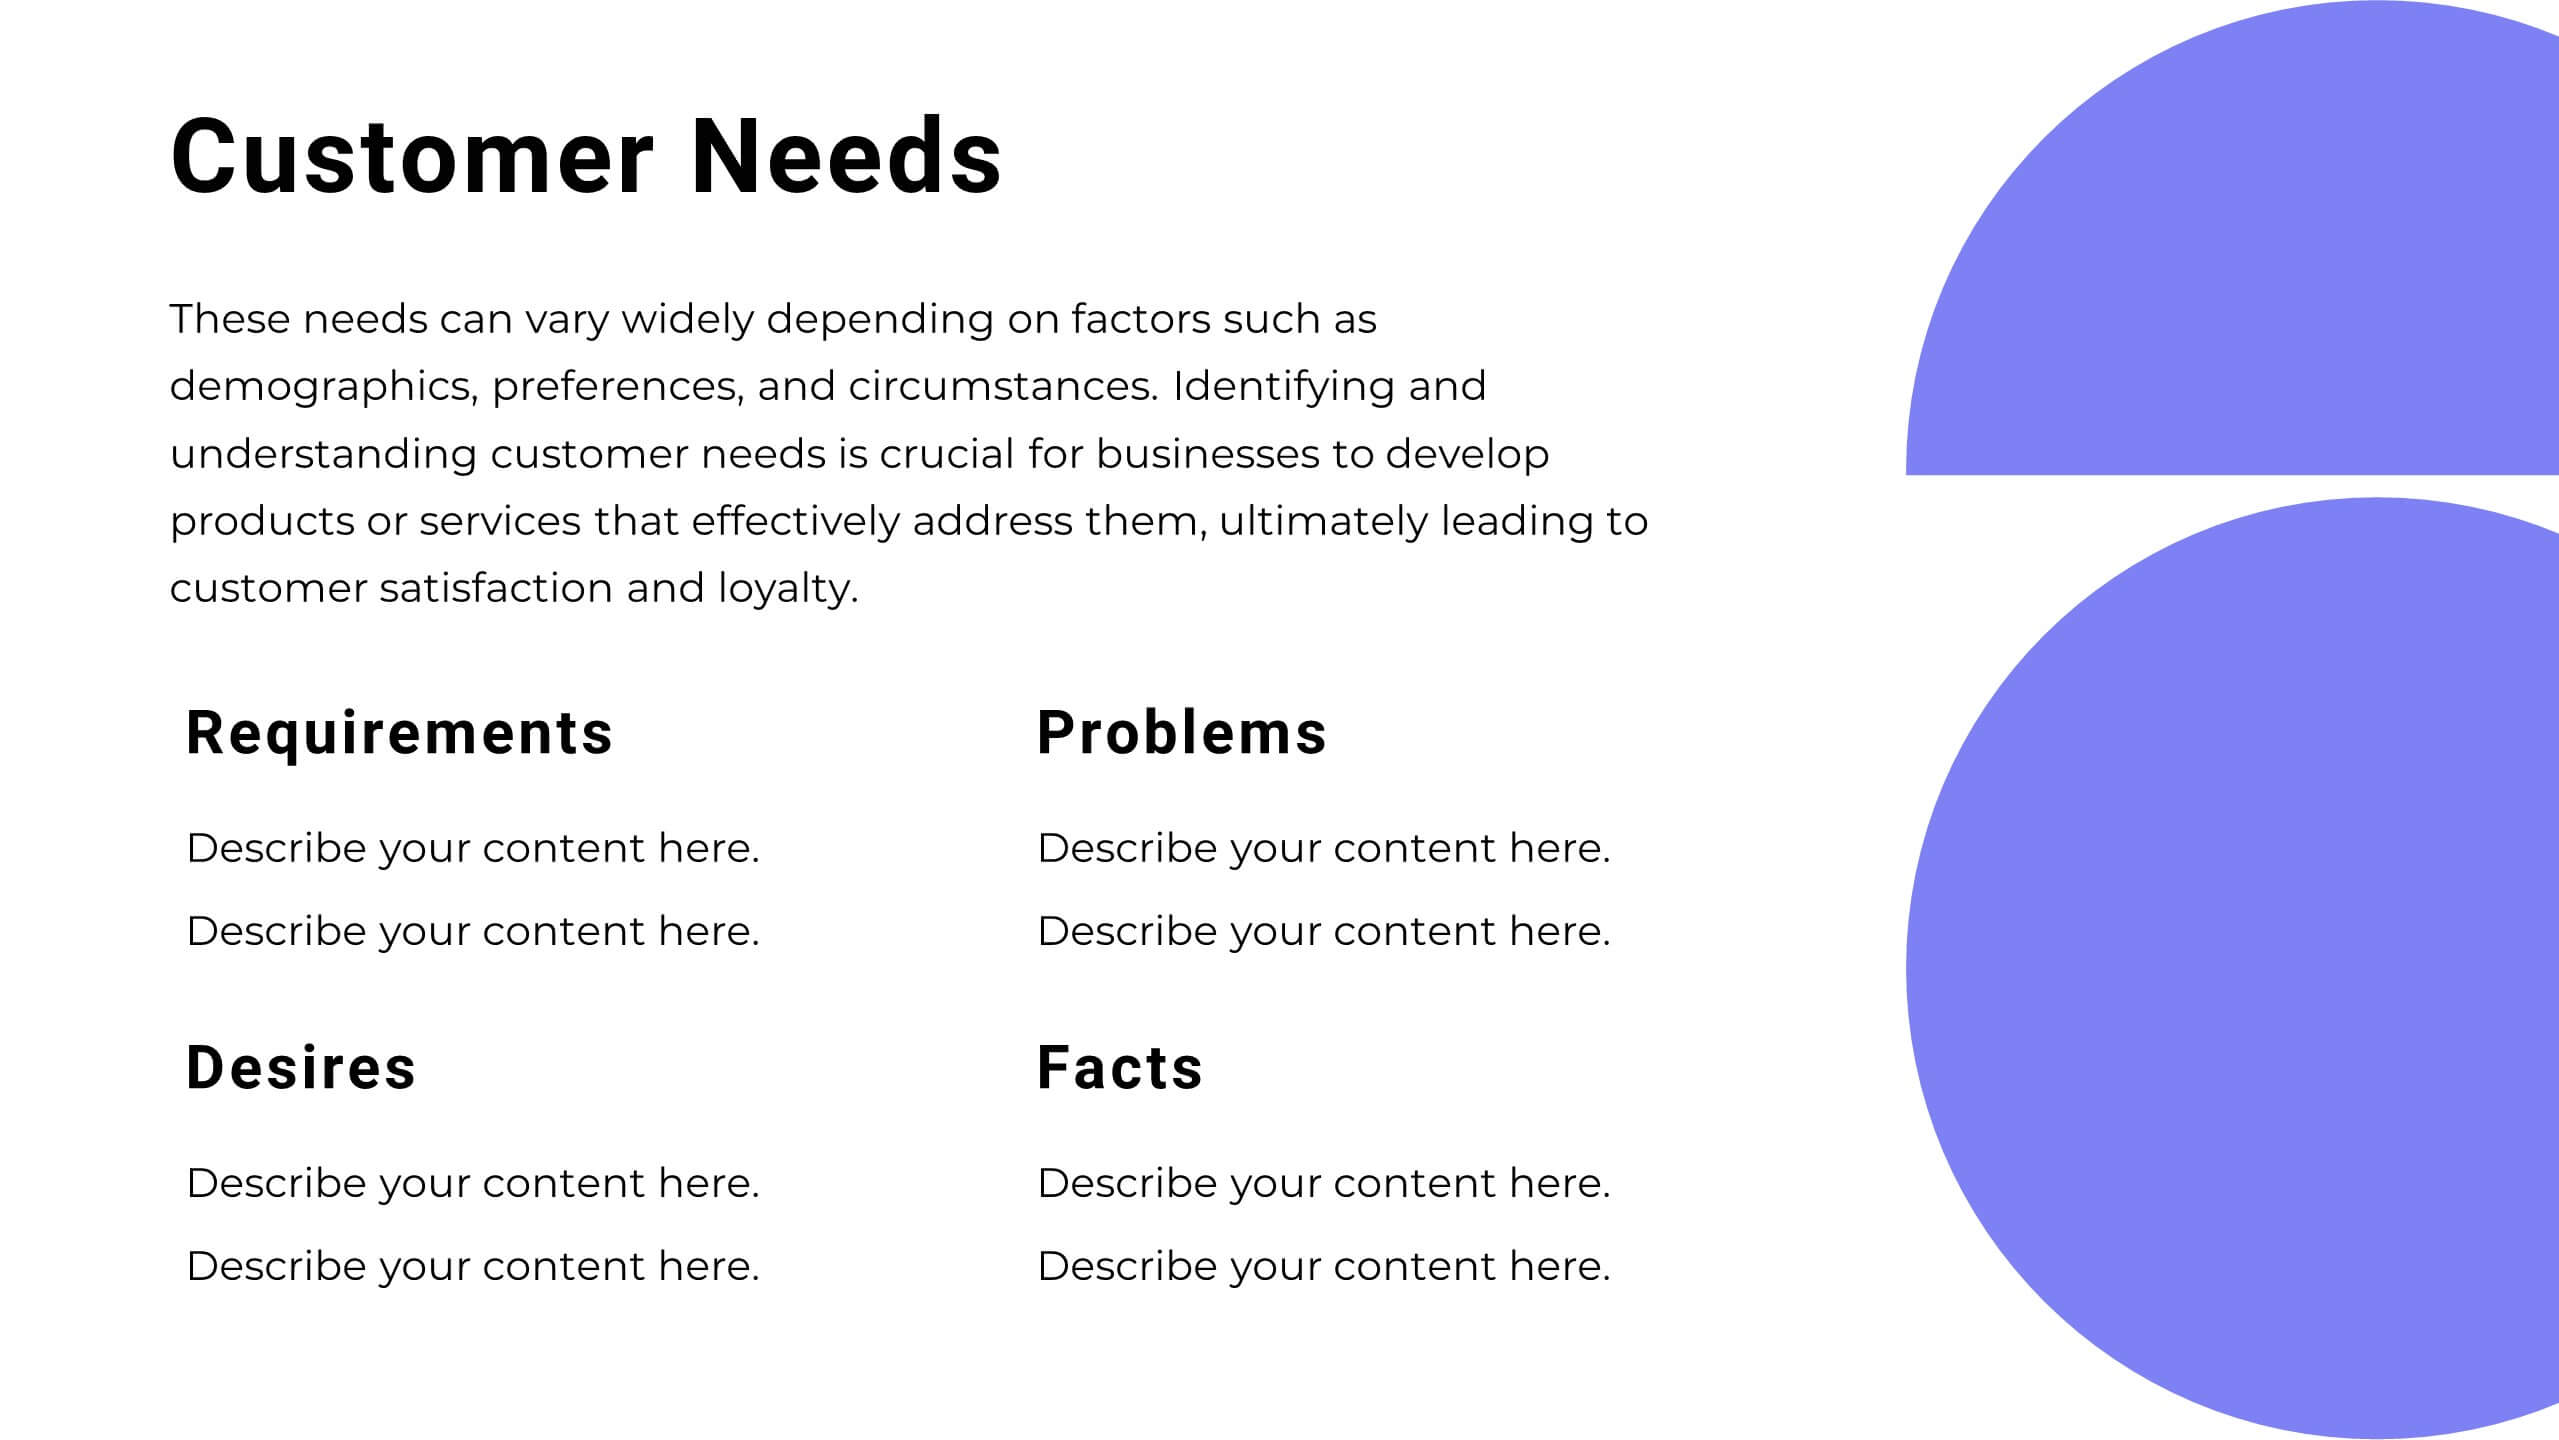
This dynamic and modern Startup Pitch Deck template is perfect for showcasing your startup's vision, strategy, and growth potential. Featuring a sleek design with bold visuals, this template guides you through key sections such as mission and vision, product/service overview, target market, and financial projections. It’s tailored to help you tell a compelling story that resonates with investors and stakeholders. The template is fully customizable in PowerPoint, Keynote, or Google Slides, ensuring you can adapt it to your specific needs and create a memorable presentation that leaves a lasting impression.


6 diapositivas
Safety Department Infographics
Promote safety awareness with our Safety Department infographic template. This template is fully compatible with popular presentation software like PowerPoint, Keynote, and Google Slides, allowing you to easily customize it to illustrate and communicate the role and functions of a safety department within an organization. The Safety Department infographic template offers a visually engaging platform to highlight the responsibilities, goals, and initiatives of a safety department. Whether you're a safety officer, HR professional, business leader, or interested in workplace safety, this template provides a user-friendly canvas to create informative presentations and educational materials. Enhance safety practices and awareness with this SEO-optimized Safety Department infographic template, thoughtfully designed for clarity and ease of use. Customize it to showcase safety protocols, training programs, incident reporting, and the importance of a safety-focused culture, ensuring that your audience understands the critical role of the safety department. Start crafting your personalized infographic today to promote a safer work environment.


7 diapositivas
Hospital Operations and Medical Services Presentation
Showcase hospital services, departments, or medical workflows with the Hospital Operations and Medical Services Presentation. Featuring a central hospital graphic with six surrounding icons, this slide is ideal for healthcare strategy, facility overviews, or operational planning. Easily editable in Canva, PowerPoint, Keynote, and Google Slides for versatile use in any healthcare setting.


7 diapositivas
Asia Map Overview Infographic
Dive into the vast and varied landscape of Asia with our collection of infographic slides designed to provide an insightful overview of the continent. These templates are ideal for educators, business professionals, and researchers looking to present data on Asia’s geography, demographics, economic status, and more. Each slide is meticulously crafted to display information clearly and attractively, using maps, charts, and icons to represent statistical data and trends across Asia. The different shades and colors used in the maps distinguish between countries, regions, or data points, making it easy for audiences to grasp complex information at a glance. These templates are fully customizable, enabling you to highlight specific areas or data according to your presentation needs. Whether discussing population growth, economic development, or environmental concerns, these slides are an excellent resource for conveying detailed information in a visually engaging format.


5 diapositivas
Real Estate Requirements Infographics
Real Estate Infographics can be an effective way to convey information about the real estate industry in a visually appealing and simple manner. This infographic template is perfect to showcase market trends, statistics, and data in a clear and concise way, making it easier for your audience to interpret the information. As well as educating and informing your clients, investors, and other stakeholders about various aspects of the real estate market. Overall, these infographic will help you communicate information about the real estate industry and help your clients make informed decisions about buying, selling, or investing in property.


5 diapositivas
Health and Safety Training Presentation
Ignite your team's commitment to safety with our 'Health and Safety Training' presentation template. Designed to highlight key safety practices and emergency procedures, this tool is essential for effective training sessions. Ideal for any organization, it's compatible with PowerPoint, Keynote, and Google Slides, ensuring wide accessibility.


6 diapositivas
Market Trends and Insights Year in Review Presentation
Analyze seasonal shifts with clarity using the Market Trends and Insights Year in Review Presentation. This quarterly layout lets you break down key trends, data, and highlights by month, helping stakeholders visualize market behavior throughout the year. Ideal for analysts, marketers, and strategy teams. Fully customizable and works seamlessly with PowerPoint, Keynote, and Google Slides.


5 diapositivas
Cybersecurity Protocols and Threat Response Presentation
Visualize your security framework with the Cybersecurity Protocols and Threat Response presentation slide. Featuring a central lock icon surrounded by four quadrant-based callouts and symbolic icons (e.g., fingerprint, shield, malware), it’s ideal for outlining access controls, incident response, and threat monitoring strategies. Fully editable in PowerPoint, Keynote, and Google Slides.


5 diapositivas
Product Marketing Slide Presentation
Spark interest instantly with a bold, circular layout that transforms product insights into a clean, memorable story. This presentation helps you explain features, audience needs, and value propositions in an organized, visual flow that keeps attention on what matters most. Fully customizable for PowerPoint, Keynote, and Google Slides.


5 diapositivas
Data Entry Infographics
Dive into the intricate world of information management with our data entry infographics. Cast in shades of blue, warm orange, and an array of inviting colors, this vertically styled template is a boon for business analysts, administrative assistants, and database managers. The design, punctuated with relevant graphics, icons, and strategic image placeholders, simplifies complex data narratives. It serves as a visual anchor, ensuring information accuracy and efficiency. This essential tool is instrumental for professionals striving to maintain data integrity while elucidating critical entry processes, thereby fostering a streamlined workflow.


10 diapositivas
Risk Management Plan Presentation
The "Risk Management Plan Presentation" template is designed to outline strategic steps for identifying, assessing, managing, and monitoring business risks. Each segment of the plan is clearly labeled and represented on a segmented wheel, with A identifying risks, B assessing them, C managing responses, and D monitoring and reporting outcomes. The clean and straightforward design ensures key risk management strategies are communicated effectively to stakeholders. This visual tool is perfect for business meetings or training sessions, helping teams understand their roles in mitigating risks and ensuring that the business maintains a proactive approach to challenges.


7 diapositivas
Business Plan Strategy Infographic
A business plan is a written document that outlines a company's goals and the strategy it will use to achieve those goals. This infographic template is a comprehensive roadmap for how a business intends to operate, grow, and succeed in its market. Compatible with Powerpoint, Keynote, and Google Slides. This template is meticulously designed to help you craft a well-structured business plan, empowering entrepreneurs and professionals to navigate their journey to success. Let this be your compass as you navigate the complexities of entrepreneurship and strive for business excellence!


6 diapositivas
Creative Process Infographic
The Creative Process Infographic offers a visually engaging and systematic approach to outlining the steps of a successful project or strategy. This template beautifully segments the process into distinct, color-coded stages, making it ideal for presentations, workshops, or educational materials that aim to simplify and illustrate the progression from concept to completion. Each section is clearly defined, providing a structured pathway that can be customized to detail specific tasks, checkpoints, or goals. This infographic is versatile and fully editable, suitable for Powerpoint, Google Slides, and Keynote, ensuring that it can be adapted to a wide range of topics and audiences.


7 diapositivas
Business Puzzle Infographic Presentation
A Puzzle Piece Infographic is great for visualizing and communicating complex topics, such as the order of steps to solve a problem or a methodical process. This template is great if you want to show your audience how different topics relate to each other, or if you want to illustrate how information fits together. This infographic will allow you to showcase your data and information in a fun, visual way. The puzzle design will help you organize information for your audience to easily understand. This template is compatible with Powerpoint, keynote and google slides, making it easy to edit!


6 diapositivas
Marketing Campaign Strategy Presentation
Spark fresh ideas and guide your audience through every stage of a powerful promotional plan with this dynamic, compass-style layout. This presentation helps visualize goals, channels, and key steps in a clear, structured flow that’s easy to follow. Fully customizable for PowerPoint, Keynote, and Google Slides.


22 diapositivas
Shield Digital Agency Strategy Plan Presentation
Embark on a journey to elevate your digital agency with this comprehensive and sleek presentation template! Perfect for showcasing your agency’s strengths, strategies, and successes, this template covers everything from market analysis to client testimonials. It’s designed to make your agency’s strategy plan stand out. Compatible with PowerPoint, Keynote, and Google Slides for seamless use.