


Características


¿Tienes alguna pregunta?
Recomendar


4 diapositivas
Wheel of Progress Planning Tool Presentation
Visualize goals, track development stages, or outline key initiatives with the Wheel of Progress Planning Tool Presentation. This dynamic circular design divides progress into four customizable quadrants (A–D), perfect for strategic planning, KPI tracking, or team milestone updates. Each segment features editable labels and supporting descriptions. Ideal for PowerPoint, Keynote, and Google Slides.


6 diapositivas
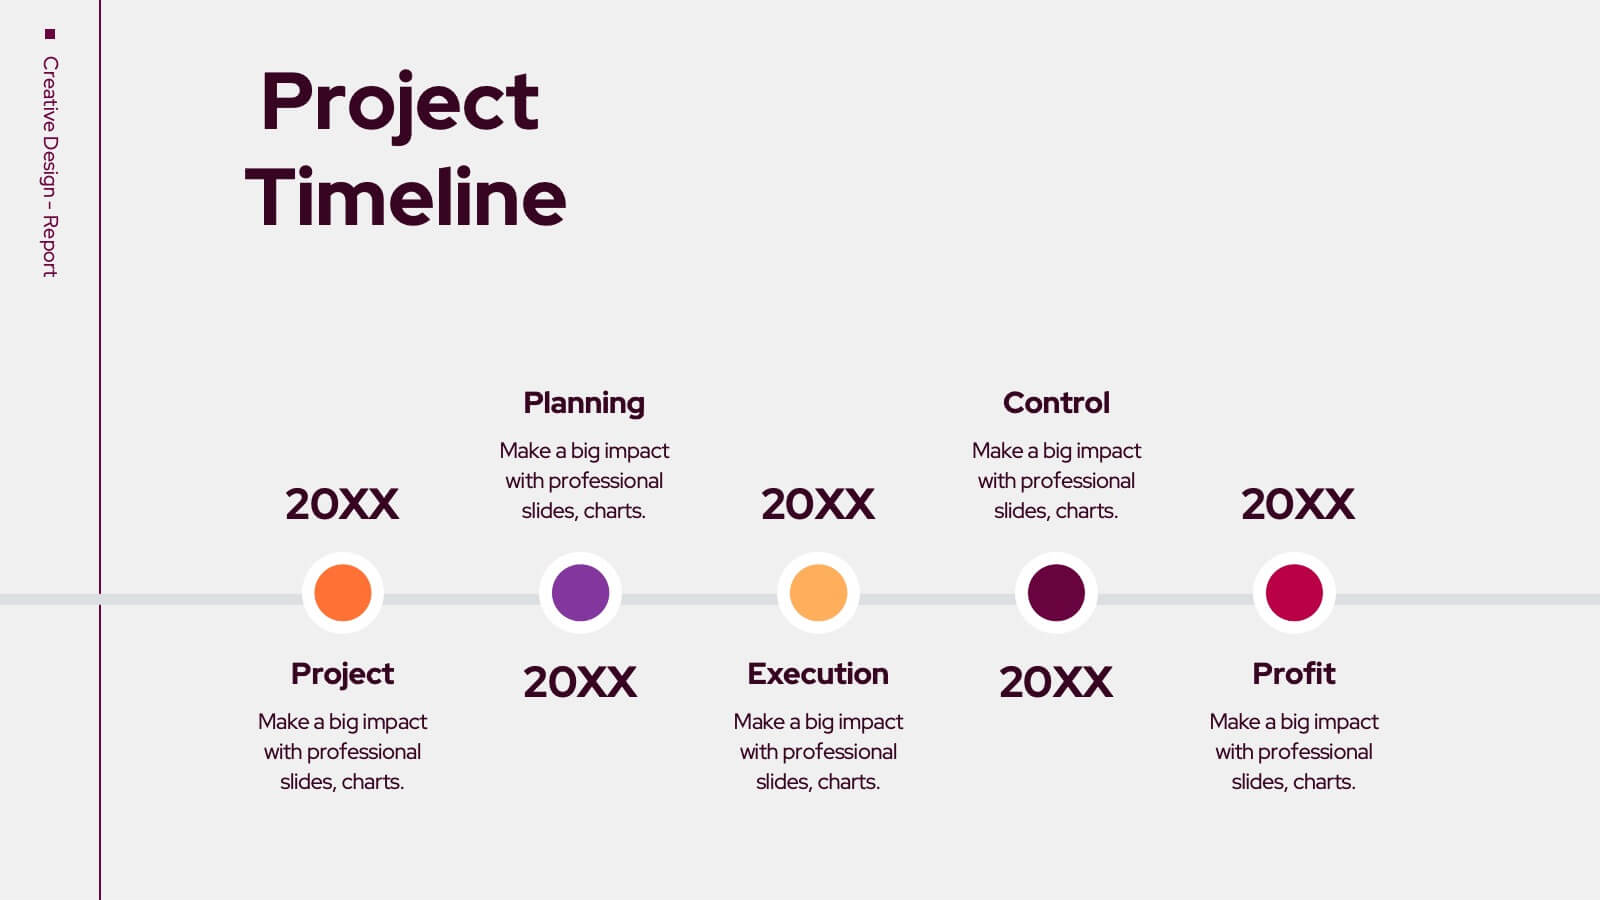
Simple Horizontal Timeline Design Presentation
Bring your story to life with a smooth, step-by-step visual that guides viewers through key events with clarity and ease. This presentation helps you outline timelines, processes, or project stages in a clean horizontal flow that’s simple to follow and easy to customize. Fully compatible with PowerPoint, Keynote, and Google Slides.


24 diapositivas
Crest User Experience Proposal Presentation
Present your user experience design proposal with a vibrant and engaging template! This design covers key UX aspects like user research, wireframes, prototyping, and usability guidelines. Ideal for showcasing your process from personas to interaction design, it's fully compatible with PowerPoint, Keynote, and Google Slides for seamless presentations.


6 diapositivas
Detailed Info Table with Metrics
Present complex insights with clarity using the Detailed Info Table with Metrics Presentation. Designed to showcase up to five key items or categories, this layout includes structured rows and multiple columns—perfect for comparing metrics, milestones, or KPIs across several dimensions. With bold numbering and clean typography, this editable slide works in PowerPoint, Keynote, and Google Slides.


7 diapositivas
Blue Ocean Diagram Presentation
The Blue Ocean Strategy goal is to create a market space that is untapped, and in doing so, break away from the competition, create new demand, and increase profits. This template is designed for use in Powerpoint, Keynote, and Google Slides, and is perfect for anyone looking to create an informative and engaging presentation on this topic. This template is a useful tool for professionals and students. It provides informative illustration and information about the Blue Ocean Strategy to help you visually present your research, build a strategy or deliver a presentation on blue ocean strategies.


26 diapositivas
Digital Agency Pink Themed Company Profile
A fashion digital agency is a specialized agency that provides a range of digital marketing, advertising, and branding services tailored to the fashion industry. This template focuses on helping you leverage your digital platforms and technologies to enhance brand visibility, engage target audiences, drive sales, and create a strong online presence for your fashion brand. Fully customizable and compatible with Powerpoint, Keynote, and Google Slides. The elegant shades of pink reflect the fashion-forward and creative nature of your agency. Use this presentation template to showcase your best work, fashion trends, and styles.


6 diapositivas
Competitor Benchmark Analysis Table Presentation
Visually compare competitors with this structured benchmark analysis template. Perfect for business strategy, market research, or product comparison presentations. Features colorful indicators and editable labels to showcase performance, differentiation, or KPIs. Fully customizable in PowerPoint, Keynote, and Google Slides—ideal for marketing teams, consultants, or competitive landscape reviews.


14 diapositivas
IT Service Operations Strategy
Simplify complex IT operations into an intuitive visual strategy. This slide features a dynamic radial flow diagram and labeled segments to illustrate service components, support tiers, or incident flows. Perfect for IT managers, consultants, and teams aligning service delivery with business goals. Fully editable in PowerPoint, Keynote, or Google Slides


7 diapositivas
Mind Map Infographic Presentation Template
A mind map is a diagram that allows you to visualize how related ideas and concepts are connected to one another. It is especially good for brainstorming, planning and organizing. A mind map allows you to organize information in a way that shows your thinking process and gives you the opportunity for deeper understanding. This template will help others understand how you think about a particular subject or topic. Use this template to "brainstorm" a topic, and create an interesting mind map. You can also use it to share your ideas with others, or to visually organize your thoughts.


6 diapositivas
KPI Overview in Dashboard Format Presentation
Track performance at a glance with this KPI Overview in Dashboard Format presentation. Featuring visual gauge meters and progress indicators, it's perfect for reporting on targets, performance metrics, and business KPIs. Clean and modern layout, fully customizable in Canva, PowerPoint, and Google Slides to match your data visualization needs.


6 diapositivas
Bubble Chart Data Visualization Presentation
Make your data pop with visuals that tell a story at a glance. This modern presentation transforms raw numbers into clear, engaging bubble charts that simplify complex insights and comparisons. Fully editable and compatible with PowerPoint, Keynote, and Google Slides for effortless customization and professional results.


6 diapositivas
Real Estate Classes Infographic
Real estate classes are educational programs or courses that provide individuals with the knowledge and skills needed to succeed in the real estate industry. This infographic template provides an overview of different types of real estate classes and what real estate is. This is designed to help individuals interested in the real estate industry understand the various educational opportunities available to them. Help your audience make informed decisions about their educational journey in the real estate field. Fully customizable and compatible with Powerpoint, Keynote, and Google Slides.


6 diapositivas
Eco-Conscious Business Practice Overview Presentation
Communicate your sustainability initiatives with the Eco-Conscious Business Practice Overview Presentation. This modern infographic template features a 5-part petal leaf layout to display eco-friendly actions, green goals, or corporate values. Ideal for environmental reports, ESG updates, or internal awareness decks. Fully editable in Canva, PowerPoint, Keynote, and Google Slides.


7 diapositivas
Brainstorm Bubble Map Infographic
A brainstorm bubble map is a visual representation used to generate and organize ideas, concepts, or information around a central theme or topic. This infographic template is designed to be a versatile tool commonly utilized in brainstorming sessions, planning, problem-solving, or organizing thoughts. Compatible with Powerpoint, Keynote, and Google Slides. Fully customizable, visualize a multitude of colorful bubbles branching out from the central theme, each encapsulating a unique idea or concept. The vibrant and lively color palette adds an element of fun, reflecting the joy that comes from a successful brainstorming session.


8 diapositivas
Team Performance and Sports Analysis Presentation
Highlight team rankings and sports metrics with the Team Performance and Sports Analysis template. Featuring a dynamic race track-inspired layout with numbered positions, icons, and vivid color coding, it’s ideal for comparing performance. Fully customizable in Canva, PowerPoint, and Google Slides to match your sport, brand colors, and presentation goals.


5 diapositivas
Strategic Planning with Concentric Circles
Draw your audience in with a visual that’s as focused as your message! This strategic concentric circles template helps you map out layered priorities, interconnected goals, or phased strategies in a clean, compelling way. Fully customizable and compatible with PowerPoint, Keynote, and Google Slides for seamless presentation design.


21 diapositivas
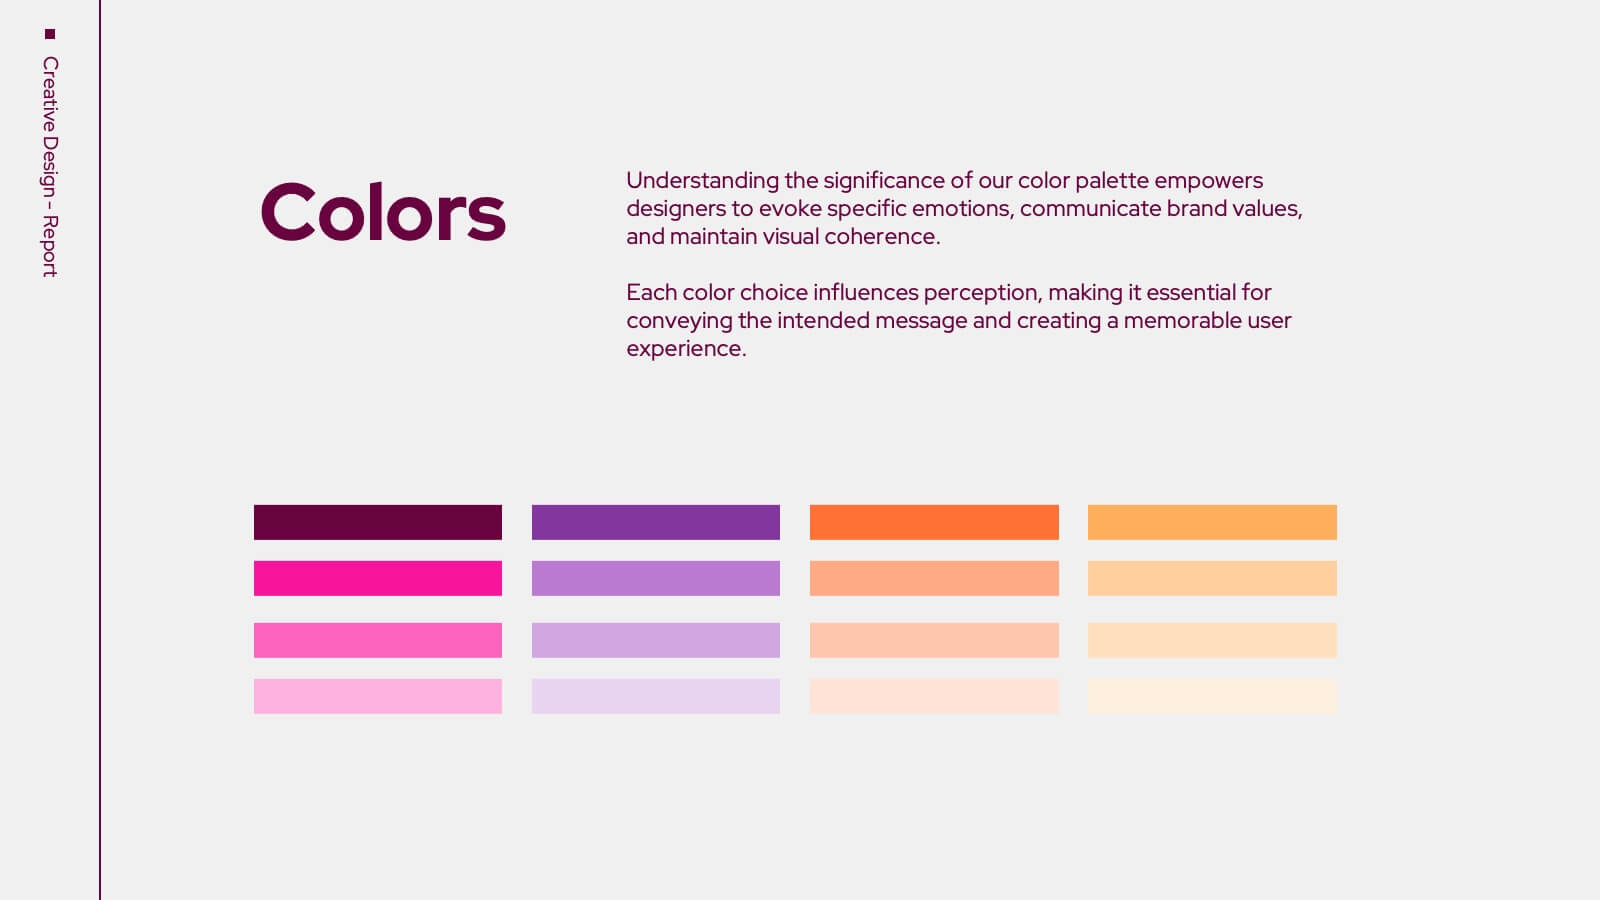
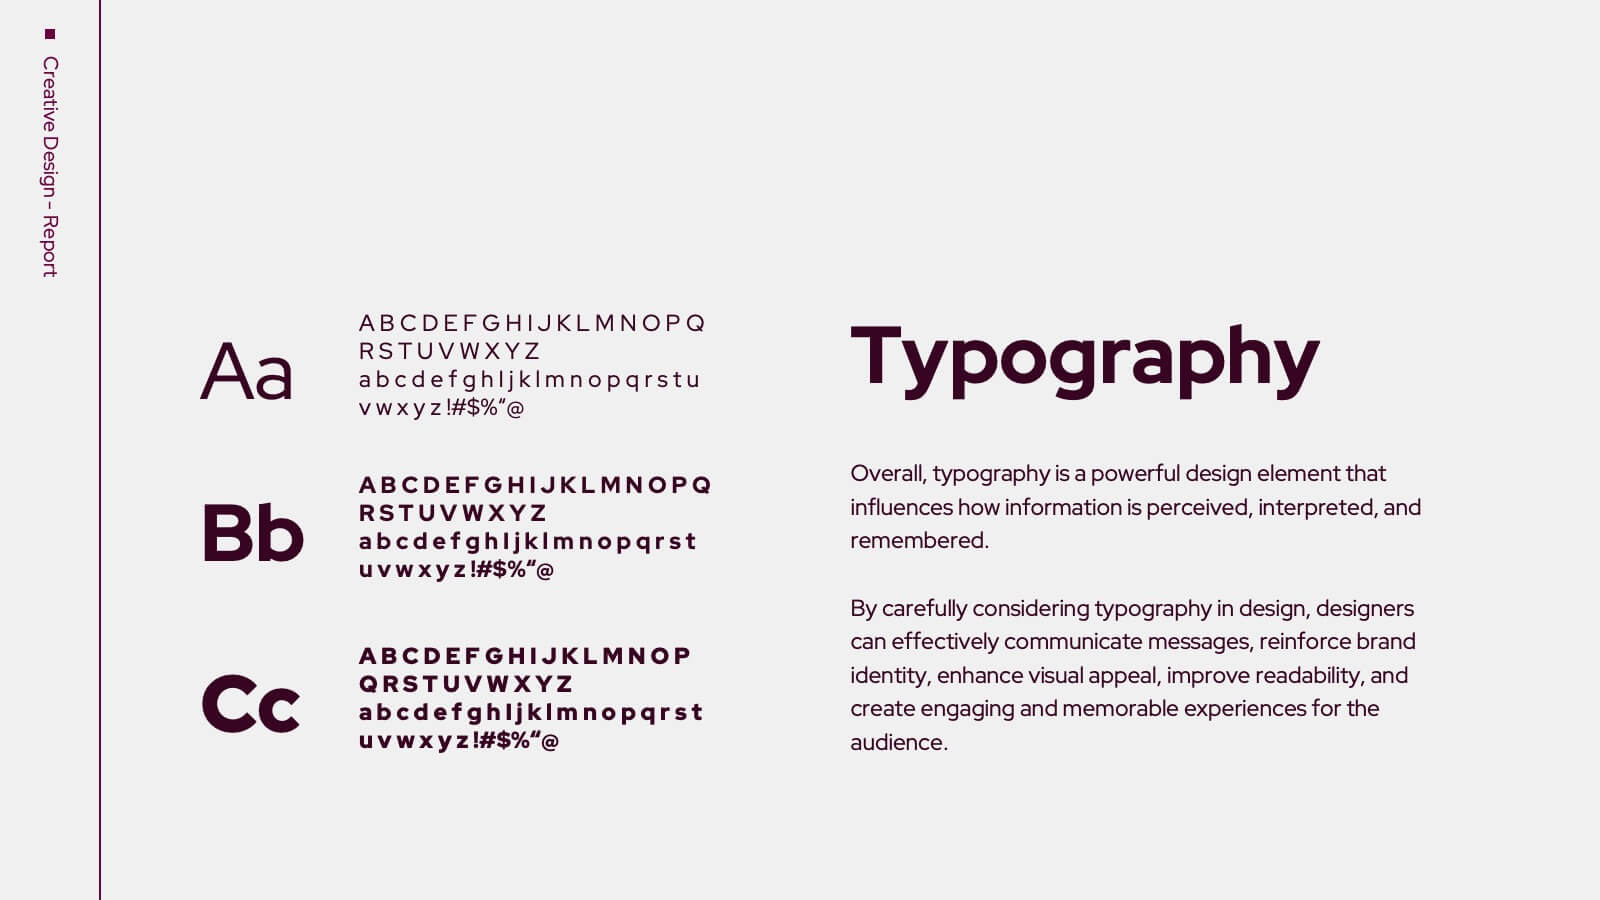
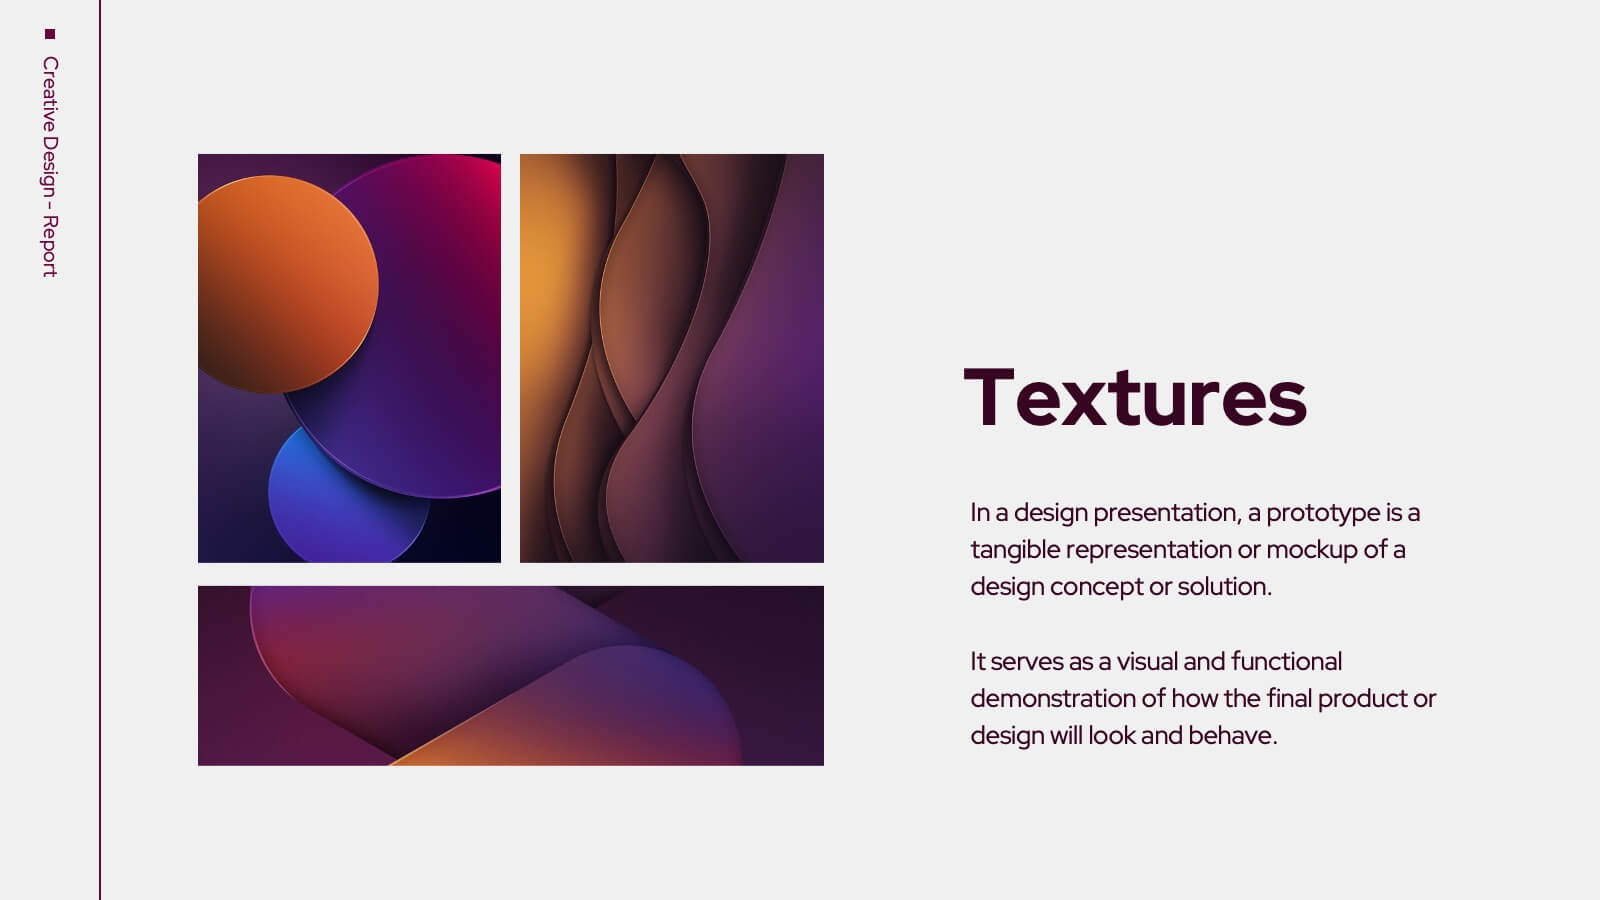
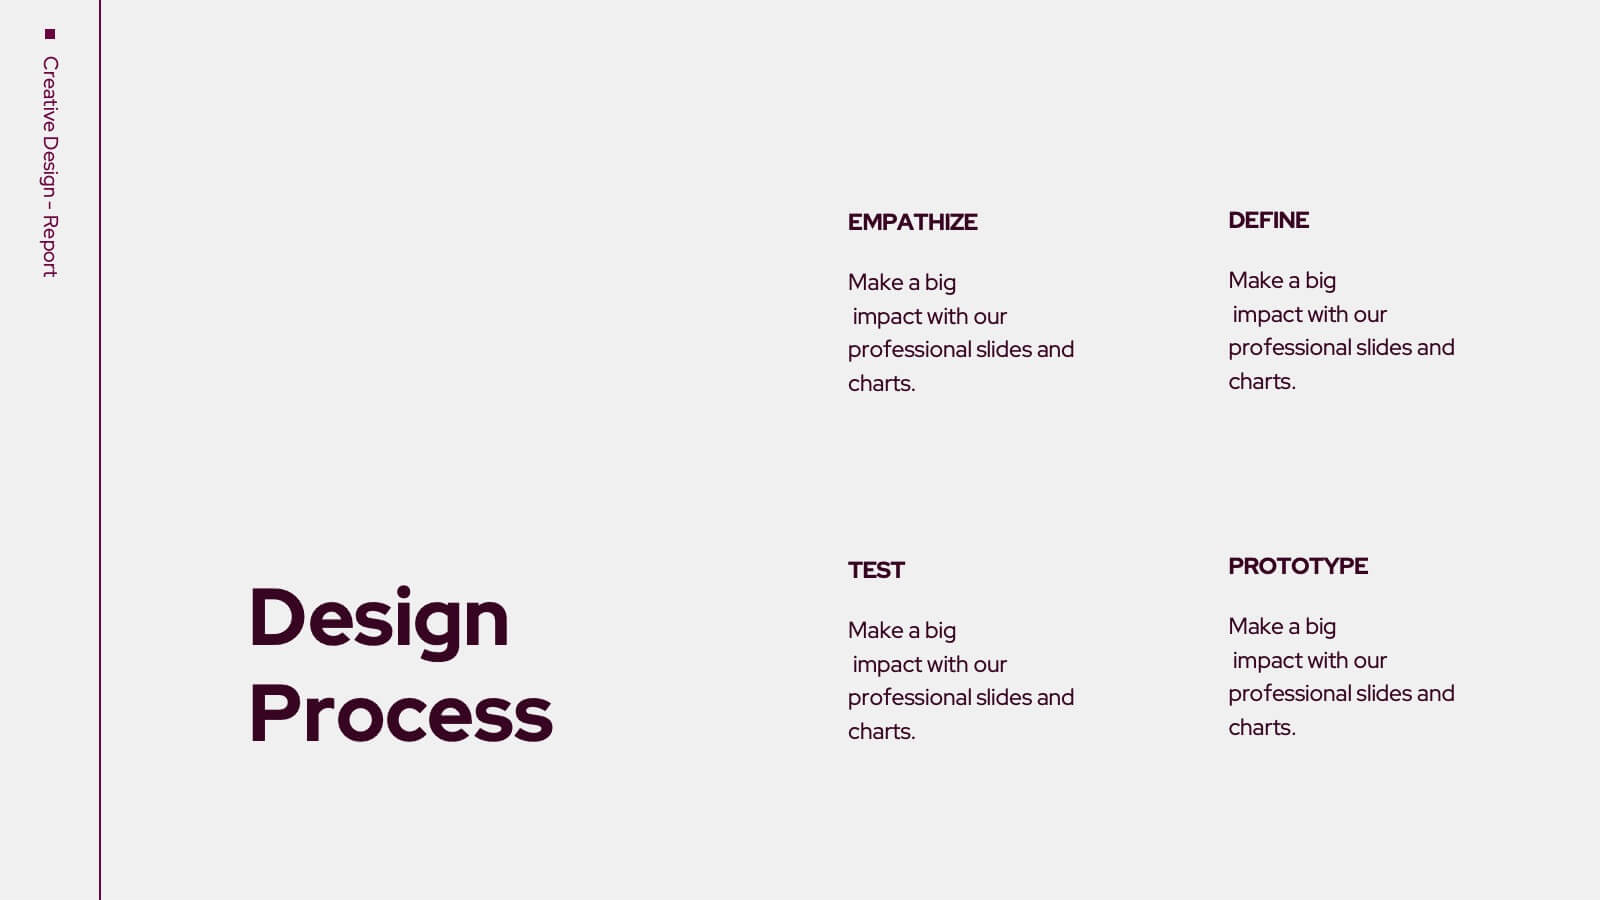
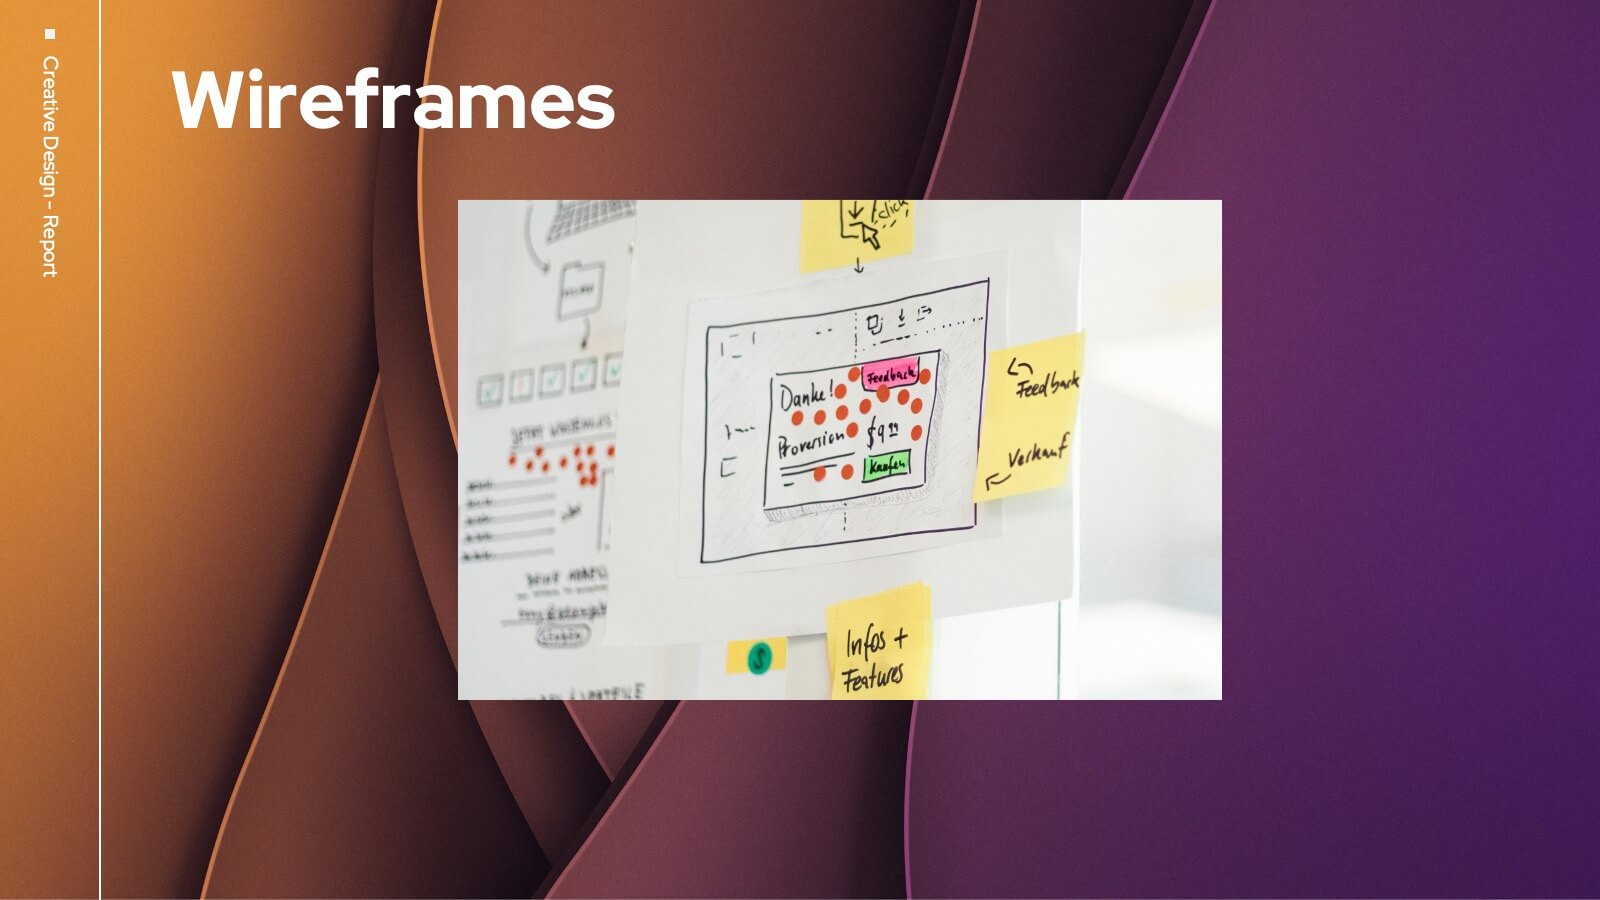
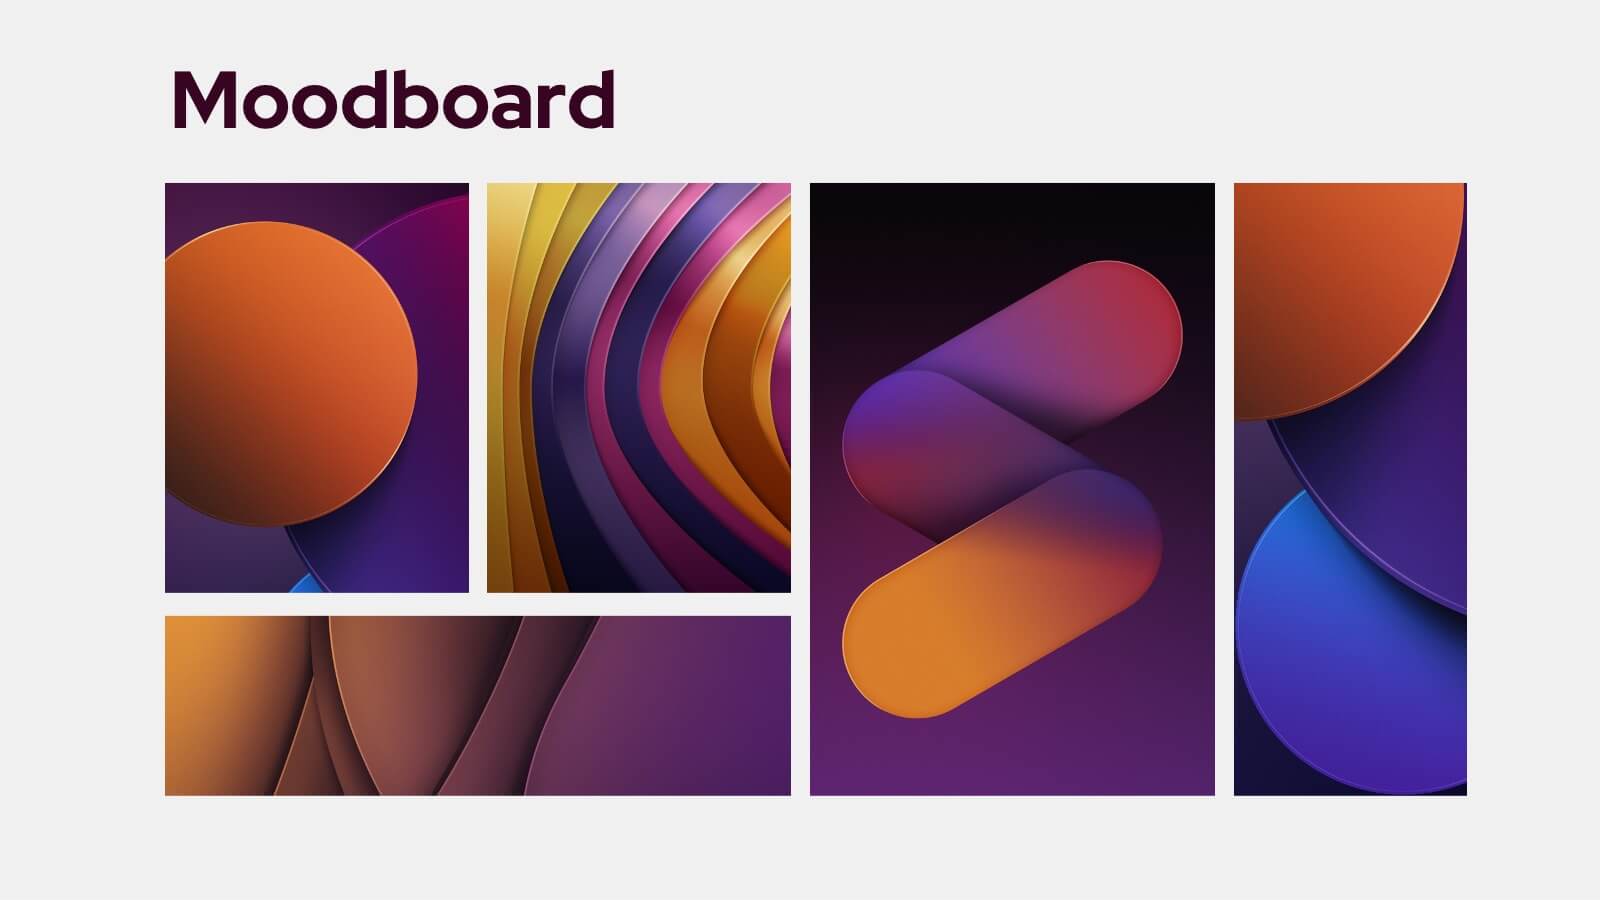
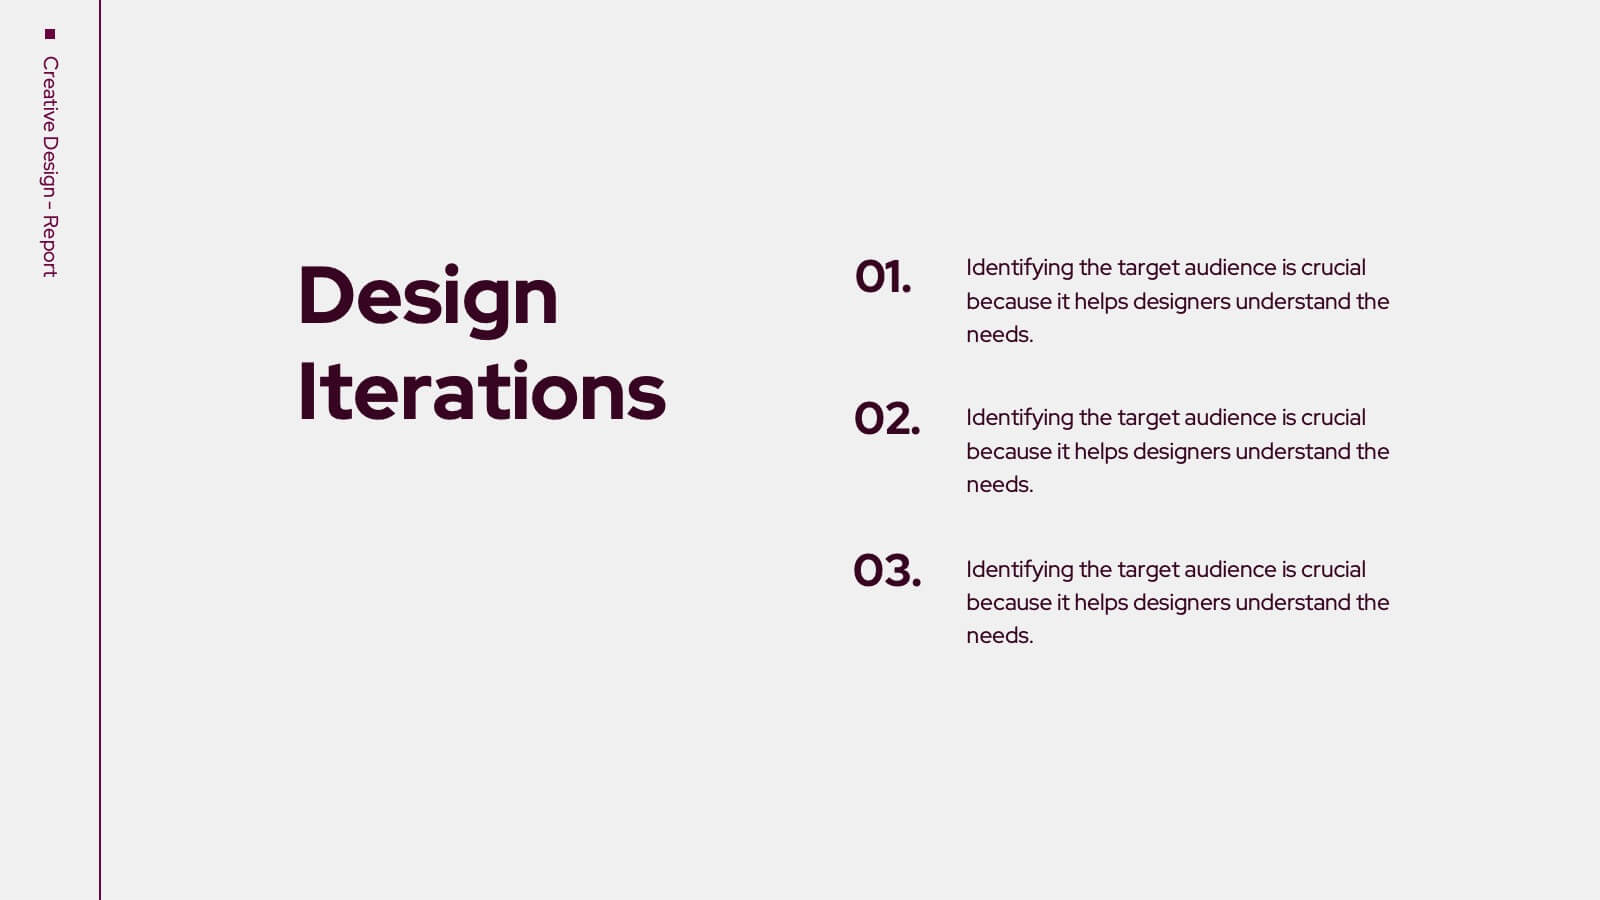
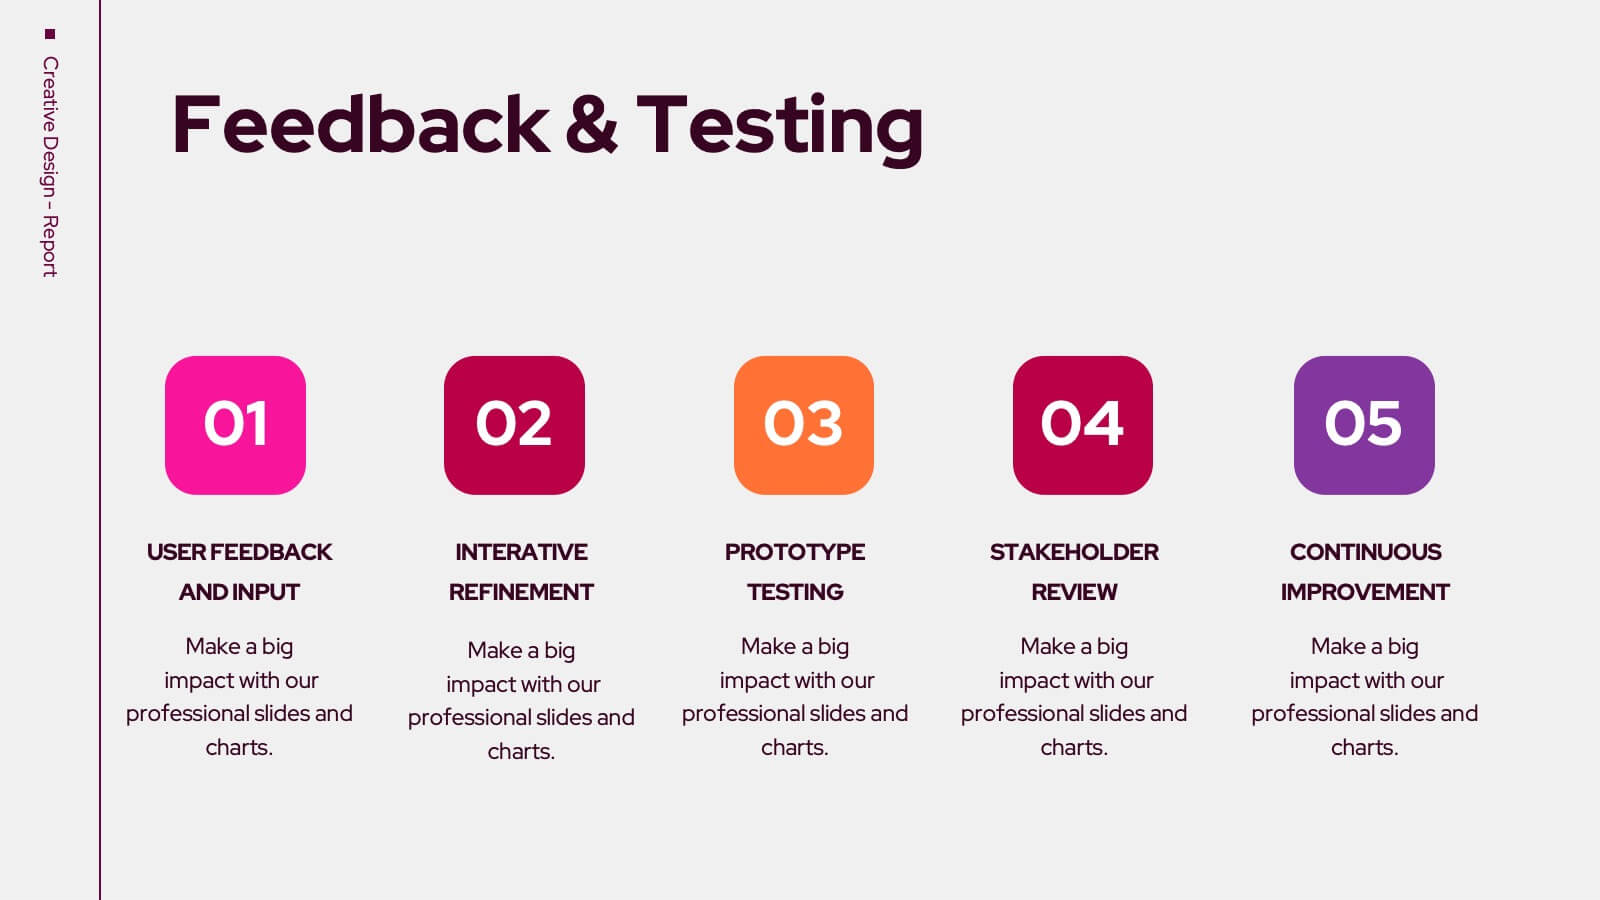
Trojan Creative Design Report Presentation
Unleash your creativity with this striking Trojan-inspired presentation template! Ideal for showcasing your design projects, this presentation enables you to highlight key concepts, inspirations, and visual elements effectively. Its engaging layout ensures your ideas shine through, captivating your audience. Compatible with PowerPoint, Keynote, and Google Slides for seamless presentations.