


Características


¿Tienes alguna pregunta?
Recomendar


4 diapositivas
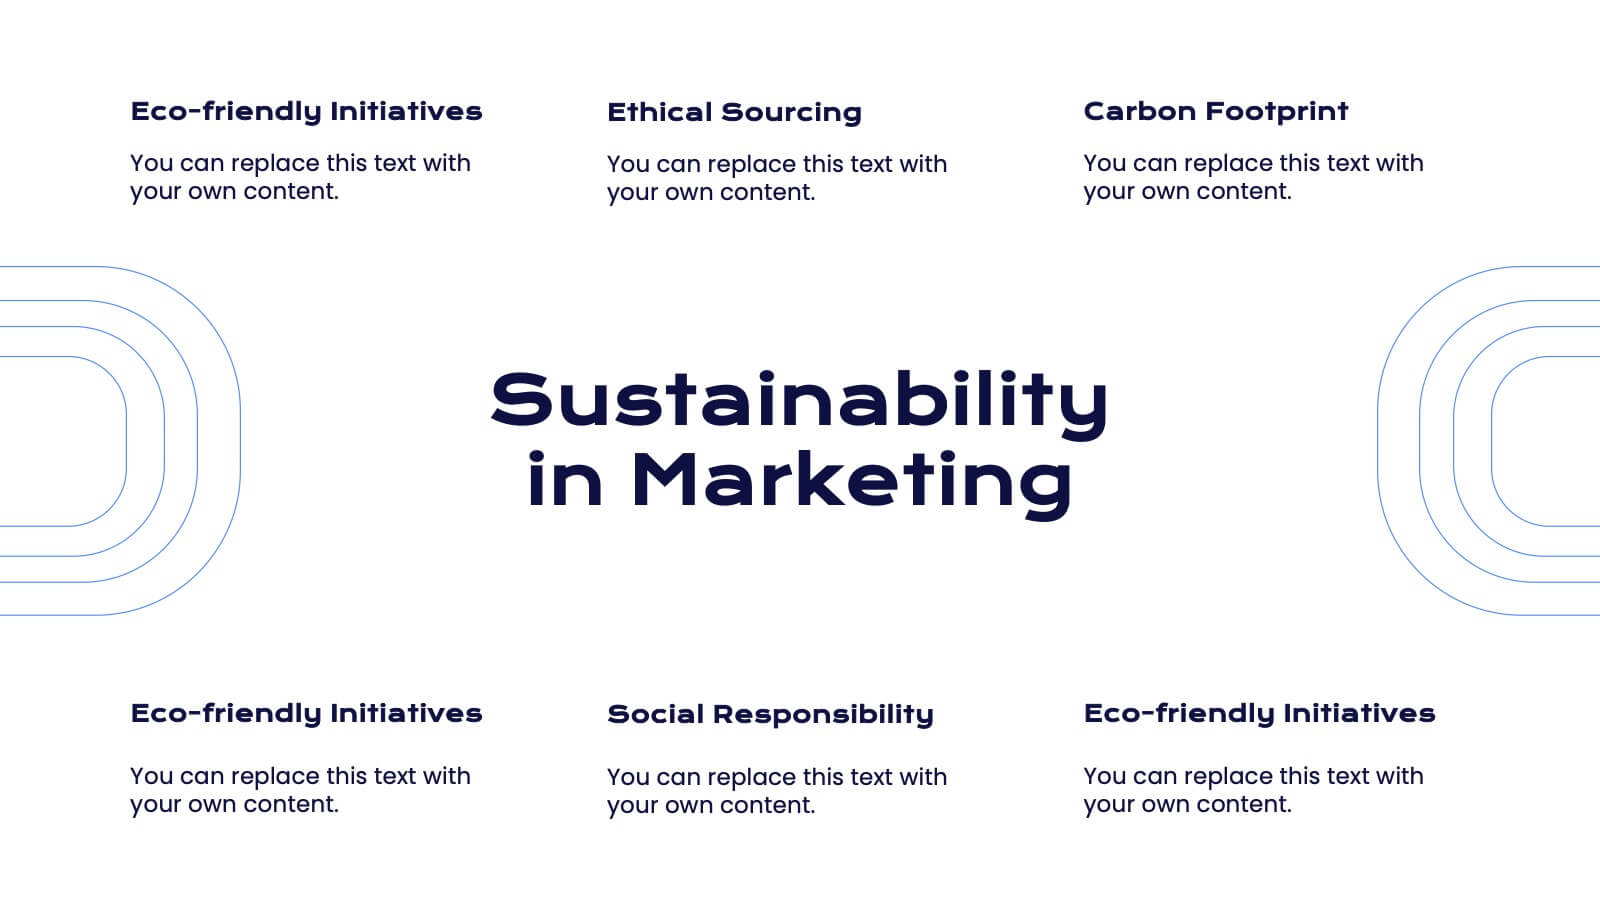
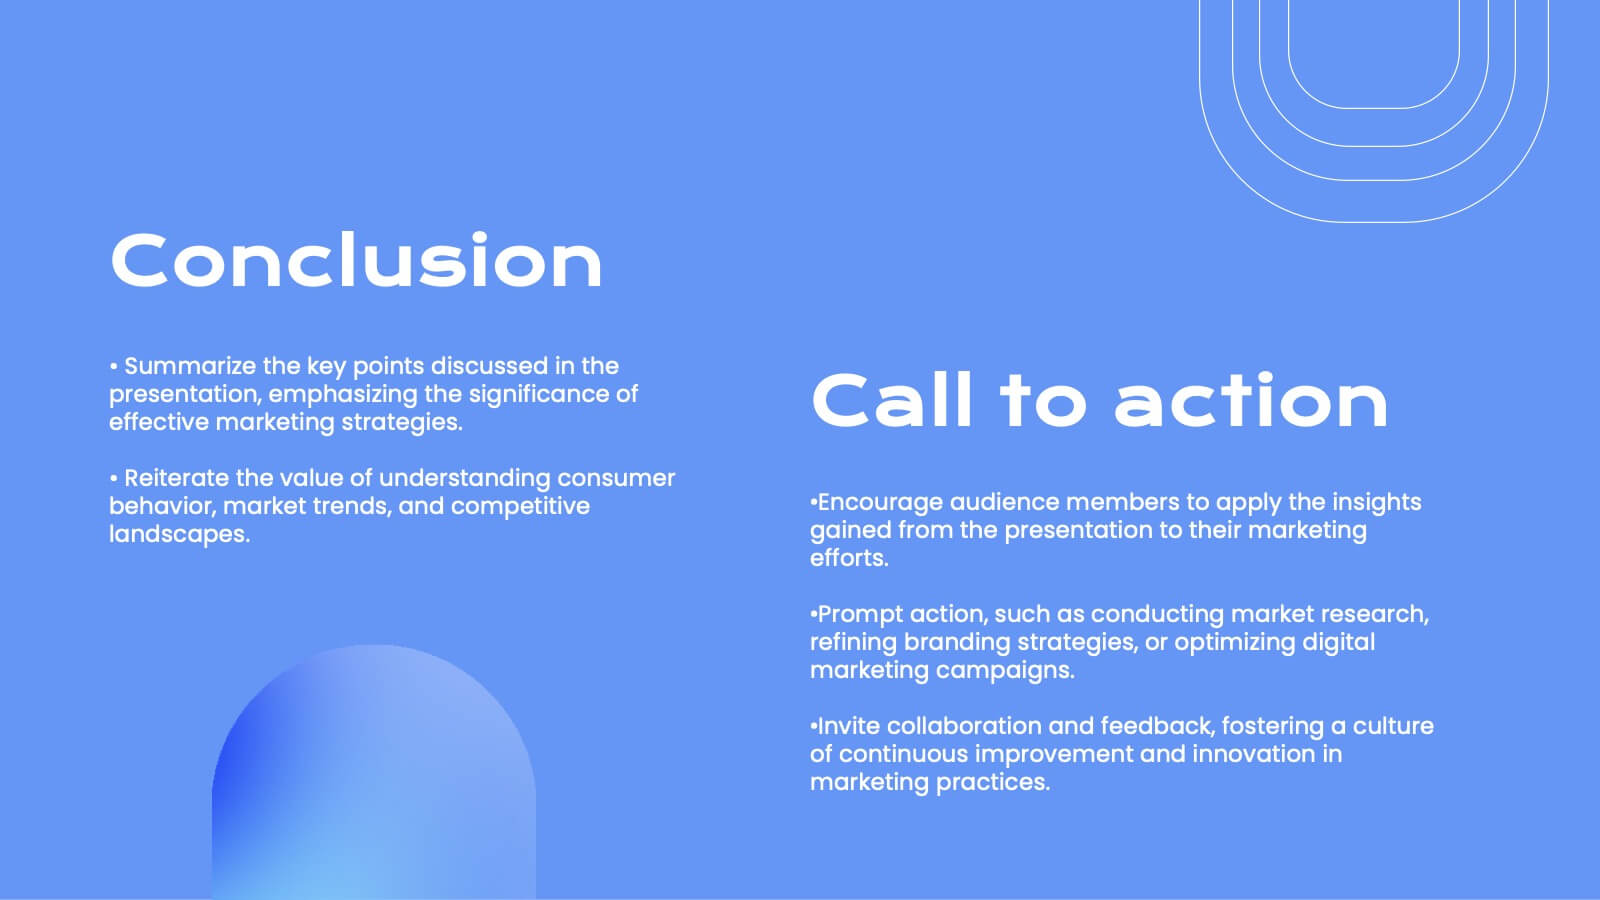
Green Initiatives & Climate Strategy Presentation
Highlight your sustainability roadmap with the Green Initiatives & Climate Strategy Presentation. Designed with a quadrant tree layout, this slide communicates four key environmental focus areas. Ideal for eco-friendly proposals, CSR updates, or climate reports. Fully customizable in PowerPoint, Keynote, and Google Slides—perfect for green strategies, goals, or impact summaries.


6 diapositivas
Root Cause Investigation Framework Presentation
Uncover the "why" behind your challenges with the Root Cause Investigation Framework Presentation. Designed around the classic fishbone (Ishikawa) diagram, this slide helps teams visually identify and organize contributing factors across multiple categories. With editable sections and bold color coding, it’s ideal for quality management, Six Sigma, and process improvement. Compatible with PowerPoint, Keynote, and Google Slides.


8 diapositivas
Australia and Pacific Map Presentation
Bring your regional data to life with a crisp, modern layout that highlights key insights across Australia and the Pacific islands. Perfect for displaying geographic trends, business reach, or market segmentation, this map design keeps your message clear and engaging. Fully compatible with PowerPoint, Keynote, and Google Slides.


4 diapositivas
Strategic Triangle Model Slide
Visualize your core pillars with this Strategic Triangle Model Slide Presentation. Featuring a clean triangular layout with three editable segments, this template is perfect for showcasing frameworks such as mission-vision-values, policy-strategy-impact, or key business objectives. Each point of the triangle is paired with an icon and customizable text, making complex concepts easy to digest. Ideal for strategy planning, leadership discussions, or consulting proposals. Fully editable in PowerPoint, Google Slides, and Keynote.


6 diapositivas
Natural Food Infographics
The "Natural Food" infographic template is a fresh and appealing visual tool, meticulously designed for PowerPoint, Keynote, and Google Slides. This template is an excellent resource for nutritionists, food bloggers, and organic food marketers looking to present the benefits, sources, and variety of natural foods in an engaging manner. This template vividly showcases the spectrum of natural foods, including fruits, vegetables, grains, and proteins, emphasizing their health benefits, nutritional values, and sustainable sourcing. Its layout is perfect for educating audiences about healthy eating habits, organic farming, and the positive environmental impact of choosing natural foods. The design is as refreshing as the topic it represents, with a color scheme that is vibrant and earthy. This not only makes the presentation visually enticing but also resonates with the themes of health, vitality, and environmental consciousness. Whether used in a workshop, a marketing campaign, or an educational seminar, this template ensures that the wholesome goodness of "Natural Food" is presented in a visually stunning, informative, and appetizing manner.


7 diapositivas
Consulting Business Strategy Infographic Presentation
A company’s business strategy is a plan that helps it achieve its goals and meet long-term objectives. A business strategy should be designed to fulfill the company’s mission, vision, and values. This template is designed to make your business or company plan, easy to understand and present in a professional way with the best design. This template can be used to present your company's strategic vision, long-term goals, and key initiatives. With its colorful and dynamic design, this can attract your audience’s attention, while also providing them with useful information about your strategy.


7 diapositivas
Human Resources Process Infographic
Dive deep into the intricate world of HR with our human resources process infographic. Designed for clarity and ease of understanding, this infographic provides a streamlined look into the diverse steps and stages involved in efficient management. With a clean white canvas complemented by various shades of blue and a spectrum of colors for differentiation, this infographic promises an insightful journey. This is a tool for professionals aiming to present complex processes in a digestible format. Given its universal design, it's perfect for integration into PowerPoint, Keynote, or Google Slides presentations, ensuring that your content not only educates but also engages.


7 diapositivas
Personal Roadmap Infographic
A personal roadmap infographic is a visual representation of an individual's goals, plans, achievements, and milestones over a specific period. Embark on a transformative journey through your life with our personal roadmap infographic template. This is a grand adventure, and this visually engaging template is your map to navigate it with purpose and direction. This template is a graphical and often chronological display that helps an individual outline and track their personal development, progress, and objectives. This infographic is fully customizable and compatible with Powerpoint, Keynote, and Google Slides.


6 diapositivas
Preventative Healthcare and Fitness Presentation
Promote wellness and proactive care with this colorful and clean slide layout. Featuring a clipboard-style design with stacked icons and aligned descriptions from A to E, it’s perfect for presenting fitness tips, health programs, or preventative strategies. The vibrant sections help guide viewers through key points at a glance. Fully editable and compatible with PowerPoint, Keynote, and Google Slides.


21 diapositivas
Sable Design Portfolio Presentation
Elevate your creative portfolio with the Sable Design Portfolio Presentation template! This stylish and professional template is perfect for showcasing your design projects, whether you’re a graphic designer, UI/UX expert, or creative professional. Start with a captivating introduction, and lead your audience through a journey of your design process, from concept development to final execution. Highlight your unique approach with dedicated slides for your color palette, typography choices, and moodboards. The template also includes sections for prototyping, feedback, and iterations, ensuring your design evolution is clearly communicated. The clean and modern layout not only keeps your presentation visually appealing but also makes your work the star of the show. Customizable and easy to use, this template is compatible with PowerPoint, Keynote, and Google Slides, allowing you to impress your clients, employers, or peers with a polished and cohesive presentation of your best work.


8 diapositivas
Geographic Data for Europe Slide Presentation
Visualize key regional data clearly with the Geographic Data for Europe Slide Presentation. This editable map layout highlights specific European countries alongside icon-based text boxes, perfect for presenting statistics, demographics, or business metrics. Use color-coded markers to tell a geographic story with visual clarity. Compatible with PowerPoint, Keynote, Google Slides, and Canva.

20 diapositivas
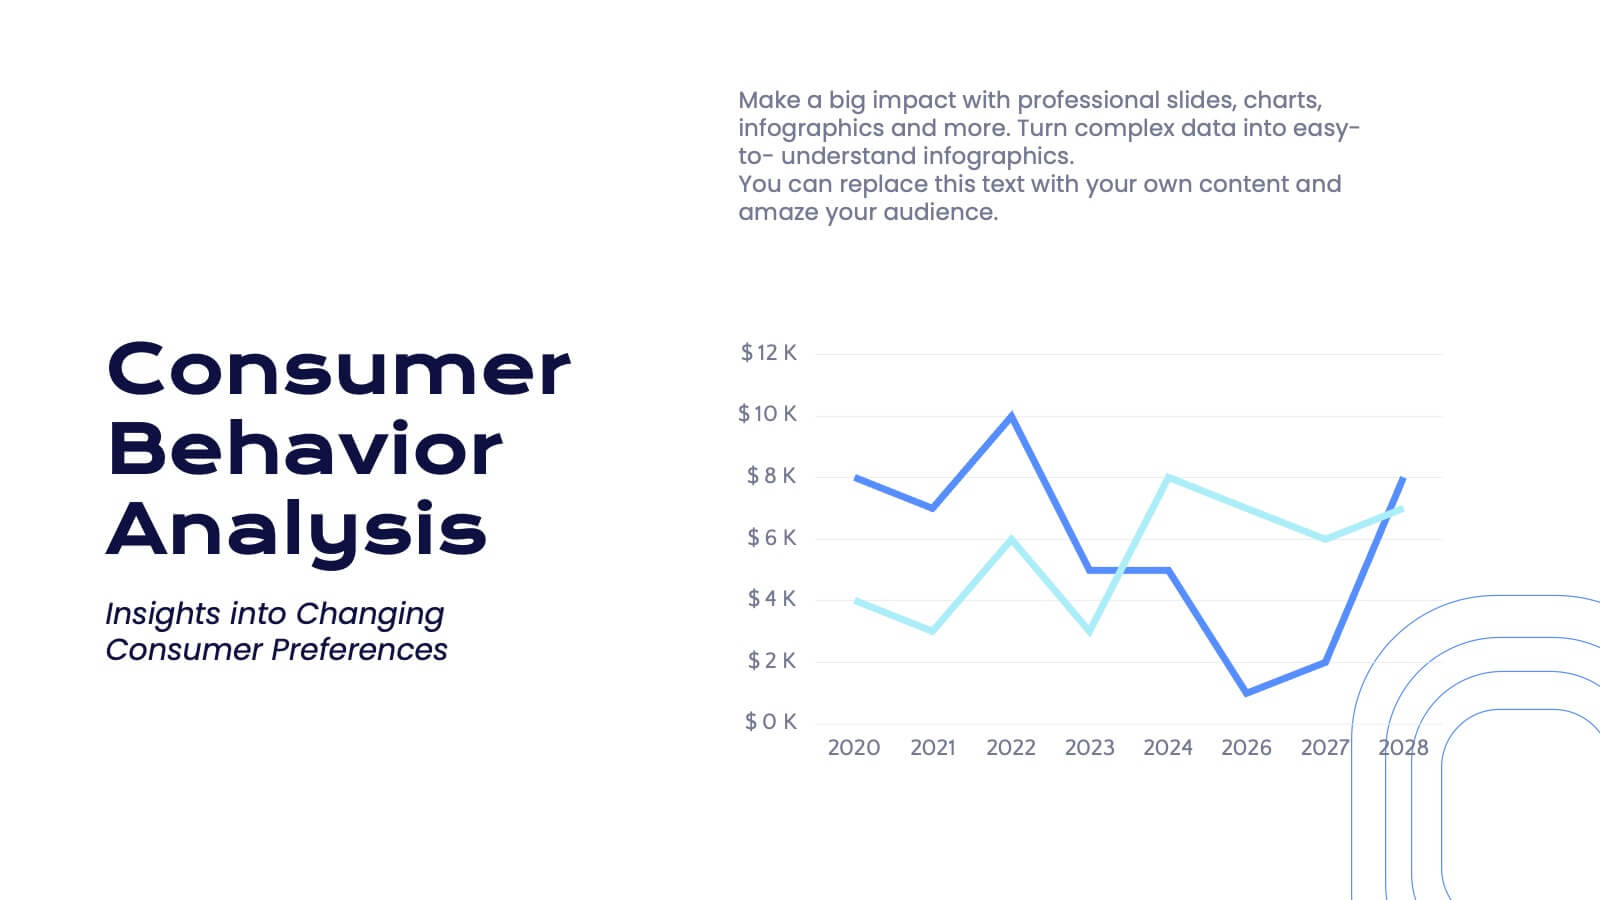
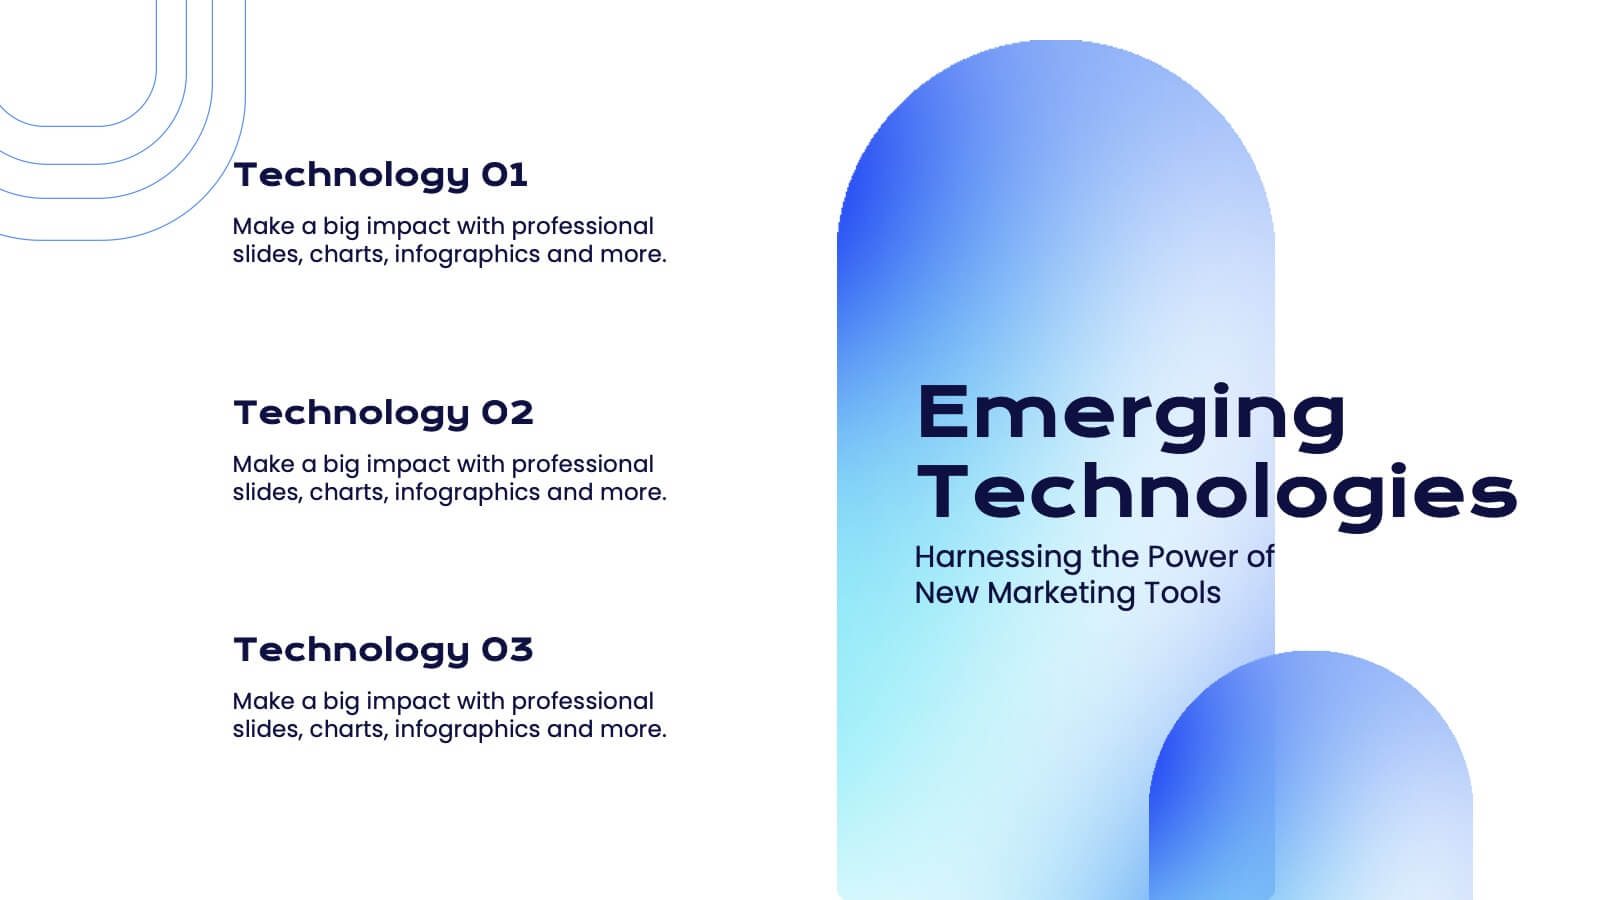
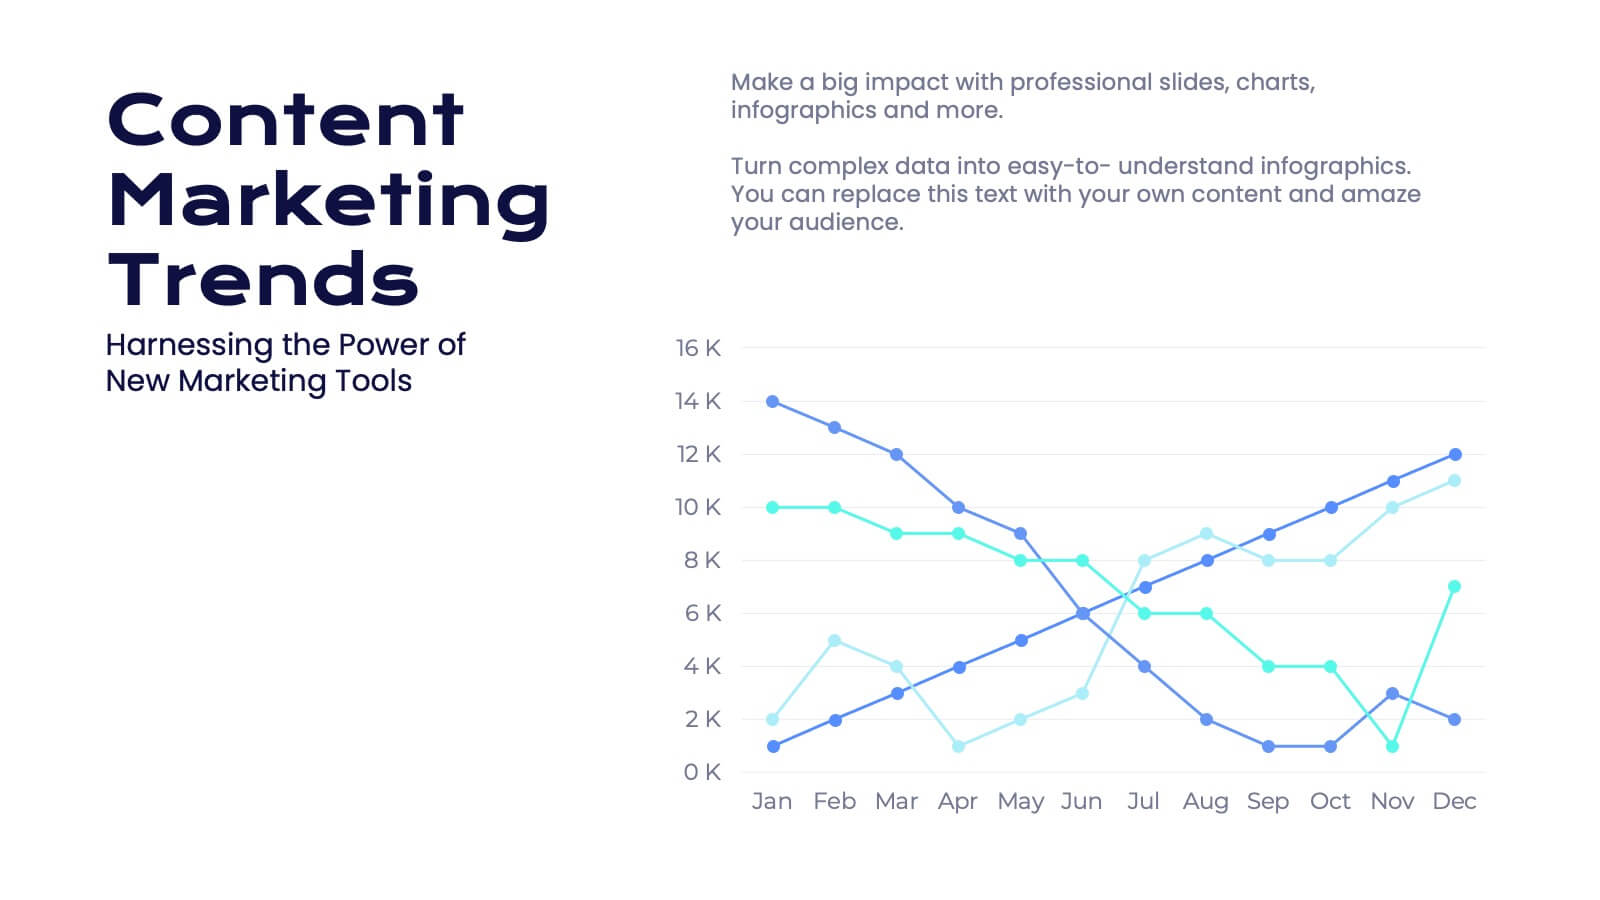
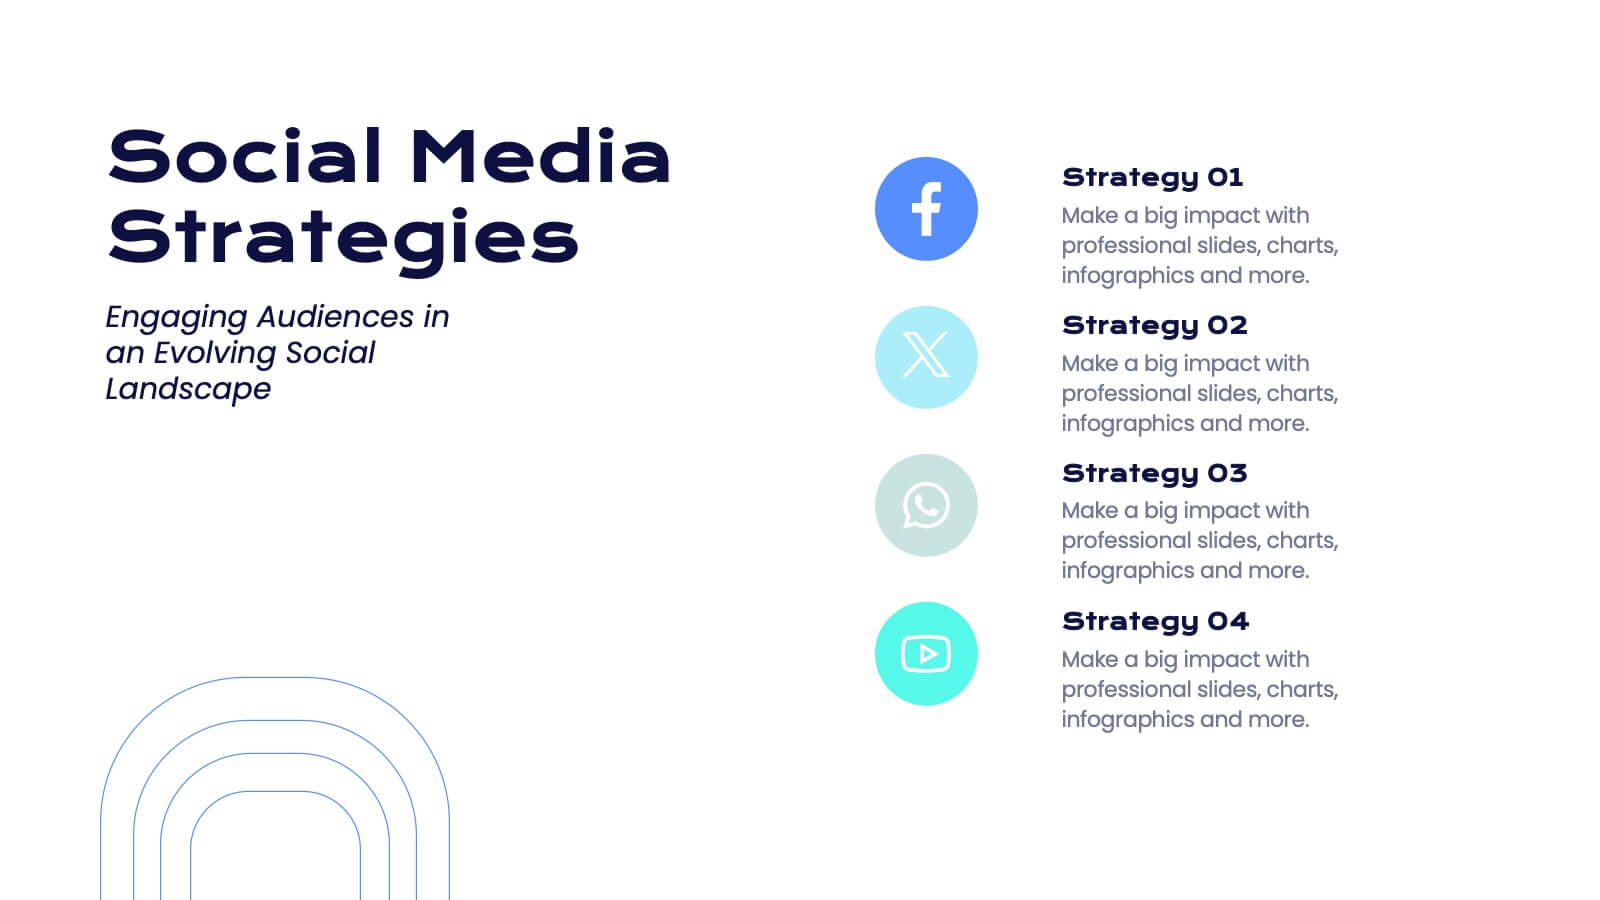
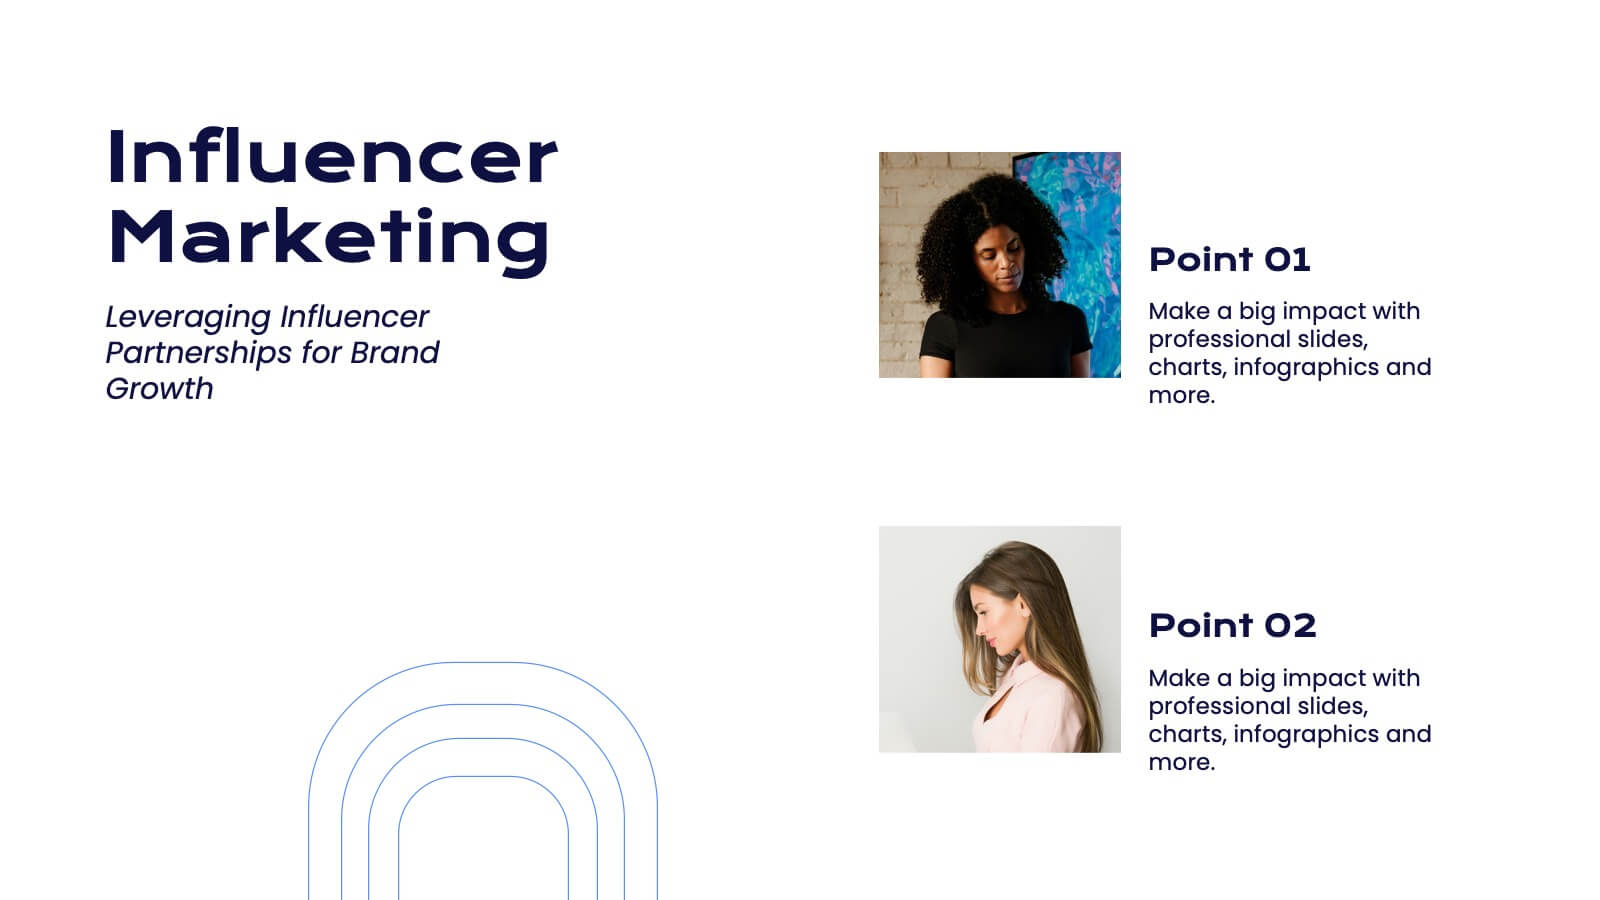
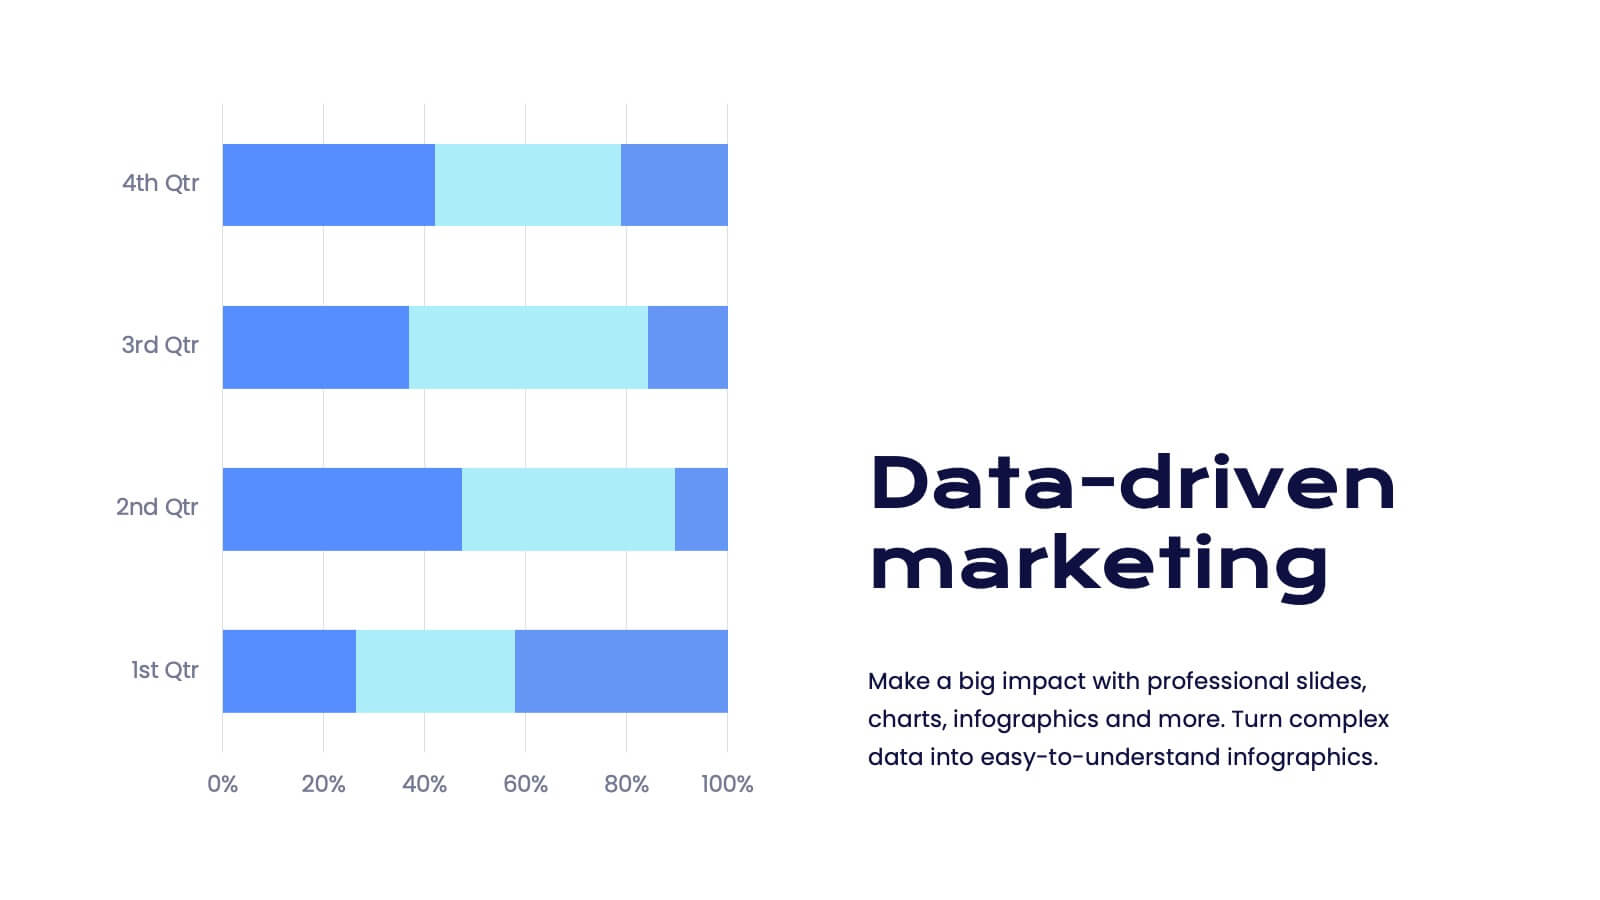
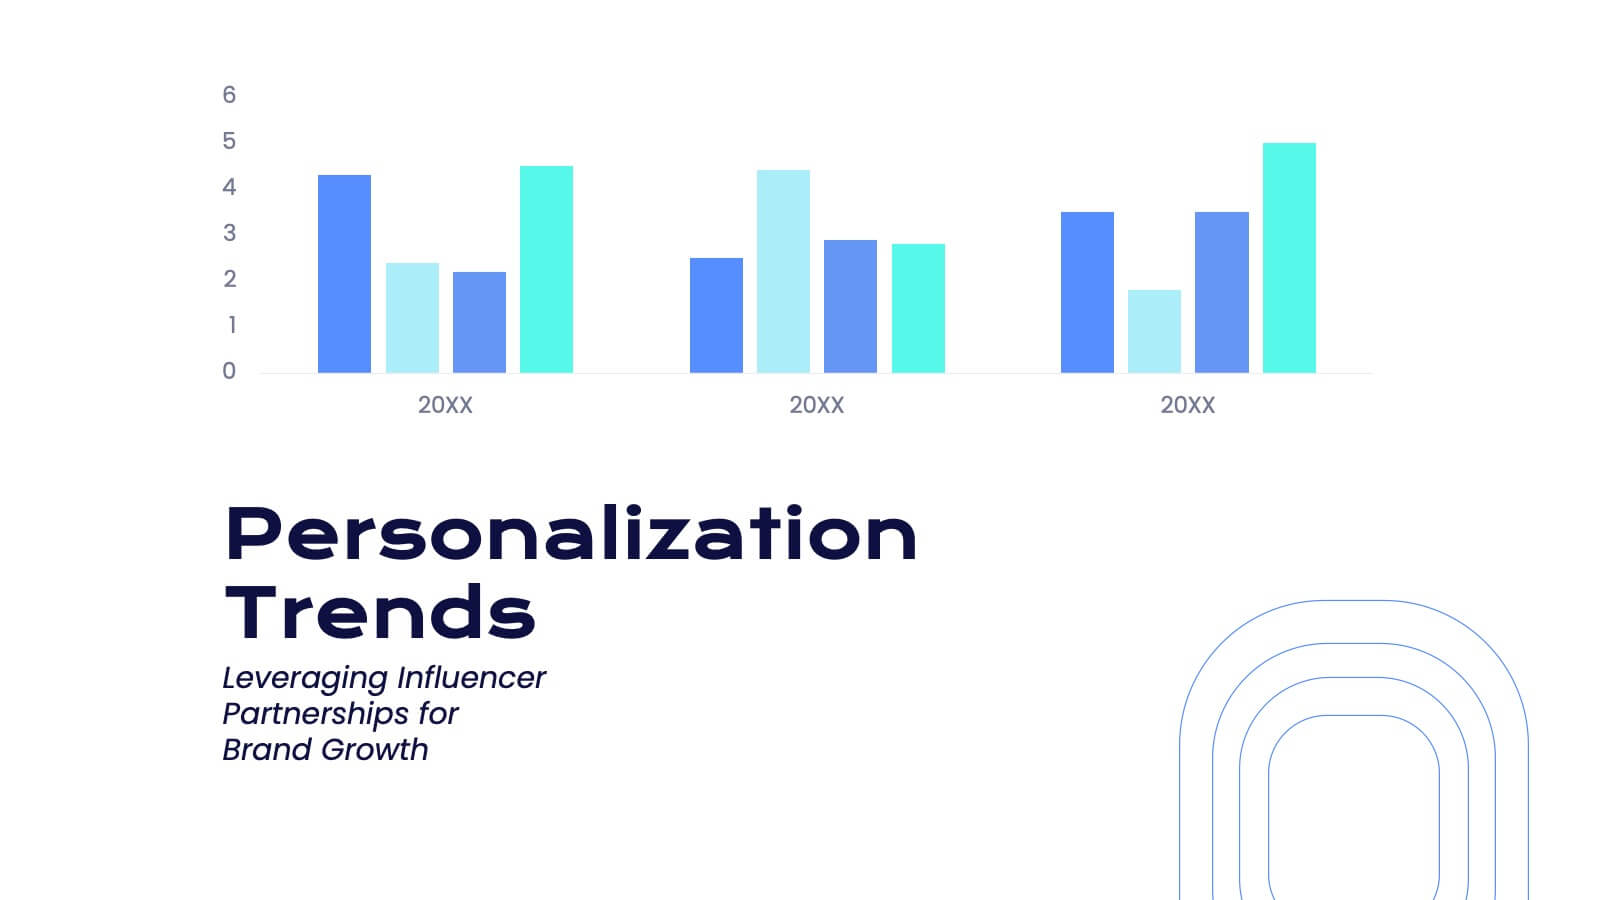
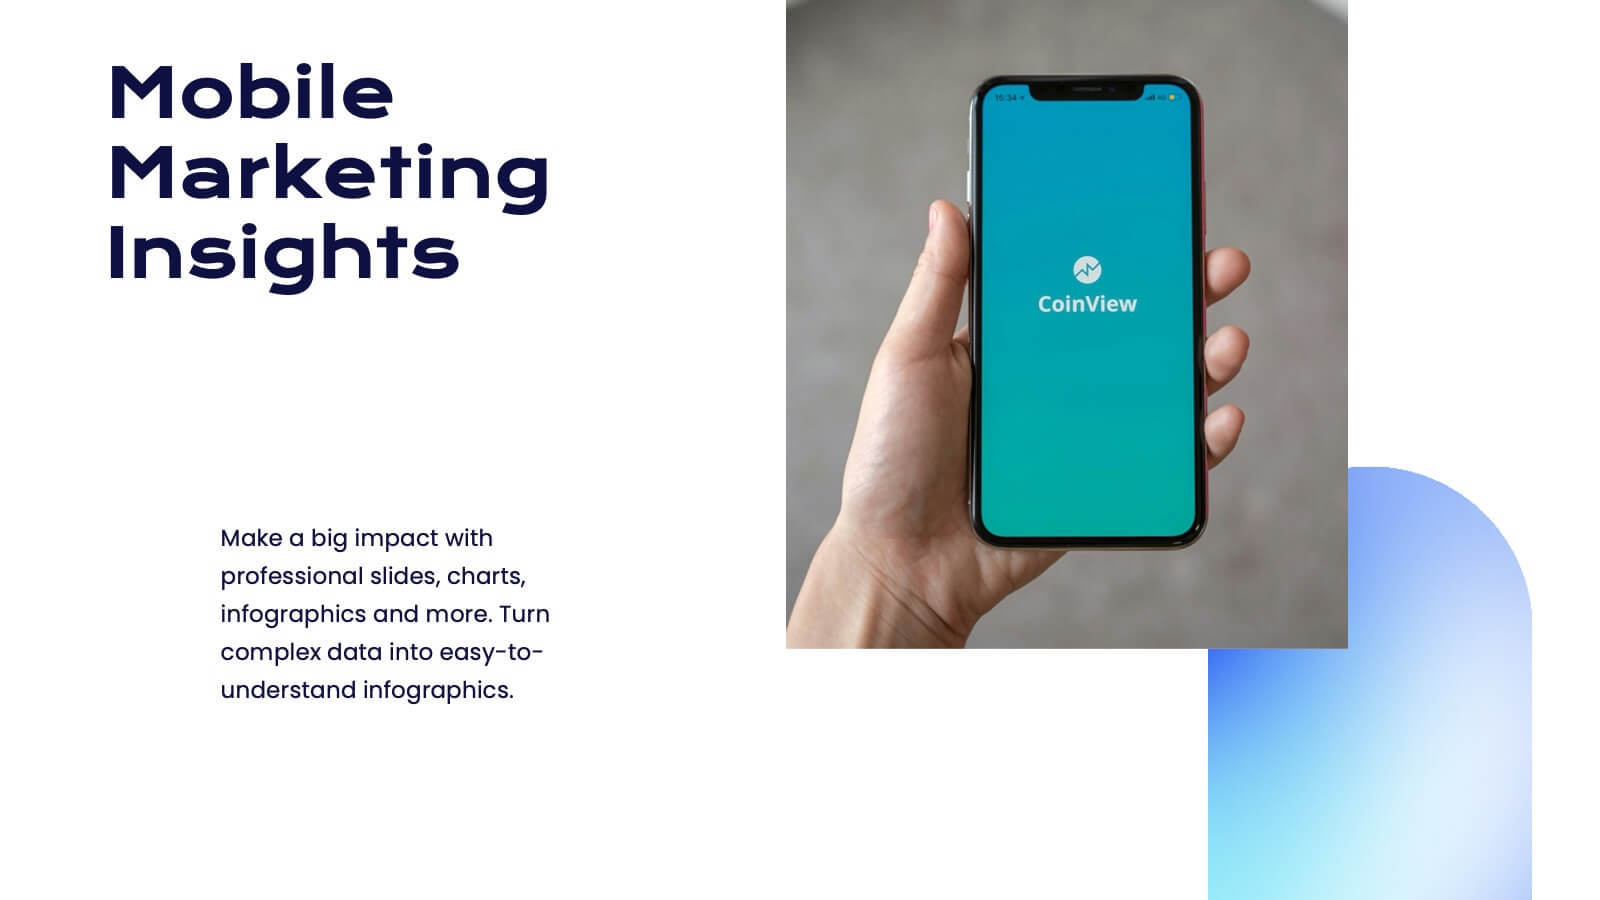
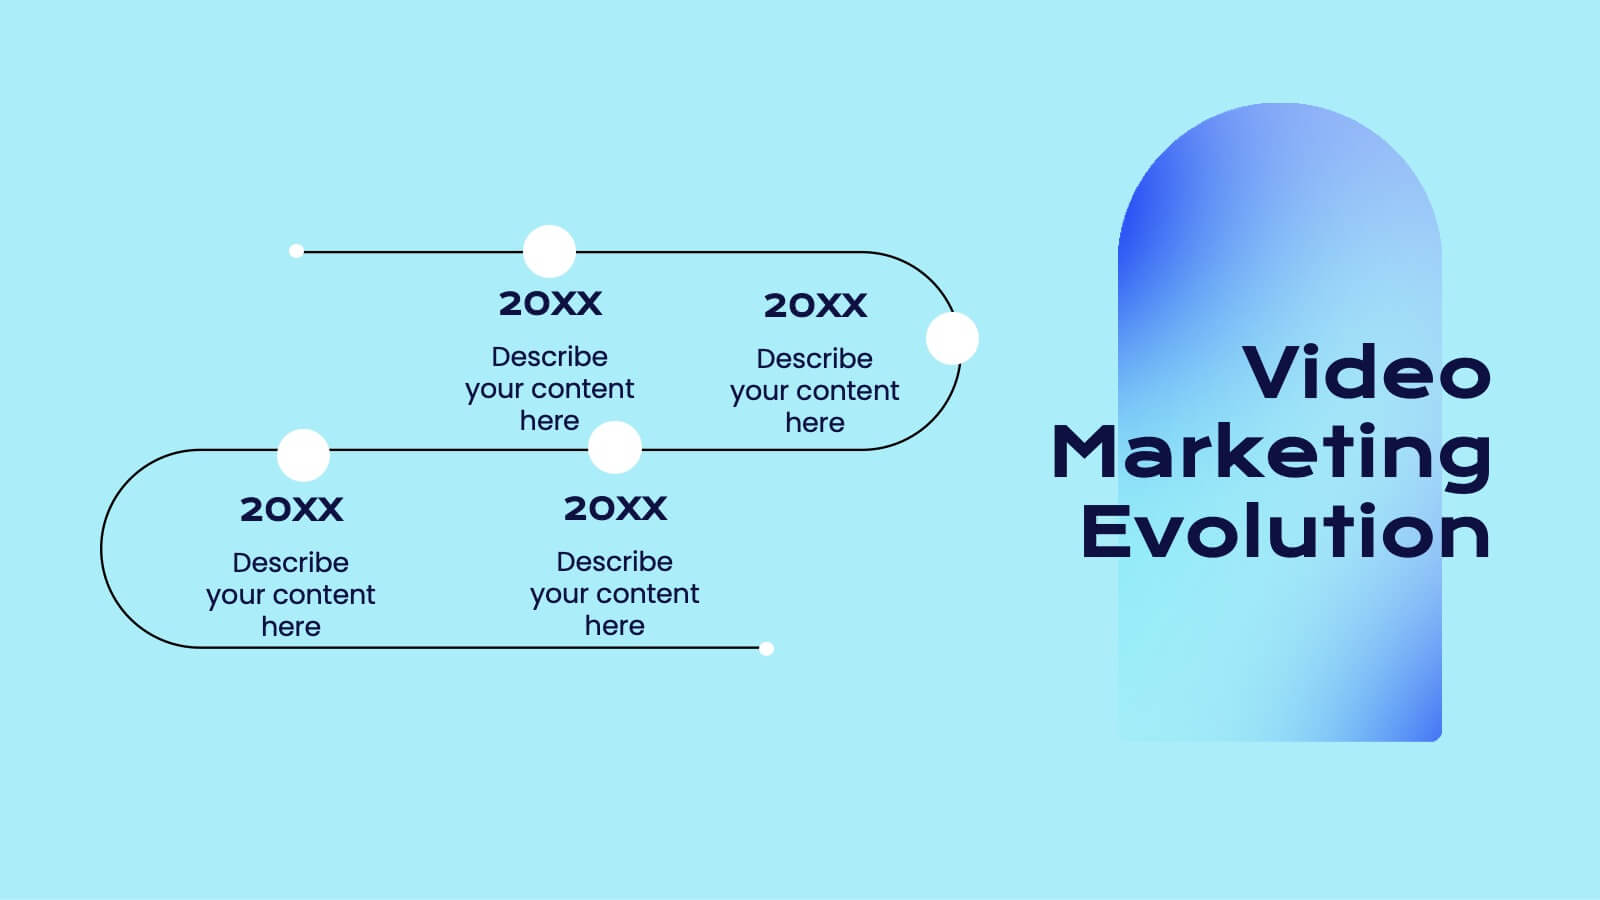
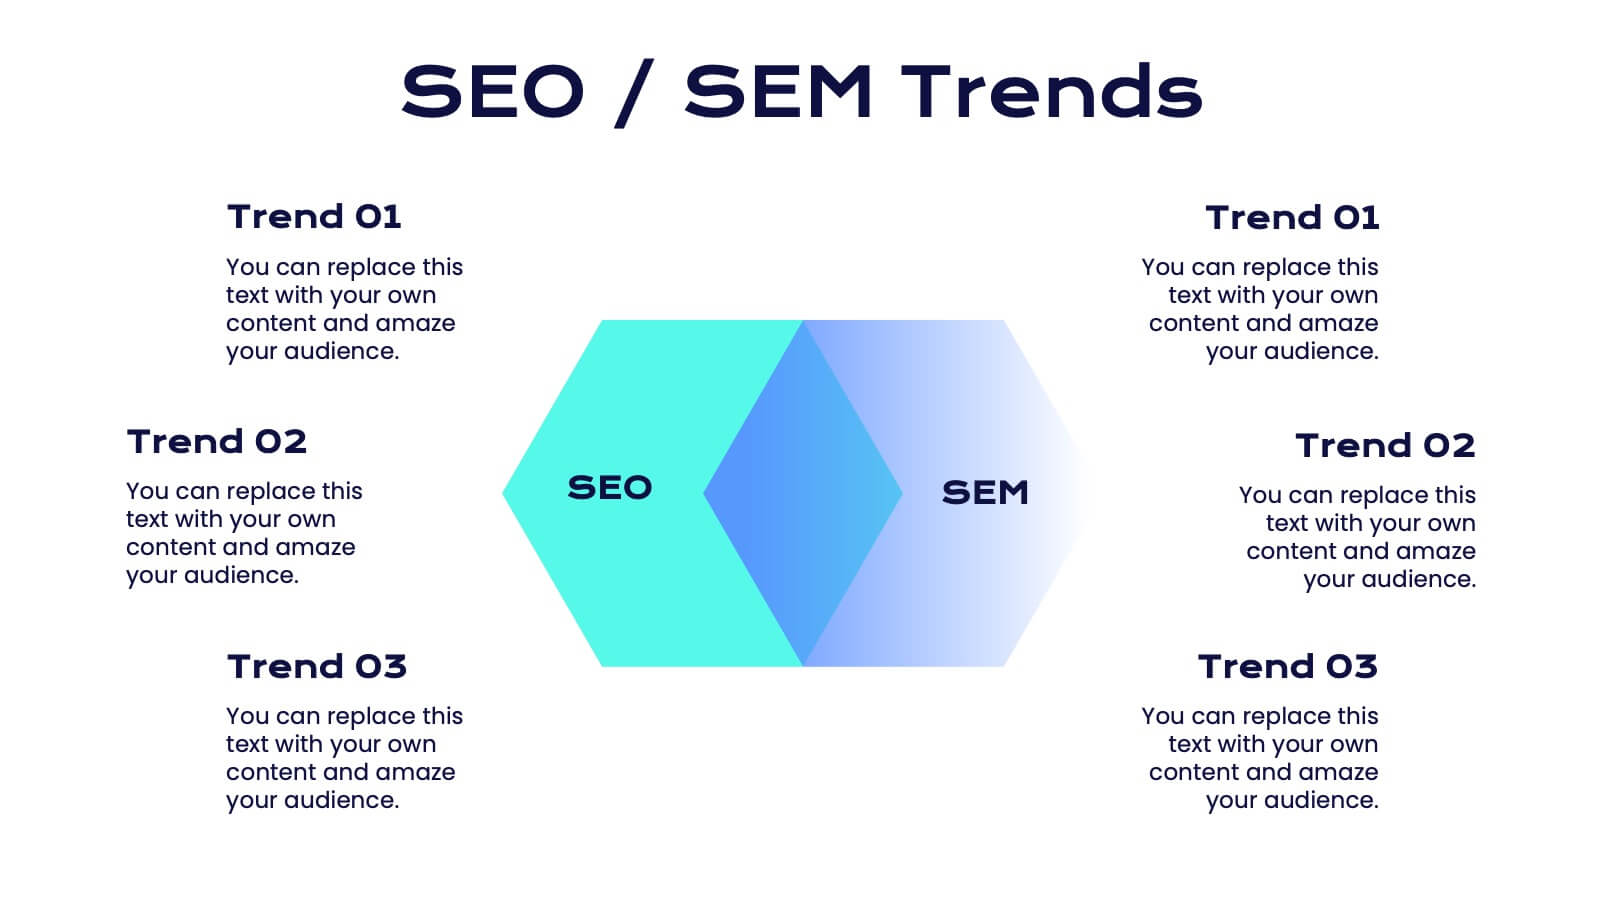
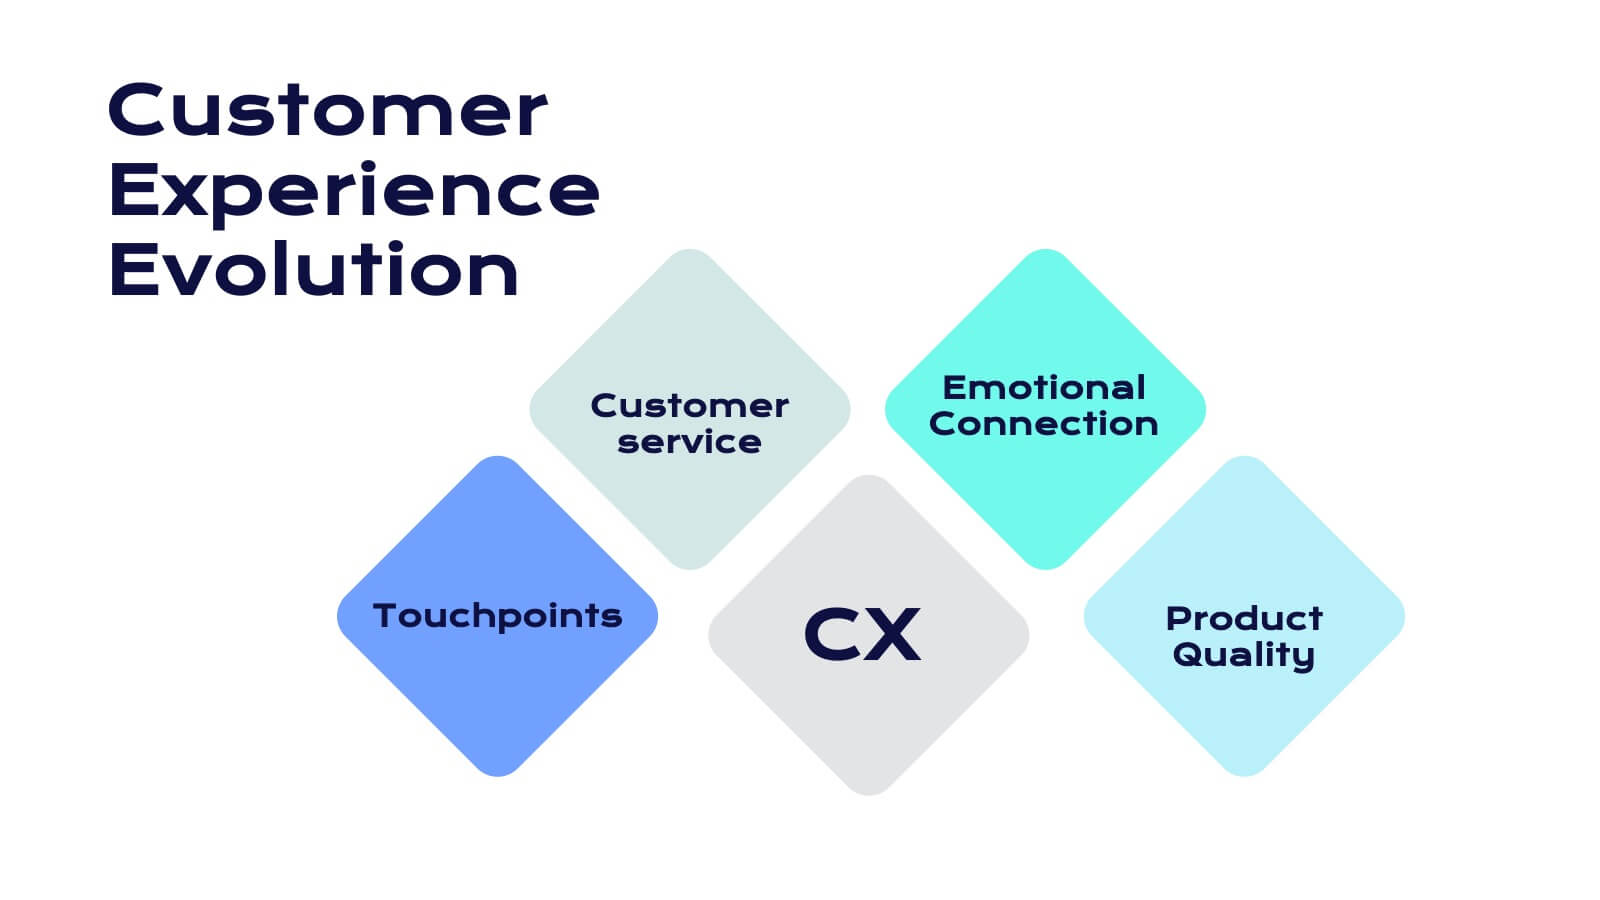
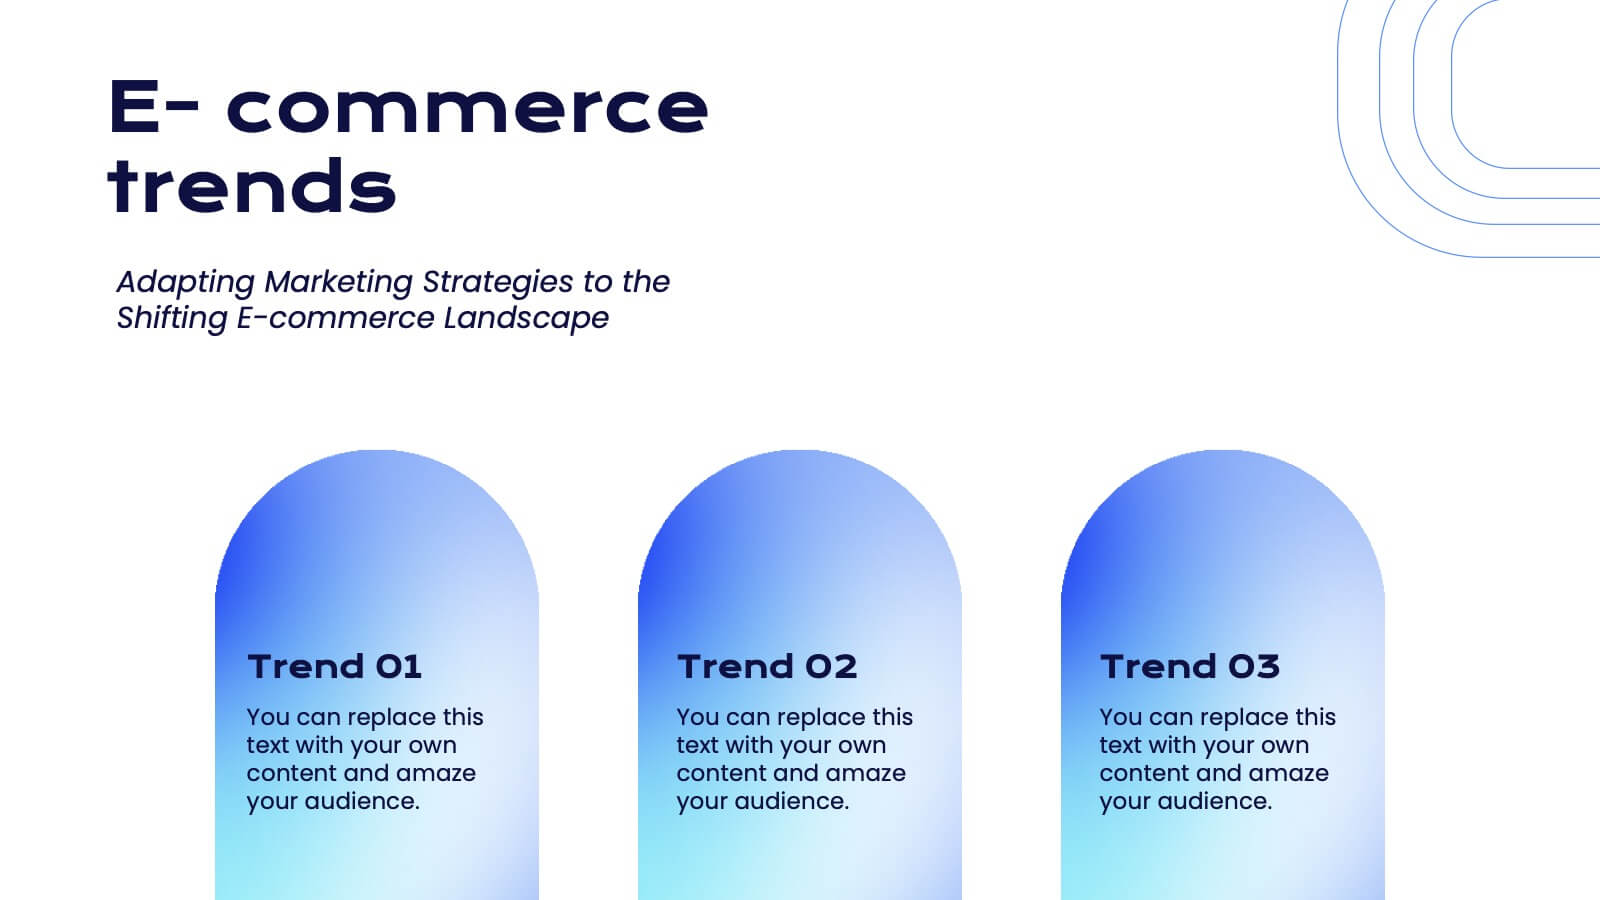
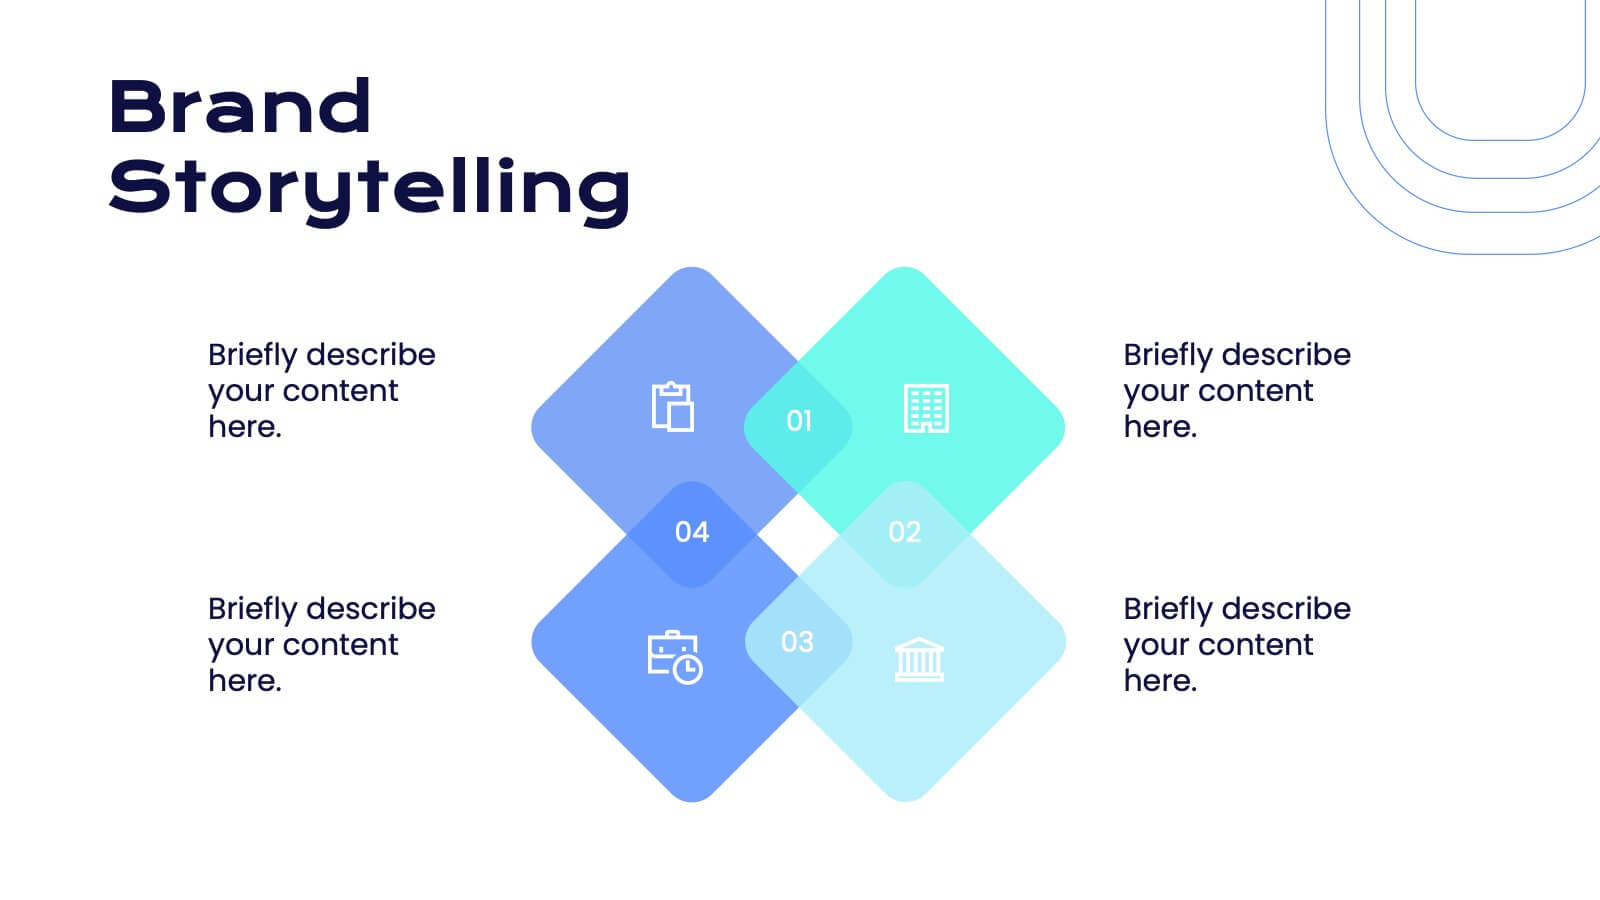
Faerie Digital Marketing Strategy Plan Presentation
Create a compelling marketing strategy with this sleek, modern template! It covers key topics like consumer behavior, social media strategies, and emerging trends. Perfect for showcasing insights in a clear, data-driven format. Fully customizable, it works seamlessly with PowerPoint, Keynote, and Google Slides for effective presentations.


4 diapositivas
Project Responsibility Assignment Matrix Presentation
Visualize team roles and task accountability at a glance with this Project Responsibility Assignment Matrix. This structured layout categorizes assignments using the RACI model—Responsible, Accountable, Consulted, and Informed—organized by team and position. Ideal for project managers, team leads, and operations planners, it helps ensure clarity, reduce overlap, and promote accountability across departments. Easily editable in PowerPoint, Keynote, and Google Slides for seamless customization and cross-platform use.


4 diapositivas
Corporate Company Profile Overview Presentation
Present your business story with clarity and impact using this sleek company profile layout. Designed for corporate overviews, it highlights key points alongside a modern visual backdrop. Ideal for executive summaries, strategy decks, or investor briefings—fully editable in PowerPoint, Keynote, and Google Slides for effortless customization and professional results.


4 diapositivas
Current vs Future State Gap Presentation
Take your audience on a journey of progress with this dynamic slide, designed to clearly compare where things stand today and where they’re headed next. It helps highlight key gaps, improvement areas, and strategic opportunities with a simple, visual flow. Fully compatible with PowerPoint, Keynote, and Google Slides.


21 diapositivas
Aetherial UX Research Report Presentation
A professional and modern template for UX research presentations. Highlight key elements such as user personas, journey mapping, wireframes, and testing processes. Includes slides for accessibility considerations, design systems, and feedback iteration. Fully customizable and compatible with PowerPoint, Keynote, and Google Slides to deliver impactful insights and research findings.


7 diapositivas
Asia Countries Map Infographic
This Asia Countries Map infographic template is ideal for presentations requiring a detailed breakdown of geographic and statistical data across Asia. Compatible with PowerPoint, Google Slides, and Keynote, it features a collection of map styles and data visualization tools including icons, bar charts, and color-coded points for easy data comparison and interpretation. The template is perfect for visualizing diverse metrics such as demographic details or social statistics, with each slide tailored to display information in a clear, engaging manner. This tool is exceptionally suited for educators, and business professionals who need to convey complex data about Asian countries.